measuring india’s gdp - ncaer r-nagarajandt-srinivasan...measuring india’s gdp unpacking the...
TRANSCRIPT

Measuring India’s GDP Unpacking the Analytics and Data Issues behind a
Controversy that refuses to go away
R Nagaraj IGIDR, Mumbai
T N Srinivasan Yale University, USA

Introduction
• In January 2015, CSO introduced a new series of NAS with 2011-12 as the base year, replacing the old series with 2004-05 as the base year.
• Base change is routine matter, to account for changing economic structure; to bring in improved databases and methodologies.
• Usually, the base change leads to marginal changes in absolute sizes of estimates of NAS aggregates, but their growth rates mostly remain the same. However, there is no analytical reason why they should.
• This time was different, however.
IPF - R Nagaraj and T N Srinivasan July 12, 2016 2

Main Differences
• Base year GVA at basic prices in the new series size contracted by 3.4%, compared to GDP at factor cost in the old series.
• Growth rates of GDP and its 9-fold industrial distribution are different significantly – except for agriculture.
• Saving and capital formation (investment) estimates are distinctly higher.
• GDP’s institutional composition is also distinctly different – except for public sector.
IPF - R Nagaraj and T N Srinivasan July 12, 2016 3

-4 -2 0 2 4 6 8 10 12 14 16
Total GVA
Community, social and personal services
Financial services
Transport and communication
Trade, hote and restaurents
Construction
Elec gas and water
Manufacturing
Mining
Agriculture
Per cent
Industr
y
Figure 1b: Disaggregated GDP growth rates for 2013-14
NAS 20011-12 base year series NAS 2004-05 base year series
IPF - R Nagaraj and T N Srinivasan July 12, 2016 4
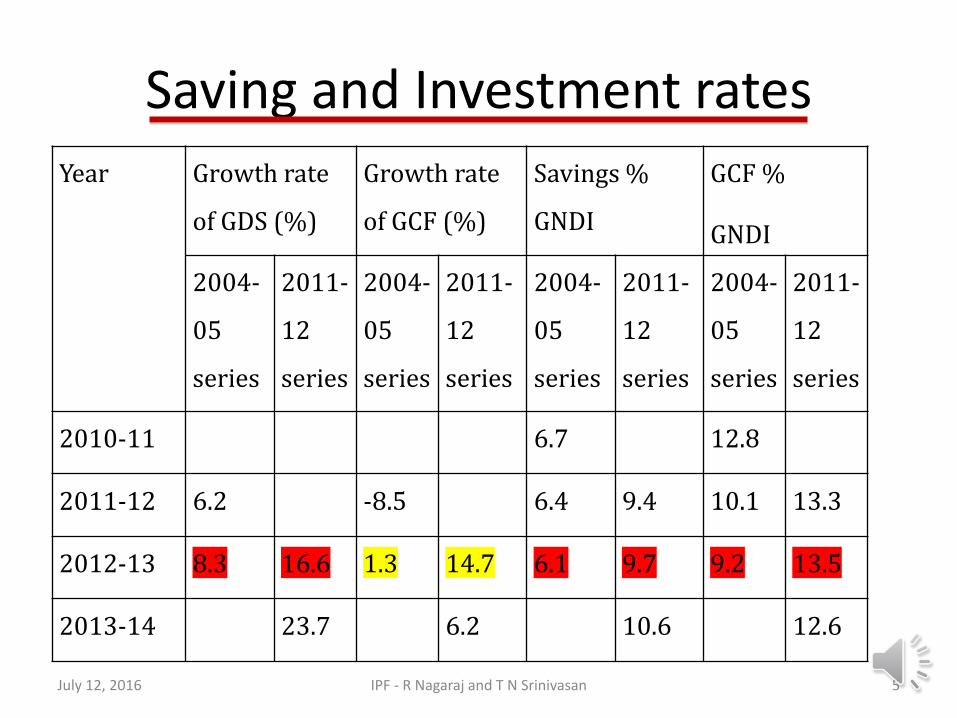
Saving and Investment rates
Year Growth rate
of GDS (%)
Growth rate
of GCF (%)
Savings %
GNDI
GCF %
GNDI
2004-
05
series
2011-
12
series
2004-
05
series
2011-
12
series
2004-
05
series
2011-
12
series
2004-
05
series
2011-
12
series
2010-11 6.7 12.8
2011-12 6.2 -8.5 6.4 9.4 10.1 13.3
2012-13 8.3 16.6 1.3 14.7 6.1 9.7 9.2 13.5
2013-14 23.7 6.2 10.6 12.6
IPF - R Nagaraj and T N Srinivasan July 12, 2016 5

Why the Differences?
• NAS template got updated to System of National Accounts 2008 (SNA 2008).
• In a first, direct estimation of VA in private corporate sector (PCS); significant changes in methodology for manufacturing sector.
• Changes in methodology and databases for saving and investment.
• Changes in the definitions and composition of GDP.
IPF - R Nagaraj and T N Srinivasan July 12, 2016 6

Their Implications
• Higher and rising GDP growth rates are not perceived (though not necessarily in theory) to square with macroeconomic correlates.
• Giving rise to widening scepticism of the base revision process.
• CSO maintains that the revision is bench-marked against the best, global practices, and has used up-to-date and large data sets; hence, no identifiable flaws.
• Critics, however, remain unconvinced, equally they have not succeeded in persuading CSO of their criticisms; every quarterly data release seems to throw up a new question.
IPF - R Nagaraj and T N Srinivasan July 12, 2016 7
Part I: Legacy Issues
● HISTORY OF GROSS DOMESTIC PRODUCT.
●PRE-INDEPENDENCE : DADABHAI NAOROJI, PH.D DISSERTATION OF V.K.R.V. RAO AT CAMBRIDGE
● POST IDEPENDENCE: THE PRELIMINARY AND FINAL REPORTS OF THE FIRST NATIONAL INCOME COMMITTEE (FNC) CHAIRED BY P.C. MAHALANOBIS, SIVASOBRAMANIAN ON DATA AND ANALYSIS
IPF - R Nagaraj and T N Srinivasan July 12, 2016 8
PART I: LEGACY ISSUES
● MY ESSAY WOULD HAVE COCLUDED, THAT GIVEN THE LEGACY OF UNRESOLVED ISSUES , THE PROGRESS IS STRICTLY LIMITED, AND PERHAPS ONLY TO THE INTRODUCTION OF BASIC PRICES ● THE TWO PRIMARY DATA SOURCES FOR (organised sector of) NAS UNTIL THE MCA-21 DATA BASE INTRODUCED BY THE NEW SERIES WERE A SAMPLE OF FACTORIES (THAT IS, PLANTS) FROM THE LIST OF FACTORIES LEGALLY REQUIRED TO REGISTER UNDER THE FACTORIES ACT AND A SAMPLE OF COMPANIES CHOSEN BY THE RBI FROM COMPANIES LEGALLY REQUIRED TO REGISTER UNDER THE COMPANIES ACT. (for organised manufacturing, ASI was the principal source. It consisted of two parts: a census sector for factories with 50+/100+ workers with/without power; for 10-50/20-100 worker factories a stratified random sample was canvassed, whose estimates were blown up to the universe of registered factories. RBI’s purposive sample consisted of large companies, which was used to estimate corporate saving and capital formation.
IPF - R Nagaraj and T N Srinivasan July 12, 2016 9

PART I : LEGACY ISSUES
● THE LISTS OF RIGISTERED FACTORIES AND COMPANIES WERE DEFECTIVE AS SAMPLE FRAMES AND PROCEDURES OF SAMPLING FROM THESE DEFECTIVE FRAMES WERE ALSO DEFECTIVE NOT BEING RANDOM AND VARYING OVER TIME, MAKING THEM DEFECTIVE AS WELL. ●THE CONSEQUENCE WAS THAT ASI DATA BLOWN UP FROM THE SAMPLE OF PLANTS OF ITS CENSUS AND SAMPLE SECTORS AND FROM THE RBI SAMPLE WERE UNRELIABLE. ASI census sector data is still considered quite good, since large factories cannot easily escape registration. Furnishing of production accounts for ASI is mandated by law. But sample sector data could be underestimates as registration of factories gradually deteriorated, especially after 1991. The data problem could be more acute in PCS as company registration boomed, but their compliance with the law deteriorated.
July 12, 2016 IPF - R Nagaraj and T N Srinivasan 10
PART I: LEGACY ISSUES
● THE MCA 21 DATA SET BRINGS ITS OWN PROBLEMS.
● ACCORDING TO MCA, “AS ON 31.3.2013, THE MCA 21 REPOSITORY HAD INFORMATION FOR ALMOST 13.02 LAKH COMPANIES THAT HAD BEEN REGISTERED [SOME TIME EARLIER] IN INDIA. AMONGST THEM, THERE ARE AS MANY AS 8.59 LAKH ‘ACTIVE’COMPANIES, CONSTITUTING 45, 440 UNLISTED PUBLIC LIMITED COMPANIES AND 7,020 LISTED PUBLIC LIIMITED COMPANIES. “
July 12, 2016 IPF - R Nagaraj and T N Srinivasan 11

PART I : LEGACY ISSUES
● EVEN IF ONE WERE TO ASSUME HEROICALLY THAT ALL COMPANIES LEGALLY REQUIRED TO REGISTER DID, STILL WHETHER TO BE ACTIVE OR NOT AT ANY TIME IS EACH COMPANY’S DECISION, ● CSO’s NEW SERIES ESTIMATES FOR 2011-12 AND 2012-13 WERE BASED ON RETURNS SUBMITTED IN 2012-13 BY 5.24 LAKH NON-FINANCIAL PRIVATE SECTOR COMPANIES OWNING 85% 0F TOTAL PUC (PAID UP CAPITAL) OF ACTIVE NON-FINACIALCORPORATE SECTOR AS PER NCA. ●FOR 2013-14, CSO USED INDUSTRY-WISE ESTIMATED PARAMETERS ARE MOVED USING THE GROWTH RATE AS OBSEVED FOR THE 3.O8 LAKH COMMON COMPANIES BETWEEN 2O12-13 AND 2013-14. THIS IS NO MORE THAN A RULE OF THUMB PROCEDURE.
July 12, 2016 IPF - R Nagaraj and T N Srinivasan 12
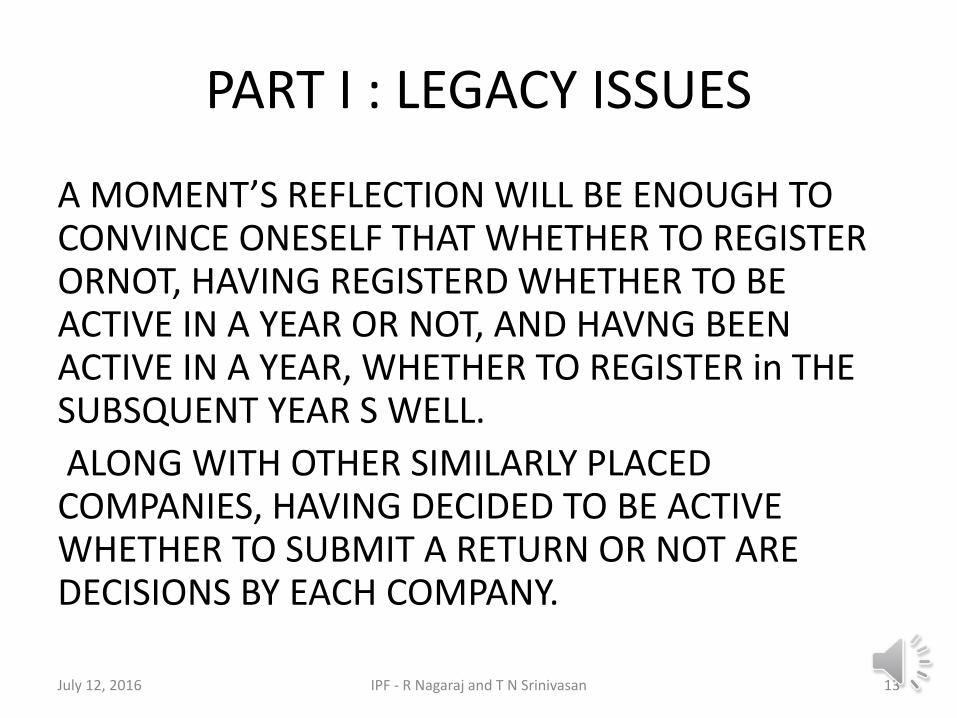
PART I : LEGACY ISSUES
A MOMENT’S REFLECTION WILL BE ENOUGH TO CONVINCE ONESELF THAT WHETHER TO REGISTER ORNOT, HAVING REGISTERD WHETHER TO BE ACTIVE IN A YEAR OR NOT, AND HAVNG BEEN ACTIVE IN A YEAR, WHETHER TO REGISTER in THE SUBSQUENT YEAR S WELL.
ALONG WITH OTHER SIMILARLY PLACED COMPANIES, HAVING DECIDED TO BE ACTIVE WHETHER TO SUBMIT A RETURN OR NOT ARE DECISIONS BY EACH COMPANY.
July 12, 2016 IPF - R Nagaraj and T N Srinivasan 13

PART I :LEGACY ISSUES
●THE ESTIMATES OF CSO OF THE NAS AGGREGATES AND OTHER PARAMETERS ARE ALL BASED ON THE VARIOUS DECISIONS OF A SELF-SELECTED SET OF COMPANIES.
AS SUCH UNLESS THE SELF-SELECTION DECISION IS MODELLED AND INCORPORATED IN THE ESTIMATION PROCESS, THE ESTIMATES WILL BE INCONSISTENT AND BIASED WITH THE DIRECTIONS AND SIZES OF BIAS UNKOWN.
July 12, 2016 IPF - R Nagaraj and T N Srinivasan 14

PART I : LEGACY issues
● MOREOVER, THE BLOW-UP FACTORS FROM THE DATA SUPPLIED BY THE SELF-SELECTED COMPANIES TO THE ECONOMY AS A WHOLE ARE COMPROMISED AS WELL.
● THE SHIFT TO MCA DATA SET HAS NOT
SOLVED THE LEGACY OF SAMPLE FRAME AND NON-RANDOM SAMPLING PROBLEM.
July 12, 2016 IPF - R Nagaraj and T N Srinivasan 15

PART I: LEGACY ISSUES
IN THE NEW SERIES THE UNIT OF OBSERVATION IS AN ENTERPRISE AND INTRODUCED THE CONCEPT OF ‘EFFETCIVE LABOUR INPUT’ BY DEFINING IT AS THE SUM OF THE LABOUR INPUTS OF THE OWNER OF OF THE ENTERPRISE, HIRED AND FAMILY LABOUR WITH THEIR PRODUCTIVITIES IN TERMS OF GROSS VALUE ADDED, RELATIVE T0 HIRED LABOUR AS WEIGHTS, ESTIMATED BY FITTING A NESTED COBB-DOUGLAS PRODUCTION FUNCTION TO DATA ON GVA BY COMPILATION CATEGORIES. THE DETAILS OF THE DATA USED, ESTIMATES OF PARAMETERS AND IF ANY ROBUSTNESS CHECKS WERE DONE ARE UNAVAILABLE.RELEVANT ISSUES ARE DISCUSSED IN APPENDX 1 WHICH ARGUES THAT A SUPERIOR TECHNIQUE WOULD HAVE BEEN TO ESTIMATE A PRODUCTION FUNCTION WITH A CONSTANT ELASTICITY OF SUBSTITUION AMONG THE THREE TYPES OF LABOR.
July 12, 2016 IPF - R Nagaraj and T N Srinivasan 16

PART I : LEGACY ISSUES
• APPENDIX 2 DISCUSSES ISSUES RELATING TO PRICE DEFLATION OF NOMINAL GROSS VALUE ADDED (GVA) IN NOMINAL PRICES TO ITS REAL COUNTER-PART AND ARGUES THAT A DOUBLE DEFLATION PROCEDURE IS IDEAL. IN PRACTICE CSO MOSTLY USES SINGLE DEFLATION AND SYSTEMATIC PROCEDURE FOR INCORPORATING NEW GOODS IS ABSENT.
July 12, 2016 IPF - R Nagaraj and T N Srinivasan 17

PART I :LEGACY ISSUES
• FNC RECOGNIZED THE FACT THAT THE PUTTING TOGETHER NAS INVOLVES THE USE OF MULTIPLE SOURCES OD DATA, EACH WITH ITS OWN ERRORS OF MEASUREMENT, WITH THE IMPLICATIONS,THAT ESTIMATED NAS AGGREGGATES HAVE MEAUREMENT ERRORS. FNC HAD PROVIDED ESTIMATES OF ERROR BANDS AROUND MAJOR NAS AGGREGATES. IT IS ESSENTIAL THAT CSO RESUMES THE PRACTICE.
NAS ARE THEIR PRESENTED AS A COMPLETE SYSTEM OF CONSOLIDATED BALANCED ACCOUNTS OF THE NATION USING DOUBLEE ENTRY BOOKING. GIVEN THE DIVERSE SOURCES OF DATA FOR THE ENTRIES AND THEIR MEASUREMENT ERRORS A BALANCING STATISTICAL DISCREPANCY ITEM ON ONE SIDE OF EACH ACCOUNT IS USUAL IN ANY SUCH A SYSTEM. NOT MISUNDERSTANDING THEM IS IMPORTANT
July 12, 2016 IPF - R Nagaraj and T N Srinivasan 18

PART I : LEGACY ISSUES
• LASTLY THERE MAVE BEEN MANY ASPECTS OF GLOBALIZATION SINCE THE ESTABLISHMENT OF WTO IN 2001 INCLUDING THE EMERGENCE OF GOBAL VALUE CHAINS. CSO COULD HAVE ADDRESSED ITS ASSESSMENT OF THE IMPACT OFITS EMERGENCE ON INDIA ICLUDING PRESENTING INDIA’S FOREIGN TRADE ACCOUNT BOTH IN VALUE ADDED AND GROSS VALUE TERMS
July 12, 2016 IPF - R Nagaraj and T N Srinivasan 19

GDP’s Industrial Composition for the base year 2011-12
July 12, 2016 IPF - R Nagaraj and T N Srinivasan 20
Sector/Industry
New NAS
(Revision
2016)
NAS 2014
(Old series)
1. Agriculture, forestry & fishing 18.5 17.9
2. Mining & quarrying 3.2 2.7
3. Manufacturing 17.4 14.7
4. Electricity, gas, water supply & other utility services 2.3 1.6
5. Construction 9.6 8.2
6. Trade, repair, hotels and restaurants 10.9 17.4
7. Transport, storage, communication & services related
to broadcasting 6.5 7.3
8. Financial , real estate & prof servs 18.9 16.5
9. Public Administration, defence and other services 12.7 13.8
10. GVA at basic prices 100.0 100.0
GVAbp/GDPfc (Rs. crore) 8106656 8391691

GDP’s Sectoral Composition For the base year 2011-12
July 12, 2016 IPF - R Nagaraj and T N Srinivasan 21
Old Series GDP share New Series GDP
share
I. Organised sector: 43.9 I. Organised sector: 55.1
1. Public sector 20.3 1. Public sector 20.4
(i) Administrative dept (i) General government 9.7
(ii) Departmental enterprises (ii) Public non-financial
corporations
2.1
(iii) Non-departmental enterprises (iii) Public financial corporations 8.6
2. Private corporate sector 23.7 2. Private corporate sector 34.7
3. Factory manufacturing (a) Private financial corporations
(b) private non-financial
corporations
4. Recognised educational and medical
institutions
II. Unorganised sector 56.1 II. Household sector 44.9

GDP’s Principal Sectors
July 12, 2016 IPF - R Nagaraj and T N Srinivasan 22
18%
33%
49%
18%
27%
55%
Figure 4 (ii) Sectoral Composition of GDP New and the Old Series
Agriculture Industry Services

Non-financial PCS
• PCS GDP was not estimated previously. Could only be derived indirectly.
• Savings and investment of PCS estimated using RBI sample. But the sample was purposive, not random.
• Estimates of RBI sample of high paid-up capital (PUC) were “blown-up” to the universe of companies.
• But as the universe of working companies was not known, it resulted in over estimation.
July 12, 2016 IPF - R Nagaraj and T N Srinivasan 23
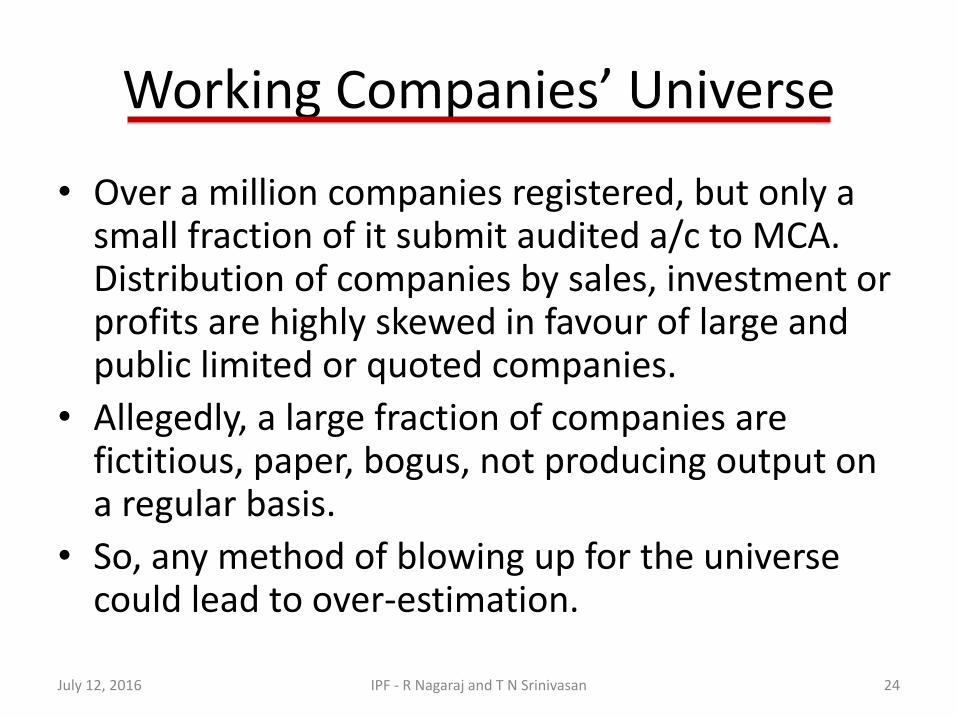
Working Companies’ Universe
• Over a million companies registered, but only a small fraction of it submit audited a/c to MCA. Distribution of companies by sales, investment or profits are highly skewed in favour of large and public limited or quoted companies.
• Allegedly, a large fraction of companies are fictitious, paper, bogus, not producing output on a regular basis.
• So, any method of blowing up for the universe could lead to over-estimation.
July 12, 2016 IPF - R Nagaraj and T N Srinivasan 24

PCS: New Methodology
• Prepared estimates using MCA’s database of over 500,000 self-selected companies, which filed annual returns.
• “Blow it up” for about a million cos., using paid-up capital as the parameter.
• Population estimates could vary on the quality of database and yearly variability of the no., of submissions and their composition.
• Why the scepticism? The size of PCS is much larger than previous estimate.
July 12, 2016 IPF - R Nagaraj and T N Srinivasan 25

Manufacturing sector
July 12, 2016 IPF - R Nagaraj and T N Srinivasan 26
Manufacturing sector growth rates
2014-15 2015-16
NAS 5.5% 9.5%
IIP 2.8% 2.4%
• In new NAS, MCA account for about 2/3rd of VA estimates in Total manufacturing.
• ASI has been practically abandoned for estimating mfg. GVA.
• One suspects, these have led to increased size and growth rate of manufacturing output.
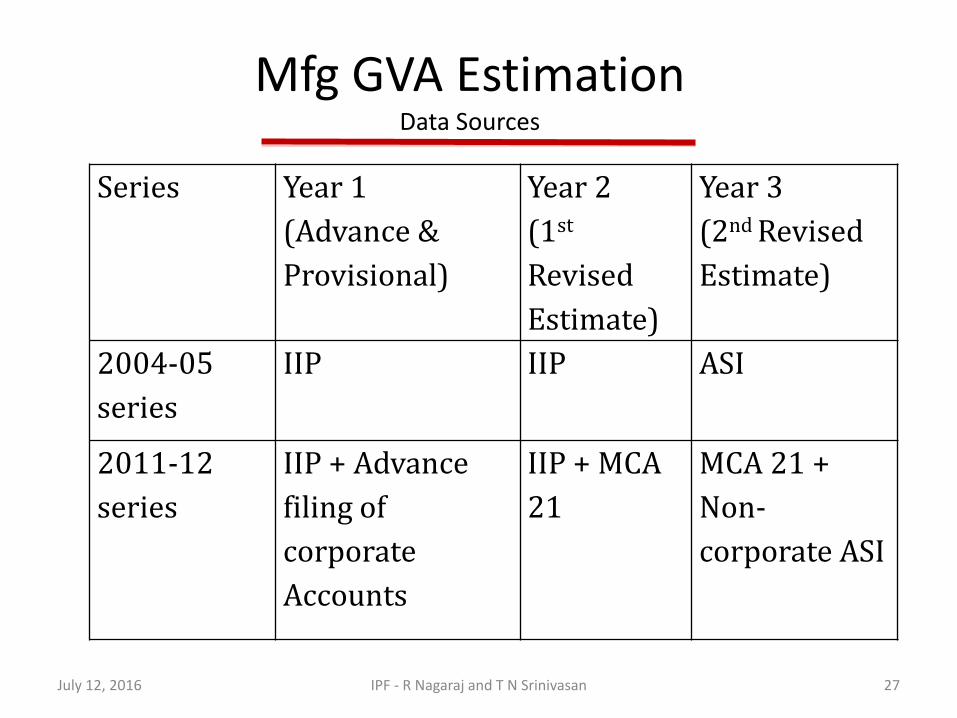
Mfg GVA Estimation Data Sources
July 12, 2016 IPF - R Nagaraj and T N Srinivasan 27
Series Year 1
(Advance &
Provisional)
Year 2
(1st
Revised
Estimate)
Year 3
(2nd Revised
Estimate)
2004-05
series
IIP IIP ASI
2011-12
series
IIP + Advance
filing of
corporate
Accounts
IIP + MCA
21
MCA 21 +
Non-
corporate ASI

HH sector size shrunk(?)
• Quasi corporations (QCs) moved from HH sector to PCS.
– What are QCs? Put simply, partnership and proprietary concerns in manufacturing and services which maintain books of accounts.
– Audited? Don’t know.
– Further, their growth rate is assumed to be same as that of PCS. On what basis?
• HH sector estimation method changed.
July 12, 2016 IPF - R Nagaraj and T N Srinivasan 28

HH sector output estimation
• Previous method: Output/worker* no., workers. • Widely believed to underestimate HH sector
output for lack of direct estimation. • New method: estimate marginal productivity of
different category of workers. • Result: Steep fall in GVA in HH sector. • How is it justified? What is the rationale for the
method and functional form of production function? Some suggestions in the appendix of the paper.
July 12, 2016 IPF - R Nagaraj and T N Srinivasan 29

Critical Questions
• What did the GDP revision really achieve?
– Answer: Perhaps not much.
• Is it worthwhile to pursue with the new series
• Does it make sense to revert to the old series?
• Need for a statistical audit of new NAS – with the best experts drawn from anywhere.
IPF - R Nagaraj and T N Srinivasan July 12, 2016 30

Conclusions
• Updating the NAS to the latest SNA is welcome. But it should not be done simply for the sake of doing it.
• SNA is a template; its adaptation for a specific country – should be suitable for the context, and its experience.
• Given the problems raised in the debate on the new NAS, we suggest phasing in the new series in several steps.
• Although the new series has already been launched, there could be (in our view should be) phasing-in of its different components at different speeds. For example, replacing factor cost with basic price approach to approximate producer incentives is appropriate can be done.
IPF - R Nagaraj and T N Srinivasan July 12, 2016 31

Thank You For your attention
July 12, 2016 IPF - R Nagaraj and T N Srinivasan 32