measuring energy efficiency and its contribution towards meeting
TRANSCRIPT

SEEDS SURREY
Surrey Energy Economics ENERGY
Discussion paper Series ECONOMICS
CENTRE
Measuring energy efficiency and
its contribution towards meeting
CO2 targets: estimates for
29 OECD countries
Joanne Evans, Massimo Filippini and Lester C Hunt
December 2011
SEEDS 135 School of Economics ISSN 1749-8384 University of Surrey

The Surrey Energy Economics Centre (SEEC) consists of members of the School of Economics who work on energy economics, environmental economics and regulation. The School of Economics has a long-standing tradition of energy economics research from its early origins under the leadership of Professor Colin Robinson. This was consolidated in 1983 when the University established SEEC, with Colin as the Director; to study the economics of energy and energy markets.
SEEC undertakes original energy economics research and since being established it has conducted research across the whole spectrum of energy economics, including the international oil market, North Sea oil & gas, UK & international coal, gas privatisation & regulation, electricity privatisation & regulation, measurement of efficiency in energy industries, energy & development, energy demand modelling & forecasting, and energy & the environment.
SEEC research output includes SEEDS - Surrey Energy Economic Discussion paper Series (details at www.seec.surrey.ac.uk/Research/SEEDS.htm) as well as a range of other academic papers, books and monographs. SEEC also runs workshops and conferences that bring together academics and practitioners to explore and discuss the important energy issues of the day.
SEEC also attracts a large proportion of the School’s PhD students and oversees the MSc in Energy Economics & Policy. Many students have successfully completed their MSc and/or PhD in energy economics and gone on to very interesting and rewarding careers, both in academia and the energy industry.
Enquiries:
Director of SEEC and Editor of SEEDS: Lester C Hunt SEEC, School of Economics, University of Surrey, Guildford GU2 7XH, UK. Tel: +44 (0)1483 686956 Fax: +44 (0)1483 689548 Email: [email protected] www.seec.surrey.ac.uk

i
___________________________________________________________
Surrey Energy Economics Centre (SEEC)
School of Economics University of Surrey
SEEDS 135 ISSN 1749-8384
___________________________________________________________
MEASURING ENERGY EFFICIENCY AND ITS CONTRIBUTION TOWARDS MEETING
CO2 TARGETS: ESTIMATES FOR 29 OECD COUNTRIES
Joanne Evans, Massimo Filippini and Lester C Hunt
December 2011
___________________________________________________________
This paper may not be quoted or reproduced without permission.

ii
ABSTRACT
Using results for 29 OECD countries from the estimation of an extended version of the model advocated by Filippini and Hunt (2011a), actual energy consumption and CO2 emissions are compared to notional energy consumption and CO2 emissions if the countries were energy efficient. This shows the contribution that improvements in energy efficiency can make towards the reduction in CO2 emissions. It is found that in many countries efficiency improvements alone are not likely to be sufficient to bring about reductions in CO2 emissions required to meet ambitious obligations. However, this is not the case across all countries included in the investigation. Moreover, it is shown that some of the world’s largest OECD emitters can make a significant contribution to CO2 reductions from becoming energy efficient. Therefore the negotiations of the new legally binding treaty agreed under the Durban Platform should promote emission reduction targets that incentivise national energy efficiency. JEL Classifications: Q41; Q48; Q50; Q54. Key Words: emissions; energy efficiency; Durban Platform
Measuring energy efficiency and its contribution towards meeting CO2 targets Page 1 of 36
Measuring energy efficiency and its contribution towards meeting
CO2 targets: estimates for 29 OECD countries
Joanne Evans Massimo Filippini Lester C. Hunt
1 Introduction
The Kyoto Protocol set an agenda in 1997 for GHG emission reductions (relative to the 1990
emission levels) in participating countries between 2008 and 2012. Despite emission
reduction measures and strengthening political will internationally,1 global CO2 emissions
reached their highest ever level in 20102 (IEA, 2010a) with an estimated 40% of global
emissions coming from OECD countries. Unsurprisingly non-OECD countries, led by China
and India, saw much stronger increases in emissions as their economic growth accelerated.
However, on a per capita basis, OECD countries collectively emitted 10 tonnes, compared
with 5.8 tonnes for China, and 1.5 tonnes in India (IEA, 2010a). This emissions profile is
informative since international discussions in Copenhagen (2009) and Cancun (2010) focused
Acknowledgements We gratefully acknowledge the comments of participants at the 34th International IAEE Conference, Stockholm, Sweden, June 2011. The authors are, of course, responsible for all errors and omissions.
Surrey Energy Economics Centre (SEEC), School of Economics, University of Surrey, UK.
Centre for Energy Policy and Economics (CEPE), ETH Zurich and Department of Economics, University of Lugano, Switzerland.
Surrey Energy Economics Centre (SEEC) and Research Group on Lifestyles Values and Environment (RESOLVE), School of Economics, University of Surrey, UK.
1 Although not legally binding countries representing over 80% of global emissions (114 parties agreed to ‘take note of’ the Accord) engaged with Copenhagen Accord (December 2009). The Accord does not commit countries to agree to a binding successor to the Kyoto Protocol; however, it does endorse the continuation of Kyoto like measures.
2 After a dip in 2009 caused by the global financial crisis, emissions are estimated to have climbed to a record 30.6 Gigatonnes (Gt), a 5% jump from the previous record year in 2008, when levels reached 29.3 Gt. In terms of fuels, 44% of the estimated CO2 emissions in 2010 came from coal, 36% from oil, and 20% from natural gas. The top 10 CO2 emitting countries in 2008 account for two thirds of the world CO2 emissions (Top 10 total 19.1 Gt CO2, world total 29.4 Gt CO2. In addition the combined share of electricity and heat generation (41% of global CO2 emissions in 2008) and transport (22% of global CO2 emissions in 2008) represented two thirds of global emissions in 2008 (IEA, 2010a, p. 11 Figure 4).

Measuring energy efficiency and its contribution towards meeting CO2 targets Page 2 of 36
on countries contributing in line with “common but differentiated responsibilities and
respective capabilities”, Article 3 of the UNFCCC, (United Nations, 1992) to 2020 economy
wide emissions reduction targets where developed countries should commit to emissions
targets and countries party to Kyoto would strengthen their targets. Developing nations would
‘implement mitigation actions’ that are nationally appropriate to slow growth in emissions
(UNFCCC, 2010). In 2011 in Durban, South Africa, the spirit of the negotiations changed
and in conjunction with extending the life of the Kyoto Agreement by between five and eight
years3 to at least 2017, the so called Durban Platform deal (UNFCCC, 2011) commits the
world to negotiating a new legally binding climate treaty by 2015 for implementation by
2020. The emissions levels specified in this new treaty would be legally binding on all
nations including the US and China.
These commitments will require a mix of instruments to be employed; however improving
energy efficiency has often been assumed to be one of the most cost-effective ways of
reducing CO2 emissions, increasing security of energy supply, and improving industry
competitiveness. It is against this backdrop that the contribution of improvements in energy
efficiency alone might make to national CO2 emissions targets of 29 OECD countries is
considered here. During the last 20 years, there has been considerable debate within energy
policy about the possible contribution from an improvement in energy efficiency and on the
effectiveness of ecological tax reforms in the alleviation of the greenhouse effect and in the
decrease of the dependency on fossil fuels. Many of the national and international ‘think
tanks’ and policy agencies4 suggest a major role for improvements in energy conservation
3 The final decision as to the exact term of the extension would be specified at the UNFCCC meeting in Qatar December 2012.
4 Such as European Climate Change (Action) Programmes (ECCP) 2000 and 2005, IPCC (2007), IEA (2008), EC (2005, 2006a and 2006b) and European Roadmap 2050 EC (2011).

Measuring energy efficiency and its contribution towards meeting CO2 targets Page 3 of 36
and efficiency. Indeed a report by the International Energy Agency (IEA, 2011) suggests that
energy efficiency can play a major role in reducing a country’s energy consumption and
consequently its GHG emissions, further highlighting the importance of activities to support a
country’s energy efficiency policy. According to IEA (2011), since 1974, energy efficiency
measures and programmes have contributed to limiting the growth of energy consumption in
IEA member countries with savings as high as 63%, although the rate of energy efficiency
progress has dropped since 1990. Consequently, IEA (2011) recommend that national energy
policies should continue to include measures promoting energy efficiency5.
Energy intensity is the typical indicator used to monitor energy efficiency at the country level
and the IEA (2011) analysis is based on this simple traditional measure; defined as the ratio
of energy consumption to GDP. However, according to an earlier report, IEA (2009),
“Energy intensity is the amount of energy used per unit of activity. It is commonly calculated
as the ratio of energy use to GDP. Energy intensity is often taken as a proxy for energy
efficiency, although this is not entirely accurate since changes in energy intensity are a
function of changes in several factors including the structure of the economy and energy
efficiency” (our emphasis, p. 15). This highlights the weakness of this simple aggregate
energy consumption to GDP ratio in that it does not measure the level of ‘underlying energy
efficiency’ that characterizes an economy6; hence, it is difficult to make conclusions for
energy policy based upon this simple measure.
5 The IEA 25 energy efficiency policy measures recommended at G8 summits in 2007 (IEA 2007) and 2008 (IEA 2008) have been followed up with two audits (2009, 2011) to assess the progress made on energy efficiency improvements by national governments. These recommendations include measures for energy efficiency improvements in buildings, appliances and equipment, lighting, transport, industry and energy utilities as well as cross sectoral measures. Progress on energy efficiency has been noted (IEA, 2011).
6 Energy Intensity can vary between countries for a whole range of reasons including the level of industrialisation, the mix of services and manufacturing, the climate, the level of energy efficiency of the appliance and capital stock and production processes and the organization of the production and consumption processes in space.

Measuring energy efficiency and its contribution towards meeting CO2 targets Page 4 of 36
As IEA (2011) highlights, energy intensity has decreased in many countries. This decrease,
sometimes justified on the ‘dematerialization’ of the economies of these countries (e.g.
Medlock, 2004), has allowed GDP growth to be decoupled to a certain extent from the
growth of energy demand, although there may be other explaining factors. Richmond and
Kaufmann (2006), for example, argue that the inclusion of energy prices explains the
evolution of energy intensity in most countries, so that the dematerialization hypothesis
should be rejected when prices are considered. This view of the role of energy prices, which
partly drive greater efficiency of processes and structural shifts, is supported by the recent
work of Metcalf (2008) and Sue Wing (2008), although these papers come to different
conclusions, with the former suggesting a major role for energy efficiency and the latter
underscoring the role of structural shifts
In the energy economics literature some approaches have been proposed in order to overcome
the problems related to the use of simple monetary based energy efficiency indicators like the
energy-GDP ratio, such as Index Decomposition Analysis (IDA) and frontier analysis. IDA is
basically a bottom-up framework that can be used to create economy-wide energy efficiency
indicators.7 Whereas frontier analysis is based on the estimation of a parametric, as well as a
non-parametric, best practice production frontier for the use of energy where the level of
energy efficiency is computed as the difference between the actual energy use and the
predicted energy use.8
7See Ang (2006) for a general discussion and application of this method.
8 See Huntington (1994) for a discussion on the relation between energy efficiency and productive efficiency using the production theory framework. One of the first studies that made use of the frontier approach was Ferrier and Hirschberg (1992). More recent, in a developing strand of the literature, Filippini and Hunt (2011a) introduced, using the stochastic frontier model proposed by Aigner et. al. (1977), the idea of a frontier energy demand relationship (discussed below) as a way of estimating underlying aggregate energy efficiency for 29 OECD countries.

Measuring energy efficiency and its contribution towards meeting CO2 targets Page 5 of 36
The next section introduces the empirical framework to estimate the energy efficiency for 29
OECD countries. In section 3 the energy efficiency estimates are used to calculate the
contribution that improvements in energy efficiency alone might make to national CO2
targets. Section 4 concludes.
2. A panel ‘frontier’ whole economy aggregate energy demand function using parametric stochastic frontier analysis.
Filippini and Hunt (2011a) use a parametric frontier approach to estimate an energy demand
frontier function in an attempt to isolate ‘underlying energy efficiency’. This is done by
explicitly controlling for income and price effects, country specific effects, climate effects
and a common Underling Energy Demand Trend (the UEDT), capturing ‘exogenous’
technical progress and other exogenous factors. Hence, it allows for the impact of
‘endogenous’ technical progress through the price effect and ‘exogenous’ technical progress
(and other factors) through the UEDT.
As stated above their aim, and the aim here, is to analyze economy wide energy efficiency;
hence, the estimated model introduced below is for aggregate energy consumption for the
whole economy. Economy wide aggregate energy demand is derived from the demand for
energy services including heat, illumination, cooked food, hot water, transport services and
manufacturing processes. A combination of energy and capital (such as household
appliances, cars, machinery, etc.) is required to produce the desired services. The demand for
energy is therefore influenced by the level of efficiency of the equipment and, generally, of
the production process. Of course, in reality, apart from the technological and economic
factors, there are a range of exogenous institutional and regulatory factors that are important
Measuring energy efficiency and its contribution towards meeting CO2 targets Page 6 of 36
in explaining the level of energy consumption. Hence, it is important that the UEDT is
specified in such a way that it is ‘non-linear’ and could increase and/or decrease over the
estimation period as advocated by Hunt et al. (2003a, b). Therefore, given a panel data set is
used this is achieved by time dummies as proposed by Griffin and Schulman (2005) and
Adeyemi and Hunt (2007).9
In order to try to tease out these different influences, a general energy demand relationship
found in the standard energy demand modelling literature, relating energy consumption to
economic activity and the real energy price, is utilized for the estimation of an aggregate
energy demand function for a panel of OECD countries. Moreover, in order to control for
other important factors that vary across countries and hence can affect a country’s energy
demand, some variables related to climate, size, and structure of the economy are introduced
in to the model. Thus after controlling for income, price, climate effects, technical progress
and other exogenous factors, as well as effects due to difference in area size and in the
structure of the economy the ‘underlying energy efficiency’ for each country is isolated.10
This is defined with respect to a benchmark, e.g. a best practice economy in the use of energy
by estimating a ‘common energy demand’ function across countries, with homogenous
income and price elasticities, and responses to other factors, plus a homogenous UEDT. This
is important given the need to isolate the different underlying energy efficiency across the
countries.11 Consequently, once these effects are adequately controlled for, it allows for the
9 It is worth noting that Kumbhakar and Lovell (2000) highlight that the use of a large number of time dummies in a parametric frontier framework can create estimation problems. Thus although not done here, Filippini and Hunt (2011a and 2011b) do also consider a time trend for the specification of the UEDT, but there is no discernable difference in the efficiency rankings.
10 Note, previous studies by Buck and Young (2007) and Boyd (2008) did not base their estimation on an energy demand function, in that they did not consider the energy price as an explanatory variable; hence omitting this important control variable.
11 The UEDT includes exogenous technical progress and it could be argued that even though technologies are available to each country they are not necessarily installed at the same rate; however, it is assumed that this

Measuring energy efficiency and its contribution towards meeting CO2 targets Page 7 of 36
estimation of the underlying energy efficiency for each country showing i) how efficiency
has changed over the estimation period and ii) the differences in efficiency across the panel
of countries.
In the case of an aggregate energy demand function the frontier gives the minimum level of
energy necessary for an economy to produce any given level of goods and services. The
distance from the frontier measures the level of energy consumption above the baseline
demand, that is, the level of energy inefficiency. Energy efficiency measures the ability of a
country to minimize the energy consumption given a level of GDP.12
2.1 An aggregate frontier energy demand model
Given the discussion above, it is assumed that there exists an aggregate energy demand
relationship for a panel of OECD countries, as follows:
, , , , , , , , , 1
where Eit is aggregate energy consumption, Yit is GDP, Pit is the real price of energy,
DCOLDi is a cold climate dummy, DARIDi is a hot climate dummy , POPit is population, Ai
is the area size, ISHit is the share of value added of the industrial sector and SSHit is the share
of value added for the service sector all for country i in year t.13 In contrast to the model
estimated by Filippini and Hunt (2011a), Equation (1) includes an extra dummy variable for
extreme high temperatures (DARID). Dt is a variable representing the UEDT that captures
the common impact of important unmeasured exogenous factors that influence all countries.
Finally, EFit is the unobserved level of ‘underlying energy efficiency’ of an economy. This results from different behaviour across countries and reflects ‘inefficiency’ across countries; hence, it is captured by the different (in)efficiency terms for all countries.
12 See Filipini and Hunt (2011b) for further discussion of the meaning of ‘energy efficiency’.
13 Unfortunately, it is not possible to get more sectoral disaggregated data (e.g. data on energy intensive sectors) on a consistent basis for all 29 countries for all the years.

Measuring energy efficiency and its contribution towards meeting CO2 targets Page 8 of 36
could incorporate a number of factors that will differ across countries, including different
government regulations as well as different social behaviours, norms, lifestyles and values.
Hence, a low level of underlying energy efficiency implies an inefficient use of energy (i.e.
‘waste energy’), so that in this situation, awareness for energy conservation could be
increased in order to reach the ‘optimal’ energy demand function. Nevertheless, from an
empirical perspective, when using OECD aggregate energy data, the aggregate level of
energy efficiency of the capital equipment and of the production processes is not observed
directly. Therefore, this underlying energy efficiency indicator needs to be estimated.
Consequently, in order to estimate this economy-wide level of underlying energy efficiency
(EFit) and identify the best practice economy in term of energy utilization, the stochastic
frontier function approach introduced by Aigner et al. (1977) is used.14
2.2 Econometric specification
This frontier approach allows the possibility to identify if a country is, or is not, on the
frontier. Moreover, if a country is not on the frontier, the distance from the frontier measures
the level of energy consumption above the baseline demand, e.g. the level of energy
inefficiency. The approach used here is therefore based on the assumption that the level of
economy-wide energy efficiency can be approximated by a one-sided non-negative term, so
that a panel log-log functional form of Equation (1) adopting the stochastic frontier function
approach proposed by Aigner et al. (1977) can be specified as follows:
itititS
itI
ia
iR
iC
ttitpop
itp
ity
it uvSSHISHaDARIDDCOLDDpoppye (2)
14 The frontier function approach suggested by Aigner et al. (1977) was developed within the neoclassical production theory and the main goal of this literature has been to estimate production and cost frontier in order to identify the level of productive inefficiency (allocative and technical inefficiency). In this study, the neoclassical production theory is discarded and instead the concept of a stochastic frontier within the empirical approach traditionally used in the estimation of economy wide energy demand function is employed. Of course, behind the concept of underlying energy inefficiency developed here, there is still a ‘production process’.

Measuring energy efficiency and its contribution towards meeting CO2 targets Page 9 of 36
where eit is the natural logarithm of aggregate energy consumption (Eit), yit is the natural
logarithm of GDP (Yit), pit is the natural logarithm of the real price of energy (Pit), popit is the
natural logarithm of population (POPit), DCOLDi is a cold climate dummy variable, DARIDi
is a hot climate dummy, ai is the natural logarithm of the area size of a country (Ai), ISHit is
the share of value added of the industrial sector, and SSHit is the share of value added for the
service sector. The time variable Dt is a series of time dummy variables.
Furthermore, the error term in Equation (2) is composed of two independent parts. The first
part, vit, is a symmetric disturbance capturing the effect of noise and as usual is assumed to be
normally distributed. The second part, uit, which represents the underlying energy level of
efficiency EFit in equation (1) is interpreted as an indicator of the inefficient use of energy,
e.g. the ‘waste energy’.15 It is a one sided non-negative random disturbance term that can
vary over time, assumed to follow a half-normal distribution.16 An improvement in the
energy efficiency of the equipment or on the use of energy through a new production process
will increase the level of energy efficiency of a country. The impact of technological,
organizational, and social innovation in the production and consumption of energy services
on the energy demand is therefore captured in several ways: the time dummy variables, the
indicator of energy efficiency and through the price effect. In summary, this is a slightly
modified version of Equation (2) in Filippini and Hunt (2011a) which is estimated in order to
estimate underlying energy efficiency for each country in the sample.
15 The energy demand function estimated in this paper can be considered an input demand function derived through a cost minimizing process from an aggregate production function. Of course, theoretically the demand for energy might also depend on the price of other inputs, but in line with previous energy demand studies, data limitations make it impossible to include these variables. For this reason this equation is specified, similar to the general energy demand literature, in a relatively ad hoc way with an indirect reference to production theory.
16 It could be argued that this is a strong assumption for EF, but it does allow the ‘identification’ of the efficiency for each country separately.

Measuring energy efficiency and its contribution towards meeting CO2 targets Page 10 of 36
2.3 Data
The study is based on an unbalanced panel data set for a sample of 29 OECD countries (i =1,
. .. , 29)17 over the period 1978 to 2008 (t=1978–2008) taken from the International Energy
Agency database (IEA, 2010b),“World Energy Statistics and Balances of OECD Countries”
and from the general OECD database “Country Profile Statistics” available at www.oecd.org.
E is each country’s aggregate energy consumption in thousand tonnes of oil equivalent (ktoe),
Y is each country’s GDP in billion US2000$PPP, P is each country’s index of real energy
prices (2000=100), and POP is each country’s population in millions. The climate dummy
variable, DCOLD and DARID, indicate whether a country belongs to those characterized by a
cold respectively a hot climate (according to the Köppen-Geiger climate classification18) and
A is the area size of a country is measured in squared kilometres. Finally, the value added of
the industrial and service sectors is measured as percentage of GDP (ISH and SSH).
Descriptive statistics of the key variables are presented in Table 1.
Table 1: Descriptive statistics
Variable Mean Std. Dev. Minimum Maximum
Description Name Energy consumption (toe) E 117472 260780 2214 1581622 GDP (1000 US2000$PPP) Y 832.26 1571.90 8.56 11693.2 Population in Millions. POP 38.40 53.52 0.36 301.75 Real Price of energy (2000=100) P 89.08 15.89 12.63 149.33 Area size in km2 A 1241662 2755333 2590 9984670 Share of industrial sector in % of GDP ISH 31.20 5.35 15.40 46.20 Share of service sector in % of GDP SSH 64.25 6.81 45.40 84.30 Climate Dummy DCOLD 0.30 0.46 0 1 Arid Country Dummy DARID 0.30 0.46 0 1
17 Australia, Austria, Belgium, Canada, Czech Republic, Denmark, Finland, France, Germany, Greece, Hungary, Ireland, Italy, Japan, Korea, Luxembourg, Mexico, Netherlands, New Zealand, Norway, Poland, Portugal, Slovak Republic, Spain, Sweden, Switzerland, Turkey, the UK, and the US. For some countries, data on for some of the explanatory variables are not available for the whole sample period; for this reason the data set is unbalanced.
18 See for a discussion of this classification Peel et al. (2007).

Measuring energy efficiency and its contribution towards meeting CO2 targets Page 11 of 36
2.4 Panel data efficiency estimation
Greene (2005a and 2005b) suggests that the original SFA model (Aigner, et al., 1977) is
extended by adding a fixed or random individual effect in the model19 and such models
produce efficiency estimates that do not include the persistent inefficiencies that might
remain more or less constant over time. In fact, the time-invariant, country-specific energy
inefficiency is captured by the individual random or fixed effects. Therefore, to the extent
that there are certain sources of energy inefficiency that result in time-invariant excess energy
consumption, the estimates of these models could provide relatively high and imprecise
levels of energy efficiency. Of course, one advantage of the approaches proposed by Greene
(2005a and 2005b) with respect to the original approach proposed by Aigner et al. (1977) is
the reduction of the potential so-called ‘unobserved variables bias’; e.g. a situation where
correlation between observables and unobservables could bias some coefficients of the
explanatory variables. However, by introducing several explanatory variables such as the
climate, the area size, population and some variables on the structure of the economy it is
possible to reduce this problem. Given this the ‘pooled’ model based on Aigner et al. (1977)
is used for the estimation of Equation (2) utilising the half-normal distribution for the
efficiency term. 20
The country’s efficiency is therefore estimated using the conditional mean of the efficiency
term | , proposed by Jondrow et al. (1982).21 The level of energy efficiency
can be expressed in the following way:
19 For a successful application of these models in network industries, see Farsi, et al. (2005) and Farsi, et al. (2006).
20 See Filippini and Hunt (2011b) for a discussion and presentation of some alternative estimates such as the true random effects model proposed by Greene (2005b).
21 See also Kumbhakar and Lovell (2000) and Battese and Coelli (1992).

Measuring energy efficiency and its contribution towards meeting CO2 targets Page 12 of 36
exp 3
where Eit is the observed energy consumption and is the frontier or minimum demand of
the ith country in time t. An energy efficiency score of one indicates a country on the frontier
(100% efficient); while non-frontier countries, e.g. countries characterized by a level of
energy efficiency lower than 100%, receive scores below one. This therefore gives the
measure of underlying energy efficiency estimated below.22
Given the discussion above, the a pooled frontier energy demand model Equation (2) is
estimated followed by utilising Equation (3) to estimate the efficiency scores for each
country for each year. The discussion of the results is given in the next sub-section.
2.5 Estimation Results
The estimation results for the frontier energy demand model, Equation (2), are given in Table
2.23 This shows that the estimated coefficients and lambda have the expected signs and are
statistically significant.24
For the variables in logarithmic form, the estimated coefficients can be directly interpreted as
elasticities. The estimated income and own price elasticities are about 0.8 and –0.25
respectively; values are not out of line with previous estimates. The estimated population
elasticity is about 0.1 and the estimated area elasticity is about 0.07. The estimated
coefficients for the climate variables, DCOLD and DARID, are 0.08 and -0.31 respectively. 22 This is in contrast to the alternative indicator of energy inefficiency given by the exponential of uit. In this case, a value of 0.2 indicates a level of energy inefficiency of 20%.
23 To note, that in comparison to Filippini and Hunt (2011a), in this study the data set that contains information for an extra year and the model specification includes an extra explanatory variable for the climate.
24 Lambda ( ) gives information on the relative contribution of uit and vit on the decomposed error term eit and shows that in this case, the one-sided error component is relatively large.

Measuring energy efficiency and its contribution towards meeting CO2 targets Page 13 of 36
These coefficients indicate that as expected climate has an important influence on a country’s
energy demand. Further, the impact of hot temperatures is larger than the impact of cold
temperatures. Similarly, larger shares of a country’s industrial and service sectors will also
increase energy consumption. Moreover, the time dummies, as a group, are significant and,
as expected, the overall trend in their coefficients is negative as shown in Figure 1; however,
they do not fall continually over the estimation period, reflecting the ‘non-linear’ impact of
technical progress and other exogenous variables.
Table 2: Estimated Frontier Energy Demand Frontier for 29 Countries (1978 - 2008)
Coefficient Estimate (t-values in
parentheses) Constant () 1.835
(3.11) y 0.807
(27.46) p -0.245
(-5.97) pop 0.109
(4.03) a 0.074
(12.70) C 0.083
(4.16) R -0.311
(-16.07) I 0.028
(8.78) s 0.028
(8.46) Time dummies
Yes
Lamda (λ) 0.723 (7.79)
Note: An unbalanced panel was used for estimation given for some variables the data were not available for every year.

Measuring energy efficiency and its contribution towards meeting CO2 targets Page 14 of 36
Figure 1: Estimated Time Dummy Coefficients (relative to 1978)
2.6 Underlying Energy Efficiency Estimates
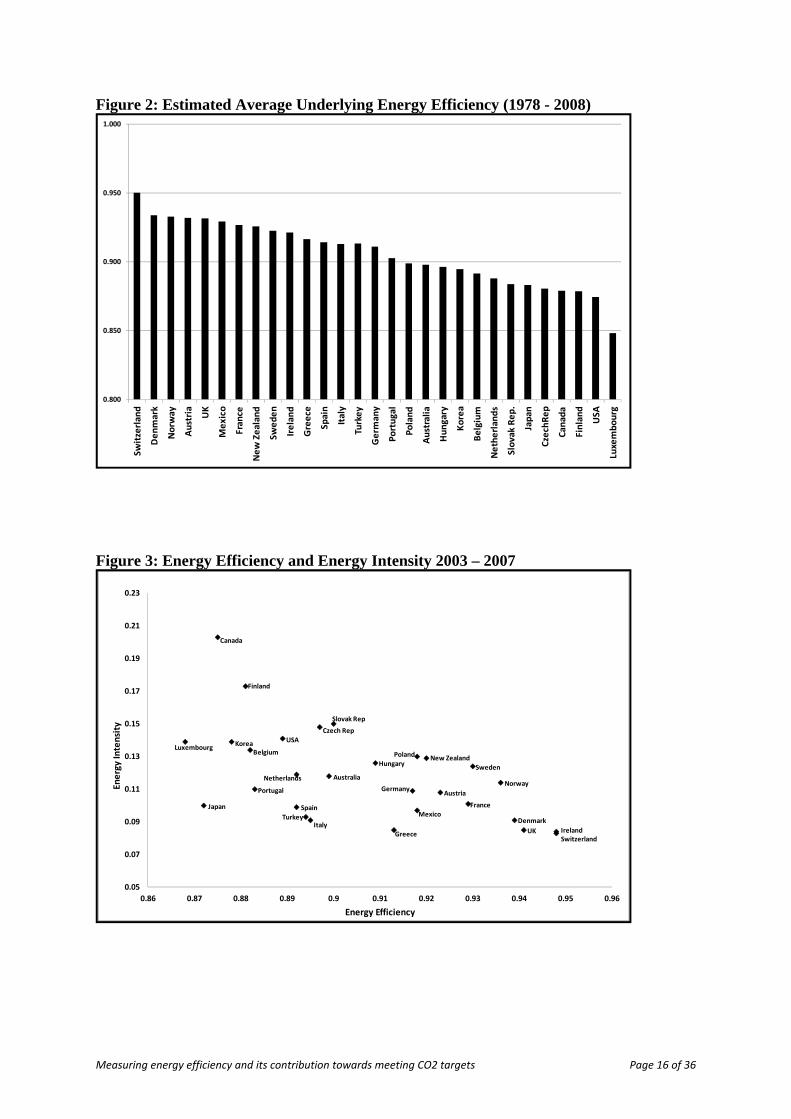
Figure 2 illustrates the rankings by ordering according the estimated efficiency. These show
that over the whole of the estimation period the most efficient country was Switzerland
followed by Denmark. At the other end of the spectrum the two countries found to be the
relatively least efficient over the whole period were Luxembourg and the USA.25 It should be
noted that, although presented individually for each country, the estimated efficiencies of
each country should not be taken as the precise position of each country given the stochastic
technique used in estimation. However, they do give a good relative indication of a country’s
change in efficiency over time and a country’s relative position vis-à-vis other countries.
Focussing on the 2003-2007 period, Table 3 compares the estimated underlying energy
efficiency with energy intensity. This shows that Luxembourg, Japan, Canada, and Korea are
estimated to be the four least efficient countries, with Switzerland, Ireland, the UK and
25 However, one of the reasons for the estimated poor performance of Luxembourg could be the presence of ‘tank tourism’, which is not captured in the aggregate model.
y = -0.0113x - 0.0183
-0.40
-0.35
-0.30
-0.25
-0.20
-0.15
-0.10
-0.05
0.00
0.05
Estimated Time Dummy Coefficients
Linear (Estimated Time Dummy Coefficients)

Measuring energy efficiency and its contribution towards meeting CO2 targets Page 15 of 36
Denmark estimated to be the four most efficient countries.26 However Table 3 also shows
that Ireland, Switzerland Greece and the UK are the least energy intensity whereas Canada,
Finland, the Slovak Republic and the Czech Republic are the most energy intensive, with the
countries re-ordered from the least energy intensive to the most energy intensive. Thus
although there would appear to be a generally negative relationship between the rankings of
the estimated underlying energy efficiency and energy intensity there is not a one to one
correspondence. For example, for the period 2003-2007 according to the energy intensity
measure Italy, Turkey, Japan and are ranked 6th, 7th and 10th respectively whereas they are
estimated to be 18th, 19th and 28th respectively according to the estimated energy efficiency
measure; thus for these countries the simple energy intensity ratio would appear to
overestimate their relative efficiency position. On the other hand, according to the simple
energy intensity ratio Sweden, New Zealand, Poland and the Slovak Republic are ranked 18th,
20th, 21st and 27th respectively whereas they are estimated to be 6th, 9th, 11th and 15th
respectively according to the estimated energy efficiency measure; thus for these countries
the simple energy intensity ratio would appear to underestimate their relative efficiency
position. This relationship between the two measures is further illustrated in Figure 3.27
The discussion above illustrates the importance of attempting to adequately define and model
‘energy efficiency’ rather than just relying on the simple energy to GDP ratio – energy
intensity. Furthermore, the estimated levels of efficiency give an indication of the possible
savings in energy consumption that countries could make if they were all efficient. This is
further analysed, along with the potential CO2 savings in the next section.
26 However, it should be noted that, given the unbalanced panel used in estimation, the figures for Switzerland are over a much shorter period.
27 We are grateful to Dermot Gately who suggested presenting the results in this way.
Measuring energy efficiency and its contribution towards meeting CO2 targets Page 16 of 36
Figure 2: Estimated Average Underlying Energy Efficiency (1978 - 2008)
Figure 3: Energy Efficiency and Energy Intensity 2003 – 2007
0.800
0.850
0.900
0.950
1.000
Switzerland
Denmark
Norw
ay
Austria
UK
Mexico
France
New Zealand
Sweden
Ireland
Greece
Spain
Italy
Turkey
Germ
any
Portugal
Poland
Australia
Hungary
Korea
Belgium
Netherlands
Slovak Rep.
Japan
CzechRep
Canada
Finland
USA
Luxembourg
0.05
0.07
0.09
0.11
0.13
0.15
0.17
0.19
0.21
0.23
0.86 0.87 0.88 0.89 0.9 0.91 0.92 0.93 0.94 0.95 0.96
Energy Intensity
Energy Efficiency
Finland
Luxembourg
Japan
Slovak Rep
Czech Rep
USA
AustraliaNetherlands
Portugal
Greece
Mexico
Germany
Denmark
UK IrelandSwitzerland
France
Austria
Norway
Sweden
New ZealandHungary
PolandBelgiumKorea
Spain
ItalyTurkey
Canada

Measuring energy efficiency and its contribution towards meeting CO2 targets Page 17 of 36
Table 3: Comparison of the Rankings for Average Estimated Underlying Energy Efficiency and Energy Intensity (2003-2007)
Estimated Underlying Energy Efficiency
( )
Energy Intensity (Energy GDP ratio, toe per 1000
US2000$PPP) Level Rank Level Rank
Australia 0.899 16 0.118 16 Austria 0.923 8 0.108 12 Belgium 0.882 24 0.134 22 Canada 0.875 27 0.203 29
Czech Rep 0.897 17 0.148 26 Denmark 0.939 4 0.091 5 Finland 0.881 25 0.173 28 France 0.929 7 0.101 11
Germany 0.917 12 0.109 13 Greece 0.914 13 0.085 3
Hungary 0.909 14 0.126 19 Ireland 0.948 2 0.083 1
Italy 0.895 18 0.091 6 Japan 0.872 28 0.100 10 Korea 0.878 26 0.139 23
Luxembourg 0.868 29 0.139 23 Mexico 0.918 10 0.097 8
Netherlands 0.892 20 0.119 17 New Zealand 0.920 9 0.129 20
Norway 0.936 5 0.114 15 Poland 0.918 11 0.130 21
Portugal 0.883 23 0.110 14 Slovak Rep. 0.900 15 0.150 27
Spain 0.892 21 0.099 9 Sweden 0.930 6 0.124 18
Switzerland 0.948 1 0.084 2 Turkey 0.894 19 0.093 7
UK 0.941 3 0.085 3 USA 0.889 22 0.141 25
Note: A rank of 29 for underlying energy efficiency represents the least efficient country by this measure, whereas a rank of 1 represents the most efficient country. A rank of 29 for energy intensity represents the most energy intensity country whereas a rank of 1 represents the least energy intensive country.
Measuring energy efficiency and its contribution towards meeting CO2 targets Page 18 of 36
3. The contribution of Energy Efficiency to CO2 Targets
The results presented in the previous section reveal an interesting result in that four out of the
six OECD countries in the world’s top 10 carbon emitters, are found to be in the bottom half
of the estimated energy efficiency rankings over the 2003 to 2007 period with Japan at 28th,
Canada at 27th, Korea at 26th and the USA at 22nd (see Table 3 and Figure 3); whereas the UK
is 3rd and Germany 12th. This suggests that there is some scope for CO2 savings from more
energy efficient behaviour. Therefore, the efficiency measures calculated in Section 3 are
employed to determine the contribution of energy efficiency alone to the reduction of CO2
emissions by the OECD countries so as to contribute towards national Kyoto targets. The
next sub-section sets out how this is achieved.
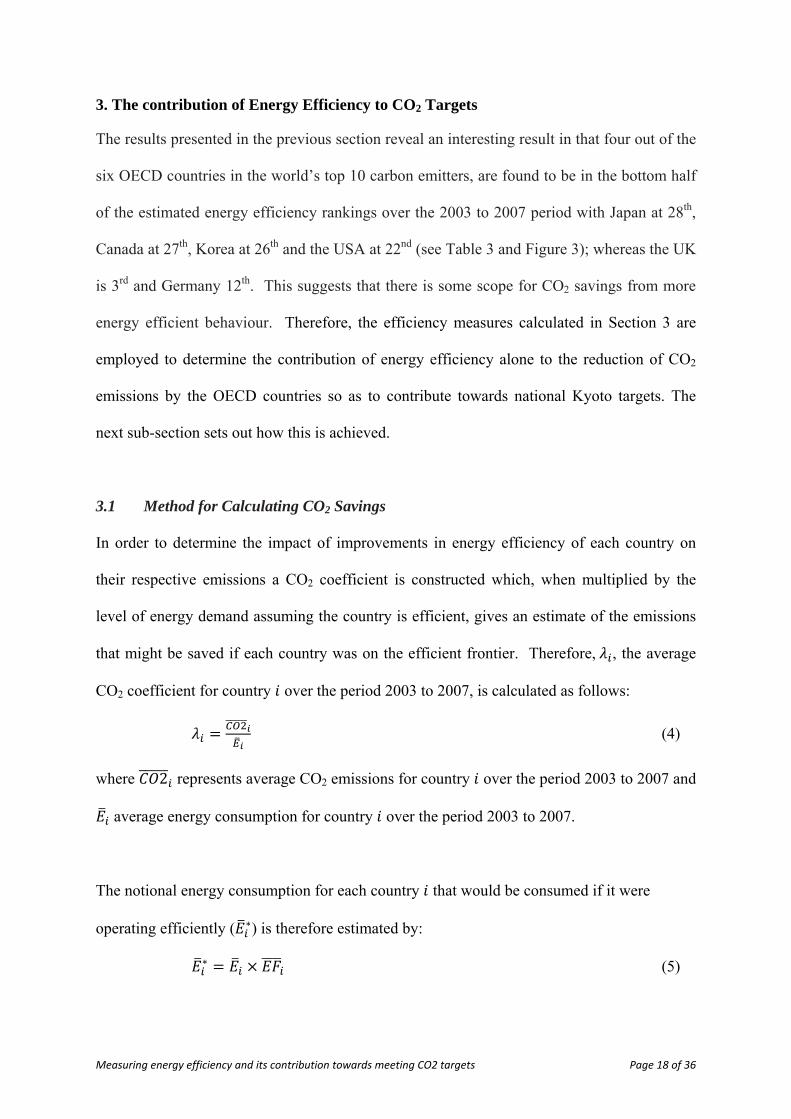
3.1 Method for Calculating CO2 Savings
In order to determine the impact of improvements in energy efficiency of each country on
their respective emissions a CO2 coefficient is constructed which, when multiplied by the
level of energy demand assuming the country is efficient, gives an estimate of the emissions
that might be saved if each country was on the efficient frontier. Therefore, , the average
CO2 coefficient for country over the period 2003 to 2007, is calculated as follows:
(4)
where 2 represents average CO2 emissions for country over the period 2003 to 2007 and
average energy consumption for country over the period 2003 to 2007.
The notional energy consumption for each country that would be consumed if it were
operating efficiently ( ∗) is therefore estimated by:
∗ (5)

Measuring energy efficiency and its contribution towards meeting CO2 targets Page 19 of 36
where is the average level of energy efficiency for country over the period 2003 to
2007 estimated in Section 3 above (see Table 5). This is then used to estimate the amount of
notional CO2 for each country that would be consumed if it were operating efficiently
( 2∗) given by:
2∗ ∗ ∗ (6)
Thus the average potential savings of energy and CO2 for each country if it were being
energy efficient are given by:
∗ (7)
and
2 2 2∗ (8)
respectively.
Furthermore, for each of the OECD nations who are party to the Kyoto Agreement, the
implications of consuming energy efficiently on achieving their emissions targets are
considered comparing the Kyoto target level of CO2 emissions (which varies between
countries for the period) with the actual level of CO2 emissions and the estimated level of
notional CO2 emissions that would have been produced had the annual aggregate energy
consumption been efficient.
3.2 Additional Data and Estimated Potential Energy CO2 Savings
The average energy consumption and the average energy efficiency estimates for each
country over the period 2003-2007 obtained in Section 3 are used along with each country’s
CO2 emissions obtained from Fuel Consumption (Sectoral Approach Mt of CO2) 28 for 29
28 CO2 emissions in the IEA database are measured in two different ways: the Sectoral Approach and the Reference Approach. The CO2 Reference Approach data contains total CO2 emissions from fuel combustion; it is based on the supply of energy in a country and as a result includes fugitive emissions from energy

Measuring energy efficiency and its contribution towards meeting CO2 targets Page 20 of 36
OECD countries between 2003 and 2007 are from the IEA (2010c) database. The results
from the above calculations are presented in Table 4. Although presented individually the
estimated CO2 emissions reduction of each country should not be taken as the precise value
given the stochastic technique used in estimation of the level of efficiency. However, they do
give a good approximation of the potential direction of a country’s change in efficiency and
CO2 emissions over time. Unsurprisingly the countries with the relatively lower energy
efficiency rankings are, broadly, amongst those which stand to make the most potential CO2
savings were they to operate on their efficient energy demand frontiers as seen in Figures 4
and 5.
It can be seen in Figure 4 that Korea, Germany, Canada, Japan and USA, who are among the
top 10 world emitters, are amongst those countries with the largest estimated potential to
consume less energy if they operated efficiently. That said the 10 counties shown in Figure 4
to have the estimated least potential to reduce energy consumption (Luxembourg, Ireland,
Denmark, New Zealand, Switzerland, Slovak Rep., Norway, Hungary, Greece, and Austria)
would collectively reduce their energy consumption by just under 28 Mtoe, being more than
the potential savings for Canada of about 25 Mtoe. Furthermore, as Figure 5 illustrates the 10
counties with the least estimated potential for CO2 savings individually (Luxembourg,
Switzerland, Ireland, Norway, New Zealand, Denmark, Sweden, Slovak Rep., Hungary, and
Austria) has an estimated potential to save less than 6 Mt of CO2 emissions; however, added
together their saved CO2 emissions would be about 32 Mt. This is similar to the estimated
transformation and for this reason is likely to overestimate national CO2 emissions. The difference between the Sectoral Approach and the Reference Approach includes statistical differences, product transfers, transformation losses and distribution losses (IEA, 2010c, p. 8). The Sectoral Approach contains total CO2 emissions from fuel combustion including emissions only when the fuel is actually combusted (IEA, 2009, p. 3). Consequently, the Sectoral Approach data is used here since by definition this measure provides the most accurate measure of emissions. Nevertheless, there is no discernable difference between the results generated using each of the two measures.
Measuring energy efficiency and its contribution towards meeting CO2 targets Page 21 of 36
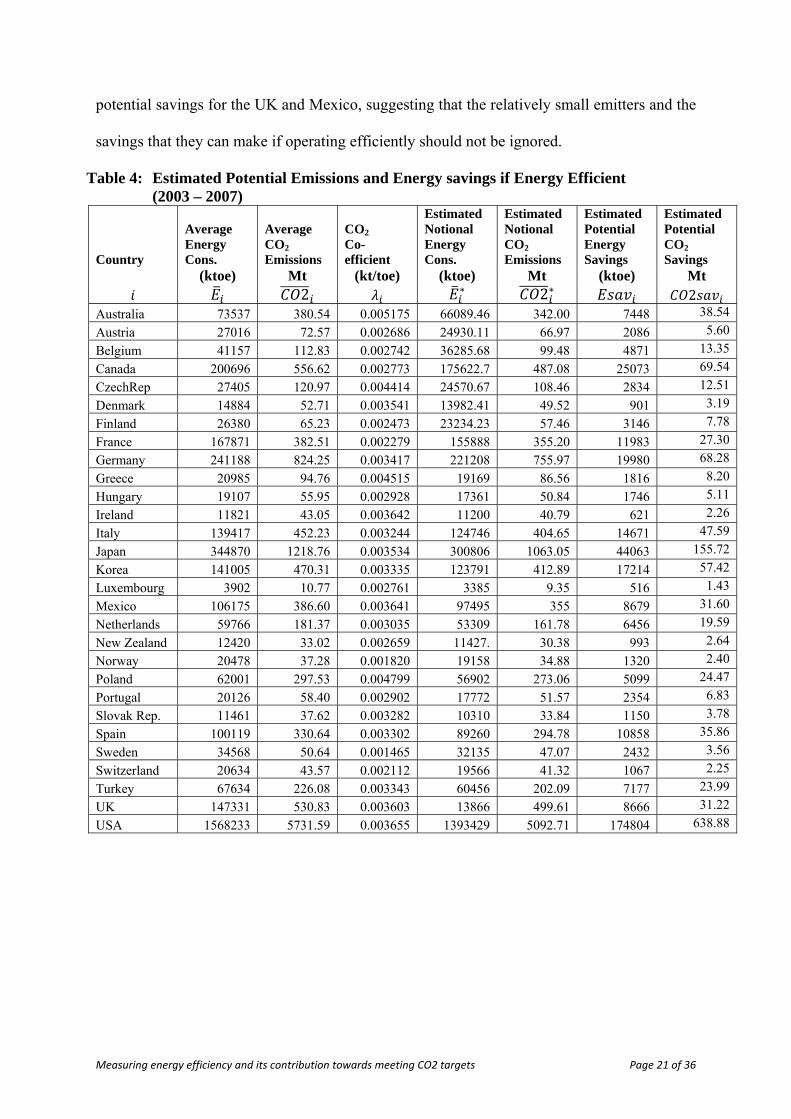
potential savings for the UK and Mexico, suggesting that the relatively small emitters and the
savings that they can make if operating efficiently should not be ignored.
Table 4: Estimated Potential Emissions and Energy savings if Energy Efficient (2003 – 2007)
Country
Average Energy Cons.
Average CO2 Emissions
CO2 Co-efficient
Estimated Notional Energy Cons.
Estimated Notional CO2 Emissions
Estimated Potential Energy Savings
Estimated Potential CO2 Savings
(ktoe) Mt (kt/toe) (ktoe) Mt (ktoe) Mt 2 ∗ 2∗ 2
Australia 73537 380.54 0.005175 66089.46 342.00 7448 38.54
Austria 27016 72.57 0.002686 24930.11 66.97 2086 5.60
Belgium 41157 112.83 0.002742 36285.68 99.48 4871 13.35
Canada 200696 556.62 0.002773 175622.7 487.08 25073 69.54
CzechRep 27405 120.97 0.004414 24570.67 108.46 2834 12.51
Denmark 14884 52.71 0.003541 13982.41 49.52 901 3.19
Finland 26380 65.23 0.002473 23234.23 57.46 3146 7.78
France 167871 382.51 0.002279 155888 355.20 11983 27.30
Germany 241188 824.25 0.003417 221208 755.97 19980 68.28
Greece 20985 94.76 0.004515 19169 86.56 1816 8.20
Hungary 19107 55.95 0.002928 17361 50.84 1746 5.11
Ireland 11821 43.05 0.003642 11200 40.79 621 2.26
Italy 139417 452.23 0.003244 124746 404.65 14671 47.59
Japan 344870 1218.76 0.003534 300806 1063.05 44063 155.72
Korea 141005 470.31 0.003335 123791 412.89 17214 57.42
Luxembourg 3902 10.77 0.002761 3385 9.35 516 1.43
Mexico 106175 386.60 0.003641 97495 355 8679 31.60
Netherlands 59766 181.37 0.003035 53309 161.78 6456 19.59
New Zealand 12420 33.02 0.002659 11427. 30.38 993 2.64
Norway 20478 37.28 0.001820 19158 34.88 1320 2.40
Poland 62001 297.53 0.004799 56902 273.06 5099 24.47
Portugal 20126 58.40 0.002902 17772 51.57 2354 6.83
Slovak Rep. 11461 37.62 0.003282 10310 33.84 1150 3.78
Spain 100119 330.64 0.003302 89260 294.78 10858 35.86
Sweden 34568 50.64 0.001465 32135 47.07 2432 3.56
Switzerland 20634 43.57 0.002112 19566 41.32 1067 2.25
Turkey 67634 226.08 0.003343 60456 202.09 7177 23.99
UK 147331 530.83 0.003603 13866 499.61 8666 31.22
USA 1568233 5731.59 0.003655 1393429 5092.71 174804 638.88

Measuring energy efficiency and its contribution towards meeting CO2 targets Page 22 of 36
Figure 4: Estimated Potential Energy Savings for the 29 OECD countries (2003 – 2007)
Figure 5 Estimated Potential CO2 Savings if Energy Efficient for the 29 OECD countries (2003 – 2007)
0
20000
40000
60000
80000
100000
120000
140000
160000
180000
Mtoe
0
100
200
300
400
500
600
700
Mtoe

Measuring energy efficiency and its contribution towards meeting CO2 targets Page 23 of 36
3.3 Comparison with Kyoto Targets
When comparing the emissions savings of each country had it been operating efficiently with
the Kyoto emissions targets that parties to the agreement have agreed to for the 2008 – 2012
first phase of the Kyoto obligations illustrated in Table 5, it can be seen that in most instances
improvements in efficiency alone are not sufficient to contribute fully to eliminating the gap
between the emissions and the emissions targets (based on 1990 emissions levels). This
implies that energy efficiency improvements in conjunction with changes in the fuel mix are
necessary to facilitate many countries in this analysis to achieve their emissions targets under
the Kyoto Agreement. As many were emitting above the level of the Kyoto targets and even
assuming efficiency would still have done so.
There are however a number of EU member countries in the group of OECD countries
including the Czech Republic, Hungary, Poland, Slovak Republic and Germany who were all
emitting below the Kyoto target during the period.29 This is of particular interest in the case
of Germany given its total level of emissions and suggests that rather than employing a flat
EU reduction target of a reduction of 8% on 1990 emission levels, these countries could have
been challenged by a higher emissions reduction target. An initiative encouraged by the
Copenhagen Accord (2009) and the UNFCCC meeting in Cancun (2010), although it
delivered little improvement on a possible compromise. On emission reductions the text of
the Cancun document says countries could either cut emissions by a specified percentage or
simply implement their chosen target without regard to how ambitious it is.30 The thinking at
Cancun was along the lines of forming regional arrangements, where similar economies via 29 Assuming Poland was to have a target consistent with the other EU target of a reduction of 1990 by 8%, in which case it too would be polluting less than this target.
30 The first week of talks was dominated by tension following Japan’s unwillingness to accept the continuation of the Kyoto protocol. A position condemned by developing countries and Britain alike. However, there is underlying concern in many quarters that the protocol covers less than a third of global emissions. Britain, for one, will not allow the protocol to continue unless China signs an agreement to cut emissions.

Measuring energy efficiency and its contribution towards meeting CO2 targets Page 24 of 36
‘coalitions of the willing’ established binding agreements to cover the spectrum of climate
problems limiting their own emissions, helping others to limit theirs and promoting low
carbon development. The results suggest that regional agreements, like the 8% reduction
offered by many of the EU countries under the Kyoto Protocol will not necessarily be as
challenging for all regional members and indeed some with the appropriate incentive could
make further significant reductions in their emissions.
Table 5: Comparison of potential CO2 savings with Kyoto Targets Country Average CO2
Emissions Notional CO2 Emissions
Potential CO2 Savings
Kyoto Target as % of 1990 emissions
Emission Target based on 1990 emissions and Kyoto obligations
(Mt) (Mt) (Mt) % (Mt) 2 2∗ 2
Australia 380.54 342.00 38.54 8 280.59 Austria 72.57 66.97 5.60 -8 52.04 Belgium 112.83 99.48 13.35 -8 101.47 Canada 556.62 487.08 69.54 -6 406.29 CzechRep 120.97 108.46 12.51 -8 142.68 Denmark 52.71 49.52 3.19 -8 46.35 Finland 65.23 57.46 7.78 -8 50.05 France 382.51 355.20 27.30 -8 323.94 Germany 824.25 755.97 68.28 -8 874.39 Greece 94.76 86.56 8.20 -8 64.52 Hungary 55.95 50.84 5.11 -6 64.40 Ireland 43.05 40.79 2.26 -8 28.18 Italy 452.23 404.65 47.59 -8 365.97 Japan 1218.76 1063.05 155.72 -6 1007.14 Korea 470.31 412.89 57.42 n/a n/a Luxembourg 10.77 9.35 1.43 -8 9.63 Mexico 386.60 355.00 31.60 n/a n/a Netherlands 181.37 161.78 19.59 -8 144.06 New Zealand 33.02 30.38 2.64 0 21.37 Norway 37.28 34.88 2.40 1 28.73 Poland 297.53 273.06 24.47 n/a n/a Portugal 58.40 51.57 6.83 -8 36.14 Slovak Rep. 37.62 33.84 3.78 -8 52.19 Spain 330.64 294.78 35.86 -8 189.38 Sweden 50.64 47.07 3.56 -8 48.53 Switzerland 43.57 41.32 2.25 -8 37.45 Turkey 226.08 202.09 23.99 n/a n/a UK 530.83 499.61 31.22 -8 508.73 USA 5731.59 5092.71 638.88 -7 4522.86

Measuring energy efficiency and its contribution towards meeting CO2 targets Page 25 of 36
Figure 6: OECD Countries where energy efficiency makes a difference to attaining Target (2003-2007)
Note: Solid line represents emission target based on 1990 figures Dashed line represents actual CO2 emissions Dotted line represents the estimated efficient level of CO2 emissions
In each of the 6 countries in Figure 6 energy efficiency improvements alone would have
taken each country below their emissions for at least some of the period. In the case of

Measuring energy efficiency and its contribution towards meeting CO2 targets Page 26 of 36
Denmark and Finland energy efficiency alone would have led to the attainment of the target
in 2005 and 2008, in Belgium energy efficiency improvements alone would have taken is
below its environmental target from 2004 on and in Sweden it would have meant achieving
target about a year (to 18 months) ahead of when the target emission barrier was broken. In
Luxembourg there are relatively small levels of emissions but nevertheless for the entire
sample period energy efficiency alone would have meant that emissions targets were met.
This is also the case for the UK; however the magnitude of emissions level is significantly
larger than Luxembourg and indeed approximately ten times larger than Sweden, Denmark
and Finland. The UK could have produced CO2 emissions below its Kyoto targets for the
entire period had it been operating on the efficient frontier this is significant for one of the
world’s top 10 CO2 emitters.
The remaining countries in the sample are those who are still exceeding their emissions target
(in some cases quite significantly). This pattern of emissions is of concern given the
undertaking of many of these nations at Cancun to seek to strengthen their existing targets.
The Australians commitment to only increase emissions by 8% from 1990 levels are still way
above this ‘generous’ target and efficiency measures alone will not be enough. The USA
target of a reduction of 7% and Canada 6% of 1990 emissions levels are not close to being
met and both countries have committed to targets of 17% reduction of 2005 emissions levels
by 2020. Energy efficiency improvements will assist but alone will not be sufficient to attain
such ambitious targets. Japan and Korea have committed to CO2 reduction targets of 25% and
30% respectively by 2020 (UNFCCC, 2010). Germany along with other EU member states
have committed to a 30% reduction in emissions from 1990 levels by 2020 and the UK in its
4th Green Budget of May 2011 (as shown in Figure 7) has committed to a 50% reduction in
CO2 emissions from 1990 levels.

Measuring energy efficiency and its contribution towards meeting CO2 targets Page 27 of 36
Figure 7: National Commitments under Copenhagen Accord Emission Reduction Pledges by 2020 (% of 1990 emissions levels*)
Source: UNFCCC (2010) Note: * USA and Canada base year is 2005 # The grey extension for the UK commitment represents the additional 20% committed by the UK in its fourth Green Budget in May 2011 (HM Government, 2011).31
When considering the national benefits of improvements in energy efficiency, with the
notable exceptions the benefits nationally appear modest and in the short term are possibly
outweighed by the costs of doing so. However the sum of the energy that would have been
saved on average over the period if all the 29 OECD countries had operated on their efficient
frontiers is 24.8% of the USA’s actual average energy consumption for the same period. That
is, if all 29 OECD countries operated on the efficient energy demand frontier this would have
saved average annual energy consumption equivalent to 24.8% of USA average annual
energy consumption. This saving in average annual energy consumption of the 29 OECD
countries would allow for a reduction in CO2 emissions equivalent to just over 12% of USA
31 This budget covers the five years from 2023 - 2027 and commits the UK to a 50% reduction of CO2 emissions on 1990 emissions levels by 2025 (with a 34% emissions reduction by 2020). On this basis, emissions reductions by 2050 are targeted at 80% of 1990 levels. The carbon budgets sets out emissions targets for the UK as required under the Climate Change Act 2008.
0
5
10
15
20
25
30
35
40
45
50
China USA Russia India Japan Germany Canada UK Korea Iran
#

Measuring energy efficiency and its contribution towards meeting CO2 targets Page 28 of 36
CO2 emissions for the period 2003 – 2007 and about 5½% of the total average CO2 emissions
over the same period for the 29 OECD countries included in this study.
3.4 Beyond Kyoto
At UNFCCC meetings in Copenhagen (2009) and again in Cancun (2010) measures for
action beyond Kyoto started to take shape. A new round of more ambitious commitments has
been sort from countries party to the Kyoto agreement and those that operated outside the
agreement. The commitments of the top emitters are presented in Figure 8.
For the majority of the 29 OECD countries analysed improvements in efficiency of energy
consumption alone were not sufficient to meet emissions targets. Of the top 10 emitters, the
US, Japan, Canada and South Korea were over target, Germany under target and the UK is
over target but energy efficiency would have put the UK under target. Therefore
championing energy efficiency policies alone will be unlikely to yield the target results.
Indeed the common target across the EU of a reduction of 8% on 1990 emission levels
appears to have been relatively easily attainable for the likes of a number of EU countries
including Germany, but not others. There are the six notable exceptions (as shown in Figure
6) where improvements in efficiency of energy consumption alone were, and are likely to be,
the difference between meeting the emissions target and not. In the UK, the results suggest
that without any adjustment to the fuel mix employed, but with only increases in the
efficiency of energy consumption the Kyoto targets should be within reach.

Measuring energy efficiency and its contribution towards meeting CO2 targets Page 29 of 36
Figure 8: 2020 Emission Reduction Targets of Top 10 OECD emitters 2007, 2010
Note: Solid lines represents emission targets Dashed line represents actual CO2 emissions Dotted line represents the estimated efficient level of CO2 emissions
As national governments face up to their environmental obligations and consider the most
appropriate measures to take beyond Kyoto (2008 – 2012)32, they has been guided by the text
32 They must consider the relative roles of improvements in efficiency of energy consumption as one means of reducing energy consumption or the alternative options of reducing carbon emitted per unit of energy by the fuel mix employed so as to be able to maintain and grow economic output.

Measuring energy efficiency and its contribution towards meeting CO2 targets Page 30 of 36
of the Cancun documentation (December 2010) which suggested that countries could either
cut emissions by a specified percentage or simply implement their chosen target without
regard as to how ambitious it might be nationally. The formation of regional arrangements
via ‘coalitions of the willing’ was the suggested way forward. It was on this basis that the
2020 emissions targets set out in Figure 8 were made. In all instances it would seem that
energy efficiency measures alone will be insufficient to meet CO2 emissions targets and a
mix of policy initiatives as suggested by the IEA (2008) is necessary to achieve the targets set
out.
It might have been expected that the negotiations at the UNFCCC meetings in Durban, South
Africa in December 2011 would continue towards voluntary national climate commitments in
line with the Bali Action Plan and the agreements made in Copenhagen and Cancun.
However, the Durban Platform raises the stakes by refocusing countries on the negotiation of
a legally binding agreement to be in place by 2020 (UNFCCC, 2011). To this end the EU has
promised to register existing emissions pledges under the extended protocol33 as have a
number of other countries.34 In conjunction with these measures progress was also made
towards establishing a Green Climate Fund to help developing countries meet their emissions
reduction commitments.
33 The European Commission’s Roadmap of March 2011 sets out a pathway to reach the EU’s objective of cutting greenhouse gas emissions by 80-95% of 1990 levels by 2050. In conjunction with the Roadmap a European Energy Efficiency Plan has also been set out (EC, 2011). The Roadmap suggests that the most cost effective way of achieving the 2050 target, requires a 25% emissions cut by 2020 (5 % higher than current European targets) via domestic measures because by 2050 it is predicted that international credits for offsetting emissions will be less available. The Efficiency Plan is a set of proposed measures aimed at creating benefits for households and businesses through lowered emissions targets of 20% improvement in energy efficiency go some way to meeting the reduction targets set out by the Roadmap. The impact of the Energy Efficiency Plan will be reviewed in 2013 and legally binding targets introduced if insufficient progress has been made towards the Roadmap targets.
34 Brazil, South Africa, China and the US have indicated that they would accept binding commitments under a new treaty. India is holding to the position of the original 1992 Framework Convention on Climate Change, which stated that countries have “common but differentiated responsibilities”. Canada, however, has been unable to meet its Kyoto commitments, and announced on 12 December 2011 that it would formally withdraw from the protocol (UNFCCC, 2011).

Measuring energy efficiency and its contribution towards meeting CO2 targets Page 31 of 36
4. Conclusions
The details of the proposed new treaty envisioned under the Durban Platform are to be
determined over the coming years. The contribution of energy efficiency to emissions
reductions targets found here suggests that the terms of the treaty need to be carefully
negotiated so as to ensure that national governments are given the appropriate incentives to
ensure not only that national emissions target are ambitious but that energy efficiency
improvements make the optimal contribution towards such emissions reduction targets.
This paper attempts to estimate a panel ‘frontier’ whole economy aggregate energy demand
function for 29 countries over the period 1978 to 2006 using parametric stochastic frontier
analysis (SFA). Consequently, unlike standard energy demand econometric estimation, the
energy efficiency of each country is also modelled and it is argued that this represents a
measure of the underlying efficiency for each country over time, as well as the relative
efficiency across the 29 OECD countries.35 This shows that energy intensity is not necessarily
a good indicator of energy efficiency, whereas by controlling for a range of economic and
other factors, the measure of energy efficiency obtained via this approach is. This is
particularly relevant in a world dominated by environmental concerns with the subsequent
need to conserve energy and/or use it as efficiently as possible. Moreover, the results show
that although for a number of countries the change in energy intensity over time might give a
reasonable indication of efficiency improvements; this is not always the case. Therefore,
unless this analysis is undertaken, it is not possible to know whether the energy intensity of a
country is a good proxy for energy efficiency or not. Hence, it is argued that this analysis
should be undertaken to avoid potentially misleading advice to policy makers.
35 It should be noted that the estimated underlying energy efficiency and associated potential CO2 savings for each country should not be taken as precise values given the stochastic technique used for the estimation. However, they do give a good approximation of each country’s direction of change in efficiency and CO2 emissions over time.

Measuring energy efficiency and its contribution towards meeting CO2 targets Page 32 of 36
As national governments face up to their environmental obligations and participate in the
negotiation of the new legally binding treaty to replace the Kyoto Agreement beyond 2020
they must ensure that the legally binding emission reduction targets are nationally
challenging, requiring energy efficiency improvement as well as other measures to meet the
target. The results presented here suggest that due in part to different levels of energy
efficiency that common targets amongst neighbours will significantly challenge some
countries, whilst being easily met (and in some cases exceeded) by others. For the majority of
the 29 OECD countries analysed improvements in efficiency of energy consumption alone
were not sufficient to meet emissions targets. Therefore, whilst important, championing
energy efficiency policies alone will be unlikely to yield the target results.36
As shown, the common 8% emissions reduction target on 1990 emission levels applicable to
many of the EU member states appears to have been relatively easily attainable for a number
of EU countries including Germany, but not for others. There are however, six countries
within our sample, where improvements in efficiency of energy consumption alone could
have made the difference between meeting the emissions target and not. Further, for the UK,
it suggests that increases in the efficiency of energy consumption alone should be enough to
meet the Kyoto targets, even without any adjustment to the fuel mix employed. Therefore a
uniform reduction target; of the same fixed percentage of a given year’s CO2 emissions for all
countries is not likely to produce the most efficient outcome, indeed for some countries the
36 This is consistent with the IEA findings that while energy efficiency is still important in limiting increases in energy use in IEA countries the rate of energy efficiency improvement since 1990 has been slower than previously and will need to speed up to make a more significant contribution; this is possible with energy efficiency measures improvements in buildings, industry and transport but government action is necessary in conjunction with the market mechanism for the deployment of energy efficiency technologies. IEA (2008) Energy Technology Perspectives 2008. In 2008 the IEA presented a list of high priority energy efficiency policy recommendations.

Measuring energy efficiency and its contribution towards meeting CO2 targets Page 33 of 36
target set on this basis will be too ambitious (and not realistically attainable) while for others
not challenging enough to incentivise the drive for optimal energy efficiency.
Instead the legally binding requirements of the treaty could usefully include national
emissions reduction targets which are determined in two parts. The first part of the target
should be calculated on the basis of desirable national energy efficiency improvements,
which could be specified in the treaty. That is, the first part of the target should determine the
emissions reductions possible when each nation is energy efficient. Beyond this, the second
part of the target could require emissions reductions via additional measures and might
indeed be set as a flat rate reduction target or on a sliding scale (to accommodate developing
countries). Such a measure would ensure that each nation had a challenging emissions
reduction target and the incentive to improve both energy efficiency and undertake other
measures to reduce CO2 emissions. Our results suggest that measure to improve energy
efficiency alone have been and therefore are likely to continue to be insufficient to meet CO2
emissions targets and therefore a mix of policy initiatives will be required to achieve the
emissions reductions levels necessary.
Measuring energy efficiency and its contribution towards meeting CO2 targets Page 34 of 36
References Adeyemi, O. I. and L. C. Hunt (2007) “Modelling OECD industrial energy demand: asymmetric price responses and energy-saving technical change,” Energy Economics, 29(4): 693–709.
Aigner, D. J., C. A. K. Lovell and P. Schmidt (1977) “Formulation and Estimation of Stochastic Frontier Production Function Models,” Journal of Econometrics, 6(1): 21–37.
Ang B. W (2006) Monitoring changes in economy-wide energy efficiency: From energy–GDP ratio to composite efficiency index, Energy Policy 34, pp. 574–582.
Battese, G. E. and T. J. Coelli (1992) Frontier production functions, technical efficiency and panel data: With application to paddy farmers in India. Journal of Productivity Analysis 3 (1/2), pp. 153 – 169.
EC (2005) Doing more with less: Green paper on energy efficiency Luxembourg: Office for Official Publications of the European Communities, European Commission, 2005.
EC(2006a) ‘A European strategy for a reliable, competitive and sustainable energy supply’ Green Paper, European Commission, {SEC(2006) 317}, COM(2006) 105 final, March.
EC(2006b) Action Plan for Energy Efficiency: Realising potential. Communication from the Commission COM(2006)545 final, European Commission, {SEC(2006)1173} {SEC(2006)1174} {SEC(2006)1175}, October.
EC (2011) A Roadmap for moving to a competitive low carbon economy in 2050. Communication from the Commission to the European Parliament, The Council, The European Economic and Social Committee and the Committee of the Regions, COM (2011)112 final, European Commission , {SEC(2011) 287 final} {SEC(2011) 288 final} {SEC(2011) 289 final}, March.
Farsi, M., M. Filippini and W. Greene (2005) “Efficiency Measurement in Network Industries: Application to the Swiss Railway Companies,” Journal of Regulatory Economics, 28(1): 69–90.
Farsi, M., M. Filippini and M. Kuenzle (2006) “Cost Efficiency in Regional Bus Companies: An Application of Alternative Stochastic Frontier Models,” Journal of Transport Economics and Policy, 40(1): 95–118.
Ferrier, G.D. and J.G. Hirschberg (1992) Climate control efficiency. The Energy Journal, 13, pp. 37 -54.
Filippini, M. & L. C. Hunt (2011a) ‘Energy demand and energy efficiency in the OECD countries: a stochastic demand frontier approach’, The Energy Journal, 32 (2); pp. 59-80.
Filippini, M. & L. C. Hunt (2011b) ‘USA Total Energy Demand and Energy Efficiency: A Stochastic Demand Frontier Approach’, Center for Energy Policy and Economics (cepe) Working Paper, ETH Zürich, Switzerland, forthcoming.
Greene, W. H. (2005a) “Reconsidering Heterogeneity in Panel Data Estimators of the Stochastic Frontier Model,” Journal of Econometrics, 126: 269–303.
Measuring energy efficiency and its contribution towards meeting CO2 targets Page 35 of 36
Greene, W. H. (2005b) “Fixed and random effects in stochastic frontier models,” Journal of Productivity Analysis, 23(1): 7–32.
Griffin J. M. and C. T. Schulman (2005) “Price asymmetry in energy demand models: A proxy for energy-saving technical change?” The Energy Journal, 26(2), pp. 1–21.
HM Government (2011) Implementing the Climate Change Act 2008: The Government's proposal for setting the fourth carbon budget. Policy Statement, May 2011, available at http://www.decc.gov.uk/emissions/carbonbudgets.
Hunt, L. C., G. Judge and Y. Ninomiya (2003a) “Underlying trends and seasonality in UK energy demand: a sectoral analysis,” Energy Economics, 25(1): 93–118.
Hunt, L. C., G. Judge and Y. Ninomiya (2003b) “Modelling underlying energy demand trends,” Chapter 9 in: Hunt, L. C. (Ed.), Energy in a Competitive Market: Essays in Honour of Colin Robinson, Cheltenham, UK; Edward Elgar, pp. 140–174.
Huntington, H. G. (1994) Been top down so long its looks like up to me. Energy Policy, 22, pp.833 – 839.
IEA (2007) IEA Energy Efficiency Policy Recommendations to the G8 2007 Summit, Heiligendamm, http://www.iea.org/g8/docs/final_recommendations_heiligendamm.pdf
IEA (2008) Energy Efficiency Policy Recommendations In support of the G8 Action Plan, Paris, available at www.iea.org.
IEA (2009) “Progress with implementing energy efficiency policies in the G8,” International Energy Agency Paper, available at
http://www.iea.org/Textbase/publications/free_new_Desc.asp?PUBS_ID_2127
IEA (2010a): Energy Statistics available at www.iea.org.
IEA (2010b): Energy Balances and Energy Statistics of OECD Countries, International Energy Agency (Edition: 2010). ESDS International, University of Manchester.
IEA (2010c) CO2 Emissions From Fuel Combustion: International Energy Agency, (Edition 2010) ESDS International, University of Manchester.
IEA Scorecard 2011 Implementing energy efficiency policy: Progress and challenges in IEA member countries, OECD/IEA, www.iea.org.
IPCC (2007): Climate Change 2007: Synthesis Report. Contribution of Working Groups I, II and III to the Fourth Assessment Report of the Intergovernmental Panel on Climate Change [Core Writing Team, Pachauri, R.K and Reisinger, A. (eds.)]. IPCC, Geneva, Switzerland, 104 pp.
Jondrow, J., C. A. K. Lovell, I. S., Materov and P. Schmidt (1982) “On the Estimation of Technical Efficiency in the Stochastic Frontier Production Function Model,” Journal of Econometrics, 19(2/3): 233–238.

Measuring energy efficiency and its contribution towards meeting CO2 targets Page 36 of 36
Kumbhakar S. C. and C. A. Lovell (2000) Stochastic frontier analysis, Cambridge: Cambridge University Press.
Medlock, K. B. (2004) Economics of energy demand. Encyclopedia of Energy, 2, pp. 65–78.
Metcalf, G. E. (2008) An empirical analysis of energy intensity and its determinants at the state level. The Energy Journal 29, pp. 1–26.
Peel, M. C., B. L. Finlayson and T. A. and B. L. McMahon (2007) “Updated world map of the Köppen-Geiger climate classification”. Hydrology and Earth System Sciences, 11: 1633–1644.
Richmond, A. K. and Kaufmann, R. K. (2006) Energy prices and turning points: the relationship between income and energy use/carbon emissions. The Energy Journal 27, pp. 157–178.
Sue Wing, I. (2008). Explaining the Declining Energy Intensity of the U.S. Economy, Resource and Energy Economics, 30: 21–49.
United Nations (1992) UN Framework Convention on Climate Change (UNFCCC), New York, United Nations.
UNFCCC (2010) Communications received from Parties in relation to the listing in the chapeau of the Copenhagen Accord. Appendix I - Quantified economy-wide emissions targets for 2020 available at http://unfccc.int/meetings/copenhagen_dec_2009/items/5264.php
UNFCCC (2011) Establishment of an Ad Hoc Working Group on the Durban Platform for Enhanced Action. Advanced unedited version, Draft decision -/CP.17, available at http://unfccc.int/files/meetings/durban_nov_2011/decisions/application/pdf/cop17_durbanplatform.pdf. Accessed 16 December 2011.
UNSD (2009) Millennium Development Goals Indicators Database, UN, Department of Economic and Social Affairs, Population Division, World Population Prospects: The 2008 Revision, New York, 2009, UNSD Demographic Yearbook, available at: http://mdgs.un.org/unsd/mdg/Data.aspx.
Zhou, P., B.W. Ang and K. L. Poh (2008) “A survey of data envelopment analysis in energy and environmental studies.” European Journal of Operational Research 189: 1–18.
Zofio J.L. and A.M. Prieto (2001) “Environmental efficiency and regulatory standards: the case of CO2 emissions from OECD industries,” Resource and Energy Economics, 23: 63–83.

Note:
This paper may not be quoted or reproduced without permission
Surrey Energy Economics Centre (SEEC)
School of Economics
University of Surrey
Guildford
Surrey GU2 7XH

SURREY
ENERGY
ECONOMICS
DISCUSSION PAPER
SERIES
For further information about SEEC please go to:
www.seec.surrey.ac.uk