measuring employment in the tourism industries...
TRANSCRIPT

Measuring Employment
in the Tourism Industries
Beyond the Tourism Satellite Account:
The Canadian Experience
Scott Meis
Special Advisor
CTHRC
7th UNWTO/PATA Forum on TOURISM TRENDS
AND OUTLOOK
Guilin, China
October 22-23, 2013

INTRODUCTION
Context: ILO-UNWTO Perspective
One of the most dynamic and beneficial modern sectors of economic activity
Recent advances in the macro-economic measurement of tourism
Insufficient and inadequate study of employment and the economic value of labor
ILO-UWWTO Partnership Agreement
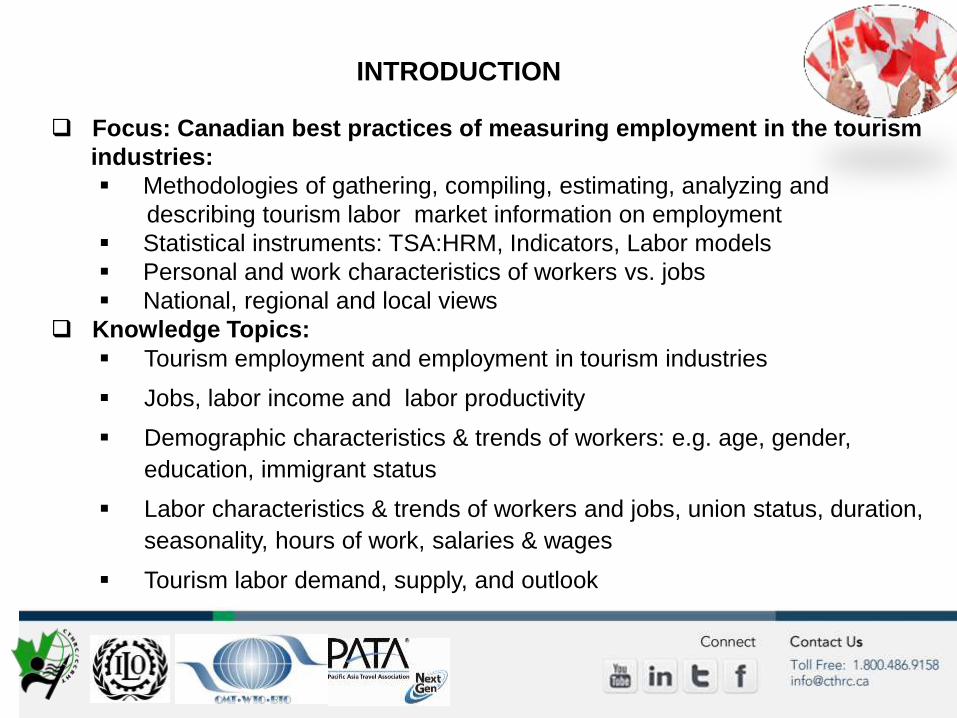
INTRODUCTION
Focus: Canadian best practices of measuring employment in the tourism
industries:
Methodologies of gathering, compiling, estimating, analyzing and
describing tourism labor market information on employment
Statistical instruments: TSA:HRM, Indicators, Labor models
Personal and work characteristics of workers vs. jobs
National, regional and local views
Knowledge Topics:
Tourism employment and employment in tourism industries
Jobs, labor income and labor productivity
Demographic characteristics & trends of workers: e.g. age, gender,
education, immigrant status
Labor characteristics & trends of workers and jobs, union status, duration,
seasonality, hours of work, salaries & wages
Tourism labor demand, supply, and outlook

Celebrating more than 125 years of tourism development
2011 Federal Tourism Strategy: Welcoming the World
recognizes importance of fostering an adequate supply of skills & labor
to enhance visitor experiences through quality service and hospitality
ABOUT CANADA

CANADIAN TOURISM HUMAN RESOURCE COUNCIL (CTHRC)
Employees
Government Education
Industry
Associations
Human Resource Organization Partners in all provinces & territories
Employers

1993 TOURISM LABOUR POLICY ISSUES / CHALLENGES
Lack of definition and recognition of the sector
Lack of measurement of a sector-specific labor force
Conflicting numbers
Loose labor markets
Poor image of tourism jobs and careers
Image of low skill and pay levels
Low attractiveness to labor
Lack of a training culture
Labor retention

0.8 1.5
2.1 2.7
3.1 2.8
2.9 3.1
3.3 3.4 3.3
3 2.9
3 2.9 2.9 2.8
2.6
0,5 1,1
1,8 2,4
2,9 3,1
2,9 2,9
3,1 3,3 3,4
3,3 3
2,8 2,8 2,8
2,7 2,7
2,5
5 3 1 1 3 5
100+95-9990-9485-8980-8475-7970-7465-6960-6455-5950-5445-4940-4435-3930-3425-2920-2415-1910-14
5-90-4
MaleFem…
2031
2013 TOURISM LABOUR POLICY ISSUES / CHALLENGES
Percentage of Population by Age Group
Feasibility Study
TSA
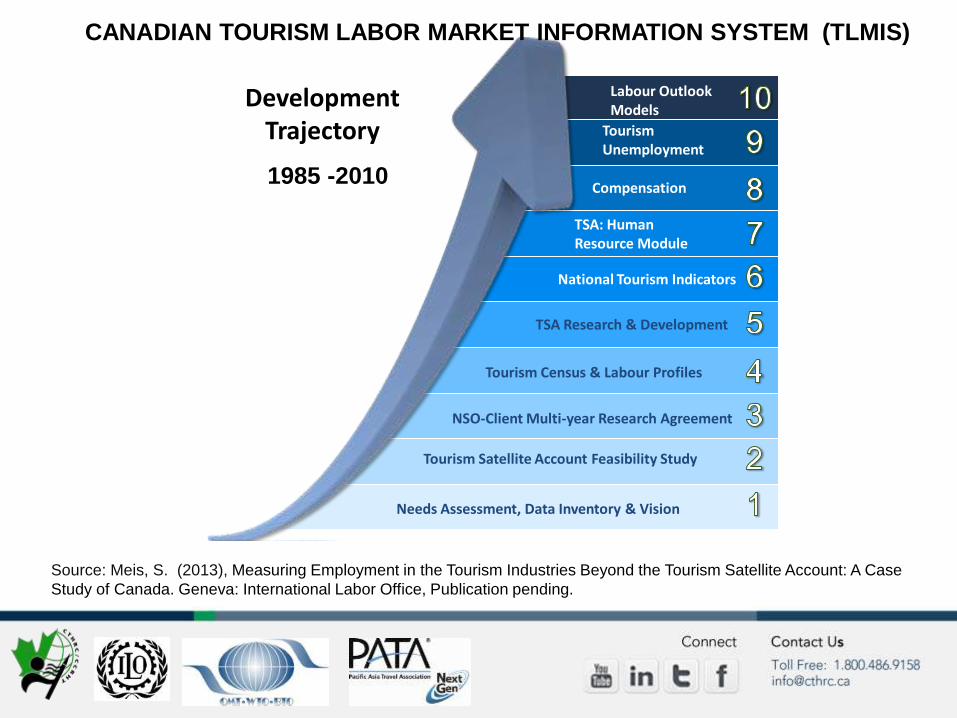
Development Trajectory
Labour Outlook Models
Tourism Unemployment
Compensation
TSA: Human Resource Module
National Tourism Indicators
TSA Research & Development
Tourism Census & Labour Profiles
NSO-Client Multi-year Research Agreement
Needs Assessment, Data Inventory & Vision
Tourism Satellite Account Feasibility Study
CANADIAN TOURISM LABOR MARKET INFORMATION SYSTEM (TLMIS)
1985 -2010
Source: Meis, S. (2013), Measuring Employment in the Tourism Industries Beyond the Tourism Satellite Account: A Case
Study of Canada. Geneva: International Labor Office, Publication pending.
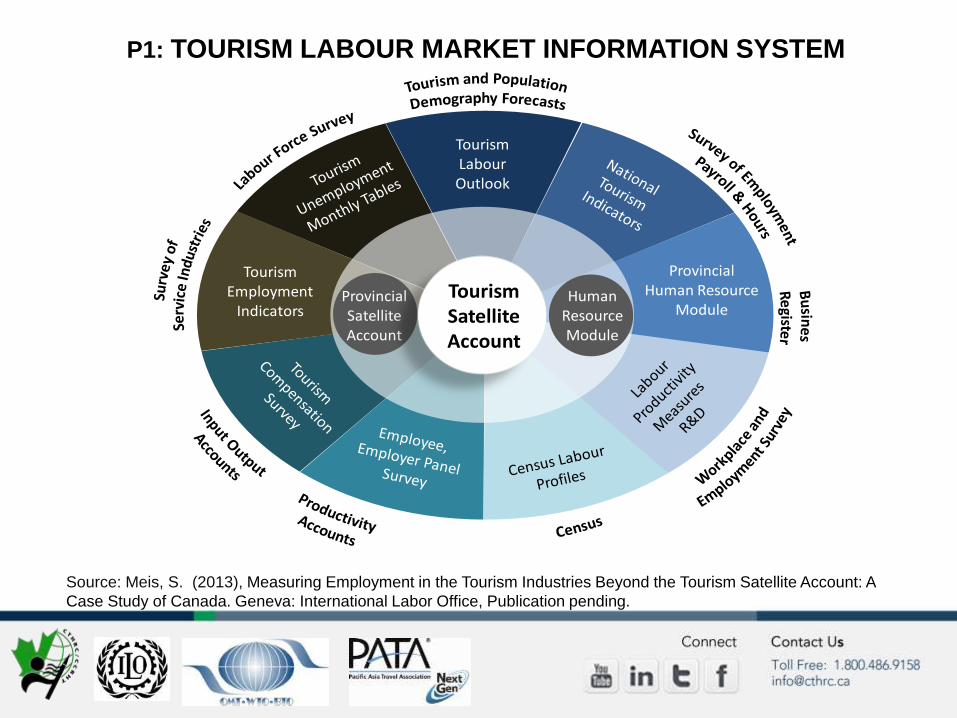
Tourism Labour Outlook
Tourism Employment
Indicators
Provincial Human Resource
ModuleProvincial Satellite Account
Tourism Satellite Account
Human Resource Module
P1: TOURISM LABOUR MARKET INFORMATION SYSTEM
Source: Meis, S. (2013), Measuring Employment in the Tourism Industries Beyond the Tourism Satellite Account: A
Case Study of Canada. Geneva: International Labor Office, Publication pending.

29 TOURISM INDUSTRIES, 5 INDUSTRY GROUPS
Accommodations 7211 Traveller accommodation
7212 RV (Recreational Vehicle) Parks and
Recreational Camps
Food & Beverage Services 7221 Full-service restaurants
7222 Limited-service eating places
7224 Drinking places (alcoholic beverages)
Recreation & Entertainment 5121 Motion pictures and video industries
7111 Performing arts companies
7112 Spectator sports
7115 Independent artists, writers and performers
7121 Heritage institutions
7131 Amusement parks and arcades
7132 Gambling industries
7139 Other amusement and recreation industries
Transportation 4811 Scheduled air transportation
4812 Non-scheduled air transportation
4821 Rail transportation
4831 Deep sea, coastal and great lakes water
transportation
4832 In-land water transportation
4851 Urban transportation systems
4852 Interurban and rural bus transportation
4853 Taxi and limo service
4854 School and employee bus transportation
4855 Charter bus industry
4859 Other transit and ground passenger transportation
4871 Scenic and sightseeing transportation, land
4872 Scenic and sightseeing transportation, water
4879 Scenic and sightseeing transportation, other
5321 Automotive equipment rental and leasing
Travel Services 5615 Travel arrangement and reservation services
Source: Based on the Canadian Tourism Satellite Account and
the North American Industry Classification System (NAICS)

REGIONAL & LOCAL SHARES OF TOURISM WORK FORCE JOBS
Municipality Tourism Sector
Accomm F&B Rec &
Ent Transport
Travel Services
St. John’s 0.5% 0.6% 0.5% 0.5% 0.6% 0.5% Halifax 1.4% 1.4% 1.3% 1.3% 1.5% 1.5% Québec 2.2% 2.9% 2.4% 1.9% 1.8% 1.9%
Montréal 11.6% 6.9% 11.0% 13.2% 14.1% 14.6%
Ottawa 3.3% 2.7% 3.5% 3.6% 2.9% 3.6%
Toronto 15.6% 10.1% 14.6% 17.9% 17.7% 23.7%
Winnipeg 2.5% 2.4% 2.4% 2.3% 3.4% 1.8%
Saskatoon 0.8% 1.0% 0.9% 0.6% 0.7% 0.4%
Calgary 4.2% 3.0% 4.1% 3.9% 5.9% 3.5%
Edmonton 3.4% 3.0% 3.7% 3.1% 3.3% 3.3%
Vancouver 8.9% 7.1% 8.6% 9.6% 9.2% 13.8%
11.2%
16.4%
2.8%
22.0% 1.1%
0.4%
2.6% 1.9%
37.6%
3.6%
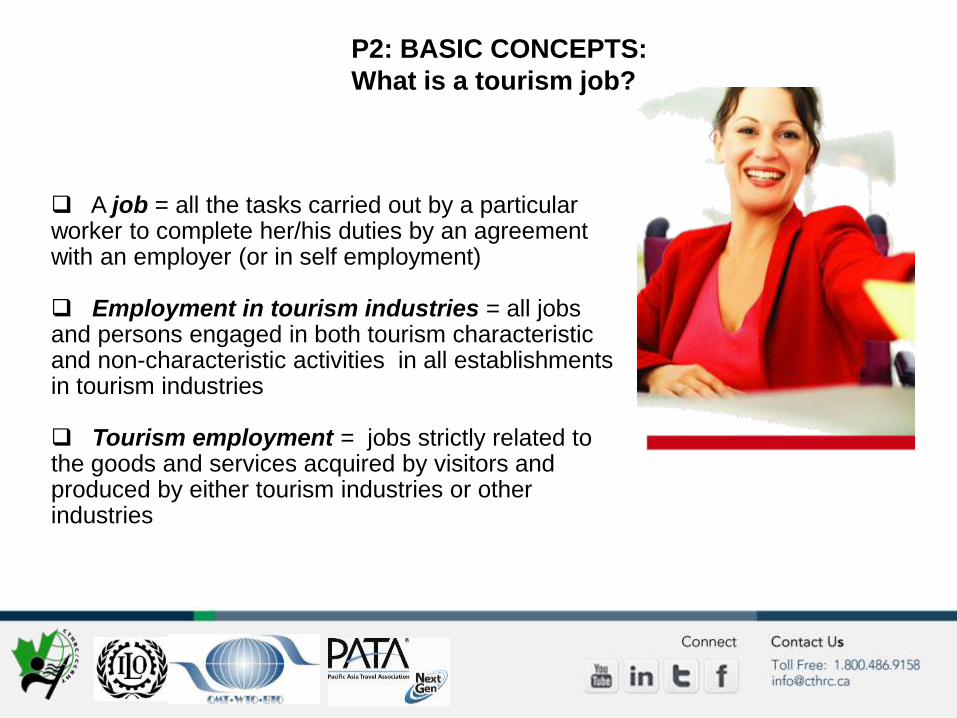
P2: BASIC CONCEPTS:
What is a tourism job?
A job = all the tasks carried out by a particular worker to complete her/his duties by an agreement with an employer (or in self employment) Employment in tourism industries = all jobs and persons engaged in both tourism characteristic and non-characteristic activities in all establishments in tourism industries
Tourism employment = jobs strictly related to the goods and services acquired by visitors and produced by either tourism industries or other industries


1.7 MILLION JOBS IN TOURISM INDUSTRIES 600,000 jobs due to tourism demand
0
200
400
600
800
1.000
1.200
1.400
1.600
1.800
1997 1998 1999 2000 2001 2002 2003 2004 2005 2006 2007 2008 2009 2010 2011 2012
tho
usa
nd
s o
f jo
bs
Employment in tourism industries versus direct tourism employment, Canada, 1997 to 2012
Employment in tourism industries
Direct tourism employment in tourism industries
Direct tourism employment
Source: Meis, S. (2013), Measuring Employment in the Tourism Industries Beyond the Tourism Satellite Account: A Case
Study of Canada. Geneva: International Labor Office, Publication pending.

47.9%
21.7%
16.4%
11.2%
2.9%
Food & Beverage Services
Recreation & Enterainment
Transportation
Accomodation
Travel Services
31.8%
13.3%
13.6%
33.3%
8.0%Food & Beverage Services
Recreation & Enterainment
Transportation
Accomodation
Travel Services
% Persons employed in tourism industry groups (2006) % Tourism employment in tourism industry groups ( 2006)
SHARES OF PERSONS EMPLOYED AND TOURISM EMPLOYMENT BY INDUSTRY GROUP IN TOURISM WORK FORCE
Source: Meis, S. (2013), Measuring Employment in the Tourism Industries Beyond the Tourism Satellite Account: A Case
Study of Canada. Geneva: International Labor Office, Publication pending.
Travel
Services 3% Transportati
on 13%
Accomo-
dation 14%
Recreation &
Entertainm
ent 17%
Food & Beverage Services
54%
Percentage distribution of jobs in tourism industry groups (2012)
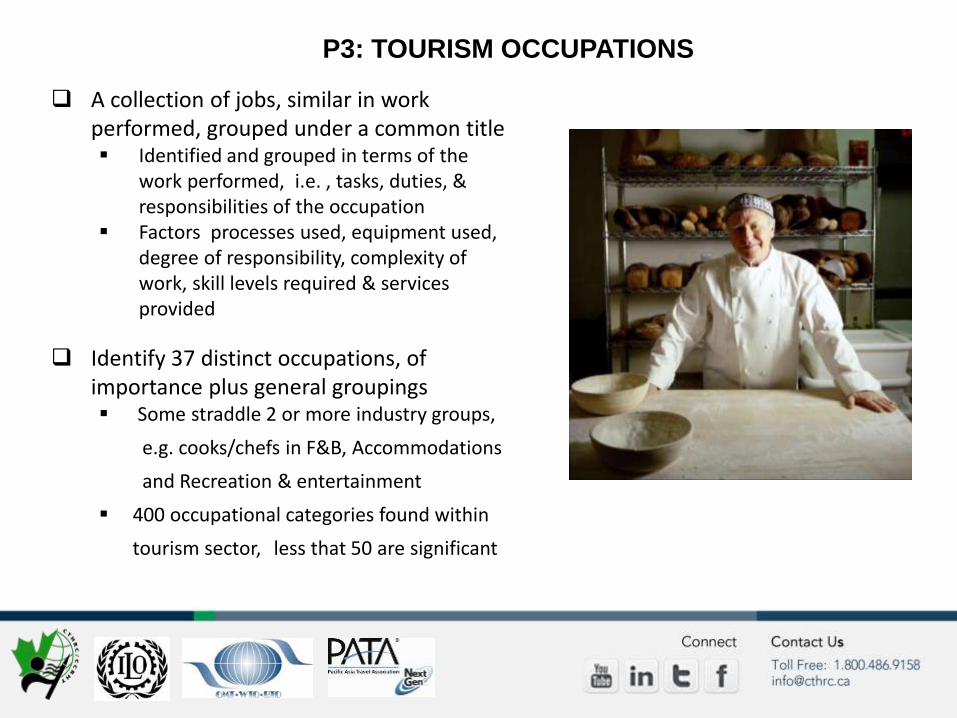
P3: TOURISM OCCUPATIONS
A collection of jobs, similar in work performed, grouped under a common title Identified and grouped in terms of the
work performed, i.e. , tasks, duties, & responsibilities of the occupation
Factors processes used, equipment used, degree of responsibility, complexity of work, skill levels required & services provided
Identify 37 distinct occupations, of importance plus general groupings Some straddle 2 or more industry groups,
e.g. cooks/chefs in F&B, Accommodations
and Recreation & entertainment
400 occupational categories found within
tourism sector, less that 50 are significant

Demand Trip Visitor
Pu
rpose
Du
rati
on
Dis
tan
ce
P
art
y si
ze
E
xpen
dit
ure
Sou
rce
Per
son
al
H
ou
seh
old
L
oca
tion
Accommodation Transportation F&B services R&E Services
Su
pp
ly
Travel Services
$
$ Other
$
$ $
$
P4: SATELLITE ACCOUNT VIEW OF TOURISM EMPLOYMENT 2006
Tourism contribution to jobs: 3.9% of all
jobs in Canada in 2006 with 80% of all
attributable jobs provided in tourism
industries
606,500 attributable jobs in 2006 with 483,000
provided to tourism industries
Tourism’s contribution labour income:
2.2% of all returns to labour in the Canadian
economy, $16.6 billion in labour income
Labour compensation per job: $26,900 in
labour compensation per attributable job in
tourism industries in 2006
Tourism labour productivity: almost 50%
of the average GDP per job level of the
overall economy, at $39,700 in Tourism
GDP per TI job
Tourism GDP Ratio
Accommodation………………………..62.3
Food and Beverage……………………17.2
Recreation & Entertainment……..19.5
Travel Services …………………………88.8
Transportation ………………………. 29.5

2006
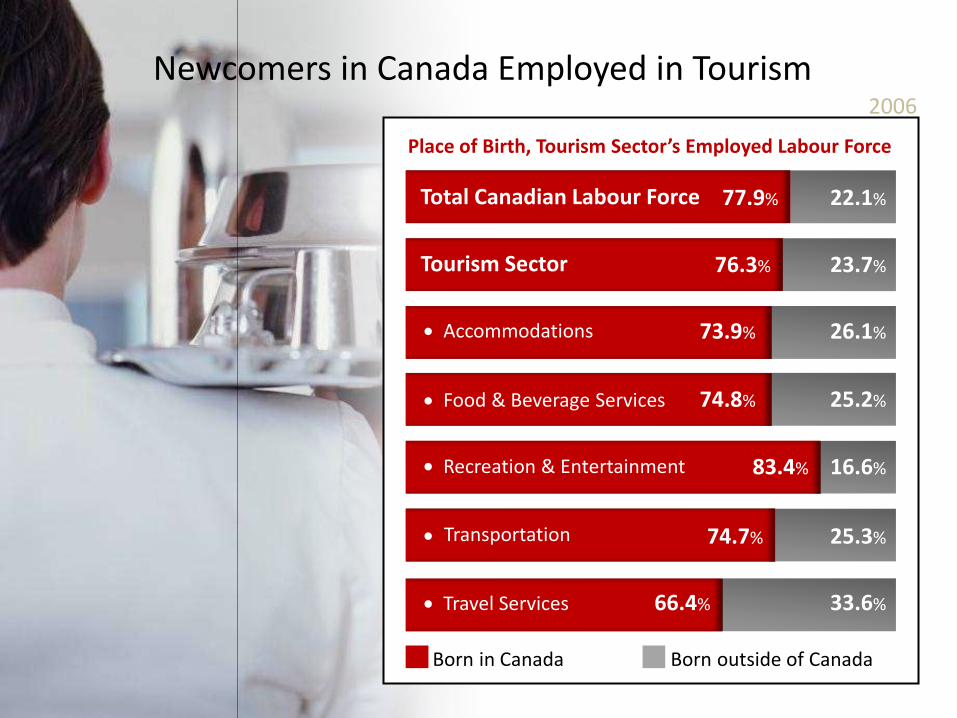
22%
26%
26%
30%
27%
16%
38%
22%
20%
22%
21%
19%
16%
31%
Born Outside of Canada
CANADA
TOURISM
Accommodations
Food & Beverage Services
Transportation
Recreation & Entertainment
Travel Services
77.9%
76.3%
73.9%
74.8%
83.4%
74.7%
66.4%
22.1%
23.7%
26.1%
25.2%
16.6%
25.3%
33.6%
Born in Canada Born outside of Canada
Place of Birth, Tourism Sector’s Employed Labour Force
2006
Newcomers in Canada Employed in Tourism
Total Canadian Labour Force
Tourism Sector
Accommodations
Food & Beverage Services
Transportation
Recreation & Entertainment
Travel Services
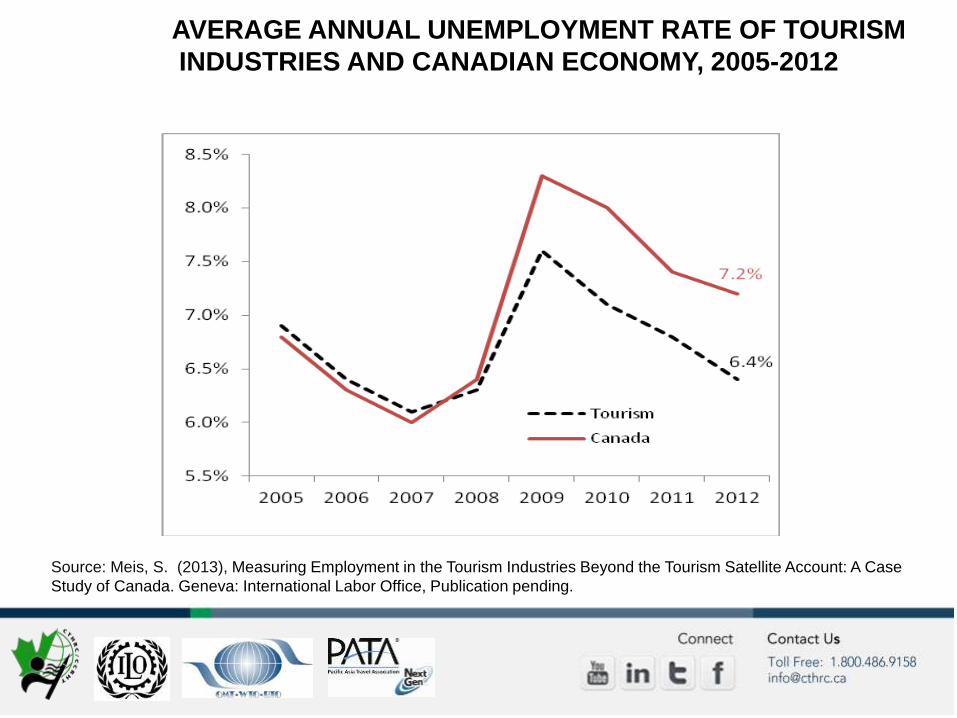
AVERAGE ANNUAL UNEMPLOYMENT RATE OF TOURISM
INDUSTRIES AND CANADIAN ECONOMY, 2005-2012
Source: Meis, S. (2013), Measuring Employment in the Tourism Industries Beyond the Tourism Satellite Account: A Case
Study of Canada. Geneva: International Labor Office, Publication pending.
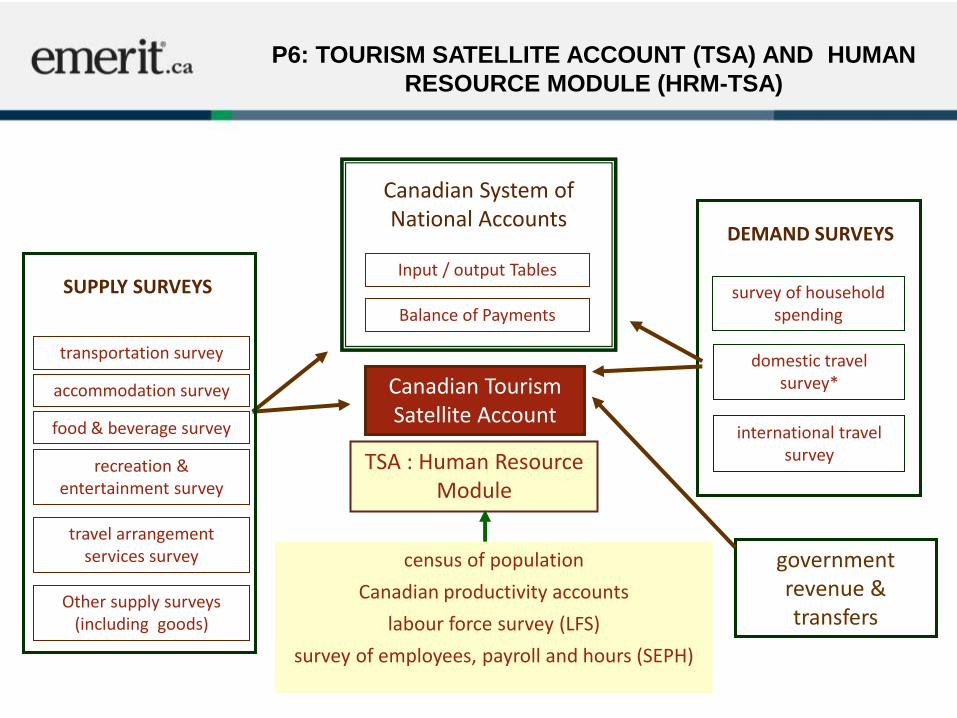
survey of household spending
domestic travel survey*
international travel survey
DEMAND SURVEYS
Canadian System of National Accounts
Input / output Tables
Canadian Tourism Satellite Account
government revenue & transfers
SUPPLY SURVEYS
transportation survey
accommodation survey
food & beverage survey
recreation & entertainment survey
travel arrangement services survey
Balance of Payments
Other supply surveys (including goods)
TSA : Human Resource Module
census of population
Canadian productivity accounts
labour force survey (LFS)
survey of employees, payroll and hours (SEPH)
P6: TOURISM SATELLITE ACCOUNT (TSA) AND HUMAN
RESOURCE MODULE (HRM-TSA)
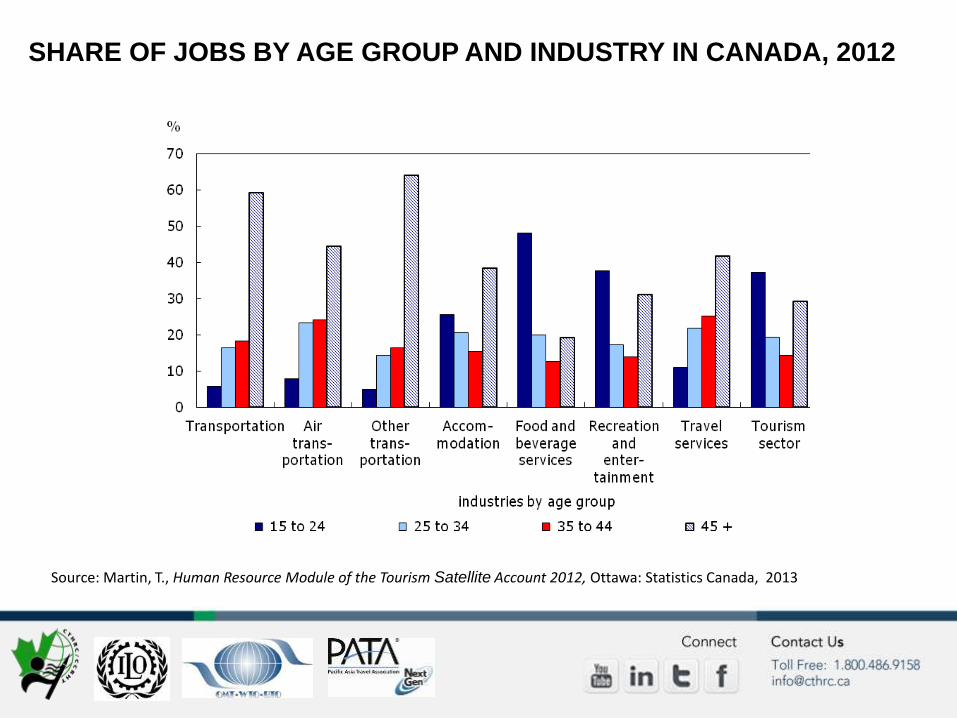
SHARE OF JOBS BY AGE GROUP AND INDUSTRY IN CANADA, 2012
Source: Martin, T., Human Resource Module of the Tourism Satellite Account 2012, Ottawa: Statistics Canada, 2013
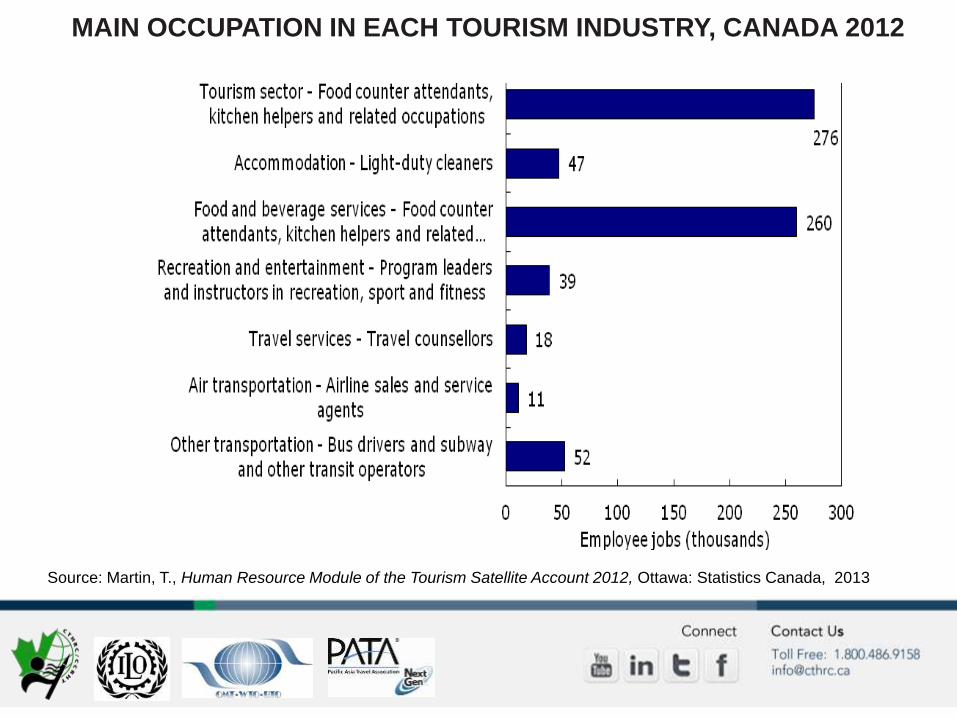
MAIN OCCUPATION IN EACH TOURISM INDUSTRY, CANADA 2012
Source: Martin, T., Human Resource Module of the Tourism Satellite Account 2012, Ottawa: Statistics Canada, 2013

ANNUAL COMPENSATION IN TOURISM INDUSTRIES IN CANADA, 2012
Source: Martin, T., Human Resource Module of the Tourism Satellite Account 2012, Ottawa: Statistics Canada, 2013
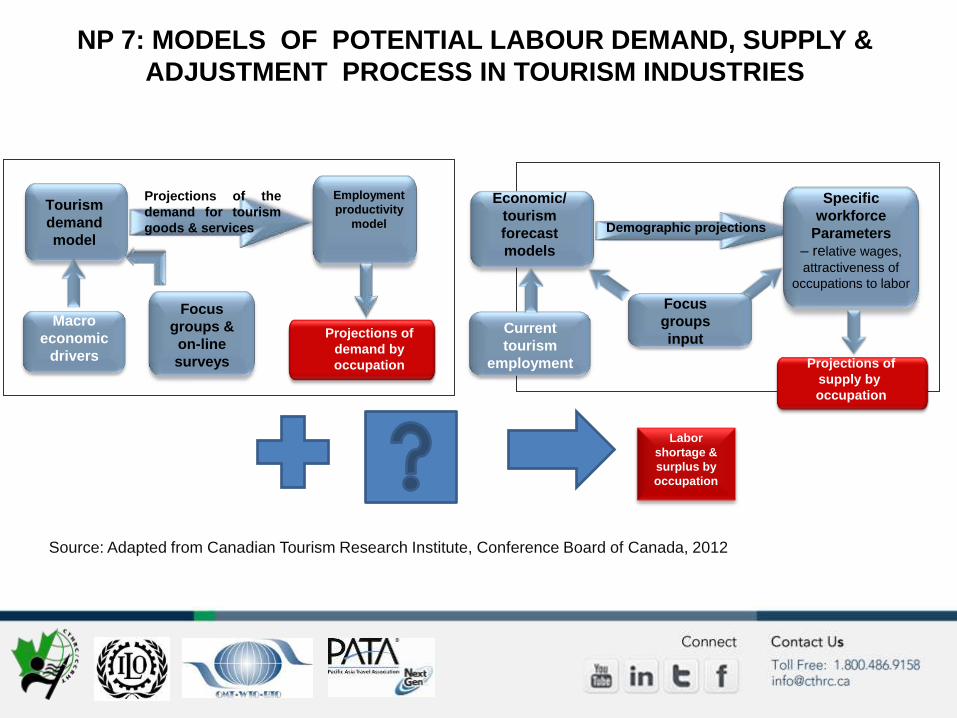
NP 7: MODELS OF POTENTIAL LABOUR DEMAND, SUPPLY &
ADJUSTMENT PROCESS IN TOURISM INDUSTRIES
Employment
productivity
model
Tourism
demand
model
Projections of
demand by
occupation
Projections of the
demand for tourism
goods & services
Macro
economic
drivers
Focus
groups &
on-line
surveys
Demographic projections
Specific
workforce
Parameters
– relative wages,
attractiveness of
occupations to labor
Projections of
supply by
occupation
Economic/
tourism
forecast
models
Current
tourism
employment
Focus
groups
input
Source: Adapted from Canadian Tourism Research Institute, Conference Board of Canada, 2012
Labor
shortage &
surplus by
occupation

Supply and Demand 228,500 Unfilled Jobs
Spending on tourism goods and services
$293 Billion (2030)
56%
Demand for Labour
Supply of Labour
Gap =
228,500 full-year jobs left unfilled
(10.7% of labour demand)
Source: Adapted from Canadian Tourism Research Institute, Conference Board of Canada, 2012

TOURISM LABOUR SHORTAGES BY OCCUPATION
2010 2015 2020 2025 2030
Food-counter attendants and kitchen helpers
-2,365 11,956 25,911 35,646 42,690
Food and beverage servers
-1,845 10,209 20,710 30,847 38,782
Cooks 92 5,465 12,540 16,496 20,536
Bartenders -277 2,321 5,003 7,394 8,738
Program leaders / instructors in recreation and sport
-415 813 2,574 4,737 6,267
Labor Shortages as a Percentage of
Labour Demandd 2030
Air Pilots, Flight Engineers and Flying Instructors 23.2%
Landscaping and Grounds Maintenance Labourers 21.1%
Bartenders* 20.7%
Security Guards and Related Occupations 18.0%
Aircraft Mechanics & Aircraft inspectors 15.7%
La
bo
r S
ho
rta
ge
s b
y
Oc
cu
pa
tio
n (
full
ye
ar
job
s)
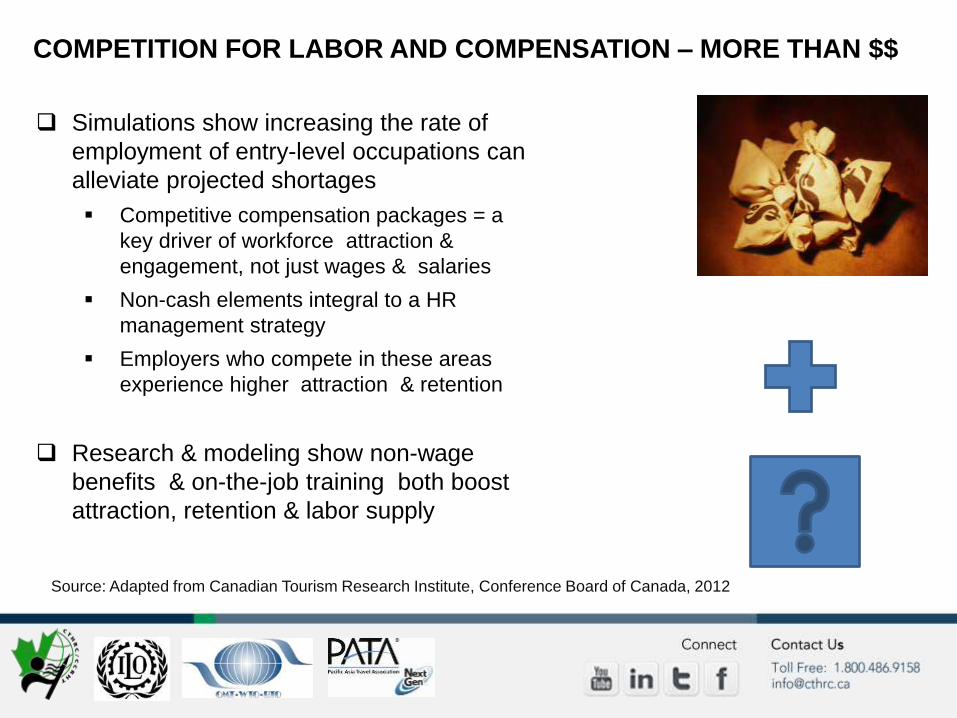
Simulations show increasing the rate of
employment of entry-level occupations can
alleviate projected shortages
Competitive compensation packages = a
key driver of workforce attraction &
engagement, not just wages & salaries
Non-cash elements integral to a HR
management strategy
Employers who compete in these areas
experience higher attraction & retention
Research & modeling show non-wage
benefits & on-the-job training both boost
attraction, retention & labor supply
COMPETITION FOR LABOR AND COMPENSATION – MORE THAN $$
Source: Adapted from Canadian Tourism Research Institute, Conference Board of Canada, 2012
CONCLUSION
Canada has developed a comprehensive set of practices and LMI products
measuring multiple aspects of employment in the tourism industries
Resolved past definitional and data compilation challenges and previous
information gaps
Developed new knowledge and industry information on employment in the
tourism industries, tourism workers and jobs
ILO recommends other countries following Canada’s path to developing a
comprehensive Tourism Labor Market Information System
New knowledge and current and relevant LMI has aided tourism labor
policy development and improved coordination and understanding among
stakeholders – industry, government, & academe
Still more to do – exploring new research topics!

Thank you for your interest & attention!
Are there any questions?
Thank You
Canadian Tourism Human Resource Council │www.cthrc.ca │613 231 6949