measuring customer satisfaction and · pdf file4.measure progress and impact of cmmi-based...
TRANSCRIPT

smi Software Metrics, Inc.
Measuring Customer Satisfaction and
Perceptions
Eighth Annual PSM Users’ Group Conference
Keystone, Colorado
26-30 July 2004
Page 2 smi Software Metrics, Inc.
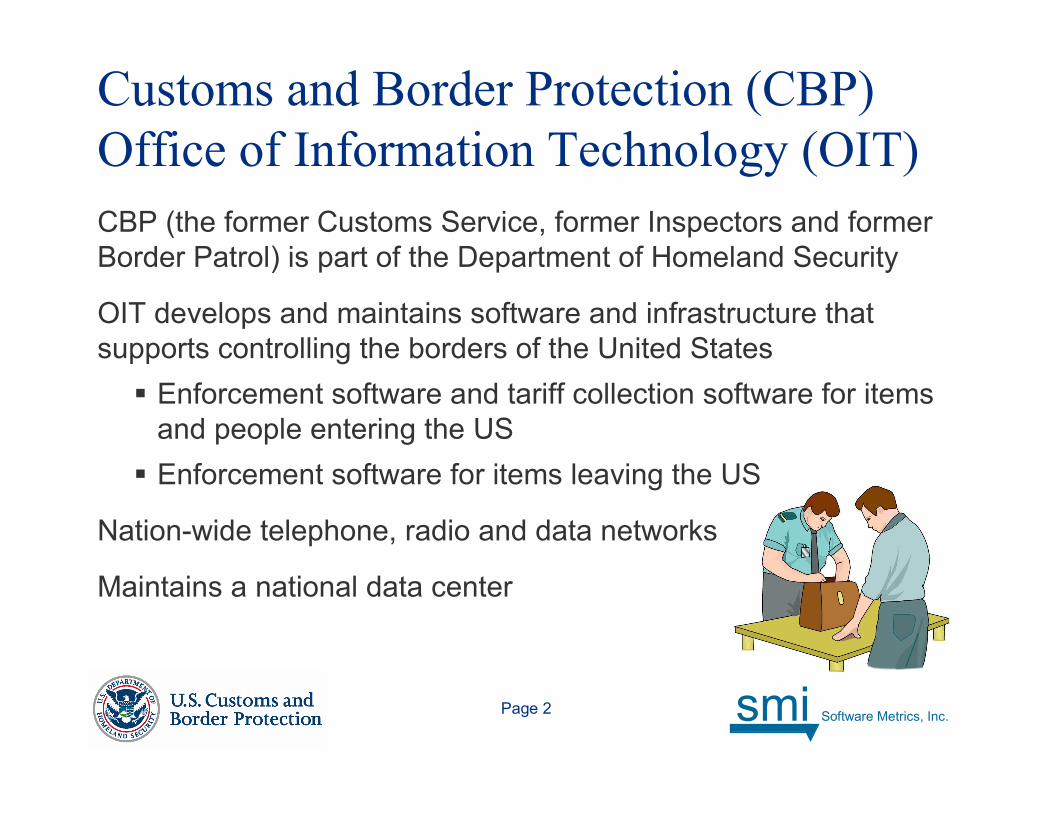
Customs and Border Protection (CBP)
Office of Information Technology (OIT)
CBP (the former Customs Service, former Inspectors and former
Border Patrol) is part of the Department of Homeland Security
OIT develops and maintains software and infrastructure that
supports controlling the borders of the United States
� Enforcement software and tariff collection software for items
and people entering the US
� Enforcement software for items leaving the US
Nation-wide telephone, radio and data networks
Maintains a national data center

Page 3 smi Software Metrics, Inc.
OIT Measurement InitiativeOIT has an enterprise-wide process improvement program
Goal is to work towards CMMI Level 4
Measurement one of 16 initiatives in the process improvement effort
Measurement Initiative
1.Implement a Common Measurement Process
� Based on PSM
2.Expand measures implemented during FY2003
3.Automate Data Collection, Analysis and Reporting
� Using Insight
4.Measure Progress and Impact of CMMI-based Process Improvement
5.Strategic Measures

Page 4 smi Software Metrics, Inc.
Five Guiding Principles
The OIT Enterprise Measurement Initiative will follow five guiding
principles during FY2004. These are:
� Broaden and strengthen a culture of measurement throughout
OIT
� Collect, analyze, and report measures based on explicit
information requirements
� Involve all management and working levels in the development
of a common measurement process
� Rollout measurement in small steps to facilitate assimilation
and expertise in measurement at all management levels: from
the working level to the Assistant Commissioner.
� Enter data once, use it in multiple places
Page 5 smi Software Metrics, Inc.
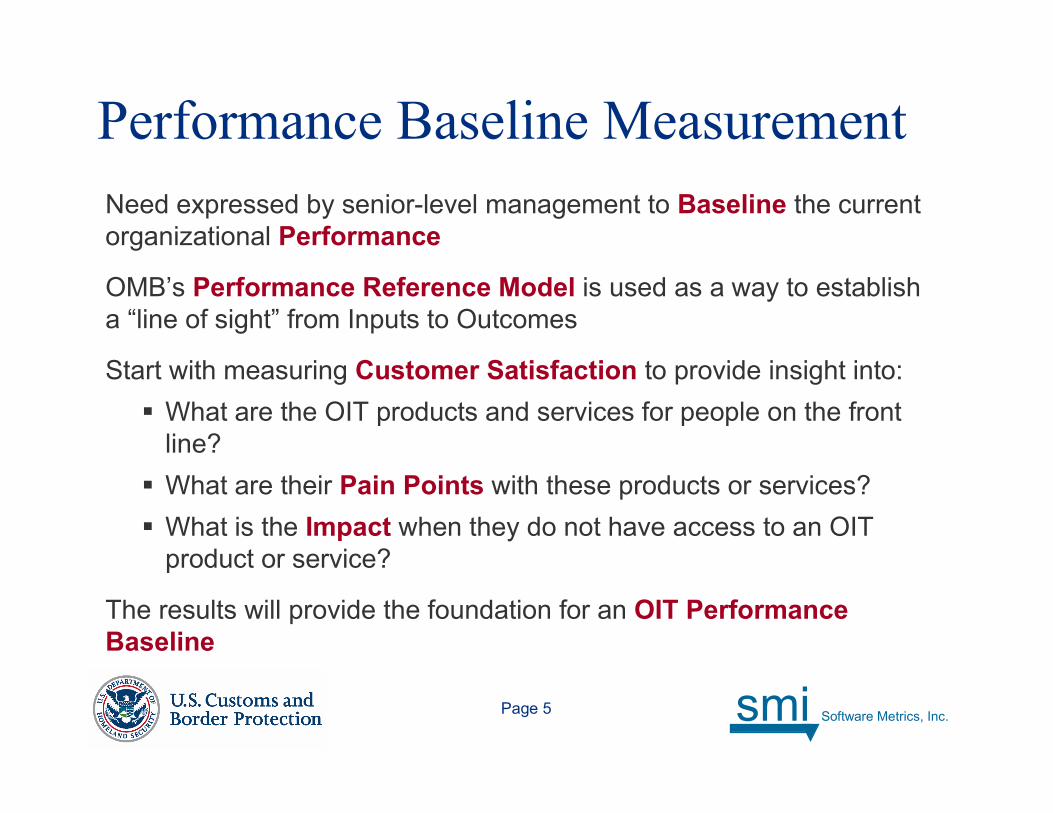
Performance Baseline Measurement
Need expressed by senior-level management to Baseline the current
organizational Performance
OMB’s Performance Reference Model is used as a way to establish
a “line of sight” from Inputs to Outcomes
Start with measuring Customer Satisfaction to provide insight into:
� What are the OIT products and services for people on the front
line?
� What are their Pain Points with these products or services?
� What is the Impact when they do not have access to an OIT
product or service?
The results will provide the foundation for an OIT Performance
Baseline

Page 6 smi Software Metrics, Inc.
OMB’s Federal Enterprise Architecture:
Performance Reference Model v1.0
Strategic Outcomes
Source: Federal Enterprise Architecture Program Management Office,
“Performance Reference Model,” v 1.0,
http://www.feapmo.gov/feaprm2.asp
Inputs
Mission and Business Results- Services for Citizens
- Support Delivery of Services
- Management of Government Resources
Mission and Business Results- Services for Citizens
- Support Delivery of Services
- Management of Government Resources
Value
Processes and Activities- Financial - Quality
- Productivity and Efficiency - Security and Privacy
- Cycle Time and Timeliness - Management and Innovation
Processes and Activities- Financial - Quality
- Productivity and Efficiency - Security and Privacy
- Cycle Time and Timeliness - Management and Innovation
Value
Technology- Financial - Information and Data
- Quality - Reliability and Availability
- Efficiency - Effectiveness
Technology- Financial - Information and Data
- Quality - Reliability and Availability
- Efficiency - Effectiveness
Human
Capitol
Human
Capitol
Other
Fixed
Assets
Other
Fixed
Assets
To establish an OIT
Performance Baseline,
we are working backwards
from Customer Results
To establish an OIT
Performance Baseline,
we are working backwards
from Customer Results
Customer Results- Customer Benefit - Service Quality
- Service Coverage - Service Accessibility
- Timeliness and Responsiveness
Customer Results- Customer Benefit - Service Quality
- Service Coverage - Service Accessibility
- Timeliness and Responsiveness
Page 7 smi Software Metrics, Inc.
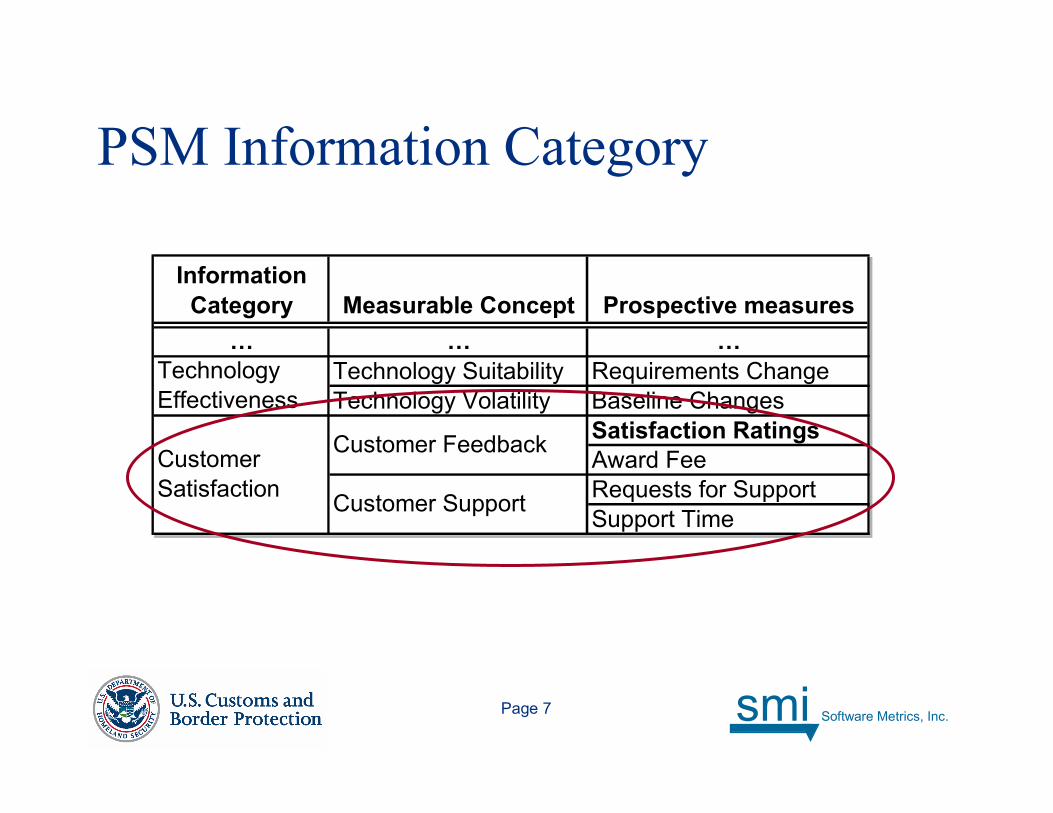
PSM Information Category
Information
Category Measurable Concept Prospective measures
… … …
Technology Suitability Requirements Change
Technology Volatility Baseline Changes
Satisfaction Ratings
Award Fee
Requests for Support
Support Time
Technology
Effectiveness
Customer
Satisfaction
Customer Feedback
Customer Support

Page 8 smi Software Metrics, Inc.
Considerations for a Customer
Satisfaction Survey -1Most literature on customer satisfaction surveys addresses the commercial
customer
� Someone who buys your product or service and has the decision
authority on what to buy and how much to spend.
� The intent is to understand how to retain and increase the number of
customers.
Government End-User
� Agency has decision authority on where it receives its services.
� The intent is to understand how to better support the customers in
carrying out their mission.
Survey must have a purpose
- Process improvement impact - Investigating a perceived need
- Training effectiveness - Evaluating a product or service

Page 9 smi Software Metrics, Inc.
Considerations for a Customer
Satisfaction Survey -2
Make the survey as easy and clear as possible for the respondent
Keep the respondent’s interest level and attention at a maximum
� Hot topics at the beginning of the survey
� Keep the questions short, simple and focused on one concept
at a time
� Demographics at the end
� Limit and target questions so survey takes only 10 to 15
minutes
� Make the survey repeatable for annual updates

Page 10 smi Software Metrics, Inc.
Customer Satisfaction Survey
Questions
ProductsProducts ServicesServicesCustomers
(End-User)
Customers
(End-User)
Ask questions about• Level of satisfaction
• Perception of change
• Attribute expectation
• Level of attribute
importance
• Knowledge of product or
service
• Impact on mission
of the product or service
attribute
Ask questions about• Level of satisfaction
• Perception of change
• Attribute expectation
• Level of attribute
importance
• Knowledge of product or
service
• Impact on mission
of the product or service
attribute
Experience
Use Use
Product Attribute
Candidates• Availability
• Response time
• Accuracy (missing or bad
data)
• Ease of Use
• Ability to submit
recommendations for
improvements
• Frequency of product use
• Features
• Design / aesthetics
• Problems with the product
Product Attribute
Candidates• Availability
• Response time
• Accuracy (missing or bad
data)
• Ease of Use
• Ability to submit
recommendations for
improvements
• Frequency of product use
• Features
• Design / aesthetics
• Problems with the product
Service Attribute
Candidates• Availability of the service
• Turnaround time
• Ability to submit
improvement
recommendations
• Knowledge level of
service responder
• Frequency of problems
• Accuracy of the service
• Delivery
• Overall service quality
• Complaint Resolution
• Complaint Handling
Service Attribute
Candidates• Availability of the service
• Turnaround time
• Ability to submit
improvement
recommendations
• Knowledge level of
service responder
• Frequency of problems
• Accuracy of the service
• Delivery
• Overall service quality
• Complaint Resolution
• Complaint Handling
Page 11 smi Software Metrics, Inc.
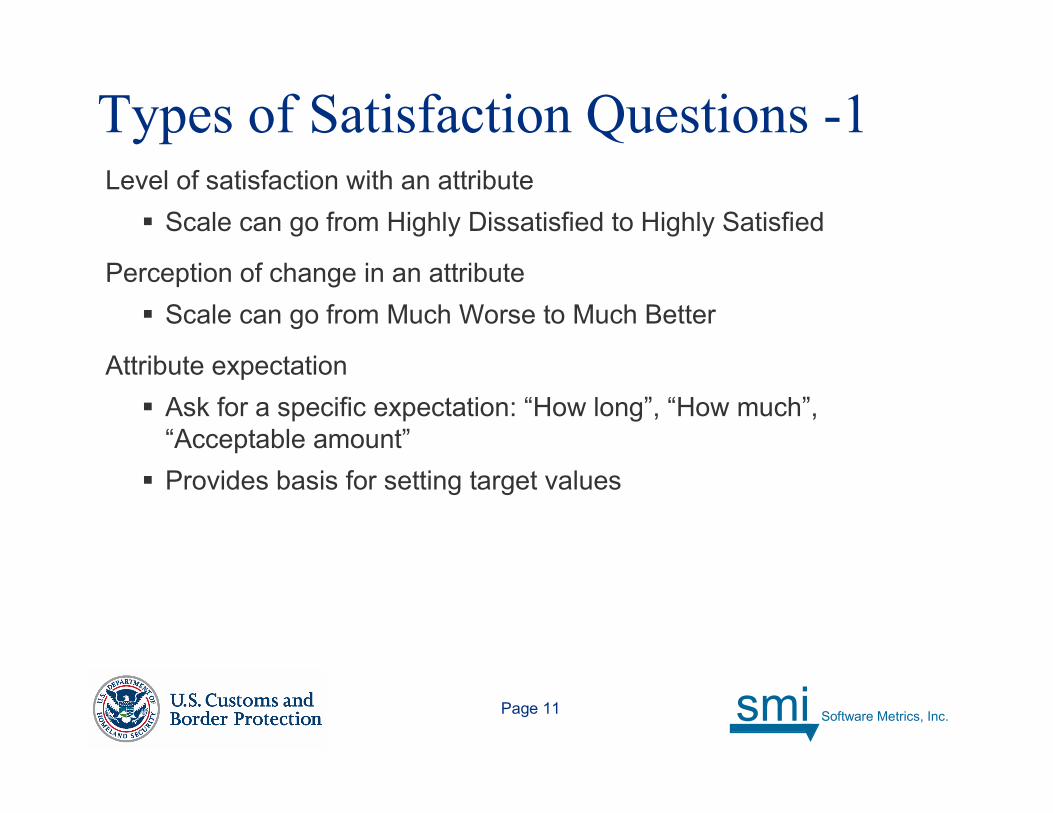
Types of Satisfaction Questions -1Level of satisfaction with an attribute
� Scale can go from Highly Dissatisfied to Highly Satisfied
Perception of change in an attribute
� Scale can go from Much Worse to Much Better
Attribute expectation
� Ask for a specific expectation: “How long”, “How much”,
“Acceptable amount”
� Provides basis for setting target values

Page 12 smi Software Metrics, Inc.
Types of Satisfaction Questions -2Level of attribute importance
� Scale can go from “Not Important” to “Very Important”
Knowledge of product or service
� Ask how long they have been using the product or service
Impact on mission
� Ask what happens when they cannot get the product or service
� If a system is down for an hour, does that mean 5,000 people
cross the border unchecked?

Page 13 smi Software Metrics, Inc.
Demographics are Important!
Examples of demographics
- Location - Gender
- Experience level - Job Position
- Years employed - Job Description
Provide means for viewing data from different groups within the
sample
Helps to understand “Non-Response” error
� Compare demographic with known population distribution

Page 14 smi Software Metrics, Inc.
Role of Demographics
For a population of 10,000+ CBP users, we need about 450 to 575
responses for statistically meaningful analysis and conclusions
Survey will be sent to all Customs and Border Protection front-line
users
We will use demographic information to verify that responses were
representative of larger population
� alternative would be random sampling with mandatory
requirement to fill out survey
� this is difficult to enforce
Page 15 smi Software Metrics, Inc.
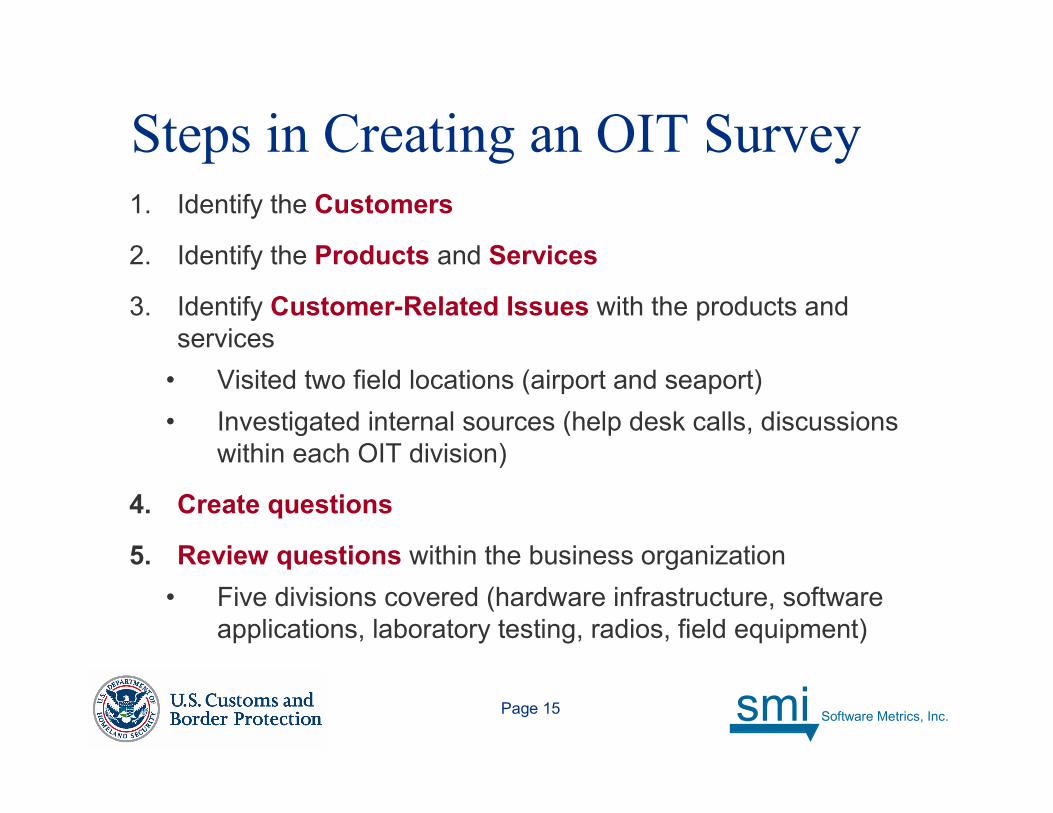
Steps in Creating an OIT Survey1. Identify the Customers
2. Identify the Products and Services
3. Identify Customer-Related Issues with the products and
services
• Visited two field locations (airport and seaport)
• Investigated internal sources (help desk calls, discussions
within each OIT division)
4. Create questions
5. Review questions within the business organization
• Five divisions covered (hardware infrastructure, software
applications, laboratory testing, radios, field equipment)

Page 16 smi Software Metrics, Inc.
Measurement Scales� Nominal: categorizing points on the scale, no ordering implied
� Examples: demographic data (gender, location), Yes/No responses
� Ordinal: points on the scale are ordered
� Example: quality of service is “worse”, “no change”, “better”
� Interval: equal space or intervals between points on the scale
� Examples: responses indicating a numerical quantity - “How long
can you wait for system to repond?”
� Likert scale where end points are labeled and intervals are implied
� Allen & Tanniru* argued that people cognitively create an interval scale
� Ratio: equal intervals plus a meaningful zero point
� Example: number of problem reportsSource: “Analysis of Customer Satisfaction Data” by Derek Allen and Tanniru R. Rao,
American Society for Quality (ASQ) Press, 2000

Page 17 smi Software Metrics, Inc.
Measurement ScalesType of analysis is determined by measurement scales
� Nominal and ordinal
� Frequency tabulations (bar charts)
� Interval and ratio
� Frequency tabulations
� Correlation, linear regression
Source: “Analysis of Customer Satisfaction Data” by Derek Allen and Tanniru R. Rao,
American Society for Quality (ASQ) Press, 2000

Page 18 smi Software Metrics, Inc.
Example Survey Question 1a – Ordinal Scale
We would like to ask you about your satisfaction with the Automated
Targeting System application. Please tell us how satisfied you are by using
the scale shown below. How satisfied are you with the application in terms
of…
Very
Dissatisfied
Very
Satisfied
5 �4 �3 �2 �1�Ability to submit
improvements
5 �4 �3 �2 �1�Ease of Use
5 �4 �3 �2 �1�Data Accuracy
5 �4 �3 �2 �1�Response Time
5 �4 �3 �2 �1�Availability
Neutral
Satisfied
Dissatisfied

Page 19 smi Software Metrics, Inc.
Example Survey Question 1b – Interval ScaleWe would like to ask you about your satisfaction with the Automated
Targeting System application. Please tell us how satisfied you are by using
a seven-point scale where 1 means you are completely and totally
dissatisfied and 7 means you are completely and totally satisfied.
Using the seven points on this scale, how satisfied are you with the
application in terms of…
Completely
Dissatisfied
Completely
Satisfied
7 �6 �5 �4 �3 �2 �1�Ability to submit
improvements
7 �6 �5 �4 �3 �2 �1�Ease of Use
7 �6 �5 �4 �3 �2 �1�Data Accuracy
7 �6 �5 �4 �3 �2 �1�Response Time
7 �6 �5 �4 �3 �2 �1�Availability

Page 20 smi Software Metrics, Inc.
Example Survey Question -2When you don’t have the use of this application, what impact does this
have on your mission?
�5. Use manual methods to get work done
�4. Work has to be transferred to another location
�3. Work-around available using other applications
�2. Wait until application is available
�1. Can still get what I need
If the mission is compromised, please describe this impact (e.g., cargo is
not screened as quickly or as throughly)

Page 21 smi Software Metrics, Inc.
Example Survey Question -3
Overall, considering all of these characteristics, how satisfied are you with
the Advance Targeting System application. Again, please use the seven-
point scale where 1 means you are totally and completely dissatisfied
and and 7 means you are totally and completely satisfied.
Completely
Dissatisfied
Completely
Satisfied
7 �6 �5 �4 �3 �2 �1�
Please provide us additional comments on this application:
Page 22 smi Software Metrics, Inc.
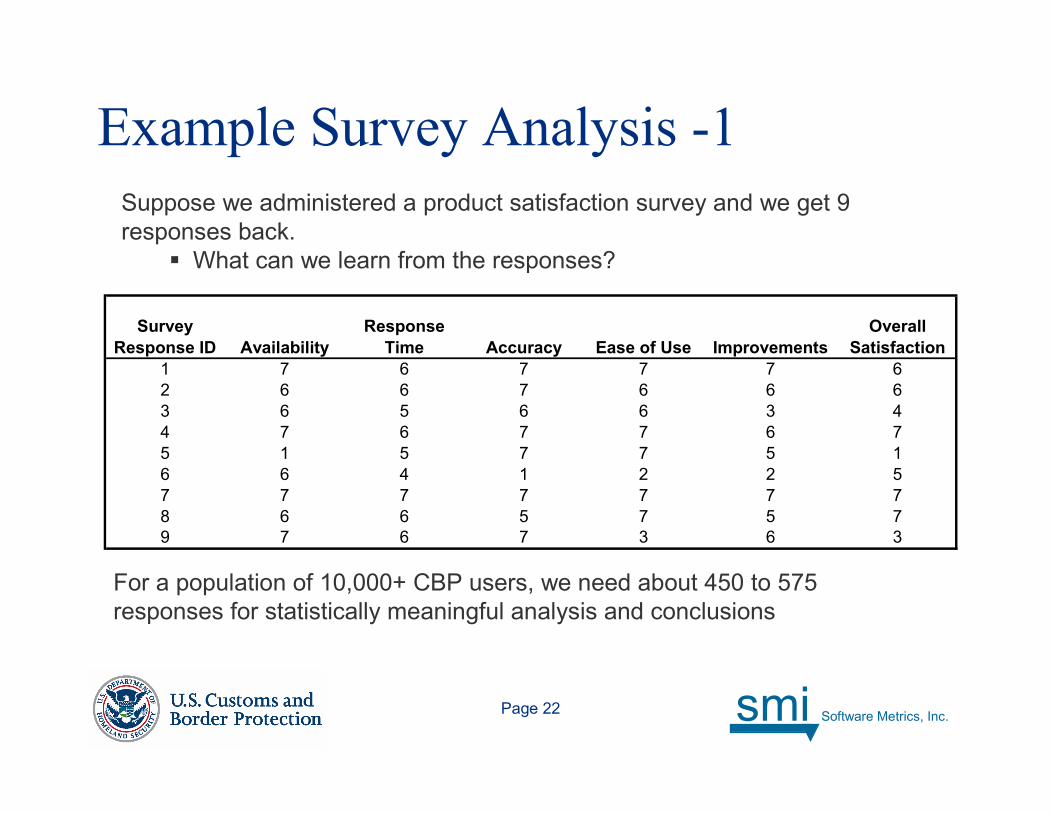
Example Survey Analysis -1
Suppose we administered a product satisfaction survey and we get 9
responses back.
� What can we learn from the responses?
Survey
Response ID Availability
Response
Time Accuracy Ease of Use Improvements
Overall
Satisfaction
1 7 6 7 7 7 6
2 6 6 7 6 6 6
3 6 5 6 6 3 4
4 7 6 7 7 6 7
5 1 5 7 7 5 1
6 6 4 1 2 2 5
7 7 7 7 7 7 7
8 6 6 5 7 5 7
9 7 6 7 3 6 3
For a population of 10,000+ CBP users, we need about 450 to 575
responses for statistically meaningful analysis and conclusions

Page 23 smi Software Metrics, Inc.
Analysis Example -2Frequency analysis: treating the responses as an ordinal scale
Overall Satisfaction
0
1
2
3
4
5
6
1 2 3 4 5 6 7
Response Scale
Frequency
Availability
0
1
2
3
4
5
6
1 2 3 4 5 6 7
Response Scale
Frequency
Response Time
0
1
2
3
4
5
6
1 2 3 4 5 6 7Response Scale
Frequency
Accuracy
0
1
2
3
4
5
6
1 2 3 4 5 6 7Response Scale
Frequency
Ease of Use
0
1
2
3
4
5
6
1 2 3 4 5 6 7Response Scale
Frequency
Improvements
0
1
2
3
4
5
6
1 2 3 4 5 6 7Response Scale
Frequency

Page 24 smi Software Metrics, Inc.
Analysis Example -3Vulnerability analysis: treating the responses as an ordinal
scale, you can look for risks to accomplishing the mission.
0
1
2
3
4
5
6
7
0 1 2 3 4 5 6
Impact on Ability to Perform Mission
Overall S
atisfaction
Risk Quadrant
“Happy” QuadrantLower Priority
Quadrant
Lower Priority
Quadrant

Page 25 smi Software Metrics, Inc.
Analysis Example -4
Analysis Questions
� For this product, how can availability be increased?
� What internal data exists to collaborate the availability
product attribute (from a call center, problem reports,
etc.)?
� Are there other products or infrastructure services that
impact this product's availability (e.g. other databases,
network availability, etc.)?
Correlation analysis: treating the responses as an interval scale
Product Attirbutes Availability
Response
Time Accuracy
Ease of
Use Improvements
Overall
Satisfaction
Availability 1
Response Time 0.43 1
Accuracy -0.03 0.72 1
Ease of Use -0.18 0.55 0.65 1
Improvements 0.24 0.90 0.80 0.55 1Overall Satisfaction 0.73 0.51 -0.06 0.29 0.31 1

Page 26 smi Software Metrics, Inc.
Analysis Example Conclusion
Type of measurement scale determines the possible analysis
Decide which analysis techniques will be used on the data
Construct questions using appropriate scales to support the
analysis
The analysis must correlate attributes against the overall results to
help define follow-up actions

Page 27 smi Software Metrics, Inc.
Conclusions
Customer satisfaction surveys can be an important measurement
instrument
We are using surveys to identify relevant organizational
performance measures based on survey results
� What product and service characteristics are important in
accomplishing CBP mission (availability, data accuracy,
response time…)?
� Understanding the impact resulting from problems with a
product or service will focus OIT on the appropriate priorities
Ask questions that point to specific improvement actions (not just a
“feel good” survey)
Page 28 smi Software Metrics, Inc.
Further Reading
“Listening to the Voice of the Customer” by Jon Anton and Debra
Perkins, Alexander Communication Group, 1997
“Customer Satisfaction Tools, Techniques, and Formulas for
Success” by Craig Cochran, Paton Press, 2003
“Analysis of Customer Satisfaction Data” by Derek Allen and
Tanniru R. Rao, American Society for Quality (ASQ) Press, 2000

Page 29 smi Software Metrics, Inc.
Craig Beyers, SETA
(703) 286-4009
Betsy Clark, SMI
Brad Clark, SMI
(703) 754-0115