measuring circularity: an application of modified material
TRANSCRIPT

RESEARCH Open Access
Measuring circularity: an application ofmodified Material Circularity Indicator toagricultural systemsL. Rocchi* , L. Paolotti, C. Cortina, F. F. Fagioli and A. Boggia
* Correspondence: [email protected] of Agricultural, Foodand Environmental Sciences,University of Perugia, Borgo XXGiugno, 74 06121 Perugia, PG, Italy
Abstract
The transition from a linear to a circular economy is a research trend topic, as well asthe possibility to measure the degree of circularity of products and systems. In a lineareconomy, raw materials are taken from nature and transformed into final products,which are subsequently used and become waste. On the contrary, a circular economyis an economic model that is restorative by intent and design. To measure the degreeof circularity is fundamental for understanding processes and improving them.Moreover, this kind of measure could be useful for driving policies on the topic andachieving a higher level of sustainability. Until now, only few studies have beenfocusing on how to effectively measure the circularity level of a product, a supplychain, or a service. Moreover, in the circular economy paradigm, there are two types ofcycles: the technical and biological ones. Biological cycles are mainly connected to theagricultural sector, and for this kind of cycle, the lack of measurement is even bigger.However, some agricultural productions, such as intensive meat production processes,have basically a linear structure. Intensive broiler production, for instance, uses a quitehigh rate of inputs, which is not entirely converted into edible products but insteadresults in a percentage of wasteful outputs. The aim of this work is to propose amodification of one of the few available tools for measuring the circularity, the MaterialCircularity Indicator (MCI), for adapting it to biological cycles. The modified MCI wasapplied to the poultry sector, integrating the results with the Life Cycle Assessmentmethodology.
Keywords: Circular economy, Broiler production system, Indicators, Modified MaterialCircularity Indicator, Life Cycle Assessment
IntroductionThe transition from a linear to a circular economy (CE) is currently considered a trend
topic, both by the academic community and governments, in particular in Europe. The
European Union has launched its Circular Economy Action Plan in 2016 and adopted
a new set of measures in January 2018. The great interest about CE is due to its ability
to operationalize the concept of sustainable development for business activities (Sauvé
et al. 2016; Kirchherr et al. 2017). Moreover, Europe has the highest net import of
© The Author(s). 2021 Open Access This article is licensed under a Creative Commons Attribution 4.0 International License, whichpermits use, sharing, adaptation, distribution and reproduction in any medium or format, as long as you give appropriate credit to theoriginal author(s) and the source, provide a link to the Creative Commons licence, and indicate if changes were made. The images orother third party material in this article are included in the article's Creative Commons licence, unless indicated otherwise in a creditline to the material. If material is not included in the article's Creative Commons licence and your intended use is not permitted bystatutory regulation or exceeds the permitted use, you will need to obtain permission directly from the copyright holder. To view acopy of this licence, visit http://creativecommons.org/licenses/by/4.0/.
Agricultural and FoodEconomics
Rocchi et al. Agricultural and Food Economics (2021) 9:9 https://doi.org/10.1186/s40100-021-00182-8
resources for person in the world (Di Maio et al. 2017); therefore, going towards circu-
larity means being less dependent on raw materials.
In a linear economy, raw materials are taken from nature and transformed into final
products, which are subsequently used and become waste. In a world that deals with a
finite amount of resources, a linear economy cannot be considered a long-run strategy.
On the contrary, a circular economy is a model that is restorative by intent and design
(EM Foundation 2015). The features of CE include low pollutant emission, low energy
consumption, waste elimination, and increased efficiency (Murray et al. 2017).
According to the circular economy approach, there are two types of cycles: technical
and biological ones. In the former, materials, products, and components remain in the
market, as long as possible, through repair, reuse, re-manufacture, and recycling. In the
biological cycles, non-toxic materials can be directly restored into the biosphere. The
issue of restoration is crucial in such approach, as it allows CE to be not only preventa-
tive but also active to repair previous damage (Murray et al. 2017).
The development of circular metrics is essential for business and public stakeholders,
because “only what gets measured gets management” (Linder et al. 2017). Usually, CE
indicators are grouped into micro-level (e.g., organizations, products, consumers),
meso-level (e.g., eco-industrial parks), and macro-level indicators (e.g., city, province,
region, country) (Pauliuk 2018). While indicators for environmental performance or re-
source efficiency are numerous (Pauliuk 2018), few studies focused on how to effect-
ively measure the circularity level of a product, a supply chain, or a service (Elia et al.
2017; Linder et al. 2017). This lack is particularly evident at the micro-level, with nega-
tive effects both for producers who want to provide circular products and services and
for consumers who want to know how to compare and chose products (Kristensen and
Mosgaard 2020).
There is no single, commonly accepted approach for measuring the circular economy
at the micro-level (Kristensen and Mosgaard 2020). Some attempts have been done in
the years. However, the analysis of the literature shows that most of the considered in-
dicators focused on metrics based on a single aspect, usually on inputs and outputs in
the production systems, or took into consideration just some of the aspects of circular-
ity (Moraga et al. 2019). In their review, Kristensen and Mosgaard (2020) identified re-
cycling, end-of-life management, and regeneration as trend topics for circularity
indicators, while fewer works considered dismantling, extending of useful life, efficiency
of resources, or reuse. Scheepens et al. (2016) proposed an LCA-based metric for prod-
ucts as an indicator for circularity; however, the proposed method deals with the reduc-
tion of externalities and not with measuring the degree of circularity. Genovese et al.
(2017) used a lifecycle perspective for comparing supply chain performance in chemical
and food sectors, integrating the circular economy within sustainable principles. Di
Maio and Rem (2015) developed the Circular Economy Index (CEI), including also en-
vironmental and economic aspects, which focuses on the recycling process, excluding
the recovery materials. Cayzer et al. (2017) designed an indicator for measuring the CE
performance of industrial products. Approaches not based on mass units are also
present. Franklin-Johnson et al. (2016) developed a performance indicator based on
longevity, i.e., the amount of time that a resource is kept in use. Di Maio et al. (2017)
expressed the degree of circularity in terms of value in chemical and food sectors,
highlighting the difference between the resource efficiency of a process and of a
Rocchi et al. Agricultural and Food Economics (2021) 9:9 Page 2 of 13

product within supply chains, in a lifecycle perspective. Zhijun and Nailing (2007) pro-
posed a system of indicators for evaluating the degree of circularity in China and moni-
toring national policies to improve it.
In this scenario, one of the newest attempts made is the Material Circularity Indicator
(MCI), proposed by the Ellen MacArthur Foundation (EM Foundation 2015. MCI pro-
vides indication on the “degree of circularity” of materials composing products. It has
some similarities with Life Cycle Assessment (LCA), but it is more focused on the flow
of materials; therefore, it can be considered as complementary to LCA. The method-
ology of MCI is designed for technical cycles and materials from non-renewable
sources only.
The aim of this paper is to propose a modification of the MCI, for adapting it to bio-
logical cycles, specifically to zootechnical production.
The reasons for this choice lean on the fact that some agricultural productions can
greatly affect the environment Notarnicola et al. 2017; in particular, meat production
consumes the majority of the global agricultural land and almost half of the global
croplands, causing also a competition between feed and food Mottet et al. 2017. How-
ever, there is no general consensus on how to address the reduction of animal-based
food Van Zanten et al. 2019. Some studies proved the relevance for mankind to con-
tinue the animal rearing, but with the need of shifting under a circular paradigm Van
Zanten et al. 2019. This is particularly important in the case of intensive rearing sys-
tems (i.e., poultry and pig production), which are built according to a linear “extract-
produce-consume-discard” model. The livestock industry, and in particular that of
poultry, is recognized as being responsible for the greatest share of ammonia emissions
in the environment, and for this reason, various strategies have been considered re-
cently to reduce emission levels in this sector Boggia et al. 2019.
EU data on poultry meat show a significant increase in its consumption (EEA
2018. In emerging economies, especially in China and India, the demand for food
is rapidly increasing and the composition of the diet is shifting in the direction of
a greater consumption of proteins of animal origin Mariani and Viganò 2013.
Therefore, we suggest that a circular economy in agriculture could mean to catch
up the production of goods using the minimal amount of external inputs, closing
the nutrient loops and reducing the negative outputs (i.e., reducing waste and
emissions). The goal of the work is to present a specific indicator for comparing
circularity among zootechnical products, with a special emphasis on poultry pro-
duction at the farm level.
Materials and methodsMaterial Circularity Indicator (MCI)
MCI of a product measures how much the linear flow has been minimized and the re-
storative flow maximized for its components, and, at the same time, how long and in-
tensively. It is based on four principles guides (EM Foundation 2015: (i) using feedstock
from reused or recycled sources, (ii) reusing components or recycling materials after
the use, (iii) keeping the products longer, and (iv) making more intensive use of prod-
ucts. Points i and ii are linked to the restorative part of the production; points iii and iv
are connected to the linear one. Secondary products are not considered.
Rocchi et al. Agricultural and Food Economics (2021) 9:9 Page 3 of 13
In comparison to other indicators, MCI is one of the few that includes retention in
its metric, as it considers how much an element is used in the process in terms of in-
tensity and duration. As Parchomenko et al. (2019) highlighted, despite this was a core
principle in CE, very few CE metrics include it.
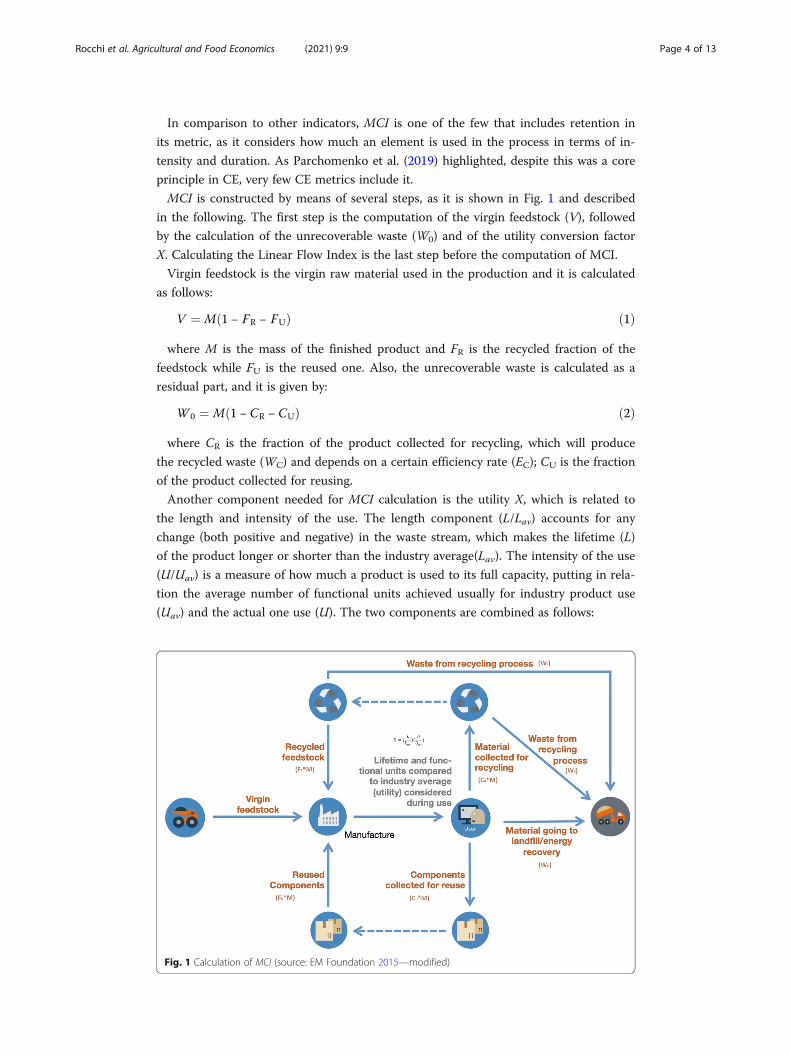
MCI is constructed by means of several steps, as it is shown in Fig. 1 and described
in the following. The first step is the computation of the virgin feedstock (V), followed
by the calculation of the unrecoverable waste (W0) and of the utility conversion factor
X. Calculating the Linear Flow Index is the last step before the computation of MCI.
Virgin feedstock is the virgin raw material used in the production and it is calculated
as follows:
V ¼ M 1 − FR − FUð Þ ð1Þ
where M is the mass of the finished product and FR is the recycled fraction of the
feedstock while FU is the reused one. Also, the unrecoverable waste is calculated as a
residual part, and it is given by:
W 0 ¼ M 1 −CR − CUð Þ ð2Þ
where CR is the fraction of the product collected for recycling, which will produce
the recycled waste (WC) and depends on a certain efficiency rate (EC); CU is the fraction
of the product collected for reusing.
Another component needed for MCI calculation is the utility X, which is related to
the length and intensity of the use. The length component (L/Lav) accounts for any
change (both positive and negative) in the waste stream, which makes the lifetime (L)
of the product longer or shorter than the industry average(Lav). The intensity of the use
(U/Uav) is a measure of how much a product is used to its full capacity, putting in rela-
tion the average number of functional units achieved usually for industry product use
(Uav) and the actual one use (U). The two components are combined as follows:
Fig. 1 Calculation of MCI (source: EM Foundation 2015—modified)
Rocchi et al. Agricultural and Food Economics (2021) 9:9 Page 4 of 13

X ¼ LL
� �UUav
� �ð3Þ
Figure 1 does not report the Linear Flow Index (LFI), which represents the propor-
tion of material flowing in a linear chain. However, it can be calculated based on WC,
which is the amount of waste generated by the recycling phase of the product, and WF,
which is the amount of waste generated for producing recycled feedstock. It represents
the part of the production that cannot circulate. When the recycling process is 100% ef-
ficient (easiest scenario), both at upstream and downstream levels, the LFI can be cal-
culated using Eq. 4
LFI ¼ V þW 0
2Mð4Þ
Finally, the MCI can be defined by considering the LFI and the factor F(X), using the
following equation:
MCI�P ¼ 1 − LFI � F Xð Þ ð5Þ
MCI assigns a score between 0 and 1 to the product analyzed, assessing how restora-
tive or linear are the flows of the materials for the product itself. For products highly
linear (LFI = 1) and with a utility worse than the average, MCI could be negative. So,
the definition is derived by:
MCIP ¼ max 0;MCI�ð Þ ð6Þ
Limitations and missing points
As noted by Figge et al. (2018), most of the circularity metrics aim to capture the circu-
larity of resource flows, while fail to simultaneously consider the length of time for
which a resource is in use. However, the circular economy is about to create value
through material retention; therefore, we cannot avoid considering duration Franklin-
Johnson et al. 2016. According to Lonca et al. (2018), MCI is the only available circular
metric that attempts to take product durability into account, thanks to the calculation
of the Utility Flow Index. However, due to the complexity of the overall metric, only a
part of the utility factor would be used (EM Foundation 2015; Figge et al. 2018). More-
over, some limitations are directly connected to the measurement of each component
(Linear Flow Index and Utility Flow Index) and it could be difficult to accommodate
the variety of reuse and recovery rates for each resource (EM Foundation 2015; Linder
et al. 2017; Figge et al. 2018).
Additionally, MCI focuses only on the technical cycles and especially on non-
renewable resources. Therefore, it covers just partially the circularity concept (Åkerman
2016; Lonca et al. 2018) and excludes all the biological-based production with a high
impact on the environment, as the intensive livestock (Gerber et al. 2005). Directive
2010/75/EU included intensive poultry (with more than 40,000 places) and pig systems
(with more than 2000 places for pigs over 30 kg and 750 places for sows) among the in-
dustrial activities under the integrated pollution prevention and control framework, be-
cause of their impact in terms of emissions. However, although intensive livestock
productions are considered industrial activities and their impact is proved, it is not
Rocchi et al. Agricultural and Food Economics (2021) 9:9 Page 5 of 13
possible to apply directly the MCI to them. Thus, the development of a new index for
biological cycles and specifically tailored for zootechnical products is required.
Modified MCI
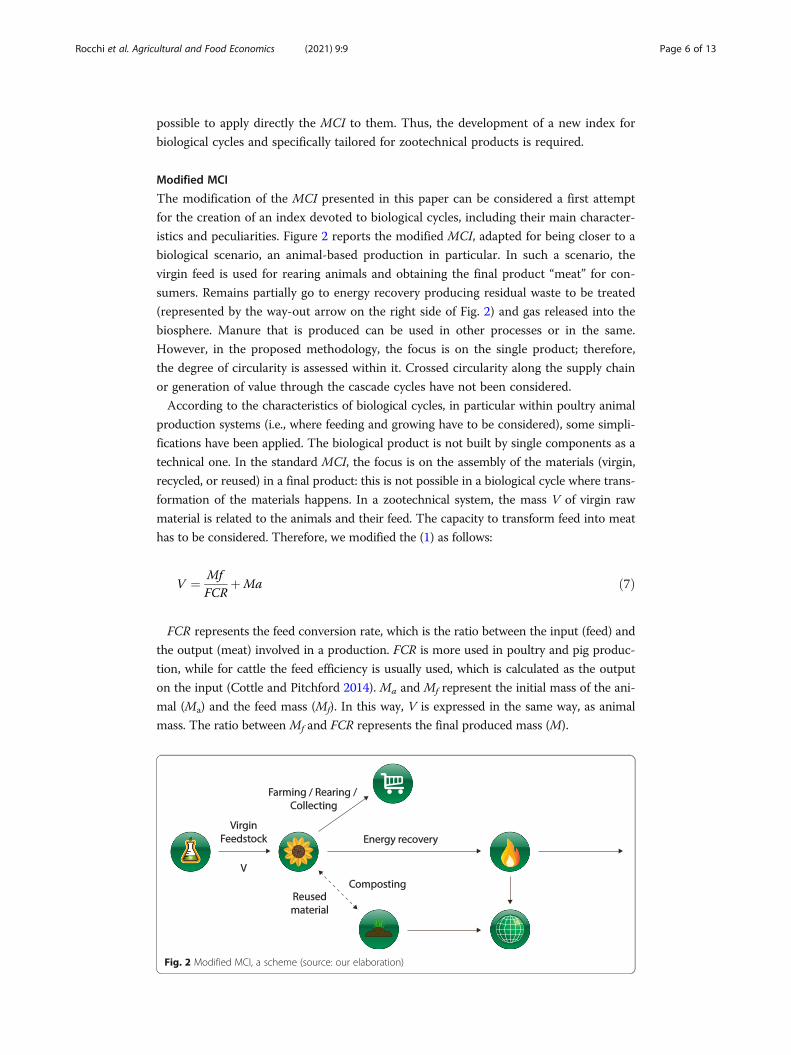
The modification of the MCI presented in this paper can be considered a first attempt
for the creation of an index devoted to biological cycles, including their main character-
istics and peculiarities. Figure 2 reports the modified MCI, adapted for being closer to a
biological scenario, an animal-based production in particular. In such a scenario, the
virgin feed is used for rearing animals and obtaining the final product “meat” for con-
sumers. Remains partially go to energy recovery producing residual waste to be treated
(represented by the way-out arrow on the right side of Fig. 2) and gas released into the
biosphere. Manure that is produced can be used in other processes or in the same.
However, in the proposed methodology, the focus is on the single product; therefore,
the degree of circularity is assessed within it. Crossed circularity along the supply chain
or generation of value through the cascade cycles have not been considered.
According to the characteristics of biological cycles, in particular within poultry animal
production systems (i.e., where feeding and growing have to be considered), some simpli-
fications have been applied. The biological product is not built by single components as a
technical one. In the standard MCI, the focus is on the assembly of the materials (virgin,
recycled, or reused) in a final product: this is not possible in a biological cycle where trans-
formation of the materials happens. In a zootechnical system, the mass V of virgin raw
material is related to the animals and their feed. The capacity to transform feed into meat
has to be considered. Therefore, we modified the (1) as follows:
V ¼ MfFCR
þMa ð7Þ
FCR represents the feed conversion rate, which is the ratio between the input (feed) and
the output (meat) involved in a production. FCR is more used in poultry and pig produc-
tion, while for cattle the feed efficiency is usually used, which is calculated as the output
on the input (Cottle and Pitchford 2014). Ma and Mf represent the initial mass of the ani-
mal (Ma) and the feed mass (Mf). In this way, V is expressed in the same way, as animal
mass. The ratio between Mf and FCR represents the final produced mass (M).
Fig. 2 Modified MCI, a scheme (source: our elaboration)
Rocchi et al. Agricultural and Food Economics (2021) 9:9 Page 6 of 13

The mass of unrecoverable waste (W0) attributed to the product is calculated by sub-
tracting the fractions used for composting (reused materials) or the biogas recovery
(recycled materials) from the total waste (W). Differently from an industrial product,
where the recycling and reuse processes are calculated on the mass of the product, for
cycles involving animals, manure production has to be considered. Equation (2) for the
rearing system has been changed as follows:
W 0 ¼ W 1 − CR −CUð Þ þMA 1 − CRA −CUAð Þ ð8Þ
where W is calculated as the quota (α) of the mass (M) that is discharged (W =M ⋅ a);
MA is the mass of the manure and CRA and CUA are the fractions of manure collected
for recycling and reusing. As suggested by EM Foundation (2012), the production of
biogas has to be considered as a recycling process; the use of manure for composting is
instead a reusing, since it enters as input, after a modification, in a new process. Be-
cause the focus of the modified MCI is the production of meat at the farm level, we did
not consider the product after it enters the human food chain.
Another simplification has to be done for the utility (X), which is related to the length
and intensity of the use of industrial products in the technical cycles (see Eq. (5)). For
biological cycles, we considered the utility conversion factor (XC), calculated as the
complementary of the mortality rate. Mortality rate expresses the number of dead ani-
mals at the end of each cycle, divided by their initial number and multiplied by 100.
The complementary of mortality rate represents the percentage of animals which stay
for the whole cycle. Equations from (4) to (6) do not need any other modifications, ex-
cept for the substitution of X with XC. The modified MCI ranges between 0 and 1, as
the MCI. As for the original one, highly linear processes or processes with a very low
utility can show negative value but, in this case, MCI should be round to 0.
Case study: the poultry industry
Poultry industrial production can generate not only local disturbances (e.g., odor, flies,
and rodents), and landscape degradation (Gerber et al. 2005), but also a significant
amount of waste (Seidavi et al. 2019). Poor manure management may cause also pollu-
tion of soil and water, with the presence of nutrients, pathogens, and heavy metals
where manure is stored. Environmental concerns are related to the geographical con-
centration of production units and to the complete decoupling of crops from poultry
production.
However, poultry performs better from an environmental perspective compared to
other livestock species. A substantial comparative advantage of poultry over other ani-
mal sectors relates to efficiency in feed conversion. Poultry’s feed conversion ratio
(called “feed index”) represents a major contribution not only to the profitability of the
industry in terms of reduced feed inputs, but also in terms of waste reduction (Gerber
et al. 2007). Another comparative advantage lies in the low water content and high nu-
trient content of poultry manure. Manure is often handled with more care than manure
from other species—especially pigs—as its recycling is generally economically profitable
(Gerber et al. 2007). Also, the waste resulted from poultry processing steps can be
recycled for raw materials or converted into new products of higher value. All these as-
pects are important from economic and environmental perspectives (Alidadi et al.
Rocchi et al. Agricultural and Food Economics (2021) 9:9 Page 7 of 13

2017) and suggest the broiler system may be a feasible case study for a first application
of the modified MCI.
Intensive broiler farming is typically characterized by high stocking densities, fast
growth rates leading to a young slaughtering age, very large holdings, and indoor rear-
ing. A typical broiler breeding cycle involves the following phases: cleaning and disin-
fection of animal housing, bird arrival, growth management, loading, and
transportation of birds at the end of the cycle. Animal rearing follows the indication of
European Directive 2007/43/EC, specifying the guidelines for the protection of chickens
reared for meat production and providing minimal standards required. Breeding takes
place in a controlled environment both in terms of temperature and humidity. The ani-
mals have free access to water and commercial pelleted diets, formulated to meet nutri-
tional requirements for all animal categories. The broiler chicks are grown according to
appropriate market standards of age and weight. In particular, broilers are slaughtered
at 32 days (1.6 kg—light broilers), at 40 days (2.5 kg—medium broilers), and at 53 days
(3.8 kg—roasters, i.e. heavy broilers). The carcasses of birds that die on the farm require
disposal; faster growing breeds tend to have higher weekly mortality rates.
The case study considered a breeding of 6.4 cycles per year, with a density of 12.69
birds per m2. The cycle length was of 57 days. The feed index of the poultry is equal to
1.9 and a final live weight of 2.6 kg was considered. The data used were based on Cas-
tellini et al. (2012) for a comparison and integration with Life Cycle Assessment (LCA),
as suggested for the MCI (EM Foundation 2015, and they are representative of the
standard central Italy rearing. Data on the production and management of waste, ne-
cessary for the calculation of the modified MCI, come from field data in the same area
of the study.
ResultsCalculation of MCI starts from the assessment of the inputs involved and their trans-
formation in virgin material (V). Table 1 reports the reference data for the calculation
of V according to (7). The FCR for intensive broilers is 1.9.
Using the data in Table 1, we can calculate V (in tonnes):
V ¼ MfFCR
þMa ¼ 31:621:9
þ 0:27 ¼ 16:91
For calculating the unrecoverable waste, we first estimated the total amount of dis-
charge (W) as equal to the 7% (ɑ) of the final produced mass (M). Then, we considered
the fraction of them collected for recycling (CR) and the one collected for reusing (CU).
Production discharges are not used in the composting process; therefore, CU is equal to
0. The fraction used for biogas is also very little: CR is equal to 0.25 for discards. In re-
lation to manure, it is collected both for biogas (CRA=0.5) and for composting (CUA=
0.5); therefore, it is not part of the unrecoverable waste. Equation (8) gives an amount
of unrecoverable waste equal to 0.87 t.
Table 1 Materials and related mass
Input Material Mass (t)
Input 1 Chicks 0.27
Input 2 Feed 31.62
Rocchi et al. Agricultural and Food Economics (2021) 9:9 Page 8 of 13
Subsequently, we calculated the LFI, following Eq. (4):
LFI ¼ V þW 0
2M¼ 16:91þ 0:87
2� 16:64¼ 0:53
The last input needed is the F(X), which is complementary to the mortality rate
(expressed on a 0/1 scale). According to Castellini et al. (2012), the mortality rate is
equal to 4%; therefore
F XCð Þ ¼ 1 − 0:04ð Þ ¼ 0:96
We can now calculate the modified MCI, following Eq. (5):
MCI ¼ 1 − LFI � F Xcð Þ ¼ 0:4812
DiscussionThe results of our case study show a modified MCI value of 0.4897. As the modified
MCI ranges between 0 and 1, values lower than 0.5 could be considered more linear
than circular. The data itself confirm the assumption connected to the application of
MCI to the broiler system: poultry meat product is comparable to industrial products.
It has to be noted as this result was obtained in a quite “optimal” situation, where ma-
nure is completely reused and recycled within the farm; therefore, it had no impact on
the modified MCI. As in the modified index at the moment we did not consider
crossed circularity, reuse of the manure externally would worsen the value. The result
seems also to support what some authors stated: the food system is still far to be com-
pletely circular, due to its openness and complexity, which generate material and nutri-
ent losses, partly impossible to recover (Van Zanten et al. 2019).
To have an idea of how much the obtained value can be considered good or bad, it is
possible to try a comparison with other examples reporting a MCI standard value. EM
Foundation (2015) reported different values of MCI for industrial products, ranging be-
tween 0.10 and 0.60. However, due to the problem of data sensitivity, the report did
not divulge the calculation behind results for many of these products, causing a direct
comparison difficult. Therefore, we can just affirm that the obtained value is in line
with general industrial items whose data are available. In our case, the linearity of the
process (LFI) is the crucial factor for the global results, while in the industrial products
proposed by EM foundation, there is also a great impact of the utility factor (X), which
severely affects the final result.
Comparing our results with literature about CE and agriculture, we found some con-
vergence. In their work, Van Hal et al. (2019) found that extensive livestock systems
are more circular than intensive ones, due to their ability to valorize feed from upcy-
cling processes. Although the approach used in the work is quite different, the results
go in the same direction: intensive rearing systems do not improve circularity.
Although the MCI is a good indicator for understanding the degree of circularity of a
product, it is not enough to understand the whole context. As suggested by EM Foun-
dation (2015), complementary indicators are required. They are additional indicators
that can be used alongside the MCI to offer further business management insight into
the product. Moreover, it is assumed that the increase of circularity reduces the use of
resources. Thus, another complementary analysis suggested is the Life Cycle
Rocchi et al. Agricultural and Food Economics (2021) 9:9 Page 9 of 13

Assessment (LCA) (ISO, 2006). The application of the LCA allows considering other
impacts not included in the MCI, as energy consumption in the process or the water
used for cleaning operations, which are not taken into account also by the modified
MCI. We performed an LCA study, based on the same MCI database, but we did not
integrate MCI with any indicators for business or risk model, as the case study is not
based on a specific firm. Moreover, since the LCA has been carried out for integrating
the analysis based on modified MCI, methodological details are not reported here.
Figure 3, reporting the LCA results, shows the most part of the impacts of poultry
production is devoted to the feed, which involves in particular the impact categories re-
spiratory inorganics, land use, and fossil fuels. The rearing phase is the second one for
importance and impacts, in particular for the categories: respiratory inorganics, acidifi-
cation, and climate change.
Putting the information coming from the modified MCI and LCA together, the inten-
sive broiler production confirms to be a production that is mainly linear, with high
consumption of resources. The LCA analysis showed the impact on land consumption
and fossil fuels, which are among the scarcer resources in the world. Feed production is
a key aspect in both the analysis. The high LFI, which derives from the feed process
mainly, has a great impact on the results of the MCI. On the other side, the LCA
showed the great impact of the feed in almost all the impact categories. Different rear-
ing systems may change the results, but in both the approaches, modified MCI and
LCA, the feed index greatly affects the results. This means that in case of organic pro-
duction we may have even worst results, due to the longer cycles and the lower effi-
ciency in meat production. However, this result can help in understanding how to
improve the circularity of the system. Shifting to a more circular rearing paradigm
means limiting the use of food as feed and increasing the use of by-products from the
food system and grass resources. This could positively affect the level of circularity, al-
though the modified MCI cannot completely capture it, in this current version. Differ-
ently, LCA can capture partially the aspect of by-product management, as the by-
products from the food system can be computed as avoided impact. The use of grass
resources, in particular in the case of marginal areas, is not captured and valorized nei-
ther by the MCI nor by the LCA approach. Another key aspect affecting the circularity
Fig. 3 Normalized results of intensive poultry system (1 tonne of living weight)
Rocchi et al. Agricultural and Food Economics (2021) 9:9 Page 10 of 13

and influencing the MCI value is the use of manure. In our application, all the manure
is reused or recycled. If we suppose to not use just a quarter of the total manure pro-
duced, the LFI would increase from 0.53 to 1.37, which means totally linear production.
Therefore, the use of manure within the farm is considered by the modified MCI, al-
though the manure contribution to close the loop of the nutrient is not fully valorized,
because aspects like fertility or structure of soil are not taken into account, in this
approach.
Moreover, integrating the results with other indicators based on scarcity of resources
and toxicity or risk of the production could be useful for a global evaluation of the sys-
tem. Also, a comparative valuation between different rearing systems could be useful,
applying multicriteria analysis, as it has been done using other types of indicators (Roc-
chi et al. 2019).
ConclusionsThe strategic importance of agriculture for mankind and its intense use of resources,
associated with the population growth path and climate change challenge, require to
re-think agriculture itself, and animal-based food production in particular. A circular
economy may lead the sector to a better strategic management than today.
In order to move the food system towards a more circular animal farming system, we
need circular economy metrics, suitable for the biological cycles. Such kind of metrics
is not yet developed; the method proposed in this article, which we called “modified
MCI,” tries to fill the gap in this direction, although some weak points are present. The
modified MCI applied to livestock production could be a useful indicator for giving a
first evaluation of the degree of circularity of rearing systems, and comparing different
types of rearing species.
Some aspects need a further development. The approach proposed here does not
consider the possibility of crossed circularity, as circularity is considered just within the
single rearing system. This choice was connected to the type of indicators at the mo-
ment available (micro-level indicators). However, for agricultural systems, meso-level
could be an interesting focus.
In the modified MCI, manure management generated a great advantage, due to its re-
using or recycling. However, its contribution in closing the loop of the nutrient was not
calculated. As closing the loop of nutrient is one of the key points of CE in agricultural
systems, this point should be improved in the future. Another aspect to be improved
should be the type of feed used by the animals. The modified MCI included the global
amount of feed expressed as quantity, without any consideration about the origin of it.
The use of by-products of the food system in the diet, in particular the no-edible ones,
is not valorized in any way in the MCI, although this would help in the global circular-
ity of the system.
The complexity of the agricultural system requires a complex set of metrics, for bet-
ter understanding the right direction for making production of food more circular. We
live in a planet with finite resources, including some strategic ones for the food produc-
tion: land, water, and nutrient. Complex assessments at micro, meso, and macro levels
will not lead to a solution, but they may guide us in re-thinking our way to approach to
food production.
Rocchi et al. Agricultural and Food Economics (2021) 9:9 Page 11 of 13

AbbreviationsCE: Circular economy; CEI: Circular Economy Index; CR: Fraction of the product collected for recycling; CU: Fraction ofthe product collected for reusing; CRA: Fractions of manure collected for recycling; CUA: Fractions of manure collectedfor reusing; EC: Efficiency rate of recycling; FR: Recycled fraction of the feedstock; FU: Reused fraction of the feedstock;FCR: Feed conversion rate; L/Lav: Length component; L: Lifetime of the product; Lav: Industry average lifetime; LCA: LifeCycle Assessment; LFI: Linear Flow Index; M: Final produced mass; Ma: initial mass; MA: Manure mass; MCI: MaterialCircularity Indicator; U/Uav: Intensity of the use; Uav: Industry functional units; U: Functional units; V: Virgin feedstock;W: Waste; W0: Unrecoverable waste; WC: Recycled waste; WF: Reused waste; X: Utility conversion factor MCI; XC: Utilityconversion factor modified MCI
AcknowledgementsNot applicable
Authors’ contributionsLR developed the modified MCI, performed the case study, and was a major contributor in writing the manuscript. LPperformed the LCA analysis to integrate the modified MCI and wrote the dedicated section. CC developed the “Casestudy: the poultry industry” section devoted to the case study and contribute to “Limitations and missing points” whileAB contributed to writing the introduction and conclusions. FFF contributed to revise the document. All the authorsread and approved the final manuscript.
FundingNot applicable
Availability of data and materialsThe datasets used during the current study are available from the corresponding author on reasonable request.
Competing interestsThe authors declare no competing interests.
Received: 27 August 2019 Revised: 30 April 2020Accepted: 28 January 2021
ReferencesÅkerman E (2016) Development of circular economy core indicators for natural resources: analysis of existing sustainability
indicators as a baseline for developing circular economy indicators. Ind Ecol R Inst TechnolAlidadi H, Salmani ER, Hamidi MR (2017) Assessing fat and aquaculture feed recyclable from chicken wastes of poultry
slaughterhouse in Bojnoord, North Khorasan Province. Iran. Arch Agric Environ Sci. https://doi.org/10.26832/24566632.2017.020404
Boggia A, Paolotti L, Antegiovanni P, Fagioli F.F, Rocchi L. (2019) Managing ammonia emissions using no-litter flooringsystem for broilers: environmental and economic analysis. Environ Sci Policy101: 331-340
Castellini C, Boggia A, Cortina C et al (2012) A multicriteria approach for measuring the sustainability of different poultryproduction systems. J Clean Prod 37:192–201. https://doi.org/10.1016/j.jclepro.2012.07.006
Cayzer S, Griffiths P, Beghetto V (2017) Design of indicators for measuring product performance in the circular economy. Int JSustain Eng. https://doi.org/10.1080/19397038.2017.1333543
Cottle DJ, Pitchford W (2014) Production efficiency. In ‘Beef cattle production and trade’. (Eds DJ Cottle, LP Kahn) (CSIROPublishing: Melbourne)
Di Maio F, Rem PC (2015) A robust indicator for promoting circular economy through recycling. J Environ Prot. Irvine, Calif.https://doi.org/10.4236/jep.2015.610096
Di Maio F, Rem PC, Baldé K, Polder M (2017) Measuring resource efficiency and circular economy: a market value approach.Resour Conserv Recycl. https://doi.org/10.1016/j.resconrec.2017.02.009
EEA (2018) Environmental indicator report 2018. Available online https://www.eea.europa.eu/airs/2018/resource-efficiency-and-low-carbon-economy/food-consumption-animal-based
Elia V, Gnoni MG, Tornese F (2017) Measuring circular economy strategies through index methods: a critical analysis. J CleanProd. https://doi.org/10.1016/j.jclepro.2016.10.196
EM Foundation (2012) Towards a circular economy - economic and business rationale for an accelerated transition. GreenerManag Int. https://doi.org/2012-04-03
EM Foundation (2015) Project overview: an approach to measuring circularity. Ellen MacArthur Found. https://doi.org/10.1016/j.giq.2006.04.004
Figge F, Thorpe AS, Givry P et al (2018) Longevity and circularity as indicators of eco-efficient resource use in the circulareconomy. Ecol Econ. https://doi.org/10.1016/j.ecolecon.2018.04.030
Franklin-Johnson E, Figge F, Canning L (2016) Resource duration as a managerial indicator for circular economy performance.J Clean Prod. https://doi.org/10.1016/j.jclepro.2016.05.023
Genovese A, Acquaye AA, Figueroa A, Koh SCL (2017) Sustainable supply chain management and the transition towards a circulareconomy: evidence and some applications. Omega (United Kingdom). https://doi.org/10.1016/j.omega.2015.05.015
Gerber P, Chilonda P, Franceschini G, Menzi H (2005) Geographical determinants and environmental implications of livestockproduction intensification in Asia. Bioresour Technol 96:263–276. https://doi.org/10.1016/j.biortech.2004.05.016
Gerber P, Opio C, Steinfeld H (2007) Poultry production and the environment-a review. FaoInternational Organization for Standardization (2006) Environmental management – life cycle assessment: principles and
framework. ISO, pp. 14040.Kirchherr J, Reike D, Hekkert M (2017) Conceptualizing the circular economy: an analysis of 114 definitions. Resour. Conserv.
Recycl.
Rocchi et al. Agricultural and Food Economics (2021) 9:9 Page 12 of 13

Kristensen HS, Mosgaard MA (2020) A review of micro level indicators for a circular economy – moving away from the threedimensions of sustainability? J. Clean. Prod
Linder M, Sarasini S, van Loon P (2017) A metric for quantifying product-level circularity. J Ind Ecol. https://doi.org/10.1111/jiec.12552
Lonca G, Muggéo R, Imbeault-Tétreault H et al (2018) Does material circularity rhyme with environmental efficiency? Casestudies on used tires. J Clean Prod. https://doi.org/10.1016/j.jclepro.2018.02.108
Mariani A, Viganò E (2013) Fair Trade: A renewable model for sustainable development. Rev Stud Sustain:149–161Moraga G, Huysveld S, Mathieux F et al (2019) Circular economy indicators: what do they measure? Resour Conserv Recycl.
https://doi.org/10.1016/j.resconrec.2019.03.045Mottet A, de Haan C, Falcucci A et al (2017) Livestock: on our plates or eating at our table? A new analysis of the feed/food
debate. Glob Food Sec 14:1–8. https://doi.org/10.1016/J.GFS.2017.01.001Murray A, Skene K, Haynes K (2017) The circular economy: an interdisciplinary exploration of the concept and application in a
global context. J Bus Ethics. https://doi.org/10.1007/s10551-015-2693-2Notarnicola B, Tassielli G, Renzulli PA et al (2017) Environmental impacts of food consumption in Europe. J Clean Prod.
https://doi.org/10.1016/j.jclepro.2016.06.080Parchomenko A, Nelen D, Gillabel J, Rechberger H (2019) Measuring the circular economy - a multiple correspondence
analysis of 63 metrics. J Clean Prod. https://doi.org/10.1016/j.jclepro.2018.10.357Pauliuk S (2018) Critical appraisal of the circular economy standard BS 8001: 2017 and a dashboard of quantitative system
indicators for its implementation in organizations. Resour Conserv Recycl. https://doi.org/10.1016/j.resconrec.2017.10.019Rocchi L, Paolotti L, Rosati A et al (2019) Assessing the sustainability of different poultry production systems: a multicriteria
approach. J Clean Prod 211:103–114. https://doi.org/10.1016/J.JCLEPRO.2018.11.013Sauvé S, Bernard S, Sloan P (2016) Environmental sciences, sustainable development and circular economy: alternative
concepts for trans-disciplinary research. Environ Dev. https://doi.org/10.1016/j.envdev.2015.09.002Scheepens AE, Vogtländer JG, Brezet JC (2016) Two life cycle assessment (LCA) based methods to analyse and design
complex (regional) circular economy systems. Case: making water tourism more sustainable. J Clean Prod. https://doi.org/10.1016/j.jclepro.2015.05.075
Seidavi AR, Zaker-Esteghamati H, Scanes CG (2019) Present and potential impacts of waste from poultry production on theenvironment. Worlds. Poult. Sci. J.
van Hal O, de Boer IJM, Muller A et al (2019) Upcycling food leftovers and grass resources through livestock: impact oflivestock system and productivity. J Clean Prod. https://doi.org/10.1016/j.jclepro.2019.01.329
Van Zanten HHE, Van Ittersum MK, De Boer IJM (2019) The role of farm animals in a circular food system. Glob Food Sec.https://doi.org/10.1016/j.gfs.2019.06.003
Zhijun F, Nailing Y (2007) Putting a circular economy into practice in China. Sustain Sci 2:95–101. https://doi.org/10.1007/s11625-006-0018-1
Publisher’s NoteSpringer Nature remains neutral with regard to jurisdictional claims in published maps and institutional affiliations.
Rocchi et al. Agricultural and Food Economics (2021) 9:9 Page 13 of 13