measuring and modeling solar irradiance on vertical … list of figures 3-1 the radiometer tower at...
TRANSCRIPT

SERI/TR-215-2525UC Categories: 59, 62DE86010737
Measuring and Modeling SolarIrradiance on Vertical Surfaces
E. L. MaxwellT. L. StoffelR. E. Bird
July 1986
Prepared under Task No. 3738.10FTP No. 468
Solar Energy Research InstituteA Division of Midwest Resear ch Inst itute
1617 Cole BoulevardGolden , Colorado 80401
Prepared for the
U.S. Department of EnergyContract No. DE-AC02-83CH10093

NOTICE
This report was prepared as an account of work sponsored by the United States Government. Neither theUnited States nor the United States Department of Energy, nor any of their employees, nor any of theircontractors, subcontractors, or their employees, makes any warranty, expressed or implied, or assumes anylegal liability or responsibility for the accuracy, completeness or usefulness of any information, apparatus,product or process disclosed, or represents that its use would not infringe privately owned rights.
Printed in the United States of AmericaAvailable from:
National Technical Information ServiceU.S. Department of Commerce
5285 Port Royal RoadSpringfield, VA 22161
Price: Microfiche A01Printed Copy A03
Codes are used for pricing all publications. The code is determined by the number of pages in the publication.Information pertaining to the pricing codes can be found in the current issue of the following publications,which are generally available in most libraries: Energy Research Abstracts, (ERA); Government ReportsAnnouncements and Index (GRA and I); Scientific and Technical Abstract Reports (STAR); and publication,NTIS-PR-360 available from NTIS at the above address.
1
TR-2525
PREFACE
This report presents the first evaluations of five algorithms for convertingthe solar energy parameters most widely available from the national climaticdata archives (global horizontal and direct normal solar irradiance) to globalirradiance on tilted surfaces using measurements from the Solar RadiationResearch Laboratory (SRRL) at the Solar Energy Research Inst i tute (SERI).This evaluation was prepared by the Resource Assessment and InstrumentationBranch, Solar Electric Research Division. Support for this research wasprovided by the U.S. Department of Energy through the Passive Solar Program atthe SERT Solar Heat Research Division.
The authors wish to recognize the following people for constructive technicalreview: Jay Burch, Roland Hulstrom, Kerri Hunter, and Claude Robbins of SERI;John Hay of the University of British Columbia; and Richard Perez of the StateUniversity of New York at Albany.
Approved for the
SOLAR ENERGY RESEARCH INSTITUTE
filL:jL/~Roland L. Hulstrom, ManagerResource Asses sment andInstrumentation Branch
~~. Stone, DirectorL..----Solar Electric Research Division
iii

TR-2525
SUMMARY
Objective
This report presents the first evaluations of five algorithms for convertingglobal horizontal and direct normal solar irradiance components to globali r r ad i ance on tilted surfaces using measurements from the Solar RadiationResearch Laboratory (SRRL) at the Solar Energy Research Institute (SERI).
Discussion
High resolution (l5-min) measurements from eight thermopile radiometersoriented vertically in the four cardinal directions were available for a169-day period ending 31 December 1984. Concurrent measurements of globalhorizontal and direct normal solar irradiance components were also used forthe analysis. The pyranometers used in the experiment were intercompared onhorizontal, north-facing, and south-facing vertical orientations before theirdeployment. The convers ion algori thms each at tempt to account for verycomplex atmospheric interactions with incoming solar radiation. The sky andground radiance contributions to tilted surface irradiance are assumed to beisotropic, anisotropic, or a combination of the two regimes depending on thealgorithm.
Conclusions
Results from the analysis of solar irradiance measurements on verticalsurfaces for the period 22 July through 4 September indicate a generaloverestimate (18%-46.5%) of solar irradiance on north-facing surfaces by allfive algorithms. The best agreement with measured data was demonstrated forsouth-facing surfaces where all but one algorithm were within the presentmeasurement accuracy (±5%). Estimates of global irradiance on east- and westfacing vertical surfaces ranged from slightly underpredicting (-3%) tooverpredicting by as much as 23% of the observed IS-min data. Future researchshould emphasize the collection of data similar to that being obtained atSRRL, which will lead to greater understanding of atmospheric processes anddiffuse sky irradiance distributions.
LV

TR-2525
TABLE OF CONTENTS
1.0 Introduction . 1
2.0 Algorithm Descriptions •••••••••••• 2
Ground-Reflected Term ••••••••••••••••••••••••••••••
2223444566
Isotropic ..
Perez ..
Klucher ..Hay ..
Temps and Coulson.2.3.12.3.2
Direct Solar Beam Term....................... • •••••••••••••••Diffuse Sky Terms • • • • • • • • • • • • • • • • • • • • • • • • • • • • • • • • • • • • •2.2.1 Isotropic.................................... . .2.2.2 Temps and Coulson •••••••••••••••••••••••••••••••••••••••2.2.32.2.42.2.5
2.3
2.12.2
3.0 Measurements at SRRL •••••••••••••••••••••••••••••••••••••••••••••••• 7
3.13.23.3
Sensor Calibrations ••••••••••••••••••••••••••••••••••••••Data Collection and Processing......................... • •••••Data Plots " ..
71313
4.0 Evaluation of the Algorithms ••••••••••••••••••••••••• 17
4.14.24.3
Intercomparisons of the Algorithms •••••••••••••••••••••••••••Summary of Work by Perez ••••••••••••••••••••••••••••••••••Evaluations Using Data Collected at SRRL ••••••••••••••••••
171718
5.0 Summary and Conclusions ••••••••••••••••••••••••••••••••••••••••••••• 25
6.0 References .. 27
v

TR-2525
LIST OF FIGURES
3-1 The Radiometer Tower at the SERI Solar Radiation ResearchLaboratory on South Table Mountain, Golden, Colo................... 8
3-2 Locations of Pyranometers on Radiometer Tower for Measuring SolarIrradiance on Vertical Surfaces.................................... 9
3-3 Pyranometer Comparisons using Tilt Table Mounting Platform in a(a) Horizontal Position and (b) Vertical South-Facing position..... 10
3-4 Results of Pyranometer Comparisons using Tilt Table MountingPlatform in Horizontal (0), South-Facing (S), and North-Facing (N)Vertical Pos i t i ons s , , •••• •••• •••••••••••• ••••••••• •••• ••••• ••• ••••• 11
3-5 A Selected Clear Day (10 August 1984) of IS-min AveragedMeasurements from Data Set #1 •••••••••••••••••••••••••••••••••••••• 14
3-6 Measurements for a Selected Overcast Day (Cirrostratus Clouds)from Data Set fF1................................................... 14
3-7 Measurements for a Selected Day from Data Set #2 ••••••••••••••••••• 15
3-8 Measurements from a Partly Cloudy Day in Data Set #2 ••••••••••••••• 16
3-9 Typical Diurnal Pattern of Ground Albedo Measurements •••••••••••••• 16
4-1a Solar Component Measurements for 6 September 1984 (Day 250) •••••••• 22
4-1b Comparison of Measured Data for North-Facing Vertical Surfaceon September 6, 1984 and Tilt Model Estimates •••••••••••••••••••••• 22
4-2a Solar Component Measurements for 7 September 1984 (Day 251) •••••••• 23
4-2b Comparison of Measured Data for North-Facing Vertical Surfaceon 7 September 1984 and Tilt Model Estimates ••••••••••••••••••••••• 23
4-3 Comparison of Measured Data for North-Facing Vertical Surfaceon 6 September 1984 (clear sky) with Isotropic and AnisotropicModel Estimates •••••••••••••••••••••••••••••••••••••••••••••••••••• 24
4-4 Comparison of Measured Data for North-Facing Vertical Surfaceon 7 September 1984 (partly cloudy sky) with Isotropic andAnisotropic Model Estimates •••••••••••••••••••••••••••••••••••••••• 24
vi

TR-2525
LIST OF TABLES
2-1 Insolation Conversion Algorithms.................................... 3
3-1 Results of Pyranometer Comparisons on Tilt Table •••••••••••••••••••• 12
4-1 Model Comparisons, North Facing-gOO Tilt •••••••••••••••••••••••••••• 17
4-2 Summary of the Models' Performance •••••••••••••••••••••••••••••••••• 19
4-3 Conversion Algorithm Performance during 41 Days ••••••••••••••••••••• 20
4-4 Average Daily Total Irradiance on Vertical Surfaces Measured atSRRL during the Period 23 July-4 September 1984 ••••••••••••••••••••• 20
VIl

1.0 INTRODUCTION
Passive solar heating, cooling, and daylighting systems utilize buildingapertures and external surfaces (walls) to collect or reject incident solarradiation. Those surfaces can generally be characterized in designperformance simulations as flat plate collectors having a wide range oforientations described by various combinations of azimuth and elevationangles. Available solar radiation resource data for input to thesesimulations are limited to the historical measurements of global irradiance(direct solar beam plus diffuse sky irradiance components) on an unobstructedhorizontal surface (SERI 1981a). Therefore, algorithms are needed to convertthese measured values to estimates of the irradiance available to planesurfaces of any orientation. Several candidate conversion algorithms exist(Hay and McKay 1985). Their accuracy for other than south-facing orientationsand application for a variety of climates continues to be a topic of research.
The FY 1984 objectives for this task were
• To evaluate the capability of existing conversion algorithms to estimateirradiance on N-E-S-W vertical surfaces
• To initiate the measurement of irradiance on N-E-S-W vertical surfaces tosupport the evaluation and development of conversion algorithms.
Initial plans called for three approaches to the evaluation of existing conversion algorithms:
1. Intercompari son of the performance of the algori thms under various hypothetical atmospheric conditions.
2. Comparison of actual measured data collected at universities participatingin the Department of Energy's Solar Energy Meteorological Research TrainingSites (DOE/SEMRTS) program (SERI 1981b, 1982) with estimated values fromthe algorithms.
3. Comparison of measured data collected at SERI' s Solar Radi a t ion ResearchLaboratory (SRRL) with estimated values from the algorithms.
The first approach was abandoned because of its limited usefulness to thevariety of climates encountered in a general application of the alorithms.
Shortly after the task was undertaken it was determined that the secondapproach had already been used at the Atmospheric Sciences Research Center,State University of New York, Albany (Perez and Stewart 1984; Stewart andPerez 1984). Rather than duplicating their effort, we put greater effort intothe collection of irradiance data at SRRL and the use of that data for thethird approach given above.

2.0 ALGORITHM DESCRIPTIONS
In general, conversion algorithms take the form
(2-1)
where
Ir(S,$) = the total irradiance on a tilted surfaceI 8(B,$) = the direct solar beam irradiance on the surfaceIn(S,$) = the diffuse sky irradiance on the surfaceIG(B,$) = the ground reflected irradiance on the surface
B = the surface tilt angle (measured from the horizontal)$ = the surface azimuth angle relative to the sun.
The five algorithms evaluated are listed in Table 2-1, which also defines thegeneral character of the diffuse sky and ground terms.
2.1 Direct Solar Beam Term
The direct solar beam term for each of the five algorithms 1S identical and 1S
expressed by
I8(B,$) = I cos 8 ,
where
I = the intensity of the direct normal (beam) irradiancea = the incidence angle of the direct normal on the surface.
(2-2)
The direct normal is measured using a tracking pyrheliometer. The 5.7 0 fieldof view of most pyrheliometers encompasses the entire solar disk (0.5°) andmost of the circumsolar region around the sun, which is produced by theforward scattering of radiation by the atmosphere.
2.2 Diffuse Sky Terms
The diffuse sky terms are different for each of the algorithms evaluated. Thesimple isotropic term used by Liu and Jordan (1960) is described first, thenthe anisotropic modifiers of the other models are discussed.
2.2.1 Isotropic
The diffuse sky term of the algorithm is often referred to simply as theisotropic algorithm and is expressed as
In(a) = 1/2 In(O)(l + cos a) ,
2
(2-3)

Table 2-1. Insolation Conversion Algorithms
Algorithm
IsotropicTemps and CoulsonK1ucherHayPerez
where
Diffuse Sky Term
Clear or cloudy and isotropicClear only and anisotropicClear or cloudy and anisotropicClear or cloudy and anisotropicClear or cloudy and anisotropic
Ground Term
IsotropicAnistropicNoneIsotropicNone
ID(O) = the measured diffuse sky irradiance on a horizontal surface (6 0)6 = the surface tilt angle.
This expression assumes uniform radiance from each portion of the sky, i.e.,isotropic diffuse irradiance from all directions above the surface, resultingin no dependence on azimuth angle, ~.
2.2.2 Temps and Coulson
Temps and Coulson (1977) added a degree of complexity to the isotropic diffusesky term:
ID{S) (2-4)
where
a = the angle of incidence of the direct beam on the surfaceZ = the solar zenith angle.
(2-5)
(2-6)
MI is an anisotropic modifier to account for horizon brightening, and M2 is ananisotropic modifier to account for the brightening around the solar disk{circumsolar radiation}. M2 is a potential sOurce of error since themeasurement of the direct normal beam (I) encompasses a large part of thecircumso1ar radiation. Note also that M2 does not include any means toaccount for the increase in circumso1ar radiation with the onset of cloudcover, which eventually leads to an anisotropic sky under overcast conditions.It is for this reason that the Temps and Coulson algorithm is applicable toonly clear conditions. Under overcast skies there is horizon "darkening"-another reason why the Temps and Coulson algorithm is inappropriate for otherthan clear sky conditions.
3

TR-2525
2.2.3 Klucher
A refinement of the diffuse sky term provided by Klucher (1978) adds a cloudiness function (F) to the Temps and Coulson algorithm; i.e.,
where
M3 = [1 + F sin3( a/ 2 ) ]
M4 = [1 - F cos 2e sin3Z]
F = {I - [ID(O)/1T(O)]2}
(2-7)
(2-8)
(2-9)
(2-10)
An examination of the cloudiness function reveals that under overcast skies[ID(O) = IT(O)] the Klucher diffuse sky term reduces to the isotropic term ofLiu and Jordan, as was the intent.
2.2.4 Hay
The diffuse sky term described by Hay and Davies (1978) also provides foranisotropy by considering both circumsolar and isotropic terms. The diffusesky term in the Hay algorithm is expressed as
ID(8) = 1D(O)[(1 cos ell o cos Z) + 1/2(1 + cos a) (1 - 1/1 0 ) ] , (2-11)
where
I = the direct normal (beam) irradiance from the sun1
0= the extraterrestrial direct normal (beam).
The first term inside the brackets represents circumso1ar radiation whoseintensity is a function of atmospheric transmissivity (1/1
0) , the angle of
incidence of the direct beam, and the solar zenith angle. The inverse relation with cos Z represents an increase in circumso1ar radiation with anincrease in airmass (increasing solar zenith angle). The second term represents the isotropic radiation from the sky that increases with decreasingtransmissivity; i.e., with increasing turbidity or cloud cover. Note that theHay algorithm simplifies to the isotropic case for overcast conditions.
2.2.5 Perez
This algorithm, like the K1ucher and the Temps and Coulson algorithms,accounts for horizon brightening as well as circumso1ar radiation (Perez andStewart 1984). This is accomplished by describing the sky dome as isotropicexcept for a circular region of variable size around the sun and a horizontalband of variable height at the horizon. The equation for the diffuse sky termof the Perez algorithm is
4

TR-2525
1/2(1 + cos 8) + 2(F 1 - 1)(1 - cos a)Zc
In(O) 1 + 2(F1
1)(1 cos a)Zh
(2-12)+ 2(F
2- 1) ~/~ sin ~t
+ 1/2(1 - cos 2~)(F2 - 1) ,
where
F1 =
F2Ct. =
~
~' =
Zc =
the ratio of the radiance in the circumsolar region to isotropic skyradiancethe ratio of the radiance in the horizon band to the isotropic skythe half angle width of the circumsolar regionthe angular width of the horizon bandthe altitude angle of the apex of the horizon band with respect to thetilted surfacecos 6 [0 < 6 < (~/2 - Ct.)]
(Xc Sln Xc)Zc (~/2 - Ct.) < a < (~/2 + ex)]
Ct.
Zc 0 [8 > (~/2 + Ct.)]
Xc = (~/2 + ex - 6)/2
6 = angle of incidence of circumsolar radiation on a tilted surface
Zh = cos Z [0 < Z < (~/2 - Ct.)]
Zh(XhsinXh) [Z > (~/2 - a)]=
ex
Xh = (~/2 + ex - Z)/2
Z = angle of incidence of circumsolar radiation on a horizontal surface.
The terms F1 and F2 are empirically derived from measured data at the locationof interest. They are a function of the solar zenith angles, ID(O) and 1(0),and are available in the form of 5 x 6 x 7 matrices. The empirlcal nature ofthese terms is a distinct limitation of data sets similar to those at theState University of New York at Albany.
2.3 Ground-Reflected Term
The approach for estimating the contribution of ground-reflected solarirradiance can be classified as either isotropic (uniform with respect todirection) or anisotropic (directional). The Klucher algorithm was developedfrom data collected from pyranometers shielded from this radiation componentby artificial ground planes and therefore does not account for either case.With the exception of the Temps and Coulson algorithm, which accounts for theazimuthal dependence of the ground-reflected components, the remainingalgorithms assume isotropy for this term in Eq. 2-1.
5
TR-2525
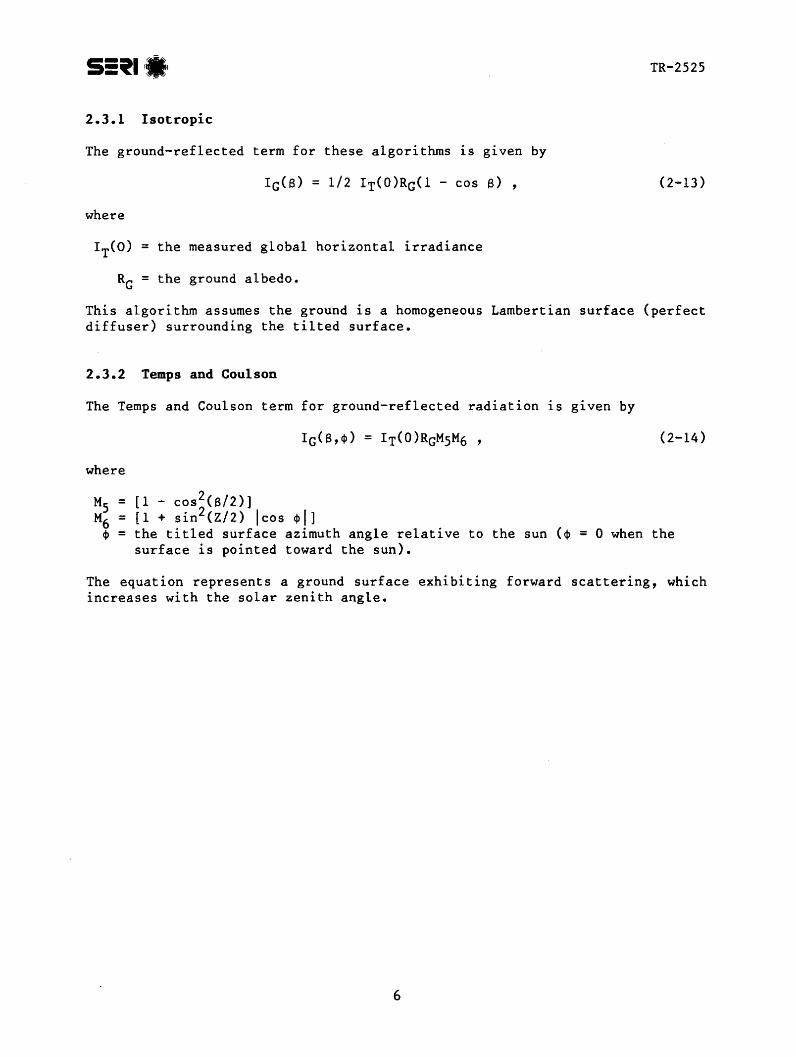
2.3.1 Isotropic
The ground-reflected term for these algorithms is given by
IC(S) = 1/2 IT(O)RC(1 - cos S) ,
where
IT(O) = the measured global horizontal irradiance
RC = the ground albedo.
(2-13)
This algorithm assumes the ground is a homogeneous Lambertian surface (perfectdiffuser) surrounding the tilted surface.
2.3.2 Temps and Coulson
The Temps and Coulson term for ground-reflected radiation 1S given by
(2-14)
where
MS = [1 - cos 2( s / 2) ]M6 = [1 + sin2(Z/2) Icos ~I]~ = the titled surface azimuth angle relative to the sun (~ = 0 when the
surface is pointed toward the sun).
The equation represents a ground surface exhibiting forward scattering, whichincreases with the solar zenith angle.
6

3.0 MEASUREMENTS AT SRRL
Pyranometers were installed at the Solar Radiation Research Laboratory (SRRL)using the radiometer tower designed for monitoring solar irradiance on vertical surfaces oriented in the four cardinal directions (Figure 3-1). Theinstruments were positioned to measure the global irradiance on each of thefour vertical surfaces as well as the diffuse sky and ground-reflected components for the north- and south-facing orientations. Global horizontal andground-reflected i r r ad i ance on downward-facing horizontal surfaces completethe list of ten Eppley PSP pyranometers deployed for the experiment. Thearrangement of sensors, artificial horizons, and radiation baffles toaccomplish the measurements is shown in Figure 3-2.
In addition to the array of sensors set up for this task, SRRL routinely monitors global horizontal, d i rect normal, and diffuse horizontal irradiances.These data provide the inputs corresponding to each term in the conversionalgorithm (Eq. 2-1). In addition to the irradiance values, ground albedo iscalculated by ratioing the downward-looking horizontal data wi th the globalhorizontal data.
3.1 Sensor Calibrations
All of the Eppley PSPs used for this task were calibrated and intercompared byplac ing them on a large til t table wi th SERI t S working standard PSP andcollecting simultaneous global data for horizontal, south-facing vertical, andnorth-facing vertical planes as shown in Figure 3-3. Note the presence ofwhite "collars," which were installed around the instrument body below the sunshade. These units provide additional shielding of the instrument body, whichserves as the reference cold junction for the thermopile sensor, from thedirect radiation. This reduces the presence of thermal gradients when thepyranometer is mounted in other than a horizontal position. The collars wereused during all intercomparisons and final installation on the radiometertower. Several days of I-min data were obtained and analyzed for eachorientation. The calibration results are summarized in Table 3-1.
From these data, the selection of PSPs for each position on the radiometertower was made so as to minimize differences among sensors for which data comparisons would be critical. A minimum of two days of measurements for eachtilt table orientation (horizontal, vertical north-facing, and vertical southfacing) was analyzed. Instrument selection was based on the minimum relativevariance of the I-min ratios of the output signal from the test pyranometer(millivolts) to the irradiance measured by the SERI reference pyranometer(watts per square meter). The calibration factor for each instrument wasdetermined from this ratio. The mean value (calibration factor) and standarddeviation of this ratio were computed for three groups of data determined bythe tilt table orientations. The relative variance of the calibration factorwas computed for each instrument using the formula: Relative Variance = 100 x
Standard Deviation/Mean.
The relative performance of the test pyranometers with respect to the reference unit is shown in Figure 3-4. The varability of the calibration
7


TR-2525
141210
Verticalnorth-facing
\
2
..--....,.-....,...-.,....---,--..,....---,~-.,..-...,---....,.-....,...-.,....-'"
~
0.8
0.4
3.2
PSP INTERCOMPARISONS: TILT TABLEAPRIL 4-13 9 1984
INSTRUMENTNUMBER
123456789
10111213
SERIALNUMBER
13674F317798F317799F317800F317362F317879F318035F318036F318039F3lR040F318078F3200h8F320079F3
MEASUREMENTPARAMETER
(Not Used)South-SkyNorth-skyNorth-GroundSouth-GroundSouth-GlobalAlbedo'Illes t-G1oba1North-GlobalDiffuse HorizontalEast-Global(Not Used)Global Horizontal
Figure 3-4. Results of Pyranometer Comparisons using Tilt Table MountingPlatform in Horizontal (0), South-Facing (S), and Horth-Facing(H) Vertical positions. Installation of instruments of theradiometer tower (measurement parameter) was determined fromthese data.
11

Table 3-1. Results of Pyranometer Comparisons on Tilt Table
Calibration Factor (~V!Wm-2) % DifferencePyranometerSerial No.
MeasurementParameter Factory Horizontal South North South North
17799
17800
18039
18078
17798
17862
17879
18036
18035
20079
18040
13674
20068
North-sky
North-ground
North-global
East-global
South-sky
South-ground
South-global
West-global
Albedo
Horizontal
Diffuse
Not used
Not used
8.50
9.17
8.37
10.17
8.35
8.31
9.00
7.99
8.63
10.50
8.95
10.73
10.57
8.37
9.16
8.30
10.01
8.38
8.34
9.06
7.89
8.64
10.20'1~
8. 70'~
10.94
10.36
8.50
9.24
8.31
10.09"'~
8.22'·~
8.3S'·~
9.01":
7 •90"~
8.58
10.33
8.77
10.57
10.52
8.51"':
9 • 15"':
8.28*
9.69
8.28
8.19
8.87
7.80
8.45'·~
9.85
8.44
10.89
9.97
1.55
-0.87
-0 .12
-0.80
1. 91
-0.12
0.55
-0.13
0.69
-1.27
-0.80
3.40
-1.54
1.67
0.11
0.24
3.19
1.19
1.80
2.10
1.14
2.20
3.43
2.99
0.46
3.76
Measurement parameterFactory calibrationHorizontal
South
North
% Difference{*}
final instrument orientation for continuous monitoringEppley Laboratory's indoor sphere determinationcomparison with SERI Reference PSP 17860, tilt table inhorizontal positioncomparison with SERI Reference PSP 17860, tilt table Insouth-facing vertical positioncomparison with SERI Reference PSP 17860, tilt table Innorth-facing vertical posltlon100 x (horizontal - vertical}!horizontalcalibration factor used for continuous monitoring
factor depends on the particular instrument and its orientation. The abilityof the instrument to view the direct (beam) radiation component appears tominimize the relative performance differences between all instruments and theSERI reference pyranometer. The reference pyranometer may itself undergochanges in sensitivity when instrument orientation, ambient air temperature,solar irradiance levels, or other factors change. These intercomparisons cannot ensure the absolute measurement accuracy of the pyranometers. The overallagreement of the calibrations is within the generally accepted tolerance of±5% for these thermopile instruments (SERI 1982b).
The selection of pyranometer orientation/location on the radiometer tower wasbased on the results shown in Figure 3-4. For example, the three north-facingsensors were selected from those that compared best on a north-facing plane.The calibration factors for the east- and west-facing pyranometers were determined from the tilt table comparisons exhibiting the least relative variance
12

TR-2525
from the reference instrument after select ing the north- and south-fac inginstruments. The cosine response of the east- and west-facing pyranometers isparticularly important since the irradiance levels are generally high nearsolar noon when the sun is setting or rising (incidence angle = 900 ) on theseinstruments.
3.2 Data Collection and Processing
Plans called for the simultaneous collection of I-min data from all nine sensors in the test array, plus the three baseline monitors. However, this taskwas initiated during the transition period between the operation of an interimresearch laboratory and the establishment of a permanent facility at SRRL.SRRL has yet to become fully operational; and therefore, data collection hasbeen limited to IS-min data from seven sensors at a time. At this time, thefollowing data sets have been collected:
Data Set No.1
(from 22 July to 4 Sept. 1984)
Global horizontalDirect normalGlobal north verticalGlobal east verticalGlobal south verticalGlobal west verticalGround reflected horizontal
Data Set No.2
(from 5 Sept. to 30 Sept. 1984)
Global horizontalDirect normalDiffuse horizontalGlobal south verticalGlobal north verticalSky north verticalGround north vertical
In the near future, a much improved data acquisition capability will be inoperation at SRRL. This will permit the collection of data from all sensorsat the same time with any desired integration time. The results in thisreport have been derived from the two data sets noted above.
3.3 Data Plots
Figures 3-5 and 3-6 are plots of typical data from data set No.1. Figure 3-5shows the symmetry of a very clear day on 10 August 1984. It is particularlyinteresting to note that in the absence of the direct beam because of surfaceorientation, the irradiance on all four surfaces is about the same. Furthermore, on this midsummer day, the daily total energy received on east, south,and west vertical surfaces is about the same (17.9, 13.5, and 17.5 MJ/m2,
respectively).
The irradiance received on a cloudy day, 6 August 1984, is shown in Figure 3-6. Some direct beam irradiance was recorded between 0500 and 0800; butthereafter, the sun did not shine on the SRRL. Between 0800 and 1030, a lowheavy overcast developed. This cloud cover thinned out between 1030 and 1330,but was more or less uniform across the sky dome. These recorded observationsare confirmed by the variations in irradiance shown in Figure 3-6.
Data for a clear day and partly cloudy day from the second data set are shownin Figures 3-7 and 3-8, respectively. On the clear day, an interesting relationship is observed between the north-vertical diffuse sky irradiance and the
13
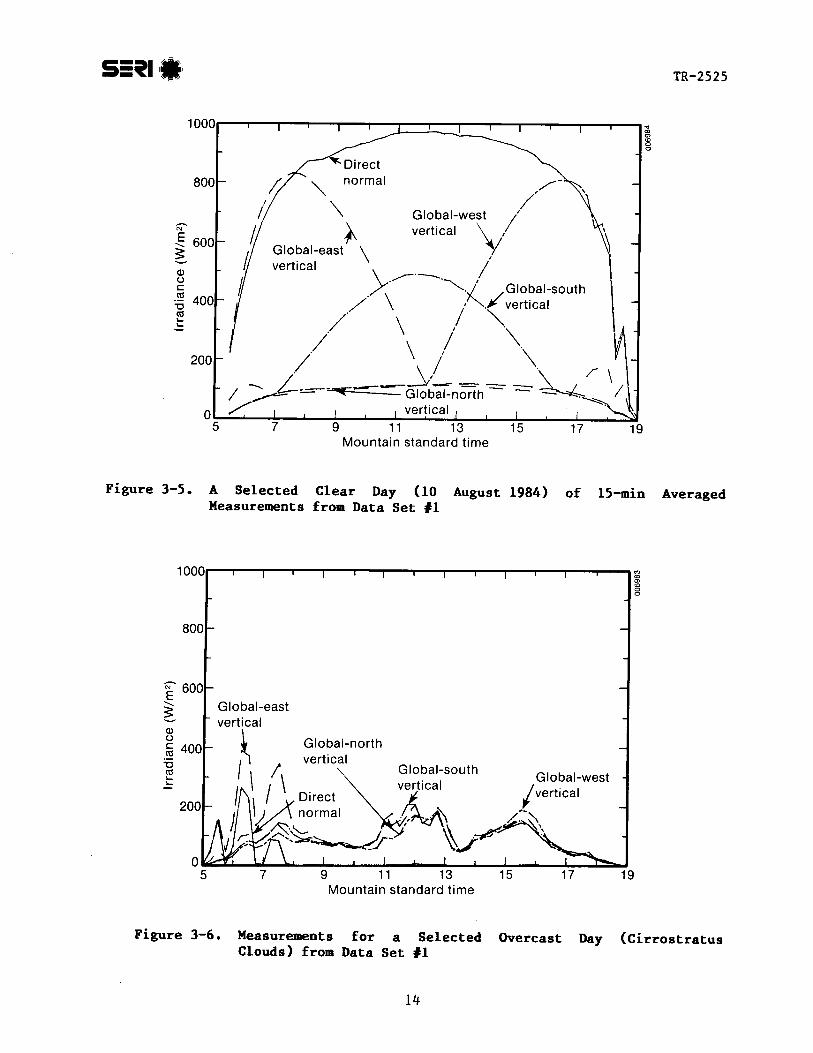

TR-2525
north-vertical ground-reflected irradiance. In early morning and late afternoon the diffuse sky irradiance reaches a maximum and is greater than theground-reflected irradiance. By midmorning, the ground-reflected irradianceis about twice the diffuse sky. This is, of course, consistent with thegradual increase in the i rradiance on horizontal surfaces as shown on thefigure. The region around the tower was a natural surface with grass, forbs,and some bare soil showing. At this time of year, the vegetation is mostlysenescent. The measured albedo just two days earlier is shown in Figure 3-9.
Figure 3-8 presents an even more interesting situation. Early in the morninga cold front moved through the area producing a dark layer of a I to-stratusclouds that moved from the northwest early in the morning until most of thesky was covered by 0830. These stratus clouds produced a sky irradiance thatwas approximately double the ground-reflected component, just the opposite ofthe relative levels observed on the previous clear day. At about 1230, thisstratus condition began to break up, and at about 1315, we noted a crossoverof the sky and ground components. The presence of alto-cumulus in the afternoon produced the jagged appearance of the direct normal and maintained thediffuse sky irradiance at about the same level as the ground-reflected term.
CDoc::co:0 400col...l...
/-----\ I'. r~/' 'v v \
/ I
/ f,--.,/ Global \
, horizontal '\/ \
, \/ I
,/ \~'"/ North-sky '\
II North-ground vertical Nor~h-global •
, vertical_.__._\-....·_·~~.L. \.1-·-'-1:. - - - -t- - - - ~~.~.-:::.::- -e:- _ _ _ _ - - - ~ "-- 7 9 11 13 15 17
Mountain standard time19
Figure 3-7. Measurements for a Selected Day from Data Set #2. Clear sky inthe morning with thin cirrus clouds in the afternoon.
15


4.0 EVALUATION OF THE ALGORITHMS
The conversion algorithms described in Section 2.0 have been evaluated inseveral ways. First, an intercomparison of the models under different atmospheric conditions reveals certain characteristics such as their regression toan isotropic form under overcast skies. The comparisons with measured data,which are reported here, include a brief summary of results reported by Perezand Stewart (1984). Comparisons with the two data sets available from theSRRL conclude this section.
4.1 Intercomparisons of the Algorithms
The results reported here excluded the ground term since some of the algorithms do not have such a term. The numbers in Table 4-1 are values ofirradiance for individual days that were overcast, partly cloudy, or clear.Measured data were available for these atmospheric conditions for the directnormal, global horizontal, and diffuse sky components. This particular dataset, used at the start of this task, did not include measurements on verticalsurfaces. Hence, the model s could be intercompared but not compared inabsolute terms.
The results show up to 30% differences under clear skies in June and almostidentical results under overcast skies any time of the year. This is a resultof all the models regressing to the isotropic model under overcast conditions.
4.2 Summary of Work by Perez
The State University of New York at Albany (SUNYA) collected an accurate database of solar radiation measurements from 1977 to 1981 under the DOE-fundedSolar Energy Meteorological Research Training Sites (SEMRTS) program. Thedata included measurements on vertical surfaces with N-E-S-W azimuths and measurements on other tilted south-facing surfaces. An artificial horizonshielded the sensors from the ground-reflected radiation.
Perez and Stewart used that data base to evaluate the isotropic (Liu andJordan), Klucher, and Hay algorithms, as well as a new model they developed
Table 4-1. Model Comparisons, North Facin¥-900 Tilt(Daily Total Irradiance - kJ/m )
Month Condition Isotropic Klucher Hay Perez
June Clear 8349 9648 6882 7479June Partly cloudy 4375 4487 4332 4000June Overcast 1525 1528 1525 1531December Clear 3182 3448 2912 3148December Partly cloudy 1865 1967 1796 1679December Overcast 632 633 632 629
17

TR-2S2S
(4-1)
and called the Perez model. In their analysis, they removed the direct beamcomponent from the global measurements to permit evaluation of the diffuse skycomponent by itself.
A summary of the results of their evaluation is given in Table 4-2. It isapparent that the isotropic, Klucher , and Hay algori t hms perform bet ter onsouth-facing surfaces than on east, west, or north surfaces. The Perez modeldoes better on the E-W surfaces, but still seems to overestimate on a northvertical surface, although still exhibiting a lower RMS error. North-facingsurfaces produce the largest relative errors for all the algorithms as mightbe expected for the lower irradiance levels associated with this orientation.
4.3 Evaluations Using Data Collected at SRRL
As described in Section 3.2, data set No.1 contains 41 days of data withglobal measurements on N-E-S-W vertical surfaces. Table 4-3 gives averageroot mean square (RMSE) and mean bias errors (MBE) for the entire 41 days ofdata, where the measured values were compared with estimates from eachalgorithm. The measured data are IS-min integrals.
The percent mean bias error is defined byn
%MBE = 100[n-1 . L (Yi - Xi>]/Y ,1=1
where n is the sample size, Yi is the model generated value for time intervali, x . is the corresponding measured value, and x is the mean measured value
1.for a given time frame.
The percent root mean square error 1.S given by
n%RMSE = 100[n-1 L (Y' - x·)2]O.S/xi=1 1 1 ,
where the parameters are the same as those defined for Eq. 4-1.
(4-2)
One should note that the horizontal diffuse irradiances used as input to themodels were calculated from global horizontal and direct normal beam valuesusing
10(0) = 1T(O) - I cos Z , (4-3)
where all the terms are defined in Section 2.0. These calculated diffusevalues are generally thought to be more accurate than diffuse measurementsus ing a pyranometer wi th a shadow band (Ryznar and Portman 1983; LeBaron,Peterson, and Oirmhirn 1980).
The evaluations using measurements from data set No. 1 were based on theobserved ground albedo values. The isotropic ground term computation methodwas added to the Klucher and Perez algorithms to complete the comparisons.
18

Table 4-2. Summary of the Models' Performance
February 1980 June 1980
Azimuth South South North East West South South North East WestTilt 430 900 900 900 900 430 900 900 900 90
Energy (kJ/m2/h) 1606 1361 190 593 581 778 407 124 346 356
RMS ErrorsIsotropic 12.2 18.6 47.3 26.8 23.7 7.3 12.4 38.9 27.6 32.4-"" Klucher 6.2 11.5 66.2 22.0 21.1 4.9 17.0 56.8 24.6 29.9Hay 7.0 10.2 48.5 17.2 16.5 6.8 19.5 32.3 19.1 24.4Perez 4.5 7.4 22.1 10.5 10.6 3.6 10.4 13.3 10.0 13.5
Accumulated ErrorsIsotropic -8.8 -13.7 24.3 -9.8 -6.3 -4.1 -1.3 13.9 -6.3 -7.3Klucher -2.2 2.7 38.4 3.0 2.4 -1.5 9.6 30.6 3.3 3.2Hay -2.0 -4.2 -4.7 -8.8 -6.2 -4.3 -9.3 -5.4 -7.1 -10.7Perez 1.1 0.9 10.4 -1.9 0.6 -1.3 -1.5 0.1 -1.6 -2.2
~(Data from State University of New York at Albany
IIIIII-V-.- ~
II I
~-"

S=~II.I TR-2525
Table 4-3. Conversion Algorithm Performance during41 Days (from 22 July to 4 September 1984)
Vertical Surfaces
Azimuth North East West South
Hourly RMS Errors (%)
Isotropic 61.6 29.1 33.0 17.9Temps & Coulson 96.5 31.4 50.9 31.9K1ucher 68.9 29.6 34.5 20.5Hay 60.4 28.3 32.4 18.0Perez 55.5 26.6 32.2 19.6
Mean Bias Error (%)
Isotropic 18.5 -3.0 3.4 1.5Temps & Coulson 46.5 9.5 23.1 15.3Klucher 29.2 2.1 11.1 6.8Hay 14.6 -3.0 2.9 0.9Perez 18.0 1.9 10.6 6.7
The RMS errors given in Table 4-3 are lowest for a south-facing surface, muchhigher on E-W surfaces, and very high on north surfaces. This can be attributed in part to the effect of generally lower levels of irradiance availableon north-facing slopes on this relative error calculation (see Table 4-4).The mean bias errors show reasonable performance on E-S-W surfaces with theexception of Temps and Coulson, which has no cloud cover term.
The Perez algorithm was used with FI and F2 values derived from data atSUNYA. Considering that fact, it may be that the F terms are spatially andtemporally conservative based on the results for the SRRL.
Table 4-4. Average Daily Total Irradiance onVertical Surfaces Measured at theSRRL during the Period 23 July4 September 1984
Orientation
NorthEastSouthWest
Irradiance
(kJ/m2/day)
496713950104958832
20
Percentof North
100320241312

TR-2525
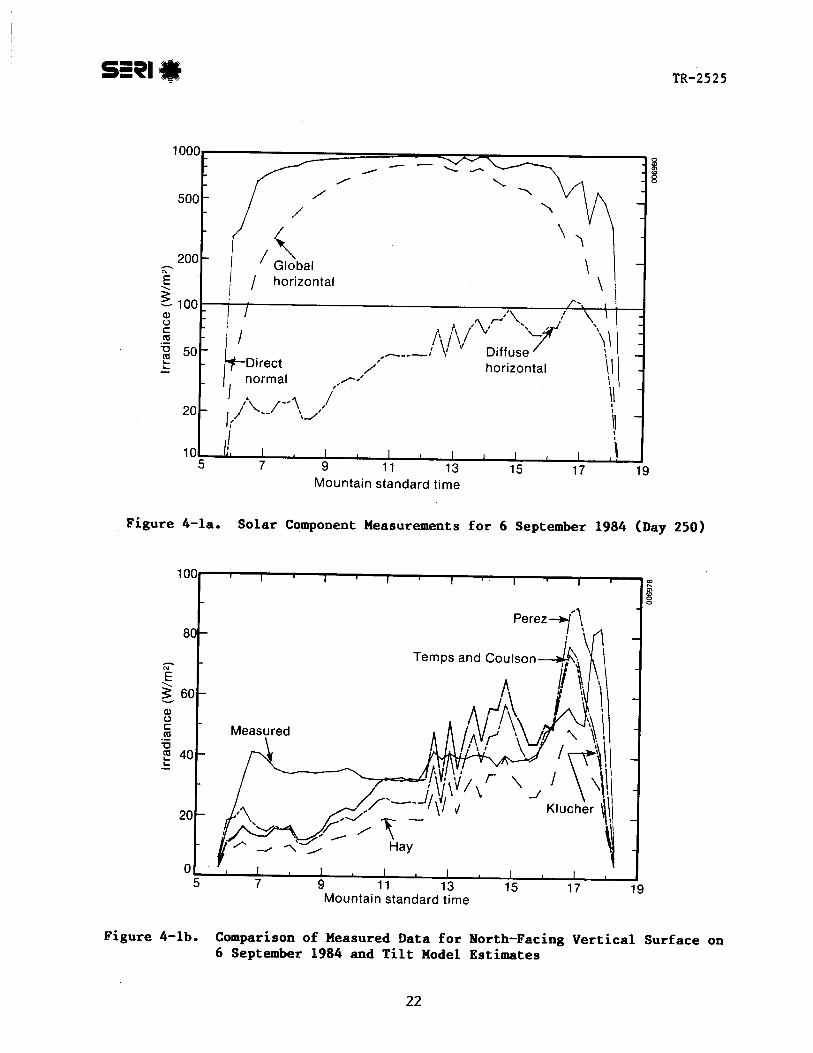
Data from two days were taken from data set No.2 for a more detailed evaluation of all of the algorithms, except the isotropic, since these data includednorth sky and north ground separation. Day 250, September 6, 1984, wasgenerally clear although scattered clouds did develop in the afternoon. Thisis apparent from Figure 4-1(a), which shows the direct normal beam, globalhorizontal, and diffuse horizontal (calculated from Eq , 4-]) components onthat day.
The comparison in Figure 4-1(b) between measured and estimated values ofirradiance on a north-vertical surface is very revealing. During the morning,under clear skies, the measured values are about twice the estimated values.Since data set No. 2 did not contain observations of ground-reflectedirradiance, the albedo input to the algorithms was adjusted each houraccording to Figure 3-9. In general, the model results are well behaved, withKlucher and Temps and Coulson being inseparable and giving the best performance. In the afternoon, the scattered clouds produced very erratic resultsuntil late afternoon when the skies apparently cleared again. Scatteredclouds are obviously not handled well by any of the algorithms.
Figures 4-2a and b are similar plots for a generally cloudy day, 7 September1984, which was previously described with reference to Figure ]-6. On thisday, all of the models overestimated the irradiance on a north-vertical surface, except during relatively clear periods during the early morning and lateafternoon hours. The Perez model performed the best, and the Temps andCoulson model gave the worst results.
Figures 4-3 and 4-4 provide comparisons between measured and estimated groundreflected irradiance on a north-vertical surface. Relatively good agreementis indicated between the isotropic and anisotropic methods under clear andcloudy sky conditions for north-facing surfaces.
21


and west verticalsurface by 14.6%.
5.0 SUMMARY AND CONCLUSIONS
Five algorithms for converting global horizontal and direct normal solar irradiance to global irradiance on tilted surfaces were evaluated using measurements from monitoring equipment newly installed at the Solar RadiationResearch Laboratory. High resolution (15-min) measurements from eight thermopile radiometers oriented vertically in the four cardinal directions wereavailable for a 169-day period ending 31 December 1984. Concurrent measurements of global horizontal and direct normal were also available for theanalyses. The pyranometers used in the experiment were intercompared on horizontal, north-facing, and south-facing vertical orientations before theirdeployment.
The conversion algorithms each attempt to account for very complex atmosphericinteractions with incoming solar radiation. The sky and ground radiancecontributions to tilted surface irradiance are assumed to be isotropic(independent of direction), anisotropic (direction dependent), or a combination of the two regimes depending on the algorithm.
Results from the analysis of measurements for the period 22 July through4 September indicate the following algorithm performances:
• Isotropic (Liu & Jordan)--Within measurement accuracy (±5%) for east, south,and west vertical surfaces. Overpredicts irradiances of north-facingsurface by 18.)%.
• Temps & Coulson--Overpredicts irradiance for all orientations from 9.5% to46.5%.
• Klucher--Overpredicts irradiance for all orientations from 2.1% to 29.2%.
• Hay--Within measurement accuracy for east, south,surfaces. Overpredicts irradiance of north-facingDemonstrated least overall mean bias errors.
• Perez--Within measurement accuracy for east orientation. Overpredicts 1rradiance of south (6.7%), west (10.6%), and north (18.0%) orientations.
The performance of all the algorithms was poorest for the north-facing vertical surfaces. The irradiance levels measured on this orientation were betweentwo and three times less than that observed for the others on an average dailytotal basis. This would help explain the larger relative errors, but thisorientation also places the greatest demands upon the models to account forthe anisotropic distribution to diffuse sky and ground irradiances.
Because of the limited data available at this time, these results must be considered preliminary and inconclusive. Nevertheless, a fairly clear picture isemerging that indicates significant deficiencies in the diffuse sky componentof all of the models. Future research should emphasize the collection of datasimilar to that being obtained at SRRL, which will lead to greaterunderstanding of atmospheric processes and diffuse sky i r r ad i ance , A verydesirable addition at SRRL would be the installation of an all-sky camera tophotograph the sky every 15 minutes. This would improve our understanding ofthe data and would likely suggest modifications of the conversion algorithms.
25

TR-2525
The collection of data during the coming months, with the change of seasonsand the concomitant changes in atmospheric and ground cover conditions, shouldprovide greater insight into the problems with the algorithms. Thedevelopment of improved models should be realized in the near future ifsupport for this kind of research continues.
26
6.0 REFERENCES
Hay, J. E., and J. A. Davies, (1978), "Calculation of the Solar RadiationIncident on an Inclined Surface," Proc. 1st Canadian Solar Radiation DataWorkshop, J. E. Hay and T. K. Won (eds.), Toronto, Canada.
Hay, J. E., and D. C. McKay, (1985), "Estimating Solar Irradiance on InclinedSurfaces, A Review and Assessment of Methodologies," International Journalof Solar Energy, Vol. 3, pp. 203-240.
Klucher, T. M., (1978), Evaluation of Models to Predict Insolation on TiltedSurfaces, NASA TM-78842.
Liu, B. Y. H., and R. C. Jordan, (1960), "The Inter-relationship andCharacteristic Distribution of Direct, Diffuse, and Total Solar Radiation,"Solar Energy, Vol. 4, pp. 1-19.
Perez, R., and R. Stewart, (1984), "Real Time Comparison of Models EstimatingIrradiation on Sloping Surfaces," preprint from Progress in Solar Energy,Vol. VII, American Solar Energy Society.
SERI, (1981a), Solar Radiat ion Resource Atlas of the Uni ted States, SERIISP-642-1037, Golden, co: Solar Energy Research Institute, 183 pp.
SERI, (1981b), Solar Energ Meteorological Research and Trainin Site Pro ram:First Annual Report, SERI SP-642-947, Golden, CO: Solar Energy ResearchInstitute, 87 pp.
SERI, (1982a), Solar Energy Meteorological Research and Training Site Program:Second Annual Report, SERl/sP-290-1478, Golden, co: Solar Energy ResearchInstitute, 109 pp.
SERI, (1982b), International Energy Agency ConferenceMeasurement s, 16-20 March 1981, Boulder, Colorado,Golden, co: Solar Energy Research Institute, 431 pp.
on PyranometerSERI!TR-642-1156,
Anisotropic Modelin Solar Energy,
Stewart, R., and R. Perez, (1984), "Validation of anEstimating Insolation on Tilted Surfaces," _P_r_o.:.::g_r_e_s_s ~
Vol. VII, American Solar Energy Society.
Temps, R. C., and K. L. Coulson, (1977), "Solar Radiation Incident upon Slopesof Different Orientations," Solar Energy, Vol. 19, pp. 179-189.
27

TR-2525
INTERNAL ABO EXTERNAL REVIEWERS FOR
PASSIVE REPORT
Richland Perez, State Un i v , of N.Y. at Albany; John Hay, Un i v , of B.C.,Vancouver; Gene Clark, Trinity Univ., San Antonio, Tex.; Ross McCluney,Florida Solar Energy Center, Cape Canaveral, Fla.; Bob Jones Los Alamos Labs.,Los Alamos, N.M.
Claude RobbinsKerri HunterJay Burch
28

Document Control 11. S.ERI R.eport No. 12. NTIS Accession No.
Page S£RI/TR~215-2525
4. Title and Subtitle
Measuring and Modeling Solar Irradiance on VerticalSurfaces
7. Author(s)E. L. Maxwell, T. L. Stoffel, R. E. Bird9. Performing Organization Name and Address
Solar Energy Research Institu~e
1617 Cole BoulevardGolden, Colorado 80401
12. Sponsoring Organization Name and Address
15. Supplementary Notes
3. Recipient's Accession No.
5. Publication Date
6.
8. Performing Organization Rept. No.
10. Project/Task/Work Unit No.
3738.1011. Contract (C) or Grant (G) No.
(C)
(G)
13. Type of Report & Period Covered
Technical Report14.
16. Abstract (Limit: 200 words) This report presents the first evaluations of 5 algorithms forconverting global horizontal and direct normal solar irradiance components to globalirradiance on tilted surfaces using measurements from the Solar Radiation ResearchLaboratory (SRRL) at SERI. High resolution (15~min) measurements from 8 thermopileradiometers oriented vertically in the 4 cardinal directions were available for a169-day period ending 31 December 1984. Concurrent measurements of global horizontal and direct normal solar irradiance components were also used. The pyranometersused were intercompared on horizontal, north-facin~, and south-facing verticalorientations. The conversion algorithms each attempt to account for the very complexatmospheric interactions with incoming solar radiation. The sky and ground radiancecontributions to tilted surface are assumed to be isotropic, anisotropic, or a combination of the two depending on the algorithm. Results from the analysis of measurements on vertical surfaces for 22 July through 4 September indicate a generaloverestimate (18%-46.5%) of solar irradiance on north-facing surfaces by all 5 ofthe algorithms. The best agreement with measured data was demonstrated for southfacing surfaces where all but one algorithm were within the present measurement byas much as 23% of the observed 15-min data.
17. Document Analysisa.Descriptors Algorithms; Data; Diffuse Solar Radiation; Direct Solar Radiation;
Pyranometers; Solar Radiation
b. IdentifiersiOpen·Ended Terms Vertica1 Surfaces
c. UC Categories
59, 62
18. Availability Statement
National Technical Information ServiceU. S. Department of Commerce5285 Port Royal RoadSpringfield, Virginia 22161
Form No. 0069 (3w25-82)
19. No. of Pages
38
20. Price
AD3
'it U.s.GOVERNMENT PRINTI NG OFFICE: 1986-676-099140049