measuring and analysing internal and external customer
TRANSCRIPT

Measuring and analysing internal and external customer
satisfaction in a multidisciplinary engineering company
by
Celeste Visagie
04430506
Submitted in partial fulfilment of the requirements for the degree of
Bachelors of Industrial and Systems Engineering
in the
Faculty of Engineering, Built Environment and Information
Technology
University of Pretoria
September 2016
©© UUnniivveerrssiittyy ooff PPrreettoorriiaa

©© UUnniivveerrssiittyy ooff PPrreettoorriiaa

Executive Summary
Powertech System Integrators (Pty) Ltd (PTSI) is a multidisciplinary engineering company serving the
electrical, utilities and information technology industries in Africa. They are based in Pretoria, South
Africa and have a footprint across Southern Africa. PTSI consists of four Lines of Business (LoB’s)
which provide solutions to their clients independently from each other. The clients of PTSI include
utilities, metropolitan cities, municipalities, mines, chemical plants, substations, telecommunication
companies and other consulting engineering companies. PTSI’s employees are as diverse as its clients
and make for complex interactions between them and the clients.
A common factor between the clients and the employees is the Customer Support Centre (CSC),
which is responsible for the reception function to the business as well as selected first-tier support to
two of the LoB’s. The CSC plays a vital role in the image of PTSI to clients and should ensure that it
is effective. In essence, the CSC serves both clients and employees as external and internal customers.
The goal of this project was to develop a uniform customer feedback tool for both external
customers and internal customers of PTSI to feed into a newly developed performance mea-
surement system in order to determine the effectiveness and productivity of the CSC with regard to
Customer Satisfaction (CS).
Surveys were thoughtfully designed and utilised as customer feedback tools. The outputs of the
surveys were used as inputs for statistical models to process the data in a way that could be used
for reporting on the performance of the CSC. The additional services provided by the CSC were also
included as inputs to the overall Performance Measurement (PM) system of the CSC as a business
function.
The PM system was designed to link with the business strategy for the identification of goals and
objectives for the CSC, to ultimately assist in growing the business. Traditional Key Performance
Indicators (KPI’s) were incorporated with custom PTSI KPI’s to tailor-make the solution for the CSC.
The outputs of the models are presented in visual format, on a dashboard, to make them more
understandable and thus easier to report on. The ease of use also improves the decision makers’
processes.
The CSC can determine which areas of the business function needs the most attention when
dissatisfaction is encountered and it can segment customers in such a way that strategies can be
created to improve those customers’ experiences of the interactions they have with the CSC.
©© UUnniivveerrssiittyy ooff PPrreettoorriiaa
Contents
1 Introduction 1
1.1 The business . . . . . . . . . . . . . . . . . . . . . . . . . . . . . . . . . . . . . . . . . 1
1.2 The people . . . . . . . . . . . . . . . . . . . . . . . . . . . . . . . . . . . . . . . . . . 2
1.3 The customers . . . . . . . . . . . . . . . . . . . . . . . . . . . . . . . . . . . . . . . . 2
1.4 The changing environment . . . . . . . . . . . . . . . . . . . . . . . . . . . . . . . . . . 4
1.5 Measuring the customer satisfaction . . . . . . . . . . . . . . . . . . . . . . . . . . . . 5
1.6 Problem investigation and definition . . . . . . . . . . . . . . . . . . . . . . . . . . . . 7
1.7 Possible solution . . . . . . . . . . . . . . . . . . . . . . . . . . . . . . . . . . . . . . . 9
1.8 Project aim and approach . . . . . . . . . . . . . . . . . . . . . . . . . . . . . . . . . . 10
1.9 Project scope and deliverables . . . . . . . . . . . . . . . . . . . . . . . . . . . . . . . . 10
1.10 Document structure . . . . . . . . . . . . . . . . . . . . . . . . . . . . . . . . . . . . . 11
2 Literature review 12
2.1 Approaches to customer feedback . . . . . . . . . . . . . . . . . . . . . . . . . . . . . . 12
2.1.1 External customer satisfaction . . . . . . . . . . . . . . . . . . . . . . . . . . . 12
2.1.2 Internal customer satisfaction . . . . . . . . . . . . . . . . . . . . . . . . . . . . 14
2.2 Designing customer feedback tools . . . . . . . . . . . . . . . . . . . . . . . . . . . . . 15
2.2.1 Considerations when designing customer feedback tools . . . . . . . . . . . . . 15
2.2.2 Ethics . . . . . . . . . . . . . . . . . . . . . . . . . . . . . . . . . . . . . . . . . 15
2.2.3 Analysing and interpreting the results of customer surveys . . . . . . . . . . . . 15
2.3 PM systems for call centres . . . . . . . . . . . . . . . . . . . . . . . . . . . . . . . . . 15
2.3.1 KPI’s for call centres . . . . . . . . . . . . . . . . . . . . . . . . . . . . . . . . . 16
2.3.2 Designing a PM system . . . . . . . . . . . . . . . . . . . . . . . . . . . . . . . 16
2.4 Quality engineering and statistical quality control . . . . . . . . . . . . . . . . . . . . . 18
2.5 Literature review conclusion . . . . . . . . . . . . . . . . . . . . . . . . . . . . . . . . . 19
3 Conceptual design and design specifications 21
3.1 Solution rationale . . . . . . . . . . . . . . . . . . . . . . . . . . . . . . . . . . . . . . . 22
3.2 Communicative interactions . . . . . . . . . . . . . . . . . . . . . . . . . . . . . . . . . 22
3.3 Application of the nine Survey Design Steps . . . . . . . . . . . . . . . . . . . . . . . . 25
3.3.1 Step 1: Establish the goal . . . . . . . . . . . . . . . . . . . . . . . . . . . . . . 25
3.3.2 Step 2: Determine the sample . . . . . . . . . . . . . . . . . . . . . . . . . . . . 25
3.3.3 Step 3: Choosing the approach . . . . . . . . . . . . . . . . . . . . . . . . . . . 25
3.3.4 Step 4: Choosing the format . . . . . . . . . . . . . . . . . . . . . . . . . . . . 25
i
©© UUnniivveerrssiittyy ooff PPrreettoorriiaa

3.3.5 Steps 5 and 6: Creating the survey and writing quality questions . . . . . . . . 26
3.3.6 Step 7: Pre-testing the survey . . . . . . . . . . . . . . . . . . . . . . . . . . . . 26
3.3.7 Steps 8 and 9: Administering the survey and analysing the results . . . . . . . 26
3.4 Justification of survey designs . . . . . . . . . . . . . . . . . . . . . . . . . . . . . . . . 26
3.5 Statistical analysis of survey outputs . . . . . . . . . . . . . . . . . . . . . . . . . . . . 28
3.6 CS inputs for the PM system . . . . . . . . . . . . . . . . . . . . . . . . . . . . . . . . 30
3.7 Additional inputs for the PM system . . . . . . . . . . . . . . . . . . . . . . . . . . . . 31
3.8 Building of the models . . . . . . . . . . . . . . . . . . . . . . . . . . . . . . . . . . . . 32
4 Solution design 34
4.1 Final data preparation . . . . . . . . . . . . . . . . . . . . . . . . . . . . . . . . . . . . 34
4.1.1 Initial sample sizes . . . . . . . . . . . . . . . . . . . . . . . . . . . . . . . . . . 34
4.1.2 External customers’ comparability and representativity . . . . . . . . . . . . . 35
4.1.3 Internal customers’ comparability and representativity . . . . . . . . . . . . . . 36
4.1.4 Preparation of the additional inputs . . . . . . . . . . . . . . . . . . . . . . . . 38
4.2 Microsoft Excel models . . . . . . . . . . . . . . . . . . . . . . . . . . . . . . . . . . . . 38
4.2.1 Model 1: External Customer Satisfaction . . . . . . . . . . . . . . . . . . . . . 38
4.2.2 Model 2: Internal Customer Satisfaction . . . . . . . . . . . . . . . . . . . . . . 39
4.2.3 Model 3: Additional Performance Measurement inputs . . . . . . . . . . . . . . 41
4.3 Linking the PM system to the business’s strategic goals . . . . . . . . . . . . . . . . . 42
5 Results, interpretations and solution validation 44
5.1 Results and interpretations . . . . . . . . . . . . . . . . . . . . . . . . . . . . . . . . . 44
5.2 Scenario analysis . . . . . . . . . . . . . . . . . . . . . . . . . . . . . . . . . . . . . . . 51
5.3 Testing the solution against the solution requirements . . . . . . . . . . . . . . . . . . 52
6 Conclusion 54
6.1 Outcomes . . . . . . . . . . . . . . . . . . . . . . . . . . . . . . . . . . . . . . . . . . . 54
6.2 Recommendations . . . . . . . . . . . . . . . . . . . . . . . . . . . . . . . . . . . . . . 55
6.2.1 Recommended use of the designed PM system . . . . . . . . . . . . . . . . . . 55
6.2.2 Customer service recovery . . . . . . . . . . . . . . . . . . . . . . . . . . . . . . 56
6.2.3 Additional recommendations . . . . . . . . . . . . . . . . . . . . . . . . . . . . 56
6.3 Future work . . . . . . . . . . . . . . . . . . . . . . . . . . . . . . . . . . . . . . . . . . 57
6.3.1 Automated customer feedback tool . . . . . . . . . . . . . . . . . . . . . . . . . 57
6.3.2 Real-time measuring of CS . . . . . . . . . . . . . . . . . . . . . . . . . . . . . 57
Bibliography 58
Appendix A 61
Telephonic survey script . . . . . . . . . . . . . . . . . . . . . . . . . . . . . . . . . . . . . . 61
Detailed internal survey design . . . . . . . . . . . . . . . . . . . . . . . . . . . . . . . . . . 62
Appendix B 63
PM system home page . . . . . . . . . . . . . . . . . . . . . . . . . . . . . . . . . . . . . . . 63
ii
©© UUnniivveerrssiittyy ooff PPrreettoorriiaa
Appendix C 65
Industry sponsorship forms . . . . . . . . . . . . . . . . . . . . . . . . . . . . . . . . . . . . 65
List of Figures
1.1 As-Is scenario of CS measuring in PTSI . . . . . . . . . . . . . . . . . . . . . . . 5
1.2 External CS measuring currently done by PTSI . . . . . . . . . . . . . . . . . . 6
1.3 Internal CS with the services of the CSC, which is currently absent from
PTSI . . . . . . . . . . . . . . . . . . . . . . . . . . . . . . . . . . . . . . . . . . . . . 7
1.4 Conceptual representation of the identification of improvement opportunities 8
1.5 To-Be scenario of CS measuring in PTSI . . . . . . . . . . . . . . . . . . . . . . 9
2.1 The service profit chain . . . . . . . . . . . . . . . . . . . . . . . . . . . . . . . . . 14
2.2 The nine steps to design a survey . . . . . . . . . . . . . . . . . . . . . . . . . . . 17
2.3 Control charts: In control and out of control (Simon, 2002) . . . . . . . . . . 19
3.1 Solution design approach . . . . . . . . . . . . . . . . . . . . . . . . . . . . . . . . 21
3.2 SIPOC model . . . . . . . . . . . . . . . . . . . . . . . . . . . . . . . . . . . . . . . . 23
3.3 As-Is Communications Process . . . . . . . . . . . . . . . . . . . . . . . . . . . . . 24
3.4 Cyclic pattern of the statistical analysis of the survey outputs . . . . . . . . 29
3.5 Conceptual graphical representation of the survey results by means of line
charts . . . . . . . . . . . . . . . . . . . . . . . . . . . . . . . . . . . . . . . . . . . . . 30
3.6 Conceptual graphical representation of the reason groupings by means of a
Pareto chart . . . . . . . . . . . . . . . . . . . . . . . . . . . . . . . . . . . . . . . . 31
4.1 Attributes decided upon beforehand . . . . . . . . . . . . . . . . . . . . . . . . . 35
4.2 Sample sizes calculated based on the attributes decided upon . . . . . . . . . 35
4.3 External customers’ segmentation . . . . . . . . . . . . . . . . . . . . . . . . . . . 36
4.4 Internal customers’ segmentation . . . . . . . . . . . . . . . . . . . . . . . . . . . 37
4.5 Outputs of external surveys used as inputs for the PM system . . . . . . . . 39
4.6 Outputs of internal surveys used as inputs for the PM system . . . . . . . . 39
4.7 Codification of the reasons given by the internal customers . . . . . . . . . . 40
4.8 Warning and control limits based on the external and internal customer
feedback . . . . . . . . . . . . . . . . . . . . . . . . . . . . . . . . . . . . . . . . . . . 40
4.9 Outputs from the Private Branch Exchange (PBX) system . . . . . . . . . . . 41
4.10 SFDC . . . . . . . . . . . . . . . . . . . . . . . . . . . . . . . . . . . . . . . . . . . . . 42
5.1 Gauge charts . . . . . . . . . . . . . . . . . . . . . . . . . . . . . . . . . . . . . . . . . 44
5.2 External customers’ segmentation based on the external survey responses . 45
5.3 Internal customers’ segmentation based on the internal survey responses . 45
iii
©© UUnniivveerrssiittyy ooff PPrreettoorriiaa

5.4 Internal customers’ segmentation based on the external survey responses . 47
5.5 Pivot Charts of the Customer Relationship Management (CRM) report out-
puts . . . . . . . . . . . . . . . . . . . . . . . . . . . . . . . . . . . . . . . . . . . . . . 48
5.6 The CSC PM system dashboard . . . . . . . . . . . . . . . . . . . . . . . . . . . . 50
6.1 Recommended use of PM system from a continuous improvement approach 55
List of Tables
1.1 Client Interaction Table . . . . . . . . . . . . . . . . . . . . . . . . . . . . . . . . . 3
2.1 Attributes of CS measuring methodologies (Benjamin, 2015) . . . . . . . . . 13
3.1 The justification of survey question choices . . . . . . . . . . . . . . . . . . . . . 27
3.2 Summary of the advantages and disadvantages of available software appli-
cation alternatives . . . . . . . . . . . . . . . . . . . . . . . . . . . . . . . . . . . . . 33
4.1 Sample size calculations . . . . . . . . . . . . . . . . . . . . . . . . . . . . . . . . . 34
4.2 Breakdown of the number of surveys to be distributed to external customers 36
4.3 Breakdown of the number of surveys to be distributed to internal customers 37
5.1 Interpretations of results from the CRM Pivot Charts . . . . . . . . . . . . . 49
5.2 The validation of the designed solution . . . . . . . . . . . . . . . . . . . . . . . 53
List of Equations
1.1 Net Promoter Score . . . . . . . . . . . . . . . . . . . . . . . . . . . . . . . . . . . . . 6
3.1 Sample Size . . . . . . . . . . . . . . . . . . . . . . . . . . . . . . . . . . . . . . . . . . . 25
3.2 Response Rate . . . . . . . . . . . . . . . . . . . . . . . . . . . . . . . . . . . . . . . . . 28
3.3 Average Score/Survey . . . . . . . . . . . . . . . . . . . . . . . . . . . . . . . . . . . . 28
3.4 Average Score/Question . . . . . . . . . . . . . . . . . . . . . . . . . . . . . . . . . . . 28
3.5 Mean CS Score . . . . . . . . . . . . . . . . . . . . . . . . . . . . . . . . . . . . . . . . 28
3.6 Median CS Score for odd n . . . . . . . . . . . . . . . . . . . . . . . . . . . . . . . . . 28
3.7 Median CS Score for even n . . . . . . . . . . . . . . . . . . . . . . . . . . . . . . . . 28
3.8 Variance . . . . . . . . . . . . . . . . . . . . . . . . . . . . . . . . . . . . . . . . . . . . . 29
3.9 Standard Deviation . . . . . . . . . . . . . . . . . . . . . . . . . . . . . . . . . . . . . . 29
iv
©© UUnniivveerrssiittyy ooff PPrreettoorriiaa

3.10 Margin of Error . . . . . . . . . . . . . . . . . . . . . . . . . . . . . . . . . . . . . . . . 29
v
©© UUnniivveerrssiittyy ooff PPrreettoorriiaa

Acronyms and abbreviations
PTSI Powertech System Integrators (Pty) Ltd
CSC Customer Support Centre
LoB Line of Business
EIS Engineering Information Systems
EM Energy Management
IPP Industrial Plant Projects
PIM Power Infrastructure Management
SHERQ Safety, Health, Environmental, Risk and Quality
CS Customer Satisfaction
NPS Net Promoter Score
CES Customer Effort Score
ACSI American Customer Satisfaction Index
CSAT Customer Satisfaction
ECEF Enhanced Customer Experience Framework
CRM Customer Relationship Management
PBX Private Branch Exchange
PM Performance Measurement
KPI Key Performance Indicator
TTR Time-to-Resolution
RR Response Rate
TV Target Value
USL Upper Specification Limit
LSL Lower Specification Limit
vi
©© UUnniivveerrssiittyy ooff PPrreettoorriiaa

Chapter 1
Introduction
Powertech System Integrators (Pty) Ltd (PTSI) is a multidisciplinary engineering company focused
on solutions in the electrical, utilities and information technology industries in Africa. They are based
in Pretoria, South Africa with satellite bases in Port Elizabeth, Durban and Cape Town, South Africa,
with recent expansion to Nairobi, Kenya.
1.1 The business
PTSI consists of four Lines of Business (LoB’s) namely:
• Engineering Information Systems (EIS);
• Energy Management (EM);
• Industrial Plant Projects (IPP) and
• Power Infrastructure Management (PIM).
The LoB’s provide solutions to their clients independently from one another. Each LoB has its
own supporting services such as project management, but do, however, share some services such as
administration, financing and business development.
The EIS business provides software solutions that enable clients to manage assets and work activ-
ities, enhance service delivery and reduce operating costs. The four main areas of expertise in the EIS
business are Enterprise Asset Management (EAM), Geographic Information Systems (GIS), mobile
workforce applications and Advanced Distribution Management Systems (ADMS). Their customers
include municipalities; state-owned enterprises, such as Telkom and Eskom; private businesses, such as
Netstar; and non-profit organisations such as the Automobile Association of South Africa (AA). The
business builds on domain knowledge, engineering capabilities and a deep understanding of customer
requirements to provide consulting, turnkey and managed services that are tailor-made for the client.
EM mainly assists South Africa’s electricity provider, Eskom, with solutions to improve billing
accuracy and to reduce non-technical losses. The business is active in different market sectors to
assist the large power user clients to find innovative and sustainable ways of managing and reducing
energy consumption. An in-house software product, ecWINTM, is used with Enermax meters, load
1
©© UUnniivveerrssiittyy ooff PPrreettoorriiaa

control units, proven communication technology and third party metering products for Automated
Meter Reading (AMR) solutions.
IPP is a multidisciplinary engineering, project and construction management service on either
an EPC/Turnkey or EPCM basis. The business’s capabilities include technology evaluations and
feasibility studies. IPP’s in-house engineering expertise includes process, mechanical, electrical, and
control and instrumentation disciplines. A drawing office with 3D modelling capabilities is another
offered service. Projects in off-gas filtration, flue gas cleaning as well as co-generation and standby
power are currently in various stages of the project life-cycle. Clients of the IPP business stretch over
many market sectors and include power generation companies, mining companies, utilities and other
engineering companies.
The PIM business is the largest LoB of the four and their work is about ensuring an uninterrupted
flow of electrical energy. PIM builds and provides solutions that use world-class protection and control
systems, connector systems, surge arrestors and surge protection devices for underground cables and
overhead line networks. Some PIM solutions include substation automation and protection schemes,
distribution network upgrades, direct current auxiliary power systems and transformer monitoring
and diagnostics. The clients serviced by PIM include Sasol, Eskom, City Power, Electricidade de
Mocambique and Umeme in Uganda.
PTSI also provides product-specific and solution-based training courses for engineers, technicians,
electricians and cable joiners.
In summary, PTSI provides a vast array of services and expertise, which adds significant complexity
to the business as a whole.
1.2 The people
PTSI’s employees consist of engineers from various disciplines, such as electrical, electronic, mechanical
and process engineering, as well as software developers, technicians, draughtsmen, sales representa-
tives, project managers and financial and administration personnel. Some employees have more than
20 years’ experience in their respective fields of expertise and can be defined as subject matter experts.
The business has a diverse body of highly qualified resources with long-standing relationships with
their clients, which makes PTSI an attractive choice when it comes to engineering solutions in the
electrical engineering space.
1.3 The customers
Table 1.1 contains PTSI’s typical customers, their requirements and the interactions the different
LoB’s encounter in their fields of expertise.
2
©© UUnniivveerrssiittyy ooff PPrreettoorriiaa

Table 1.1: Client Interaction Table
PTSI Line of
Business Typical Clients Typical Requirements from Clients Typical Interactions with those Clients
EIS
- Metropolitan cities and municipalities - Utilities (Water, power and telecoms) - Mines - Telecommunication companies - State-owned enterprises - Privately owned companies such as sugar mills, cement factories and food producers
- Enterprise asset management - Workforce management relating to scheduling and mobility - Geographic information solutions relating to data and spatial analysis and other modelling - Distribution automation solutions to increase reliability and quality of service - Decreasing of outage by monitoring and control solutions - Training
Initial interaction with an identified client starts with the generation of the actual problem definition as perceived by the client. From there requirements analysis and definition is completed and solution design follows. After the solution is developed it gets implemented. The Customer Support Centre comes into play when a Support and Maintenance contract is concluded. The clients contact PTSI relating to their specific solutions and predefined processes are then followed to resolve various requests. Some of the enquiries are handled by first-tier support functions within the CSC and the other enquiries are handled by technical experts within the LoB. The CSC agents have the know-how to identify the appropriate technical expert to transfer a call- or email enquiry to. In the EIS LoB there are hardware and software support protocols in place that include hardware swops and software patches. These support functions distinguish the EIS LoB from the other LoB's.
EM
- Municipalities (Local and African Municipalities) - Utilities (Eskom and other African countries' utilities) - Other consulting engineering companies - Mining companies - Industrial applications companies
- Cost reduction of electricity expenditures - Revenue protection through accurate billing and billing verification processes - Prevention of non-technical electricity losses - Reduction of the need for manual readers by using Automated Meter Reading solutions - Real-time metering and monitoring solutions for electricity production and consumption - Power factor corrections and energy efficiency metering and monitoring - Demand site management by scheduling and load shifting solutions - Training
Initial interaction with an identified client starts with the generation of the actual problem definition as perceived by the client. From there requirements analysis and definition is completed and solution design follows. After the solution is developed it gets implemented. The Customer Support Centre comes into play when a Support and Maintenance contract is concluded. The clients contact PTSI relating to their specific solutions and predefined processes are then followed to resolve various requests. Some of the enquiries are handled by first-tier support functions within the CSC and the other enquiries are handled by technical experts within the LoB. The CSC agents have the know-how to identify the appropriate technical expert to transfer a call or email enquiry to.
IPP
- Utilities (Power and water) - Mines - Chemical plants
- Energy recovery - Gas cleaning solutions - Water treatment and recovery solutions - Alternative and renewable energy solutions - Process control, workflow and analytics regarding gas, power and water usages - Automation control systems
The IPP LoB provides solutions that have a very long life cycle and as a result the engineers have direct contact with the clients for 95% of the time. The projects follow the same life cycle as the EM and EIS LoB's, with the exception of the after-sales support.
PIM
- Utilities (Power and water) - Owners of substations - Metropolitan cities and municipalities - Contractors tasked with building substations
- Protection schemes - Control schemes - Implementation of their products in protection, automation and control schemes - Sales of the loose products being used in their schemes for maintenance - Training
The PIM LoB projects follow the same project life cycle as the EIS and EM LoB's, but they do provide on-site technical support that the other LoB's don't provide.
3
©© UUnniivveerrssiittyy ooff PPrreettoorriiaa

The current operations within PTSI can also be described as complex because of the diverse
employees, projects and customers. More complexity is introduced by all the different measures of
success, Key Performance Indicators (KPI’s) and metrics. If an overall metric were to be used for
PTSI it would have to be standardised across all the LoB’s.
1.4 The changing environment
PTSI has undergone extensive organisational changes from 2014 to 2016, which have influenced their
employees’ work environment and clients’ experiences significantly. These changes include the imple-
mentation of a manufacturing SAP environment as an Enterprise Resource Planning (ERP) system,
two restructuring processes of the organisational structure, a retrenchment process and the implemen-
tation of a Software-as-a-Service Customer Relationship Management (CRM) system. The changes
have necessitated the redefinition of the strategic business goals.
When defining the strategic business goals, the complex operating environment of PTSI along with
its stakeholder views was considered and five influencing factors were identified in the operating space.
The five influencing factors are as follows:
• Urbanisation;
• The Future of Power;
• Infrastructure Development;
• Connectivity and Convergence; and
• New Business Models.
These factors all influence the views of PTSI’s stakeholders. The stakeholders are the shareholders,
employees, partners, competitors and clients. For this project the two most important stakeholder
views, in conjunction with the influencing factors, are the views from the clients’ and employees’
perspectives.
Singh (2006) states that Customer Satisfaction (CS) has a positive effect on an organisation’s
customer loyalty and retention and Martin (2010) proves that an increase in shareholder value is a
definite by-product of the focus on CS.
The clients of PTSI are expecting world-class technologies and products supported by unique core
competencies and subject matter experts that consistently provide value for money. Customers further
have an expectation that the subject matter experts are responsive, flexible and innovative in dealing
with the complexities they face when encountering a problem.
In order to assist in the clients’ perspective, an initiative was started to capture all incoming
communications from external clients at one entrance point to the business. For this function, the
existing call centre of the EIS business was upgraded to a Customer Support Centre (CSC). The main
function of the agents in the CSC is to capture incoming calls and emails relating to the business and
to provide first tier support for the cases they are qualified to resolve. The cases they are not qualified
to resolve are transferred to the relevant internal contact person in each of the LoB’s, also referred to
as the Internal Receiver. Another function of the agents in the CSC is to support the implemented
4
©© UUnniivveerrssiittyy ooff PPrreettoorriiaa
solutions of the EIS and EM businesses. The agents resolve mobile workforce requests, related to
hand-held devices, and remotely monitor ecWinTMsystems to check them for faults.
From the employees’ perspective, PTSI is expected to create a space with the freedom and trust
for innovation to happen and to be able to become experts in their respective fields. A sense of pride
and loyalty is appreciated from management to the employees, in order for them to be the best people
in the market in what they do.
The CSC is in direct contact with both the business’s clients and its employees. Thus, the CSC is
a very important aspect of PTSI’s clients’ experience of the business and its services.
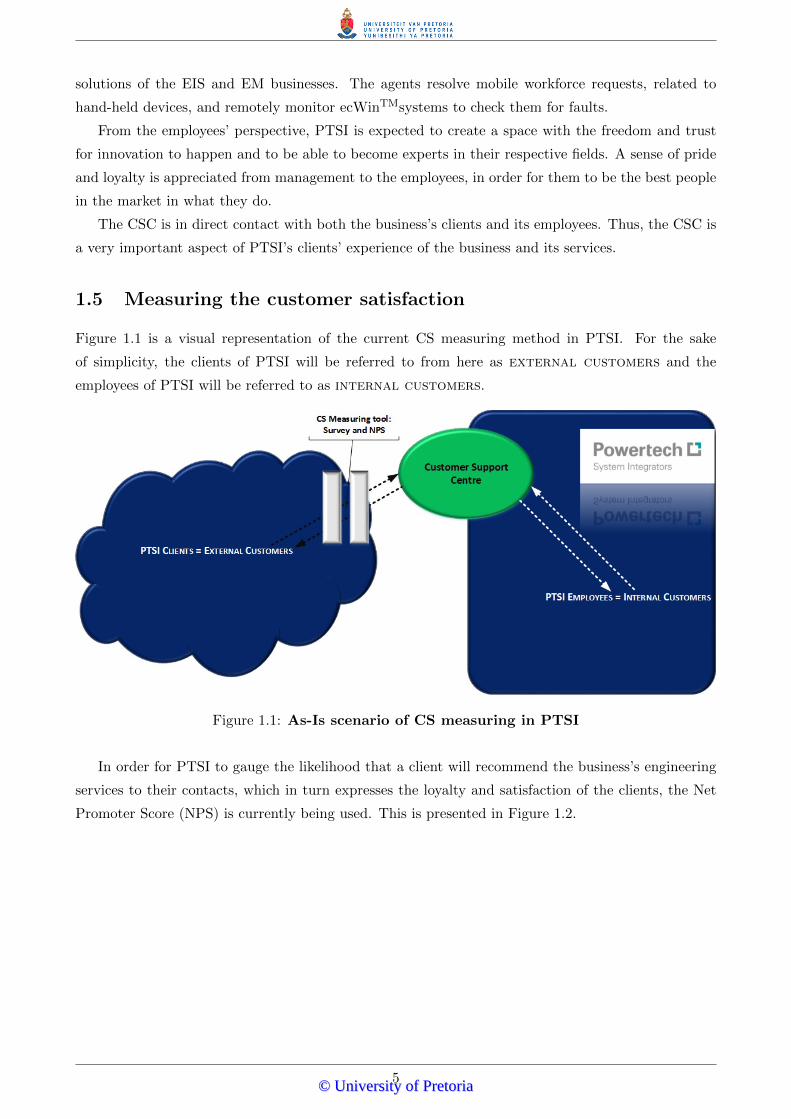
1.5 Measuring the customer satisfaction
Figure 1.1 is a visual representation of the current CS measuring method in PTSI. For the sake
of simplicity, the clients of PTSI will be referred to from here as external customers and the
employees of PTSI will be referred to as internal customers.
Figure 1.1: As-Is scenario of CS measuring in PTSI
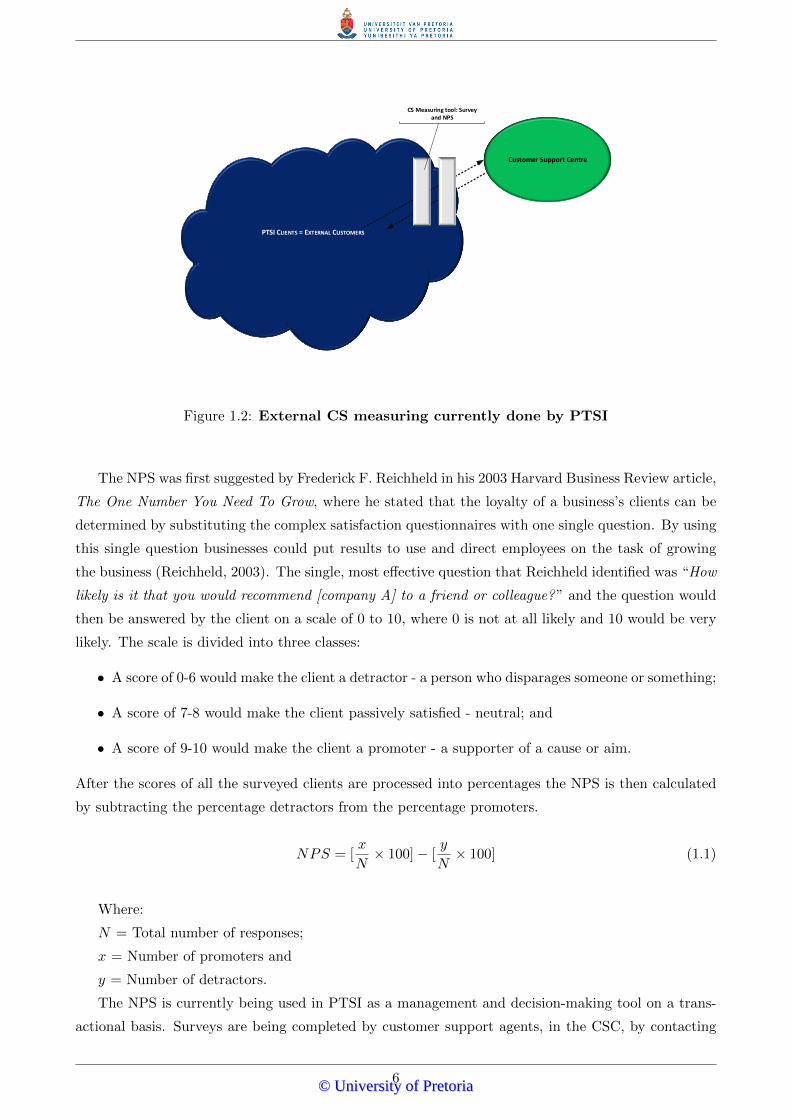
In order for PTSI to gauge the likelihood that a client will recommend the business’s engineering
services to their contacts, which in turn expresses the loyalty and satisfaction of the clients, the Net
Promoter Score (NPS) is currently being used. This is presented in Figure 1.2.
5
©© UUnniivveerrssiittyy ooff PPrreettoorriiaa
Customer Support Centre
PTSI CLIENTS = EXTERNAL CUSTOMERS
CS Measuring tool: Survey and NPS
Figure 1.2: External CS measuring currently done by PTSI
The NPS was first suggested by Frederick F. Reichheld in his 2003 Harvard Business Review article,
The One Number You Need To Grow, where he stated that the loyalty of a business’s clients can be
determined by substituting the complex satisfaction questionnaires with one single question. By using
this single question businesses could put results to use and direct employees on the task of growing
the business (Reichheld, 2003). The single, most effective question that Reichheld identified was “How
likely is it that you would recommend [company A] to a friend or colleague?” and the question would
then be answered by the client on a scale of 0 to 10, where 0 is not at all likely and 10 would be very
likely. The scale is divided into three classes:
• A score of 0-6 would make the client a detractor - a person who disparages someone or something;
• A score of 7-8 would make the client passively satisfied - neutral; and
• A score of 9-10 would make the client a promoter - a supporter of a cause or aim.
After the scores of all the surveyed clients are processed into percentages the NPS is then calculated
by subtracting the percentage detractors from the percentage promoters.
NPS = [x
N× 100]− [
y
N× 100] (1.1)
Where:
N = Total number of responses;
x = Number of promoters and
y = Number of detractors.
The NPS is currently being used in PTSI as a management and decision-making tool on a trans-
actional basis. Surveys are being completed by customer support agents, in the CSC, by contacting
6
©© UUnniivveerrssiittyy ooff PPrreettoorriiaa

clients by telephone and asking them to answer the survey questions after the conclusion of an en-
gineering project. These surveys are then processed by the Safety, Health, Environmental, Risk and
Quality (SHERQ) department and a NPS is calculated. The surveys, however, consist of multiple
questions, with the important single question suggested by Reichheld being one of these. This is a
time consuming and frustrating process to the clients and the agents. Only the results of the NPS
portion of the surveys are processed and reported back to management on a regular basis, which means
that only a partial view of the customers’ views are reported on and available for strategic planning
activities.
Currently, the interactions between the CSC and the internal customers include transferring
incoming telephone calls and taking messages if the internal customer is not available. An auto-
mated process, managed by the CRM system, has been implemented to streamline the message-taking
actions. The CSC also monitors a mailbox dedicated to customer support-related enquiries and they
reroute the emails to the relevant people when the emails are received. The efficiency and effectiveness
of the interactions are currently not being measured and as a result, a picture of the satisfaction of
the customers is not available as shown in Figure 1.3.
Figure 1.3: Internal CS with the services of the CSC, which is currently absent from PTSI
1.6 Problem investigation and definition
At a reporting meeting held on 26 November 2015 the transactional NPS, measured and processed by
the SHERQ department, was equal to zero. This means that the percentage of PTSI’s detractors is
so great that it completely cancels out the percentage of its promoters. In other words, there are a
7
©© UUnniivveerrssiittyy ooff PPrreettoorriiaa

lot more customers that would not recommend PTSI’s engineering services to others than customers
that would recommend the services.
It is unclear which external customers make up the detractors and which make up the pro-
moters. This prevents the use of customer segmentation methods to address the dissatisfaction of the
detractors and leveraging the promoters’ most appreciated aspects of the business.
This measurement is a reflection of the opinions of PTSI’s external customers alone and no
official feedback or opinions are available from the internal customers.
Seeing as the CSC has also become a prominent aspect of PTSI’s image to its external cus-
tomers and must perform a vital communications-and-support function to its internal customers,
it has become necessary to measure the performance of the CSC from both sides. Currently no uniform
measurements for the CS or performance of the CSC are available.
The absence of measurements is troublesome, because valuable improvement opportunities can not
be identified if the current performance of a business function is unknown. In order to rectify this,
measurement systems and capacities should be put in place for measuring the current performance.
When the current performance can be measured accurately, only then can targets be set and the
improvement opportunities be identified to close the gap between the current performance and the
target performance, as conceptually shown in Figure 1.4. Without setting targets, a business will also
not be aware of the problems it really has to solve to reach those targets.
Figure 1.4: Conceptual representation of the identification of improvement opportunities
The business problems identified can be combined to produce the following descriptive problem
statement:
A uniform customer feedback tool, for both external customers and internal customers of
PTSI, is needed to facilitate the development of a performance measurement system to determine the
effectiveness and productivity of the CSC with regard to Customer Satisfaction.
According to Stroud (2011), a business requirement can be defined as critical activities of a business
that must be performed to meet the organisational objectives. The business requirements must be
8
©© UUnniivveerrssiittyy ooff PPrreettoorriiaa

defined independently from the solution. The problem statement stated above can thus be defined
as a business requirement of PTSI that needs to be addressed in order to achieve the strategic goals
referred to in Section 1.4.
1.7 Possible solution
Figure 1.5 is a visual representation of a possible solution to the stated problem.
Customer Support Centre
PTSI EMPLOYEES = INTERNAL CUSTOMERS
PTSI CLIENTS = EXTERNAL CUSTOMERS
CS Measuring tool
CS Measuring tool
Performance Measurement
Tool
Figure 1.5: To-Be scenario of CS measuring in PTSI
The purpose of solution requirements is to give a detailed view of what a solution must include in
order to solve a problem and reach a goal or objective. The problem defined in the previous section
is considered as the goal that must be achieved.
The solution requirements are:
1. Define the current communicative interactions between external customers and the CSC
and internal customers and the CSC
2. Determine and state the most appropriate approach to customer feedback tools for both exter-
nal customers and internal customers
3. Identified feedback tools must be simple, descriptive, cost-effective, time-saving and statistically
significant
9
©© UUnniivveerrssiittyy ooff PPrreettoorriiaa

4. The resulting design of the identified customer feedback tools should conform to the above-
mentioned attributes
5. A mathematical model is required to capture and interpret the results of the feedback tools
6. The significance of the customer feedback tools in the measuring of performance of the CSC
must be determined and stated
7. An appropriate performance measurement tool for the CSC must be identified, stated and de-
signed
8. The identified performance measurement tool must effectively and accurately use the outputs of
the customer feedback tools as inputs
9. The designed tools and models must be made available in a program that is familiar to the end
users
10. All the designed tools should be able to stand up to a validation exercise to prove the relevance
and effectiveness of the solution
1.8 Project aim and approach
The aim of this project is to solve the stated problem by addressing every solution requirement listed
above. The approach to the development of the solution will be started by conducting the necessary
research into the customer feedback tools, the performance measurement tool and the statistics to
effectively measure the outputs of the tools. From the critically reviewed literature, designs of the
tools will then be presented in a visual format and the data surrounding the tools will be presented
in the format of mathematical models.
1.9 Project scope and deliverables
The scope of the project is of an experimental nature and the deliverables of the project are as follows:
• A visual design of a customer feedback tool for external customers dubbed the external
customer feedback tool;
• A mathematical model for the results of the external customer feedback tool;
• A visual design of a customer feedback tool for internal customers dubbed the internal
customer feedback tool;
• A mathematical model for the results of the internal customer feedback tool;
• A visual design of a performance measurement tool to measure the performance of the CSC; and
• A document that includes the stated deliverables.
10
©© UUnniivveerrssiittyy ooff PPrreettoorriiaa

1.10 Document structure
The last deliverable, the document, will have the following structure:
• Chapter 1 Introduction: Setting the context for the project and stating the problem to be
solved;
• Chapter 2 Literature review: Reviewing the available literature in terms of the requirements
to determine the appropriate solution methodology;
• Chapter 3 Conceptual design and design specifications: Describing and explaining how
the solution will meet the requirements;
• Chapter 4 Solution design: Refining and creating designs and models. Analysis of outputs
of designs and models; and
• Chapter 5 Results, interpretations and solution validation: Interpretations of the results
and validation of the solution.
• Chapter 6 Conclusion: Drawing of conclusions from the results of the analyses and recom-
mending potential future work.
11
©© UUnniivveerrssiittyy ooff PPrreettoorriiaa

Chapter 2
Literature review
In this chapter, literature is critically reviewed to determine how customer feedback is collected,
measured and analysed to calculate applicable Customer Satisfaction (CS) scores. Further literature
regarding Performance Measurement (PM) systems is reviewed to determine how such a system should
be designed for the output to be of value to the business.
2.1 Approaches to customer feedback
2.1.1 External customer satisfaction
Customers in the current business environment can choose from a wide variety of available products
and services, which causes businesses to place a heavy focus on customer retention. To keep a customer
and to enjoy the profitability that comes with customer loyalty, businesses need to make CS a central
concern of management (Botha et al., 2012).
Various metrics have been developed in the last two decades to measure external CS and pre-
dict customer loyalty. Four of the most popular methodologies are the Net Promoter Score (NPS),
Customer Effort Score (CES), American Customer Satisfaction Index (ACSI) and the Customer Sat-
isfaction (CSAT) metric (Benjamin, 2015). Table 2.1 contains the different attributes of the four
methodologies.
12
©© UUnniivveerrssiittyy ooff PPrreettoorriiaa
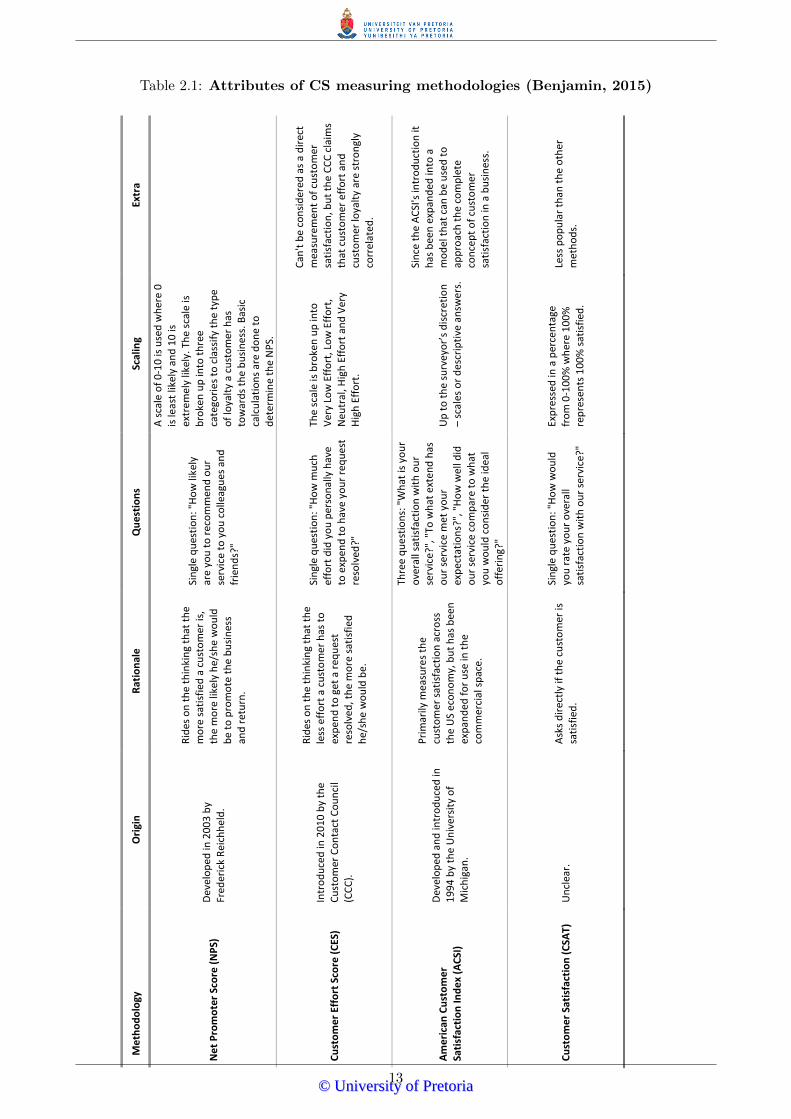
Table 2.1: Attributes of CS measuring methodologies (Benjamin, 2015)
Me
tho
do
logy
O
rigi
n
Rat
ion
ale
Q
ue
stio
ns
Scal
ing
Extr
a
Ne
t P
rom
ote
r Sc
ore
(N
PS)
D
evel
op
ed in
20
03
by
Fred
eric
k R
eich
hel
d.
Rid
es o
n t
he
thin
kin
g th
at t
he
mo
re s
atis
fied
a c
ust
om
er is
, th
e m
ore
like
ly h
e/sh
e w
ou
ld
be
to p
rom
ote
th
e b
usi
nes
s an
d r
etu
rn.
Sin
gle
qu
esti
on
: "H
ow
like
ly
are
you
to
rec
om
men
d o
ur
serv
ice
to y
ou
co
lleag
ues
an
d
frie
nd
s?"
A s
cale
of
0-1
0 is
use
d w
her
e 0
is
leas
t lik
ely
and
10
is
extr
em
ely
likel
y. T
he
scal
e is
b
roke
n u
p in
to t
hre
e ca
tego
rie
s to
cla
ssif
y th
e ty
pe
of
loya
lty
a cu
sto
mer
has
to
war
ds
the
bu
sin
ess
. Bas
ic
calc
ula
tio
ns
are
do
ne
to
det
erm
ine
the
NP
S.
Cu
sto
me
r Ef
fort
Sco
re (
CES
) In
tro
du
ced
in 2
01
0 b
y th
e C
ust
om
er C
on
tact
Co
un
cil
(CC
C).
Rid
es o
n t
he
thin
kin
g th
at t
he
less
eff
ort
a c
ust
om
er h
as t
o
exp
end
to
get
a r
equ
est
reso
lved
, th
e m
ore
sat
isfi
ed
he/
she
wo
uld
be
.
Sin
gle
qu
esti
on
: "H
ow
mu
ch
effo
rt d
id y
ou
per
son
ally
hav
e
to e
xpen
d t
o h
ave
you
r re
qu
est
reso
lved
?"
The
scal
e is
bro
ken
up
into
V
ery
Low
Eff
ort
, Lo
w E
ffo
rt,
Neu
tral
, Hig
h E
ffo
rt a
nd
Ver
y H
igh
Eff
ort
.
Can
't b
e co
nsi
der
ed a
s a
dir
ect
mea
sure
men
t o
f cu
sto
mer
sa
tisf
acti
on
, bu
t th
e C
CC
cla
ims
that
cu
sto
mer
eff
ort
an
d
cust
om
er lo
yalt
y ar
e st
ron
gly
corr
elat
ed.
Am
eri
can
Cu
sto
me
r Sa
tisf
acti
on
Ind
ex
(AC
SI)
Dev
elo
ped
an
d in
tro
du
ced
in
19
94
by
the
Un
iver
sity
of
Mic
hig
an.
Pri
mar
ily m
easu
res
the
cust
om
er s
atis
fact
ion
acr
oss
th
e U
S ec
on
om
y, b
ut
has
bee
n
exp
and
ed f
or
use
in t
he
com
mer
cial
sp
ace.
Thre
e q
ue
stio
ns:
"W
hat
is y
ou
r o
vera
ll sa
tisf
acti
on
wit
h o
ur
serv
ice?
", "
To w
hat
ext
end
has
o
ur
serv
ice
met
yo
ur
exp
ecta
tio
ns?
", "
Ho
w w
ell d
id
ou
r se
rvic
e co
mp
are
to w
hat
yo
u w
ou
ld c
on
sid
er t
he
idea
l o
ffer
ing?
"
Up
to
th
e su
rvey
or’
s d
iscr
etio
n
– sc
ales
or
de
scri
pti
ve a
nsw
ers.
Sin
ce t
he
AC
SI's
intr
od
uct
ion
it
has
bee
n e
xpan
ded
into
a
mo
del
th
at c
an b
e u
sed
to
ap
pro
ach
th
e co
mp
lete
co
nce
pt
of
cust
om
er
sati
sfac
tio
n in
a b
usi
nes
s.
Cu
sto
me
r Sa
tisf
acti
on
(C
SAT)
U
ncl
ear.
A
sks
dir
ectl
y if
th
e cu
sto
mer
is
sati
sfie
d.
Sin
gle
qu
esti
on
: "H
ow
wo
uld
yo
u r
ate
you
r o
vera
ll sa
tisf
acti
on
wit
h o
ur
serv
ice?
"
Exp
ress
ed in
a p
erce
nta
ge
fro
m 0
-10
0%
wh
ere
10
0%
re
pre
sen
ts 1
00
% s
atis
fied
.
Less
po
pu
lar
than
th
e o
ther
m
eth
od
s.
13
©© UUnniivveerrssiittyy ooff PPrreettoorriiaa

Botha et al. (2012) have developed a CS framework, called the Enhanced Customer Experience
Framework (ECEF), by combining Business Process Re-engineering, Quality Function Deployment
(QFD) and simulation. The ECEF is a framework used for enhancing the customer experience through
the use of improved business processes. Surveys and interviews are also used to gather customer data
and requirements to enable the QFD to relate them to the customer-based business processes in need
of improvement.
Stelzer et al. (2015) evaluate the need for standardised automated information exchange to improve
the service quality of a public transportation company. The information exchange that was focused
on, was between the travellers and the company, where the needs and expectations of both parties
were defined by firstly using surveys before proposing a bidirectional information and communication
system. The system did not only improve the company’s ability to improve customer service but also
improved dispatch times that have an indirect connection to CS.
Surveys are an integral part of all the approaches described. They are mainly used to collect
customer feedback directly. This is beneficial when measuring external CS because the surveys provide
an opportunity to measure the customers’ satisfaction by directly finding out from them how satisfied
they are and why (Brogle, 2014).
2.1.2 Internal customer satisfaction
Miller (2012) defines internal customer service as the service that is provided to departments and
colleagues within a business, for employees to get their work done. If employees are able to get their
work done satisfactorily and in alignment with the strategies of the business, they become more efficient
at dealing with external customers’ requests. This relationship was first identified by Berry (1981) in
the retail banking space. Furthermore, Gilbert (2000) states that each internal system should also be
aligned to the strategies of the business and add value to other systems, as though the others were its
customers. The service-profit chain, by Loveman (1998) (Figure 2.1), is a visual representation of the
relationships between the business’s internal systems that lead to loyal and satisfied employees.
Figure 2.1: The service profit chain
From his work with different focal groups from different industries, Gilbert (2000) identifies two
generic measures to assess internal CS, namely personal service and technical competence. Surveys
were used to ask the focal groups to estimate how their internal customers would rate them and their
perceptions were skewed. He noted that individuals tend to assume that their own work units’ internal
services are acceptable, but that in reality they are not delivering the needed services to their internal
14
©© UUnniivveerrssiittyy ooff PPrreettoorriiaa

customers and causing breaks in the service-profit chain as a result. Thus, it is possible to measure
internal CS with surveys, but self-rating surveys are subject to biases and “self-serving perceptual
distortion”.
Rust et al. (1996) developed a framework for understanding employee satisfaction by using a CS
approach. They conclude that a survey about the average intention to remain employed can be used
to identify the changes needed by management to drive internal CS.
2.2 Designing customer feedback tools
2.2.1 Considerations when designing customer feedback tools
Biases and limitations should be kept in mind when designing surveys to be used for customer feedback
because they might prevent the drawing of sound conclusions from the data. Issues that are often
encountered with surveys are various types of biases, such as regional biases, the absence of statistical
significance and the different ways that people can interpret the scales on the surveys. Stroud (2010b)
has identified nine steps to create good customer surveys while keeping the biases and limitations in
mind. They follow in Figure 2.2.
2.2.2 Ethics
The University of Portsmouth (2013) states that not all surveys need to be reviewed by a research
ethics committee. The underlying intention of the evaluation determines whether a survey needs to
be reviewed. The evaluation of a service or a product without any experimentation does not need an
ethics review.
The participants’ consent is required if the survey is of a sensitive nature, and if the survey is
completed anonymously then written consent will not be needed. Participants should, however, be
adequately informed about the research being conducted.
2.2.3 Analysing and interpreting the results of customer surveys
The data collected from the surveys have to be meaningful and presented in a way that will be of use
to the decision makers of a business. Another reason for the careful selection of data presentation is
that the analysis thereof will be easier. The chosen method of analysing the survey results should,
very importantly, account for statistical significance to ensure that decisions can’t be based on random
chance (Brogle, 2014).
Aydin et al. (2015) created a hierarchical CS framework to evaluate the CS levels of the very
complex public rail transit systems in Istanbul. The framework was created by integrating statistical
analysis, a fuzzy analytic hierarchy process (FAHP) and the fuzzy-Choquet integral. All based on
surveys conducted in the city.
2.3 Performance Measurement (PM) systems for call centres
In their book, Customer Satisfaction Measurement for ISO 9001:2000, Hill et al. (2002) explain the
theory and practicalities of statistical analysis and sampling to ensure the production of accurate
15
©© UUnniivveerrssiittyy ooff PPrreettoorriiaa

measures in Customer Satisfaction (CS) measurement activities. These practicalities, related directly
to Section 8 of ISO 9001:2000, relate statistical analysis to PM from a quality assurance perspective.
2.3.1 Key Performance Indicators (KPI’s) for call centres
Dixon et al. (2010) directly tie the Customer Effort Score (CES) to call centres in his Harvard Business
Review article, Stop Trying to Delight Your Customers, and stated that the necessity for repeat contact
by a customer to resolve his/her request definitely undermines the customer’s loyalty to the business. In
a case study, conducted by Stroud (2010a), he found that applying Six Sigma improvement processes to
a call centre was beneficial because through the voice-of-the-customer the most important requirement
is issue resolution time, also known as Time-to-Resolution (TTR). The shorter the TTR became, the
higher the CS rose. Other metrics such as call quality, skill levels, average call duration and first call
resolution should also be mentioned as they form part of the most common call centre metrics.
2.3.2 Designing a PM system
A PM system is a dynamic and balanced system that is able to support a business’s decision-making
process by gathering and analysing information regarding its employees’ performance (Garengo et al.,
2005). Hudson et al. (2001) studied various PM system approaches to formulating a theoretical model
of the strategic PM development process. This model states that a strategic PM system should be
designed to be:
• Derived from the business strategy;
• Designed for an explicit purpose and clearly defined;
• Relevant;
• Easy to understand, use and maintain;
• Able to provide accurate feedback;
• Stimulating continuous improvement and
• Linking operations to the business strategy.
The model also identifies specific metrics that the strategic PM system should be designed to measure,
namely:
• Quality;
• Time;
• Customer satisfaction;
• Flexibility;
• Human resources and
• Finances.
16
©© UUnniivveerrssiittyy ooff PPrreettoorriiaa

• Determine what the business wants to know, whom to ask for it and what to ask them.
1. Establish the Goal
• Determine who the target population is and the sample size.
2. Determine the Sample
• Decide which probability sampling will be used, e.g. random sampling.
3. Choosing the Approach
• Determine the distribution channel of the surveys, the number of surveys sent out, the
timeline and the cost.
4. Choosing the Format
• Choose the questions so that they fit the business's format to ensure usable results.
5. Creating the Survey
• Ties back to step 1 - ensure that the answers of the questions are what the business wants
to know.
6. Writing Quality Questions
• Small-scale implementation of the survey to identify problems
7. Pre-testing the Survey
• Send the surveys out using the identified distribution channels.
8. Administering the Survey
• The analysis of the data should produce results that are useful to the business.
9. Analysing the Results
Figure 2.2: The nine steps to design a survey
17
©© UUnniivveerrssiittyy ooff PPrreettoorriiaa

2.4 Quality engineering and statistical quality control
Quality engineering is a set of activities (engineering, managerial and operational) used to ensure that
the characteristics of a product or service are at the required levels and that the variability around
the desired levels is minimised (Montgomery, 2013).
Statistical quality control is used to describe a set of tools that are used by quality professionals
to describe the variability that occurs in the production process. The toolset is based on statistics.
Statistical quality control consists of three categories that are needed to measure and evaluate the
quality of services or products (Reid and Sanders, 2011).
1. Descriptive statistics: Descriptions of quality characteristics and relationships such as the range,
distribution, mean and standard deviation of data.
2. Statistical process control: Inspection of an output, chosen via random sampling, to determine
if a process is producing outputs with the characteristics that fall within a predetermined range.
Used to determine if a process is functioning as it should.
3. Acceptance sampling: Random inspection of samples in order to determine whether a complete
lot should be accepted based on the results.
The use of statistical quality control tools in service organisations has lagged behind manufacturing
organisations, because of the intangibility of the services. A way around this is to identify important
metrics of a service and then define quantifiable measurements for the metrics. An example of this
would be the number of customer complaints that have been received over a specified time (Reid and
Sanders, 2011).
Statistical process control utilises the descriptive statistics to monitor the quality of a process and
the output it produces. A chart is used for the monitoring of the process by illustrating variation that
is normal. In other words, the chart shows whether the chosen sample of data points falls within the
normal range of variation. Limits on the chart are used to separate normal from assignable causes of
variation. If any of the data fall outside of the limits then the process is said to be out of control as
shown in Figure 2.3 (Reid and Sanders, 2011).
Quality characteristics can be evaluated respective to specifications. These specifications are the
desired measurements for the characteristics that make up every part of the product or service including
the final result. A measurement that links to the desired value for the quality characteristic is the
Target Value (TV) or nominal value. A range of values, believed to be sufficiently close to the TV,
bind the TV of a specific quality characteristic. The largest acceptable value of the range is called the
Upper Specification Limit (USL) and the smallest acceptable value is called the Lower Specification
Limit (LSL) (Montgomery, 2013).
18
©© UUnniivveerrssiittyy ooff PPrreettoorriiaa

Figure 2.3: Control charts: In control and out of control (Simon, 2002)
Specification limits can be one-sided or two-sided. The two scenarios relating to one-sided limits
are the-Higher-the-Better and the-Lower-the-Better and the scenario related to two-sided limits is
Nominal-the-Best. The one-sided scenarios have a single specification limit below or above the TV
because the other specification limit can be deemed irrelevant (Montgomery, 2013). An example of
a the-Lower-the-Better limit is the pollution level of a body of water where a USL implies that the
water pollution is not allowed to ever surpass a certain level, but should the level be much lower than
the TV it wouldn’t be of too much negative consequence.
2.5 Literature review conclusion
From the literature reviewed it can be established that it is possible to solve the stated problem and
that the solution requirements can be addressed with a combination of current tools and techniques
available.
The literature showed that surveys can and are used to collect both internal and external
customer feedback and that if the uniqueness of a business is kept in mind in the design of those
surveys, they can provide valuable information for the business. The collection of data regarding
products or services also does not require ethical review. When the measurements and analyses of the
feedback are done by means of statistical analysis, random chance decision-making can be prevented
and valuable results can be available to the business. The results of the statistical analysis can also
be displayed in a clear and understandable manner by using the concepts of control charts. The
interpretation of the results will be easier if they are represented this way.
The CS score, obtained from the analysis, was identified as one of the important metrics needed
to measure the performance of a call centre. This ties the solution requirements together to form
the concept of an appropriate solution with interdependent aspects that can address the identified
19
©© UUnniivveerrssiittyy ooff PPrreettoorriiaa

business requirement. In other words, the CS metric of a strategic PM system requires the output of
a customer feedback tool as an input, for the measurement of a call centre’s performance.
The design approach of the solution must then focus clearly on the interdependence of the different
aspects to ensure they function in harmony and complement one another.
20
©© UUnniivveerrssiittyy ooff PPrreettoorriiaa

Chapter 3
Conceptual design and design
specifications
This chapter contains the concepts followed to reach a stage where the solution for the problem stated
in Chapter 1, can be designed in detail. As a precursor for the solution design, this chapter contains the
concepts required for the solution to effectively address the solution requirements. The next chapter
contains the final data preparation and development of the models. Finally, the results from the
designed solution are interpreted and the solution is validated. Figure 3.1 illustrates that the concepts
explained in this chapter play a fundamental role in the complete solution design. Alternatively stated,
the solution can not be effectively designed or developed without these concepts.
Figure 3.1: Solution design approach
A solution rationale is identified to act as the backbone of the solution design and the concepts
in this chapter are considered and explored according to this backbone. The business process relating
21
©© UUnniivveerrssiittyy ooff PPrreettoorriiaa

to the communicative interactions of the Customer Support Centre (CSC) is identified to better
understand the role players that will be affected by the designed solution. An application of the nine
design steps of the surveys follows with a justification of why the particular survey questions are asked
in the manner that they are.
A detailed explanation of the statistical equations to be used can be found following the survey
designs. The application of the equations will be incorporated into the solution to provide for accuracy
and data integrity. Visual representations of the processed Customer Satisfaction (CS) inputs used
in the Performance Measurement (PM) system are explained to prepare for the developed solution.
Additional inputs to the PM are also mentioned in this chapter as they will be included in the designed
solution to sketch a holistic picture of the CSC’s performance.
At the end of this chapter, a decision is made as to how the models, that will process the inputs,
will be developed and which software application will be used to develop the models.
3.1 Solution rationale
Figure 3.2 illustrates the solution rationale, in the form of the Suppliers, Inputs, Process, Outputs
and Customers (SIPOC) model, that will be followed in order to address the solution requirements
and produce the deliverables.
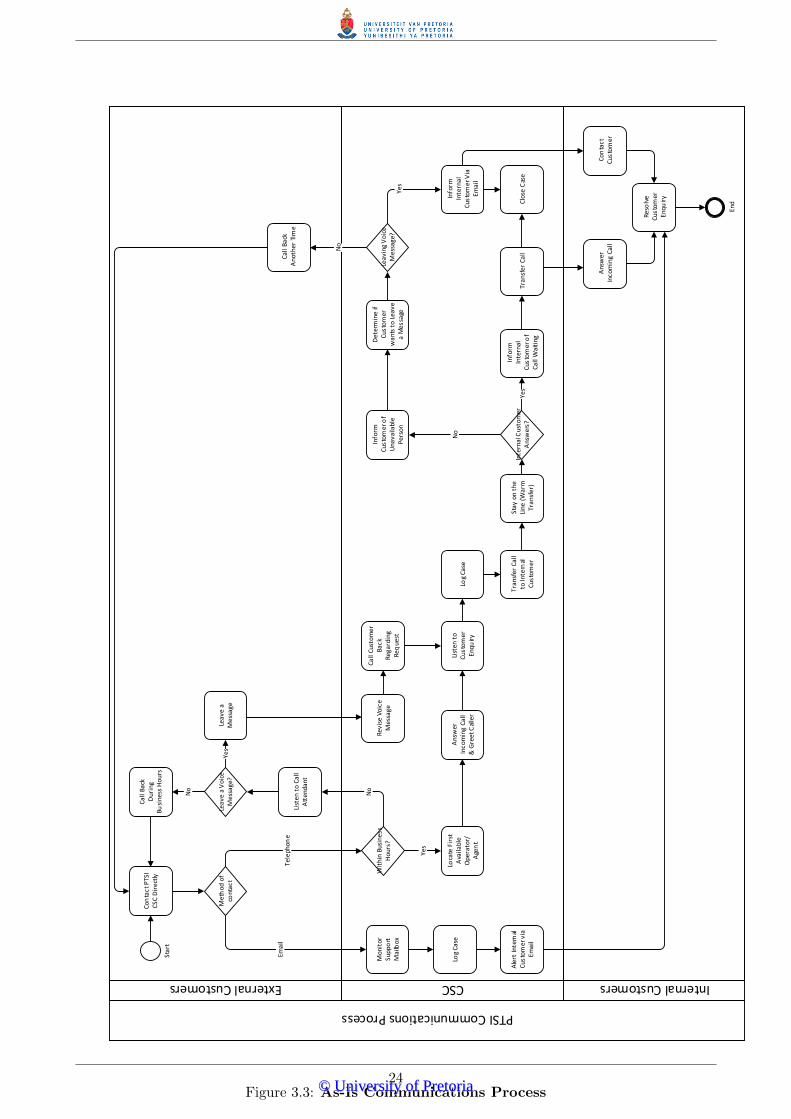
3.2 Communicative interactions
In order to measure the CS of the external and internal customers, the communicative interac-
tions between the customers and the CSC need to be understood. Figure 3.3 is a visual representation
of the process that the CSC follows when dealing with incoming telephone calls and emails.
Some notable aspects of the process, with regard to customer service, are the actions of monitoring
the voice mail box to follow up on calls that came in outside of business hours, “warm transfers” (when
an agent who is currently speaking with a caller, announces the call to the requested recipient before
transferring the call) of the incoming telephone calls, the chance to leave a message when an internal
customer is not available and the monitoring of a mailbox dedicated to customer support.
22
©© UUnniivveerrssiittyy ooff PPrreettoorriiaa

Inpu
tsP
roce
ssO
utp
uts
Inp
ut
A1
:Fe
edb
ack
fro
m
EX
TER
NA
L C
UST
OM
ERS
colle
cted
wit
h
de
sign
ed
su
rvey
s
Inp
ut
A2
:Fe
edb
ack
fro
mIN
TER
NA
L C
UST
OM
ERS
colle
cted
wit
h
de
sign
ed
su
rvey
s
Pro
cess
A:
Stat
isti
cal a
nal
ysis
mo
de
l o
f th
e fe
ed
bac
k fr
om
th
e su
rve
ys
Ou
tpu
t A
/In
pu
t B
1:
Cu
sto
me
r Sa
tisf
act
ion
sco
re
fro
m s
tati
stic
al
ana
lysi
s
Pro
cess
B:
Vis
ual
re
pre
sen
tati
on
m
od
el o
f th
e C
SC
met
rics
Inp
ut
B2
:M
eas
ure
men
t o
utp
uts
of
oth
er
call
cen
tre
met
rics
Ou
tpu
t B
:V
isu
al
rep
rese
nta
tio
ns
of
all
CSC
met
rics
: D
ash
bo
ard
, Lin
e ch
arts
& P
are
to
char
t
Cu
stom
ers
Supp
liers
Bu
sine
ss,
i.e. P
TSI
EXTE
RN
AL
CU
STO
ME
RS
INTE
RN
AL
CU
STO
ME
RS
Figure 3.2: SIPOC model
23
©© UUnniivveerrssiittyy ooff PPrreettoorriiaa
PTSI Communications Process
External Customers CSC Internal Customers
Star
t
Co
nta
ct P
TS
I C
SC
Dir
ect
ly
Me
tho
d o
f co
ntac
t
Emai
l
Mon
itor
Su
ppo
rt
Mai
lbox
Te
lep
ho
ne
Wit
hin
Busi
ness
H
our
s?
List
en
to
Ca
ll A
tten
dant
Lea
ve a
Voi
ce
Mes
sage
?
No
Ye
sLe
ave
a
Mes
sage
No
Call
Back
D
urin
g Bu
sine
ss H
our
s
Revi
se V
oice
M
essa
ge
Call
Cust
omer
Ba
ck
Reg
ardi
ng
Req
uest
Yes
Loca
te F
irst
A
vaila
ble
Ope
rato
r/A
gen
t
Ans
wer
In
com
ing
Call
& G
reet
Cal
ler
List
en t
o Cu
stom
er
Enqu
iryLo
g Ca
se
Tran
sfer
Cal
l to
Int
ern
al
Cust
omer
Stay
on
the
Line
(W
arm
Tr
ansf
er)
Inte
rna
l Cu
sto
me
r A
nsw
ers?
No
Info
rm
Cust
omer
of
Una
vaila
ble
Pers
on
Det
erm
ine
if Cu
stom
er
wan
ts to
Lea
ve
a M
essa
ge
Lea
vin
g V
oic
e
Mes
sage
?
No
Ca
ll B
ack
A
noth
er T
ime
Yes
Info
rm
Inte
rna
l C
usto
mer
Via
Em
ail
Yes
Info
rm
Inte
rnal
Cu
stom
er o
f Ca
ll W
aiti
ng
Tran
sfer
Cal
lC
lose
Cas
e
Ans
wer
In
com
ing
Call
Co
nta
ct
Cust
omer
Res
olv
e C
ust
om
er
Enqu
iry
End
Log
Case
Ale
rt In
tern
al
Cu
sto
me
r via
Em
ail
Figure 3.3: As-Is Communications Process24
©© UUnniivveerrssiittyy ooff PPrreettoorriiaa
3.3 Application of the nine Survey Design Steps
By using the process in Figure 3.3 as a reference, the survey designs were done by following the nine
survey design steps that Stroud (2010b) defined.
3.3.1 Step 1: Establish the goal
• External surveys
The goal of this survey is to determine the external customers’ satisfaction with their
interactions with the CSC.
• Internal surveys
The goal of this survey is to determine the internal customers’ satisfaction with their inter-
actions with the CSC.
3.3.2 Step 2: Determine the sample
• External surveys
For the purpose of this project the sample will consist of a representative group of the external
customers that contacted Powertech System Integrators (Pty) Ltd (PTSI) through the CSC
via telephone and email.
• Internal surveys
For the purpose of this project the sample will consist of a representative group of internal
customers spanning across all the Lines of Business (LoB’s) and the other business functions
within PTSI. This is possible because of easy access to the internal customers.
3.3.3 Step 3: Choosing the approach
Simple random sampling will be used for both surveys to keep uniformity.
3.3.4 Step 4: Choosing the format
• Sample size
The optimal sample size formula will be used to determine how many surveys should initially
be distributed internally and externally.
n =
z2×p(1−p)e2
1 + z2×p(1−p)e2×N
(3.1)
Where:
n = the sample size;
N = the estimated population size;
p = the probability of success (p = 0.5);
e = the Margin of Error (e = 0.10); and
z = the z-score for setting the confidence level (z = 1.645, because of a 90% confidence level).
25
©© UUnniivveerrssiittyy ooff PPrreettoorriiaa

• Distribution period
The targeted period of survey distribution spans 30 days.
• External surveys
The distribution channels for the surveys will be telephonic and via email.
• Internal surveys
The distribution channels for the surveys will be telephonic, through face-to-face interviews and
printed surveys.
• Cost
The cost of distributing the surveys and analysing their results will include the telephone costs
and the salary for a part-time intern.
3.3.5 Steps 5 and 6: Creating the survey and writing quality questions
• External surveys
The three questions of the American Customer Satisfaction Index (ACSI) and the single question
of the Customer Effort Score (CES) were chosen for this survey because the answers to these
questions address the goals that were established in Step 1. All the questions will be assessed on
a scale from 1-5 in order to make the analysis of the results less complicated and easier to use.
• Internal surveys
The three questions of the ACSI were chosen for this survey because the answers to these
questions address the surveys’ goal from Step 1. All three questions will also be assessed on a
scale from 1-5. A fourth question will be included enquiring about the reasons for the answers
to the other three questions. These reasons will be grouped according to types, analysed and
interpreted.
3.3.6 Step 7: Pre-testing the survey
The use of tested and widely accepted customer feedback tools remove the need for pre-testing and
no ethical review is needed as the survey will only evaluate the services of PTSI and the CSC.
3.3.7 Steps 8 and 9: Administering the survey and analysing the results
The administering of the email surveys will be done by using the SurveyMonkey platform as it is a
familiar and efficient platform. Details of analysis follow in Section 4.3.
3.4 Justification of survey designs
The following table is an explanation of the choice of questions for the external and internal surveys,
respectively.
26
©© UUnniivveerrssiittyy ooff PPrreettoorriiaa
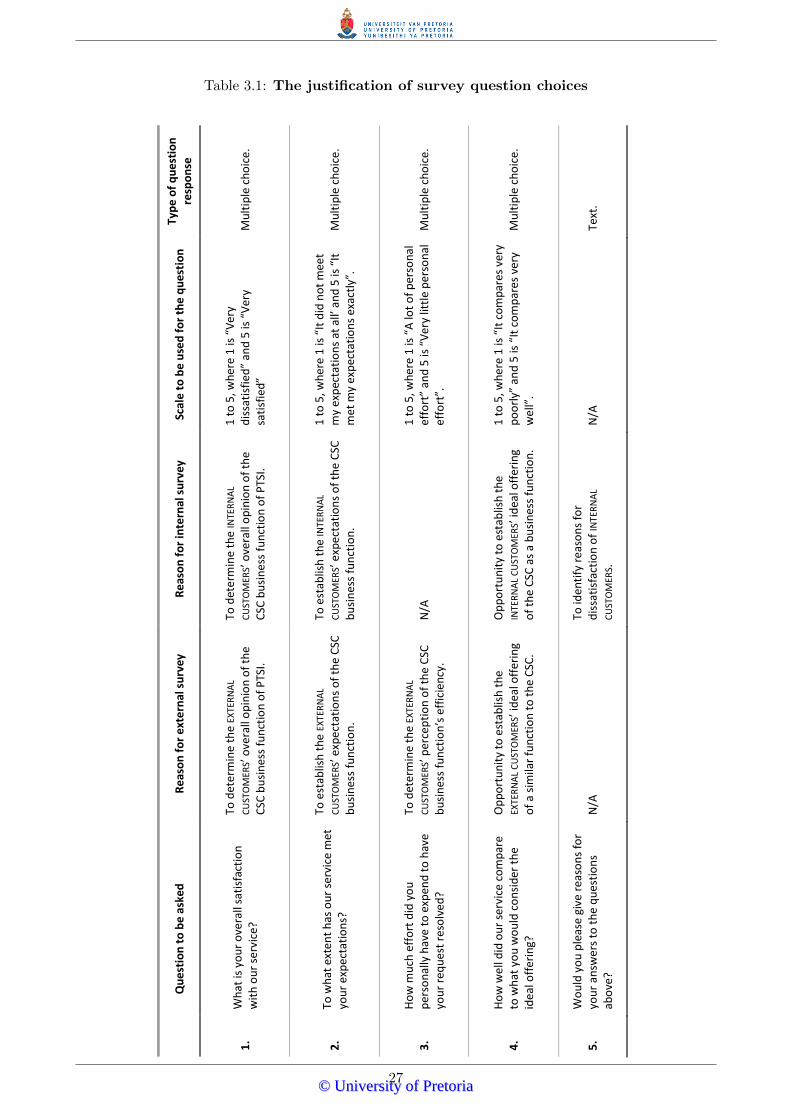
Table 3.1: The justification of survey question choices
Qu
esti
on
to
be
aske
d
Re
aso
n f
or
ext
ern
al s
urv
ey
Re
aso
n f
or
inte
rnal
su
rvey
Sc
ale
to b
e u
sed
fo
r th
e q
ue
stio
n
Typ
e o
f q
ue
stio
n
resp
on
se
1.
Wh
at is
yo
ur
ove
rall
sati
sfac
tio
n
wit
h o
ur
serv
ice?
To d
ete
rmin
e t
he
EXTE
RN
AL
CU
STO
MER
S’ o
vera
ll o
pin
ion
of
the
CSC
bu
sin
ess
fun
ctio
n o
f P
TSI.
To d
ete
rmin
e t
he
INTE
RN
AL
CU
STO
MER
S’ o
vera
ll o
pin
ion
of
the
CSC
bu
sin
ess
fun
ctio
n o
f P
TSI.
1 t
o 5
, wh
ere
1 is
“V
ery
dis
sati
sfie
d”
and
5 is
“V
ery
sati
sfie
d”
Mu
ltip
le c
ho
ice
.
2.
To w
hat
ext
ent
has
ou
r se
rvic
e m
et
you
r ex
pec
tati
on
s?
To e
stab
lish
th
e EX
TER
NA
L
CU
STO
MER
S’ e
xpec
tati
on
s o
f th
e C
SC
bu
sin
ess
fun
ctio
n.
To e
stab
lish
th
e IN
TER
NA
L
CU
STO
MER
S’ e
xpec
tati
on
s o
f th
e C
SC
bu
sin
ess
fun
ctio
n.
1 t
o 5
, wh
ere
1 is
“It
did
no
t m
eet
my
exp
ecta
tio
ns
at a
ll’ a
nd
5 is
“It
m
et m
y ex
pec
tati
on
s ex
actl
y”.
Mu
ltip
le c
ho
ice
.
3.
Ho
w m
uch
eff
ort
did
yo
u
per
son
ally
hav
e to
exp
end
to
hav
e yo
ur
req
ues
t re
solv
ed?
To d
ete
rmin
e t
he
EXTE
RN
AL
CU
STO
MER
S’ p
erce
pti
on
of
the
CSC
b
usi
nes
s fu
nct
ion
’s e
ffic
ien
cy.
N/A
1
to
5, w
her
e 1
is “
A lo
t o
f p
erso
nal
ef
fort
” an
d 5
is “
Ver
y lit
tle
per
son
al
effo
rt”.
M
ult
iple
ch
oic
e.
4.
Ho
w w
ell
did
ou
r se
rvic
e co
mp
are
to w
hat
yo
u w
ou
ld c
on
sid
er t
he
idea
l off
erin
g?
Op
po
rtu
nit
y to
est
ablis
h t
he
EXTE
RN
AL
CU
STO
MER
S’ id
eal o
ffer
ing
of
a si
mila
r fu
nct
ion
to
th
e C
SC.
Op
po
rtu
nit
y to
est
ablis
h t
he
INTE
RN
AL
CU
STO
MER
S’ id
eal o
ffer
ing
of
the
CSC
as
a b
usi
nes
s fu
nct
ion
.
1 t
o 5
, wh
ere
1 is
“It
co
mp
ares
ver
y p
oo
rly”
an
d 5
is “
It c
om
par
es v
ery
we
ll”.
Mu
ltip
le c
ho
ice
.
5.
Wo
uld
yo
u p
leas
e gi
ve r
easo
ns
for
you
r an
swe
rs t
o t
he
qu
esti
on
s ab
ove
? N
/A
To id
enti
fy r
easo
ns
for
dis
sati
sfac
tio
n o
f IN
TER
NA
L
CU
STO
MER
S.
N/A
Te
xt.
27
©© UUnniivveerrssiittyy ooff PPrreettoorriiaa

3.5 Statistical analysis of survey outputs
For the results of a survey to be significant to the business, the Response Rate (RR) must be greater
than 80% (Brogle, 2014). The RR will be calculated by using the following formula:
RR(%) =n
N× 100 (3.2)
The sample size of the analysis will only be the number of responses received and is denoted as n
and N represents all the surveys distributed.
After the results of the returned surveys are input into the calculation sheet the following calcula-
tions will be available:
1. The average CS score per survey
AverageScore/Survey = y =
∑yi
Total#ofQuestions, i = 1, 2, 3, 4 (3.3)
2. The average score per question (four questions for the external surveys and three for the internal
surveys)
AverageScore/Question = x =
∑ni=1 xin
(3.4)
3. The mean CS score
MeanCSScore = ¯y =y
n(3.5)
4. The median CS score
Median = ym = yn+12
(3.6)
when n is an odd number
Median = ym =yn
2+ yn+2
2
2(3.7)
when n is an even number
28
©© UUnniivveerrssiittyy ooff PPrreettoorriiaa

5. The variance and standard deviation (σ)
V ariance =
∑ni=1(yi − ¯y)
n(3.8)
σ =√V ariance (3.9)
6. To test the accuracy of the data, the margin of error (e), based on the mean CS score and the
predetermined confidence level (Initial z = 1.645), is calculated.
e = z × σ√n
=1.645σ√
n(3.10)
7. The optimal sample size will then be determined once again after testing the accuracy of the
data and the re-evaluation of the adequacy of the confidence level.
From the calculations from the surveys’ outputs, it can be noted that a cyclic pattern appears. Figure
3.4 is the visual representation of the cyclic pattern to the statistical analysis of the survey outputs
as explained.
Optimal sample size
Response Rate
Average Customer Satisfaction Score
Average score per question
Mean Customer Satisfaction Score
Median Customer Satisfaction Score
Variance and Standard Deviation
Margin of Error
Figure 3.4: Cyclic pattern of the statistical analysis of the survey outputs
29
©© UUnniivveerrssiittyy ooff PPrreettoorriiaa

The statistical attributes were chosen for the mathematical models for the external and inter-
nal feedback tools, because of their statistical significance. The attributes will all be automatically
calculated by the two survey models, but one attribute will need manual intervention. This will be
the grouping of the reasons according to type given as answers to the fourth question of the internal
survey. The groupings will be used to generate a Pareto chart to determine the groups that cause the
greatest dissatisfaction among the internal customers.
3.6 CS inputs for the PM system
The attributes mentioned in Section 3.5 are all statistically significant, but not necessarily relevant
when it comes to the measurement of the CSC’s performance. They are also not as easy to interpret
in a statistical format.
The proposed solution to this obstacle is the use of line charts and the Upper and Lower Specifica-
tion Limits concept of statistical quality control principles for the visual representation of the survey
scores. The charts are a graphical display of a quality characteristic of a sample measured over time,
to show that a process is in control (Montgomery, 2013). In this project, the limits can be used to
identify classes of customers and develop strategies to engage with them accordingly.
These line charts will be used to plot n on the x-axis, the y values on the y-axis and the Target
Value (TV) will also be a line on the graph. The ¯y will be presented as the centre line on the line chart
for segmentation, as well as on a gauge chart to show the overall CS of the internal and external
customers. Specification limits will be decided upon and included on the line charts. The data will
be presented in a manner similar to Figure 3.5.
Figure 3.5: Conceptual graphical representation of the survey results by means of line
charts
In a case like this, a the-Higher-the-Better one-sided scenario is applicable, because the optimal
would be if the CS scores were as high as possible. This means that the only applicable specification
limit would be the Lower Specification Limit (LSL) to ensure that the scores do not cross that limit.
30
©© UUnniivveerrssiittyy ooff PPrreettoorriiaa

The reason why the one-sided scenario was not chosen alone, is to enable the user to potentially
identify different groups of customers and to then devise engagement strategies to improve the overall
CS score of the business function.
The Pareto principle states that quality losses within a process are not distributed evenly and that
a small proportion of possible causes are responsible for the bulk of the quality problems. Plainly
stated, only a few “bad apples” account for the majority of the experienced quality losses. A Pareto
chart (Figure 3.6) is used to visually illustrate the distribution of the quality losses across relevant
categories by using a histogram (StatSoft, 2000). The order of the categories is descending in the
order of importance and here the categories will be arranged in descending order of frequency of
reason category.
Figure 3.6: Conceptual graphical representation of the reason groupings by means of a
Pareto chart
3.7 Additional inputs for the PM system
The call centre metrics mentioned in Chapter 2 can be converted to visual representations and added
on the dashboard in order to get an overall view of the performance of the CSC. All the charts will
be displayed in a dashboard format with an interpretation linked to each graph.
Due to the additional first-tier support that the CSC provides to PTSI’s Engineering Information
Systems (EIS) and Energy Management (EM) clients there exists a need for the measuring of the
performance of those services. Additional to the first-tier support, the capturing of incoming calls,
that are routed through the CSC, should be measured, too. After consultation, it was determined
that the following aspects should be measured in order to determine the efficacy of the implemented
solutions along with the efficiency of the CSC’s support:
• Number of abandoned incoming calls from the Private Branch Exchange (PBX) system
• Number of successfully transferred incoming calls
• Number of messages taken for unsuccessfully transferred incoming calls
31
©© UUnniivveerrssiittyy ooff PPrreettoorriiaa

• Number of recorded support calls for each of the supported LoB’s
• Number of resolved support calls for each of the supported LoB’s
• Time-to-Resolution (TTR) of the resolved support calls
The sources of these aspects include the current PBX system and the implemented Software-as-a-
Service Customer Relationship Management (CRM) solution. The outputs of the sources need some
extra intervention to facilitate incorporation into the developed PM system. The intervention can also
be seen as a model of sorts because it should be able to process the outputs of the systems as inputs
and produce answers that are understandable and usable.
3.8 Building of the models
The three models need to be designed and built in a software application that will be easy for the end
user to use and possess the necessary calculation abilities to do the required calculations. Four alter-
natives were considered for this purpose and Table 3.2 summarises the advantages and disadvantages
of each considered alternative.
The conclusion that was drawn from considering the alternatives, was that the three models would
be built in Microsoft Excel, because of the application’s versatility and ease of use. Another reason for
building the models in MS Excel is that the models’ end users are familiar and comfortable with the
format. The protection functions of MS Excel would be used to prevent tampering and unauthorised
changes to the models. Other formats might be more advanced and maybe even safer, thus further
investigation of possible alternatives could be considered as an expansion of this project.
32
©© UUnniivveerrssiittyy ooff PPrreettoorriiaa

Table 3.2: Summary of the advantages and disadvantages of available software application
alternatives
Co
nsi
der
ed
Alt
ern
ativ
e A
dva
nta
ges
Dis
adva
nta
ges
Mic
roso
ft E
xcel
Fam
iliar
ity
for
end
use
r
Cu
rren
t to
ol u
sed
fo
r re
po
rtin
g
Pro
tect
ion
set
tin
gs a
vaila
ble
to
sec
ure
d w
ork
shee
ts
Dat
a p
roce
ssin
g e
asie
r w
ith
nat
ive
Piv
ot
Tab
les
and
Piv
ot
Ch
arts
Lin
ks t
o e
xter
nal
dat
a so
urc
es a
vaila
ble
fo
r au
tom
ated
im
po
rtin
g o
f d
ata
No
ext
ra c
ost
s n
eed
to
be
incu
rred
to
acq
uir
e th
e p
rogr
am
Litt
le t
o n
o a
uto
mat
ic v
ersi
on
co
ntr
ol
Po
ten
tial
fo
r in
accu
rate
ou
tpu
ts d
ue
to b
roke
n li
nks
or
form
ula
e
Lin
ks t
o e
xter
nal
dat
a so
urc
es f
or
auto
mat
ic im
po
rtin
g o
nly
ava
ilab
le in
late
st M
S O
ffic
e (2
016
)
Can
’t b
e ef
fect
ivel
y h
ost
ed a
nd
mu
st b
e st
ore
d o
n in
tern
al
shar
ed D
rive
s
Use
r in
terf
ace
no
t at
trac
tive
Mic
roso
ft A
cces
s D
atab
ase
Rel
atio
nal
dat
abas
es e
nab
le r
elat
ing
imp
ort
ant
attr
ibu
tes
of
tab
les
wit
h e
ach
oth
er in
th
e b
ackg
rou
nd
Use
of
form
s as
th
e u
ser
inte
rfac
es p
oss
ible
Form
s m
ake
for
attr
acti
ve u
ser
inte
rfac
es
Go
od
pro
tect
ion
set
tin
gs
Go
od
ver
sio
n c
on
tro
l
Can
be
ho
ste
d f
or
mu
ltip
le p
arty
acc
ess
Un
fam
iliar
to
ol t
o m
ost
en
d u
sers
Nee
d f
or
exte
nsi
ve t
rain
ing
to c
reat
e f
amili
arit
y
Hav
e to
exp
ort
dat
a to
MS
Exce
l fo
r d
ata
pro
cess
ing
wit
h
Piv
ot
tab
les
Cu
sto
m F
orm
-Bas
ed
Mic
roso
ft S
har
ePo
int
Ap
plic
atio
n
Use
of
form
s as
th
e u
ser
inte
rfac
es p
oss
ible
Form
s m
ake
for
attr
acti
ve u
ser
inte
rfac
es
Po
ten
tial
so
luti
on
fo
r th
e fu
ture
Nee
ds
des
ign
an
d d
evel
op
men
t fr
om
scr
atch
Un
def
ined
in-h
ou
se d
evel
op
men
t ab
iliti
es
Tim
ely
and
co
stly
if d
evel
op
ed e
xter
nal
ly
Exte
rnal
par
ty im
ple
men
tati
on
if d
evel
op
ed e
xter
nal
ly
Thir
d P
arty
So
ftw
are
Ap
plic
atio
n
Po
ten
tial
ly e
xcit
ing
app
licat
ion
(“N
ew T
oy”
Eff
ect)
Req
uir
es a
n in
-dep
th a
nal
ysis
to
det
erm
ine
its
suit
abili
ty
for
PTS
I
Co
stly
Exte
rnal
par
ty im
ple
men
tati
on
33
©© UUnniivveerrssiittyy ooff PPrreettoorriiaa

Chapter 4
Solution design
A culmination of the concepts explained in Chapter 3 results in the following solution. Starting
off with the preparation of the data needed as inputs to the Customer Satisfaction (CS) models.
This preparation requires some equations described in Chapter 3 and the rest of the equations are
incorporated into the Excel models. The models are finally presented and explained.
4.1 Final data preparation
Seeing as random sampling was chosen as the sampling approach, data preparation is required to
ensure the feedback from the customers is representative of the total population. The sample size is
determined using the equation explained earlier and then broken up as to ensure further representa-
tivity.
4.1.1 Initial sample sizes
The formula explained in Section 3.3.4, with certain predetermined attributes, was used to determine
the external and internal customer sample sizes, respectively. A predetermined Margin of
Error, confidence level and a probability of success was decided upon. The resulting sample sizes are
shown in Table 4.1:
Table 4.1: Sample size calculations
Figures 4.1 and 4.2 show how the predetermined aspects and the sample sizes are displayed in the
Excel models to enable processing in the models.
34
©© UUnniivveerrssiittyy ooff PPrreettoorriiaa

Figure 4.1: Attributes decided upon beforehand
Figure 4.2: Sample sizes calculated based on the attributes decided upon
4.1.2 External customers’ comparability and representativity
The external customers of Powertech System Integrators (Pty) Ltd (PTSI) are considered com-
parable with each other based on the fact that they make use of the Customer Support Centre (CSC)
to contact the business and they all are the source of the business’s income. From a representativity
aspect, they can be segmented according to the market sectors they trade in and how much revenue
is generated from PTSI doing business with them. If an increase in delivered solutions in a specific
sector occurs, then an increased need for contact and support will inevitably follow. A greater need for
contact and support leads to increased volumes of interactions with the CSC of PTSI. When the CSC
interacts with customers from a certain sector regularly, it becomes paramount that the customers are
satisfied with those interactions.
Customer, revenue and market sector data were sourced from the PTSI Enterprise Resource Plan-
ning system, from the 2010-2011 financial year to the 2105-2016 financial year, to determine a repre-
sentative sample of the external surveys. Table 4.2 is the breakdown of the number of surveys to be
sent out based on the initial sample size calculated. Figure 4.3 shows a visual representation of the
current segmentation of PTSI customers based on the revenue generated from solutions provided to
them across all the Lines of Business (LoB’s) and the market sector they trade in.
35
©© UUnniivveerrssiittyy ooff PPrreettoorriiaa

Table 4.2: Breakdown of the number of surveys to be distributed to external customers
Figure 4.3: External customers’ segmentation
4.1.3 Internal customers’ comparability and representativity
The comparability of the internal customers of the CSC is based firstly on the fact that all of
them are employees of PTSI and secondly on an internal business rule that states that as many as
possible external calls should be channelled through the CSC to the employees (refer to Figure 3.3 for
36
©© UUnniivveerrssiittyy ooff PPrreettoorriiaa

the As-Is Communications Process).
An organisational chart of the various departments and LoB’s in PTSI can be used to determine the
representativity of the internal customers. Table 4.3 is the breakdown of the internal surveys to
be distributed based on the initial sample size calculated and Figure 4.4 shows a visual representation
of the current segmentation of the internal customers according to the PTSI organisational chart.
Table 4.3: Breakdown of the number of surveys to be distributed to internal customers
Figure 4.4: Internal customers’ segmentation
A detailed design of the internal survey is included in Appendix A along with the script followed
37
©© UUnniivveerrssiittyy ooff PPrreettoorriiaa

for the telephonic surveys.
4.1.4 Preparation of the additional inputs
PTSI uses a Private Branch Exchange (PBX) as a telephone switching system within the business.
The number of incoming calls from external sources is recorded along with the duration of the waiting
time before the call is answered and the duration of the calls themselves. The system also records the
number of abandoned calls, which are calls that could not be answered because they were ended in
the first 10 seconds of the total call duration. These results can be used to determine the average call
duration of the CSC due to the fact that all external incoming calls are routed through the CSC.
The incoming calls that are transferred successfully and the unsuccessfully transferred calls are all
recorded using the implemented Customer Relationship Management (CRM) system that have been
configured to the specifications of PTSI. The records of the first-tier support that the CSC provides
to the LoB’s are also captured in the CRM system and can thus be reported on. A functionality to
create reports within the system exists and the reports can be exported in an Excel format for easy
simplification of the data.
The simplification of the exported data from the CRM system is done by using the Pivot Table
and Pivot Chart functionality of Excel. The Pivot Table presents the data in a comprehensible format
and the Pivot Chart presents the data from the Pivot Table visually. Using Pivot Tables and Charts
are beneficial when working with dynamic data because they change as the data changes.
4.2 Microsoft Excel models
Two models were developed to process the outputs of the customer feedback tools and a third model
was developed to process all the other additional inputs relevant to the Performance Measurement
(PM) system of the CSC.
4.2.1 Model 1: External Customer Satisfaction
The outputs of the customer feedback tool used to measure the CS the external customers are
presented as shown in Figure 4.5. The recorded responses are populated in the white blocks as they
are the data source for the calculations and processing taking place on the sheet. The processed data
is then displayed in green to differentiate between captured and processed data.
The statistical attributes referred to in Section 3.5 are calculated and displayed for control purposes.
The most relevant information is displayed on the dashboard for easy reporting.
38
©© UUnniivveerrssiittyy ooff PPrreettoorriiaa
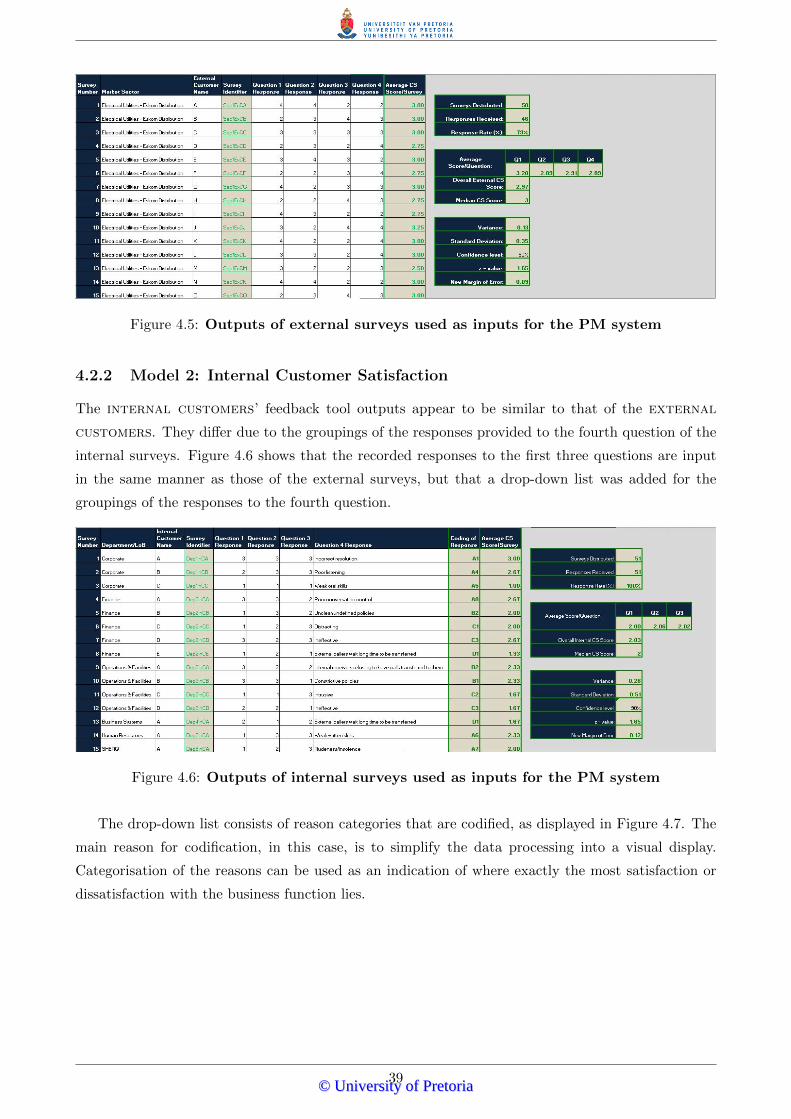
Figure 4.5: Outputs of external surveys used as inputs for the PM system
4.2.2 Model 2: Internal Customer Satisfaction
The internal customers’ feedback tool outputs appear to be similar to that of the external
customers. They differ due to the groupings of the responses provided to the fourth question of the
internal surveys. Figure 4.6 shows that the recorded responses to the first three questions are input
in the same manner as those of the external surveys, but that a drop-down list was added for the
groupings of the responses to the fourth question.
Figure 4.6: Outputs of internal surveys used as inputs for the PM system
The drop-down list consists of reason categories that are codified, as displayed in Figure 4.7. The
main reason for codification, in this case, is to simplify the data processing into a visual display.
Categorisation of the reasons can be used as an indication of where exactly the most satisfaction or
dissatisfaction with the business function lies.
39
©© UUnniivveerrssiittyy ooff PPrreettoorriiaa

Figure 4.7: Codification of the reasons given by the internal customers
The visual displays of the processed and codified data also appears on the dashboard of the PM
system for easy reporting and a visual comparison to the external CS data.
Specification limits
The specification limits for both internal and external customers were set at 5 and 1 and the
Target Values (TV’s) were chosen as 3 for internal customers and 3.5 for external customers.
Figure 4.8 shows all the Limits together as they apply to external and internal customers.
Figure 4.8: Warning and control limits based on the external and internal customer feed-
back
40
©© UUnniivveerrssiittyy ooff PPrreettoorriiaa

4.2.3 Model 3: Additional Performance Measurement inputs
PBX system inputs
The PBX system’s report has to be manually captured (Figure 4.9) in this PM system because the
PBX does not have the integration capabilities to make it a seamless solution. The report is of
importance when it comes to measuring the total number of incoming and outgoing calls along with
the call loss rate and the call service level of the CSC as a business function, in order for it to be
included in the PM system.
A gauge chart, available as an Add-In for Excel, is an effective way to visually display the most
important metric from the PBX system. A gauge chart was added to the dashboard to display the
service level of the CSC’s call taking activities.
Figure 4.9: Outputs from the PBX system
CRM system inputs
The CRM system outputs, in the form of exported reports, also requires some manual intervention
before being included in the PM system of the CSC. The Pivot Tables that were constructed from
the exported reports are shown in Figure 4.10. The inter-connectivity between the Pivot Tables and
the Pivot Charts makes it possible to easily move back and forth between the graphic and the tabular
views of the exported data. The Pivot Charts, that are linked to the Pivot Tables, are included on
the dashboard of the PM system because they are easier to read and thus easier to report on.
41
©© UUnniivveerrssiittyy ooff PPrreettoorriiaa

(a) All recorded cases per record type(b) All resolved cases per record type
(c) All incoming calls per CSC agent
(d) EIS recorded cases
(e) EDA recorded cases
(f) ecWin recorded cases
Figure 4.10: Pivot Tables created from exported CRM reports
The concept of “Record Types” is used in the CRM as a way to differentiate between business
processes, pick-list values and page layouts. Record Types facilitate ease-of-use for different business
functions who use the CRM for conducting business. The details surrounding the design and setup of
the Record Types are out of scope for this project.
4.3 Linking the PM system to the business’s strategic goals
Hudson et al. (2001) identify criteria that a PM system should adhere to, to be considered as a strategic
42
©© UUnniivveerrssiittyy ooff PPrreettoorriiaa

PM system (Section 2.3.2). This approach was followed and a homepage for the CSC’s PM system
was designed. The homepage enables the user to link the CSC’s goals and objectives to the business
strategy and see where the CSC fits into the bigger picture of the business. It also links the goals
and objectives to metrics. The metrics are linked via hyperlinks to their visual representations on the
dashboard to make them easy to find and report on.
Appendix B contains the designed homepage with the business function goals and objectives relat-
ing to customer satisfaction and first-tier support already populated. This homepage can be expanded
should additional goals and objectives be added.
The activities portion of the homepage enables the period to period tracking of the necessary
activities and their due dates. This enables the business function to accomplish the identified goals
and objectives to further facilitate the business’s strategy. The activities should be updated, by the
user, manually during every reporting period to keep up to date with the progress of the activities.
The symbols in the left-hand corner can be used to state the progress of the activities.
43
©© UUnniivveerrssiittyy ooff PPrreettoorriiaa

Chapter 5
Results, interpretations and solution
validation
In this chapter, the results are presented along with their interpretations. The solution is then validated
and conclusions are drawn. Finally, future work is discussed.
5.1 Results and interpretations
The results obtained from the customer feedback tools along with the additional Performance Mea-
surement (PM) inputs are discussed in this section. The outputs of the Customer Satisfaction (CS)
models are discussed in detail and interpreted. The additional inputs are shortly explained in the
context of what they mean to the Customer Support Centre (CSC) from a performance perspective.
A dashboard is used to display the results, is also discussed.
The first three displays on the dashboard are called gauge charts, which displays a single result
on a spectrum broken up into desirable, intermediate and undesirable ranges. The first gauge chart
displays the Private Branch Exchange (PBX) service level and the following gauge charts show the
CS scores of the external and internal customers, respectively.
(a) Overall PBX service level of the
CSC
(b) Overall external customers’
satisfaction with the CSC
(c) Overall internal customers’
satisfaction with the CSC
Figure 5.1: Gauge charts displayed on the PM system dashboard
Figure 5.1a shows that the CSC’s service level regarding the PBX system is remarkably high at
44
©© UUnniivveerrssiittyy ooff PPrreettoorriiaa

92%, and a conclusion can be drawn that the business function focuses on answering every external
call coming into Powertech System Integrators (Pty) Ltd (PTSI). The abandoned calls causing the
missing 8% of the service level was identified as the improvement opportunity regarding the service
level.
From Figure 5.1b it can be seen that the external customers’ overall satisfaction with the
CSC only measures at a 2.97 out of 5. This is a troubling, but a redeemable result. Serious attention
and effort will be needed to improve on the overall external CS.
A revealing and troubling result was observed when analysing the internal customers’ overall
satisfaction. From Figure 5.1c it can be seen that the internal customers of the business function
are very dissatisfied with its service. The reason groupings (Figure 4.7) also mainly consist out of
dissatisfaction from the PTSI employees’ perspectives.
The following two charts (Figures 5.2 and 5.3) are the line charts described in Section 3.6 and
display the external and internal customers’ segmentation according to their responses on the
surveys.
Figure 5.2: External customers’ segmentation based on the external survey responses
Figure 5.3: Internal customers’ segmentation based on the internal survey responses
Blocks of colour are used to indicate the areas between the Specification Limits, the Target Value
45
©© UUnniivveerrssiittyy ooff PPrreettoorriiaa

(TV) and the overall CS scores. The areas are used to segment the customers based on their individual
CS scores. The green area on the chart spans from the TV to the Upper Specification Limit (USL),
the yellow area spans from the calculated overall average CS score (Figures 5.1b and 5.1c) to the TV
and the red area spans from the Lower Specification Limit (LSL) to the overall average CS score.
The top line of the green area is the USL that was chosen to be 5 as it is the highest score that
can be achieved from the model. Its counterpart is indicated as the bottom line of the red area and
set at 1 to show the USL. This limit is of greater significance than the USL in this particular case as
a low score is very undesirable when it comes to CS. The top line of the red area is the overall CS
satisfaction scores, 2.97 out of 5 for external and 2.03 out of 5 for internal. The top line of the
yellow area shows the TV for each of the types of customers.
It was decided that the TV for the external customers should rather be at 3.5 out of 5 since
the current overall score is already very close to 3. A starting point of 3 was established for the
internal customers since the overall score is so low to start off with. The function for the TV is
to facilitate the formulation of improvement strategies, such as explained in Figure 1.4.
From these line charts the following customer segmentation can be done:
1. Critical customers: The scores that fall in the red area on the chart can be seen as critical
customers and need the most attention. The engagement strategies required to improve those
customers’ perceptions and emotions, towards the CSC, include personal contact with the cus-
tomers and severe corrective actions on the CSC’s part. Everything that should not be done
can be learnt from the root-cause analysis interactions with these customers. The “bad habits”
of the CSC can be identified and corrected from the interactions.
2. Stable customers: The customers’ scores that fall in the yellow area of the chart can be con-
sidered as the stable customers. The ideal would be to improve their perceptions and emotions,
even more, to yield a higher CS score. It is important to remember that the stable customers
would be upset if a perception of a lack of attention is created simply because they are “stable”.
3. Healthy customers: These customers (with CS scores falling in the green area) are the most
positive about the business function. Meaningful elicitation interactions with them can shed light
on what exactly they appreciate about the business function’s manners. The positive points can
then be used to improve the other segments’ perceptions and satisfaction scores. An important
aspect to keep in mind for the customers in this segment is that they should be taken care of
and never neglected. This opens up the possibility to appoint resources to focus specifically on
these customers, much like a Key Account Manager would from a sales perspective.
Figure 5.4, the Pareto chart, follows with the frequency of groupings from the internal cus-
tomers’ reasons on the surveys. It was found that only six of the 19 reasons cause 80% of the
dissatisfaction of the internal customers. Reasons A5, C3 and D2 were the reasons given most
frequently by the internal customers. From the codification the three most common reasons are
the agents’ weak oral skills over the phone, the perception that the service the CSC delivers is ineffec-
tive and that the internal customers don’t want their incoming calls to be transferred to them.
These three groupings will have to be the focus of a potential improvement strategy. The reasons
46
©© UUnniivveerrssiittyy ooff PPrreettoorriiaa
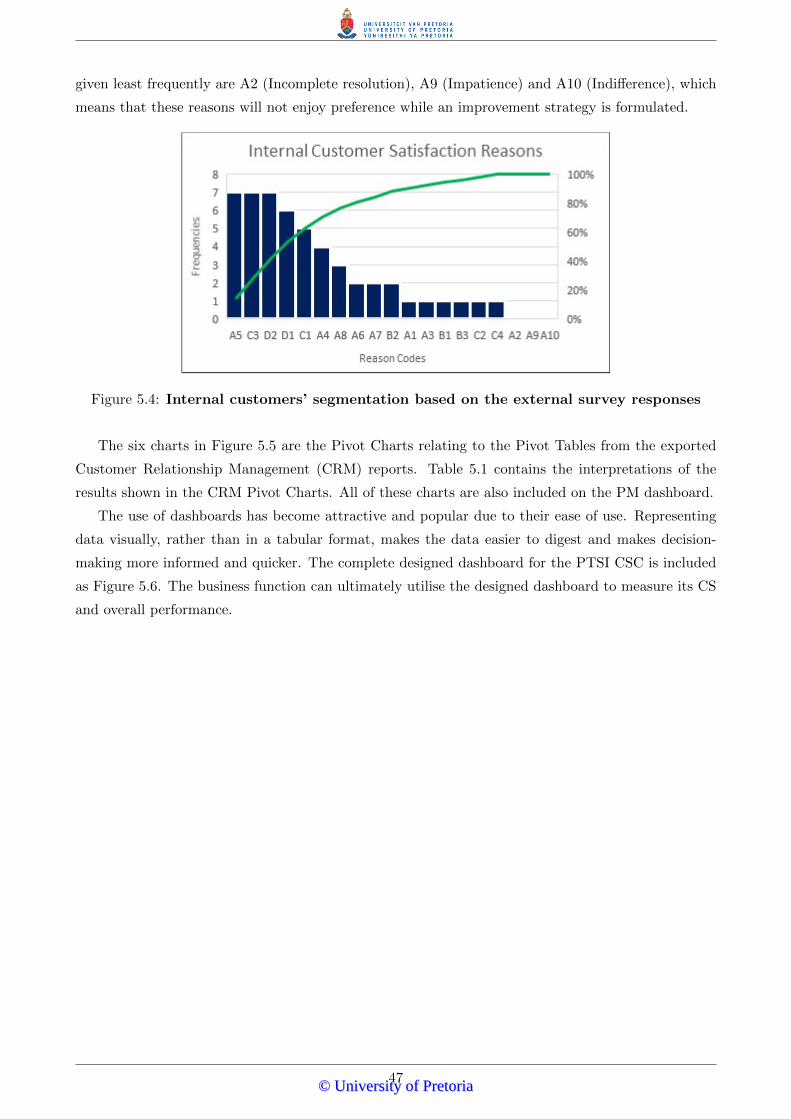
given least frequently are A2 (Incomplete resolution), A9 (Impatience) and A10 (Indifference), which
means that these reasons will not enjoy preference while an improvement strategy is formulated.
Figure 5.4: Internal customers’ segmentation based on the external survey responses
The six charts in Figure 5.5 are the Pivot Charts relating to the Pivot Tables from the exported
Customer Relationship Management (CRM) reports. Table 5.1 contains the interpretations of the
results shown in the CRM Pivot Charts. All of these charts are also included on the PM dashboard.
The use of dashboards has become attractive and popular due to their ease of use. Representing
data visually, rather than in a tabular format, makes the data easier to digest and makes decision-
making more informed and quicker. The complete designed dashboard for the PTSI CSC is included
as Figure 5.6. The business function can ultimately utilise the designed dashboard to measure its CS
and overall performance.
47
©© UUnniivveerrssiittyy ooff PPrreettoorriiaa
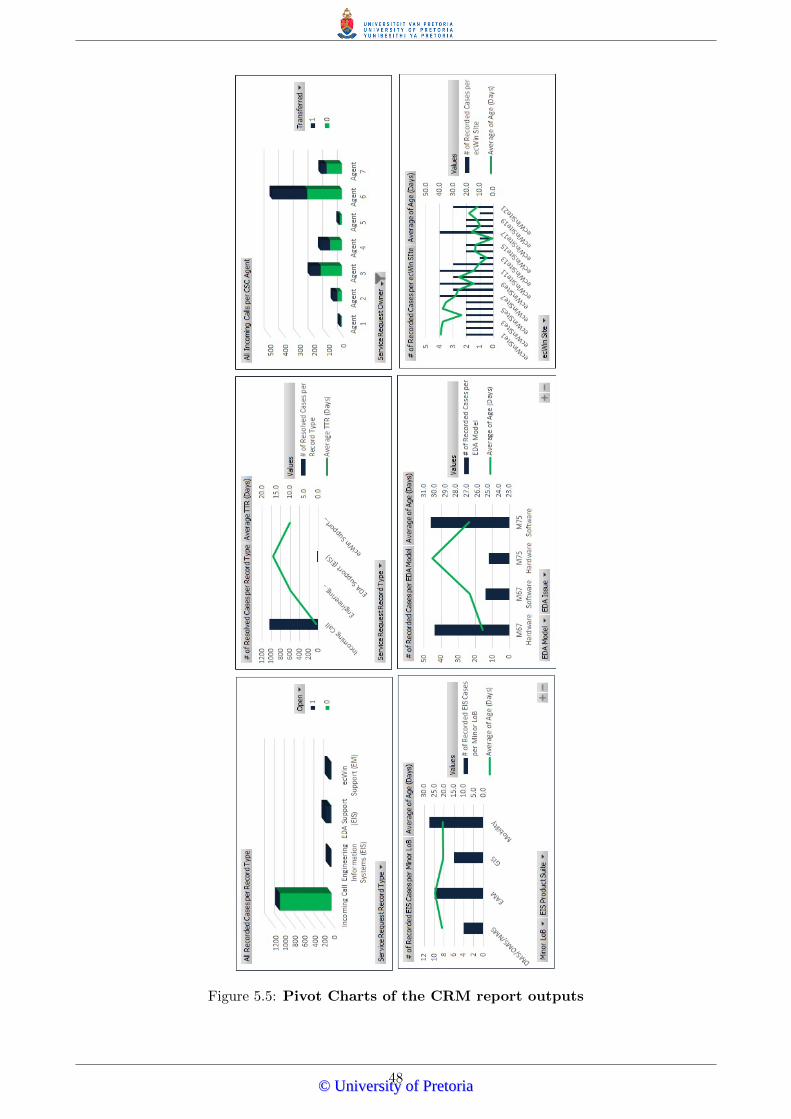
Figure 5.5: Pivot Charts of the CRM report outputs
48
©© UUnniivveerrssiittyy ooff PPrreettoorriiaa

Table 5.1: Interpretations of results from the CRM Pivot Charts
49
©© UUnniivveerrssiittyy ooff PPrreettoorriiaa

PB
X S
ervi
ce L
eve
lO
vera
ll Ex
tern
al C
ust
om
er
Sati
sfac
tio
n
Ove
rall
Inte
rnal
Cu
sto
me
r
Sati
sfac
tio
n
0.0
0
1.0
0
2.0
0
3.0
0
4.0
0
5.0
0
6.0
0
13
57
91
11
31
51
71
92
12
32
52
72
93
13
33
53
73
94
14
34
5
Average Survey Scores
Surv
ey N
um
ber
s
Exte
rnal
Cu
sto
mer
Seg
men
tati
on
TV t
o U
SL
Ave
rage
to
TV LSL
toA
vera
ge0
.00
1.0
0
2.0
0
3.0
0
4.0
0
5.0
0
6.0
0
14
71
01
31
61
92
22
52
83
13
43
74
04
34
64
9
Average Survey Scores
Surv
ey N
um
ber
s
Inte
rnal
Cu
sto
mer
Seg
men
tati
on
TV t
o U
SL
Ave
rage
to
TV LSL
toA
vera
ge
02
00
40
06
00
80
01
00
01
20
0
Inco
min
gC
all
Engi
nee
rin
gIn
form
atio
nSy
stem
s(E
IS)
EDA
Sup
po
rt(E
IS)
ecW
inSu
pp
ort
(EM
)
1 0
Op
en
Serv
ice
Re
qu
est
Re
cord
Typ
e
All
Rec
ord
ed C
ases
per
Rec
ord
Typ
e
0.0
5.0
10
.0
15
.0
20
.0
02
00
40
06
00
80
01
00
01
20
0
# o
f R
eso
lved
Cas
esp
er
Rec
ord
Typ
e
Ave
rage
TTR
(D
ays)
Val
ue
s
Serv
ice
Re
qu
est
Re
cord
Typ
e
# o
f R
eso
lved
Cas
es p
er R
eco
rd T
ype
Ave
rage
TTR
(D
ays)
0
10
0
20
0
30
0
40
0
50
0
Age
nt
1A
gen
t2
Age
nt
3A
gen
t4
Age
nt
5A
gen
t6
Age
nt
7
1 0
Tran
sfe
rred
Serv
ice
Re
qu
est
Ow
ner
All
Inco
min
g C
alls
per
CSC
Age
nt
0.0
10
.0
20
.0
30
.0
40
.0
50
.0
012345
ecWinSite1
ecWinSite3
ecWinSite5
ecWinSite7
ecWinSite9
ecWinSite11
ecWinSite13
ecWinSite15
ecWinSite17
ecWinSite19
ecWinSite21
# o
f R
eco
rded
Cas
esp
er
ecW
in S
Ite
Ave
rage
of
Age
(D
ays)
Val
ue
s
ecW
in S
ite
# o
f R
eco
rded
Cas
es p
er e
cWin
SIt
eA
vera
ge o
f A
ge (
Day
s)
23
.0
24
.0
25
.0
26
.0
27
.0
28
.0
29
.0
30
.0
31
.0
0
10
20
30
40
50
M6
7H
ard
war
eM
67
Soft
war
eM
75
Har
dw
are
M7
5So
ftw
are
# o
f R
eco
rded
Cas
esp
er
EDA
Mo
del
Ave
rage
of
Age
(D
ays)
Val
ue
s
EDA
Mo
del
EDA
Issu
e
# o
f R
eco
rde
d C
ases
per
ED
A M
od
elA
vera
ge o
f A
ge (
Day
s)
0.0
5.0
10
.01
5.0
20
.02
5.0
30
.0
024681
01
2
# o
f R
eco
rded
EIS
Cas
es
pe
r M
ino
r Lo
B
Ave
rage
of
Age
(D
ays)
Val
ue
s
Min
or
LoB
EIS
Pro
du
ct S
uit
e
# o
f R
eco
rded
EIS
Cas
es p
er M
ino
r Lo
BA
vera
ge o
f A
ge (
Day
s)
Figure 5.6: The CSC PM system dashboard
50
©© UUnniivveerrssiittyy ooff PPrreettoorriiaa

5.2 Scenario analysis
When statistical models that contain independent and dependent variables are developed, it becomes
important to determine the behaviour of the variables within a set of scenarios and compare them to
some key predictions (Suganthi and Jagadeesan, 1997). A sensitivity analysis is thus conducted by
using a range of variables to test the outcomes of the models.
While a sensitivity analysis focuses on the behaviour of a specific range of independent and subse-
quently dependent variables, a scenario analysis focuses on a possible scenario with a set of conditions,
made up of the variables, that align with that scenario. A good example is a scenario of where a mar-
ket might crash and what would happen to an investment model if that set of conditions take place
(Investopedia, 2005).
In this application, a scenario analysis would provide valuable insights into how adaptable and
scalable the customer feedback models are if the models were to be taken through a few extreme
scenarios and compared to base scenarios.
Seeing as the Margin of Error and confidence level are an indication of how well the sample size
represents the population, a conclusion can be drawn from various possible scenarios as follows: The
smaller the Margin of Error and the higher the confidence level of the customer feedback models,
the closer the sampled customers’ satisfaction represents the satisfaction of the entire population of
customers. In order to achieve this closeness of the sampled customers’ satisfaction to the entire
population’s satisfaction, the sample sizes are required to be significantly larger. In other words,
the Margin of Error is indirectly proportional to the sample size and the confidence level is directly
proportional to the sample size. This aspect can positively contribute to the scalability of the customer
feedback models.
The downside of the larger required sample sizes is that if the Response Rate (RR) were to be kept
at the same level (80%), then the number of returned surveys will need to increase, as well. This will
pose a challenge, because of the non-response biases surrounding CS surveys currently experienced in
the market (Brogle, 2014).
Another downside would be the financial impact that the larger sample size will have on the
business. A larger sample size means more surveys are required and more human resources are
required to conduct said surveys. The time for the processing of the larger number of surveys will
also increase. The increased need for resources will have a negative impact on the budget set out for
measuring CS, should one be made available.
Furthermore, it could be of value to determine how much certain values need to change to obtain
a satisfactory CS score. In other words, it could be useful to determine what needs to change in the
responses of customers to minimise the yellow area on the customer segmentation charts. The area
will shrink if the overall average CS score increases and moves closer to the TV. It would be counter-
intuitive to lower the TV closer to the average score or to have a TV if the overall score is above it.
The optimal scenario would be to have an overall CS equal to the TV to validate the hypothetically
completed improvement initiatives, and then to set a higher TV with more improvement initiatives
for the coming period.
By referring to PTSI’s current customer segmentation results, it can be determined that the overall
external customers’ satisfaction scores would need to improve by 15% across the board, to reach
51
©© UUnniivveerrssiittyy ooff PPrreettoorriiaa

the current TV that is set at 3.5 out of 5. For the internal customers’ overall score to match the
current TV of 3 out of 5, an overall improvement of 32% is required. The required improvements should
be included in the business function’s strategy and translated into goals, objectives and activities to
include in the PM system.
5.3 Testing the solution against the solution requirements
In order for a solution to be relevant and effective, it should be validated. The validation of a
solution can easily be done if a set of solution requirements have been identified, clarified and stated as
guidelines for the design and functioning of the solution. Table 5.2 shows that the solution requirements
identified in Section 1.7 were addressed during the design of the PM system.
52
©© UUnniivveerrssiittyy ooff PPrreettoorriiaa

Table 5.2: The validation of the designed solution
Solu
tio
n R
eq
uir
em
en
t R
eq
uir
em
en
t A
dd
ress
ed
? H
ow
?
1 D
efin
e th
e cu
rren
t co
mm
un
icat
ive
inte
ract
ion
s b
etw
een
EX
TER
NA
L C
UST
OM
ERS
and
th
e C
SC a
nd
INTE
RN
AL
CU
STO
MER
S an
d t
he
CSC
Y
es
The
com
mu
nic
ativ
e in
tera
ctio
ns
we
re d
efin
ed a
nd
pro
cess
ed
into
a b
usi
nes
s p
roce
ss u
sin
g B
PM
N a
nd
can
be
fou
nd
in S
ecti
on
3
.2
2 D
eter
min
e an
d s
tate
th
e m
ost
ap
pro
pri
ate
app
roac
h t
o c
ust
om
er f
eed
bac
k to
ols
fo
r b
oth
EX
TER
NA
L C
UST
OM
ERS
and
INTE
RN
AL
CU
STO
MER
S Y
es
Surv
eys
wer
e id
enti
fied
as
the
mo
st a
pp
rop
riat
e a
nd
ap
plic
able
cu
sto
mer
fe
edb
ack
too
ls in
Ch
apte
r 2
3 Id
enti
fied
fee
db
ack
too
ls m
ust
be
sim
ple
, des
crip
tive
, co
st e
ffec
tive
, tim
e sa
vin
g an
d s
tati
stic
ally
sig
nif
ican
t Y
es
Stat
isti
cal a
nal
ysis
met
ho
ds
wer
e fo
un
d t
o w
ork
we
ll w
ith
cu
sto
mer
fe
edb
ack
surv
eys
and
is e
xpla
ined
in S
ecti
on
2.2
.3
4 Th
e d
esig
n o
f th
e id
enti
fied
cu
sto
mer
fee
db
ack
too
ls s
ho
uld
co
nfo
rm t
o t
he
abo
ve m
enti
on
ed a
ttri
bu
tes
Ye
s Th
e ju
stif
icat
ion
of
the
cho
sen
su
rvey
qu
esti
on
s ca
n b
e fo
un
d in
Se
ctio
n 3
.4
5 A
mat
hem
atic
al m
od
el is
req
uir
ed t
o c
aptu
re a
nd
inte
rpre
t th
e re
sult
s o
f th
e fe
edb
ack
too
ls
Ye
s R
efe
r to
Sec
tio
n 4
.2 f
or
the
mo
del
s fo
r b
oth
EX
TER
NA
L A
ND
INTE
RN
AL
CU
STO
MER
S
6 Th
e si
gnif
ican
ce o
f th
e cu
sto
mer
fee
db
ack
too
ls in
th
e m
easu
rin
g o
f p
erfo
rman
ce o
f th
e C
SC m
ust
be
det
erm
ined
an
d s
tate
d
Ye
s Th
is r
equ
irem
ent
was
ad
dre
ssed
in S
ecti
on
2.3
.1
7 A
n a
pp
rop
riat
e p
erfo
rman
ce m
easu
rem
ent
too
l fo
r th
e C
SC m
ust
be
iden
tifi
ed,
stat
ed a
nd
des
ign
ed
Ye
s R
efe
r to
Sec
tio
n 4
.3 f
or
the
des
ign
ed p
erfo
rman
ce
mea
sure
men
t sy
stem
8 Th
e id
enti
fied
per
form
ance
mea
sure
men
t to
ol m
ust
eff
ecti
vely
an
d a
ccu
rate
ly
use
th
e o
utp
uts
of
the
cust
om
er f
eed
bac
k to
ols
as
inp
uts
Y
es
By
the
use
of
hyp
erlin
ks w
ith
in E
xce
l th
e o
utp
uts
of
the
cust
om
er f
eed
bac
k to
ols
can
be
acce
sse
d
9 Th
e d
esig
ned
to
ols
an
d m
od
els
mu
st b
e m
ade
avai
lab
le in
a p
rogr
am t
hat
is
fam
iliar
to
th
e en
d u
sers
Y
es
Aft
er
con
sid
erin
g a
few
alt
ern
ativ
es, i
t w
as d
ecid
ed t
hat
M
icro
soft
Exc
el w
ill b
e u
sed
mai
nly
bec
ause
th
e en
d u
sers
of
the
too
ls a
re s
o f
amili
ar w
ith
th
e p
rogr
am
10
A
ll th
e d
esig
ned
to
ols
sh
ou
ld b
e ab
le t
o s
tan
d u
p t
o a
val
idat
ion
exe
rcis
e to
p
rove
th
e re
leva
nce
an
d e
ffec
tive
nes
s o
f th
e so
luti
on
Y
es
The
scen
ario
an
alys
is a
nd
th
e so
luti
on
val
idat
ion
tab
le p
rove
th
e re
leva
nce
an
d e
ffec
tive
nes
s o
f th
e so
luti
on
53
©© UUnniivveerrssiittyy ooff PPrreettoorriiaa

Chapter 6
Conclusion
6.1 Outcomes
The goal of this project was to develop a uniform customer feedback tool for both external cus-
tomers and internal customers of Powertech System Integrators (Pty) Ltd (PTSI) to feed into a
developed performance measurement system in order to determine the effectiveness and productivity
of the Customer Support Centre (CSC) with regard to Customer Satisfaction (CS).
From the literature studied it was found that surveys are used to collect customer feedback,
regardless of whether the customers are internal or external. It was also found that there are tested
and widely accepted survey questions already available to collect specific feedback. The designs of
the surveys must consider the target population along with what exactly the business wants to learn
from distributing the surveys and the costs thereof. The results from the surveys were analysed with
statistics to ensure the significance, accuracy and validity of the outputs. It was found that the metric
of CS form part of the most important metrics used to measure the performance of call centres.
By using Industrial Engineering tools and techniques, models were developed to process the results
of the surveys and those outputs were used as inputs for the Performance Measurement (PM) to
measure the efficiency of the CSC of PTSI. The models were built in Microsoft Excel, because of the
users’ familiarity with the program and its calculating powers. The models were validated by using a
scenario analysis, but not implemented in the business.
It was found that the external and internal CS is far less than desired and that serious improvement
initiatives should be put in place for the CS scores to improve. The specific areas identified from the
internal customers’ reason groupings further indicate that multiple improvement opportunities
exist.
The unsatisfactory CS scores have a business, financial and cultural impact on the business function
(the CSC). From a business perspective, it can indicate that the possibility of repeat communications
could be slim. This is a detrimental blow to the business because repeat business with current
customers is not as resource intensive as it would be to acquire new customers from scratch. Also, fewer
opportunities will be generated by the external customers’ connections, due to unsatisfactory
services received while in contact with the CSC.
The financial implications could include not only the lost opportunities but also the extra training
that the CSC staff will have to receive to improve on the aspects identified as lacking. Another
54
©© UUnniivveerrssiittyy ooff PPrreettoorriiaa

financial implication could be the need for financial incentives to motivate the agents to improve their
service levels.
The cultural implication of the unsatisfied customers, especially the internal customers, could
lead to demotivated CSC agents, which could have a detrimental effect on the interactions they have
with the external customers.
Viewing the bigger picture, the aspect of unsatisfied customers could overshadow the engineering
excellence and expertise that PTSI provides to the customers. It could also then damage the long-
standing relationships that the business has already built over the years.
6.2 Recommendations
6.2.1 Recommended use of the designed PM system
Should PTSI wish to continue competing in a customer-driven global market, the business should
urgently reconsider the approach that its CSC takes to customer service. By using the solution devel-
oped a process of continuous improvement can be developed. Figure 6.1 displays the recommended
steps to take in the future use of the PM system to facilitate a continuous improvement in the CS of
the CSC of PTSI.
Collect CS scores with designed surveys
Process CS scores with models
Interpret processed scores from dashboard
Draw conclusions in terms of set targets
Identify aspects in need of improvement (missed
targets)
(Re)set targets for lacking aspects
Strategise improvement opportunities with goals
and objectives
Allocate available resources to
improvement opportunities
Apply improvement strategies in business
function
Figure 6.1: Recommended use of PM system from a continuous improvement approach
55
©© UUnniivveerrssiittyy ooff PPrreettoorriiaa

In Section 5.2 a conclusion was drawn that the external customers’ satisfaction should be
improved by 15% and the internal customers’ satisfaction by 32% to match their respective
Target Values (TV’s). Specific aspects that require improvement can now be pinpointed as stated in
the continuous improvement cycle (Figure 6.1). A good place to start would be to determine which
customers’ survey responses are primarily responsible for the responses that occupy the red area on the
customer segmentation charts and centre a customer service recovery strategy around them. This is
made possible by the fact that various customers from various sectors are recorded within the models
(Figures 4.5 and 4.6).
After a customer service recovery strategy has been decided upon, aspect specific targets along with
goals and objectives for any improvement opportunities can be set. Finally, the required resources can
be allocated to apply the strategy. The validation of the strategy and the improvements will happen
when the following period’s CS scores are collected and processed.
6.2.2 Customer service recovery
Major companies such as the JetBlue (US airline) and the Walt Disney Company have customer service
recovery approaches because it was found that back-end recovery can often be more cost effective than
upfront prevention (Markidan, 2014).
These approaches include steps such as:
• Hear: Listen to the grievance of the customer and acknowledge that the fault has occurred;
• Empathise: Acknowledge the customer’s emotions regarding the fault that occurred;
• Apologise: Apologise for the fault occurring and explain the reasons for the fault;
• Resolve: Resolve the fault as quickly as possible after asking the customer what he/she would
consider an adequate resolution;
• Make good: Provide compensation to the customer should the severity of the fault require it
and
• Diagnose: After the fault has been resolved to the customer’s satisfaction it is necessary to
investigate the fault and find out why it occurred.
It is recommended that PTSI invest in a customer service recovery strategy in order to retain loyal
customers and to save money.
6.2.3 Additional recommendations
A pertinent recommendation can be made towards retraining and improving the CSC agents’ skills
overall. This could be considered as an elementary improvement in the pursuit of improved CS scores
for the business function.
To improve discipline within the business function, the implementation of a clear and achievable
internal Service Level Agreement should be investigated and considered.
Another recommendation will be the facilitation of a culture change across the entire business
to shift the business focus to a customer-centric focus. This culture change will have to include an
56
©© UUnniivveerrssiittyy ooff PPrreettoorriiaa

understanding of the importance of rekindling older customer relationships and actively fostering the
current relationships from the other business functions’ side. These relationships will then have to be
reinforced by effective and complete service from the CSC.
A clear vision for the growth of the business will assist the CSC to align its goals, objectives and
activities more effectively and will then become more effective when the business function understands
where it fits into the overall picture of the business’s future.
6.3 Future work
Although this project has enabled the CSC to measure and analyse the CS of their customers, some
future work has been identified.
6.3.1 Automated customer feedback tool
An automated solution for the measuring of the CSC’s CS scores and performance could also be
investigated as such a solution could potentially streamline the measuring process and freeing up the
agents’ time to focus on the customers’ needs.
An example of such a solution would be the automatic distribution of emails asking to rate the
service straight after contact with a customer. Or, as in the case of Vox Telecom, an extra interactive
section is added to the email signature of each employee to enable a customer to rate that employee’s
service directly from the email.
6.3.2 Real-time measuring of CS
An argument can be made for the real-time tracking of CS in the CSC because it will enable the
business function to react quicker to undesired CS scores. Such a solution would have to have a much
more detailed approach towards the specific dissatisfaction of the customers on a more immediate
timeline.
A scenario where a real-time tracking solution could be beneficial could be where an email response
is required to rate the service of the CSC and the rating that is received is a negative rating. The
immediate monitoring of such responses along with the immediate corrective actions that could be
taken could potentially turn such a negative rating into a more positive rating.
Such a solution might require significant capital expenditure, which means that an effective Return-
on-Investment exercise will be required to show that it would be financially beneficial to the business.
57
©© UUnniivveerrssiittyy ooff PPrreettoorriiaa

Bibliography
Aydin, N., Celik, E., and Gumus, A. T. (2015). A hierarchical customer satisfaction framework for
evaluating rail transit systems of Istanbul. Transportation Research Part A: Policy and Practice,
77:61–81.
Benjamin, D. (2015). How to measure customer experience. Available from http://www.
interactrdt.com/blog/2015/03/16/customer-experience-measurement/, (Accessed 5 March
2016).
Berry, L. L. (1981). The employee as customer. Journal of retail banking, 3(1):33–40.
Botha, G., Kruger, P., and de Vries, M. (2012). Enhancing customer experience through business
process improvement: An application of the enhanced customer experience framework (ecef). South
African Journal of Industrial Engineering.
Brogle, R. (2014). How to avoid the evils within customer satisfaction surveys.
Available from https://www.isixsigma.com/methodology/voc-customer-focus/
how-to-avoid-the-evils-within-customer-satisfaction-surveys/ (Accessed 7 April
2016).
Dixon, M., Freeman, K., and Toman, N. (2010). Stop trying to delight your customers. Harvard
Business Review, 88(7/8):116–122.
Garengo, P., Biazzo, S., and Bititci, U. S. (2005). Performance measurement systems in smes: a
review for a research agenda. International journal of management reviews, 7(1):25–47.
Gilbert, G. R. (2000). Measuring internal customer satisfaction. Managing Service Quality: An
International Journal, 10(3):178–186.
Hill, N., Self, B., and Roche, G. (2002). Customer satisfaction measurement for ISO 9000: 2000.
Routledge.
Hudson, M., Smart, A., and Bourne, M. (2001). Theory and practice in sme performance measurement
systems. International journal of operations & production management, 21(8):1096–1115.
Investopedia (2005). Sensitivity analysis. Available from http://www.investopedia.com/terms/s/
sensitivityanalysis.asp Accessed (22 August 2016).
Loveman, G. W. (1998). Employee satisfaction, customer loyalty, and financial performance an empiri-
cal examination of the service profit chain in retail banking. Journal of Service Research, 1(1):18–31.
58
©© UUnniivveerrssiittyy ooff PPrreettoorriiaa

Markidan, L. (2014). You screwed up, and you have an angry customer. now what? Avail-
able from https://www.groovehq.com/support/how-to-deal-with-an-angry-customer (Ac-
cessed 19 September 2016).
Martin, R. (2010). The Age of Customer Capitalism. Harvard Business Review, 47(February):58–65.
Miller, R. L. (2012). The importance of internal customer service.
Available from http://www.mycustomer.com/community/blogs/rlmiller/
the-importance-of-internal-customer-service (Accessed 26 April 2016).
Montgomery, D. C. (2013). Statistical quality control: A Modern Introduction, volume 7. Wiley.
Reichheld, F. F. (2003). The One Number You Need to Grow. Harvard Business Review, 81(12):46–
54+124.
Reid, R. D. and Sanders, N. R. (2011). Operations Management an integrated approach. John Wiley
& Sons.
Rust, R. T., Stewart, G. L., Miller, H., and Pielack, D. (1996). The satisfaction and retention
of frontline employees: A customer satisfaction measurement approach. International Journal of
Service Industry Management, 7(5):62–80.
Simon, K. (2002). Why control chart your processes? Available from https://www.isixsigma.com/
members/Kerri-Simon/ (Accessed 22 July 2016).
Singh, H. (2006). The Importance of Customer Satisfaction in Relation to Customer Loyalty and
Retention. Asia Pacific University College of Technology & Innovation Technology Park Malaysia,
May.
StatSoft (2000). Quality control charts. Available from http://www.uta.edu/faculty/sawasthi/
Statistics/stquacon.html (Accessed 22 August 2016).
Stelzer, A., Englert, F., Horold, S., and Mayas, C. (2015). Improving service quality in public trans-
portation systems using automated customer feedback. Transportation Research Part E: Logistics
and Transportation Review.
Stroud, J. D. (2010a). Aligning call center agent goals with customer de-
sires. Available from https://www.isixsigma.com/new-to-six-sigma/dmaic/
aligning-call-center-agent-goals-customer-desires/ (Accessed 29 April 2016).
Stroud, J. D. (2010b). Nine steps to create a great customer survey. Avail-
able from https://www.isixsigma.com/methodology/voc-customer-focus/
nine-steps-create-great-customer-survey-part-one/ (Accessed 7 April 2016).
Stroud, J. D. (2011). Business requirements document: A high-level review. Avail-
able from https://www.isixsigma.com/implementation/project-selection-tracking/
business-requirements-document-high-level-review/ (Accessed 16 April 2016).
59
©© UUnniivveerrssiittyy ooff PPrreettoorriiaa

Suganthi, L. and Jagadeesan, T. (1997). Sensitivity analysis of a modified energy model. International
journal of ambient energy, 18(4):185–196.
University of Portsmouth, . (2013). Surveys: Ethical issues. Available from http://www.port.ac.
uk/research/ethics/downloads/filetodownload,171768,en.doc (Accessed 11 May 2016).
60
©© UUnniivveerrssiittyy ooff PPrreettoorriiaa
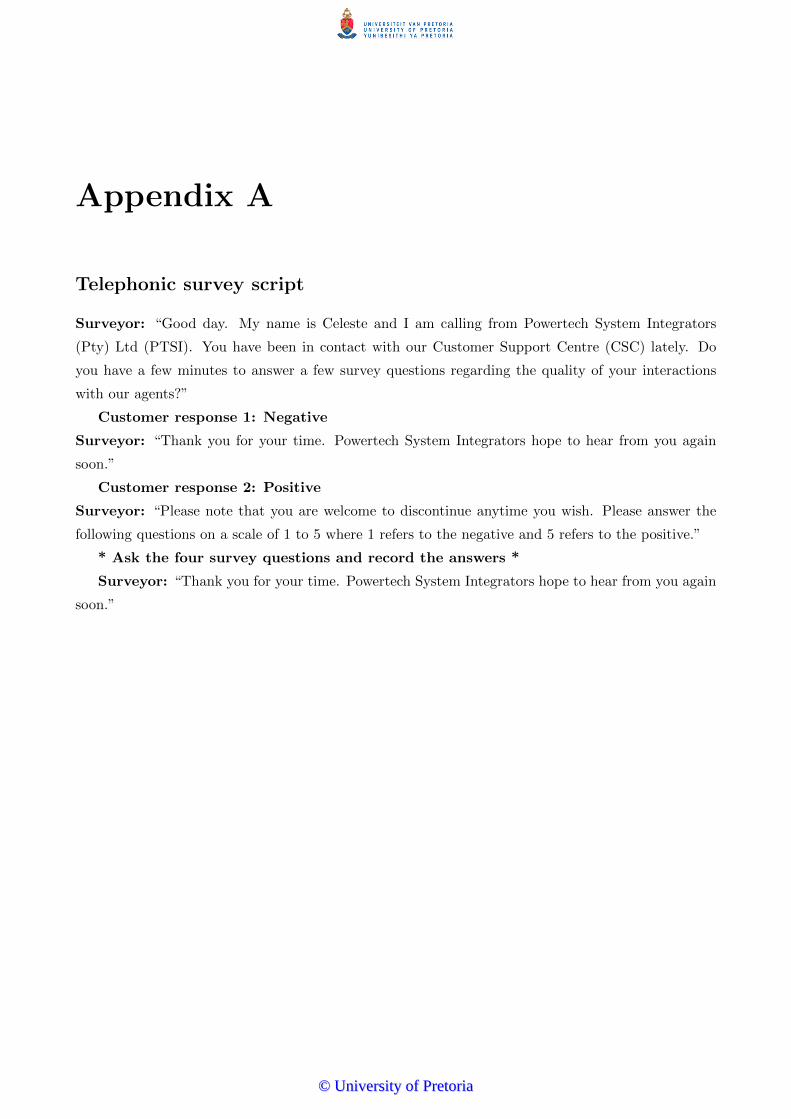
Appendix A
Telephonic survey script
Surveyor: “Good day. My name is Celeste and I am calling from Powertech System Integrators
(Pty) Ltd (PTSI). You have been in contact with our Customer Support Centre (CSC) lately. Do
you have a few minutes to answer a few survey questions regarding the quality of your interactions
with our agents?”
Customer response 1: Negative
Surveyor: “Thank you for your time. Powertech System Integrators hope to hear from you again
soon.”
Customer response 2: Positive
Surveyor: “Please note that you are welcome to discontinue anytime you wish. Please answer the
following questions on a scale of 1 to 5 where 1 refers to the negative and 5 refers to the positive.”
* Ask the four survey questions and record the answers *
Surveyor: “Thank you for your time. Powertech System Integrators hope to hear from you again
soon.”
©© UUnniivveerrssiittyy ooff PPrreettoorriiaa

Detailed internal survey design
©© UUnniivveerrssiittyy ooff PPrreettoorriiaa

Appendix B
Performance Measurement (PM) system home page
63
©© UUnniivveerrssiittyy ooff PPrreettoorriiaa

x Δ Ο
Ow
ner:
Da
te:
31
/07
/20
16
Lo
B G
oa
lB
us
ine
ss
Fu
nc
tio
n G
oa
l(s
)K
PA
/ M
ea
su
reS
tatu
sD
UE
DA
TE
1M
ea
su
re c
usto
me
r sa
tisfa
ctio
n o
f e
xte
rna
l cu
sto
me
rsO
vera
ll Ex
tern
al C
S Sc
ore
11
2M
ea
su
re c
usto
me
r sa
tisfa
ctio
n o
f in
tern
al cu
sto
me
rsO
vera
ll In
tern
al C
S Sc
ore
22
3S
eg
me
nt
cu
sto
me
rs t
o d
ete
rmin
e e
ng
ag
em
en
t str
ate
gie
sEx
tern
al a
nd
Inte
rnal
sat
isfa
ctio
n3
3
4D
ete
rmin
e c
au
se
s o
f d
issa
tisfa
ctio
n o
f cu
sto
me
rsIn
tern
al C
ust
om
er S
atis
fact
ion
Rea
son
s4
4
5Id
en
tify
co
rre
ctive
actio
ns f
or
the
de
term
ine
d c
au
se
s5
5
6Id
en
tify
im
pro
ve
me
nt
op
po
rtu
nitie
s d
ire
ctly lin
ke
d t
o t
he
de
term
ine
d c
au
se
s6
6
7Id
en
tify
ge
ne
ral im
pro
ve
me
nt
op
po
rtu
nitie
s f
or
the
CS
C7
7
8R
esp
on
d t
o c
usto
me
r co
mp
lain
ts (
exte
rna
l a
nd
in
tern
al)
88
9T
rack s
ucce
ss o
f e
ng
ag
em
en
t str
ate
gie
s a
nd
im
pro
ve
me
nts
fo
r
co
ntin
uo
us im
pro
ve
me
nts
99
10
10
10
1M
ea
su
re #
of
ca
se
s r
eco
rde
d p
er
SF
DC
Re
co
rd T
yp
e o
n a
mo
ntly b
asis
# o
f R
eco
rded
Cas
es
per
Rec
ord
Typ
e1
1
2M
ea
su
re #
of
ca
se
s r
eso
lve
d p
er
SF
DC
Re
co
rd T
yp
e
on
a
mo
ntly b
asis
# o
f R
eso
lved
Cas
es p
er R
eco
rd
Typ
e2
2
3M
on
ito
r th
e a
ve
rag
e t
ime
to
re
so
lutio
n o
f ca
se
sA
vera
ge T
TR o
f R
eso
lved
, ecW
in,
EDA
an
d E
IS C
ases
33
4D
ete
rmin
e c
au
se
s f
or
un
reso
lve
d c
ase
s4
4
5Id
en
tify
ap
plic
ab
le c
orr
ective
actio
ns o
f th
e d
ete
rmin
ed
ca
use
s
(if
be
ca
use
of
CS
C)
55
6Id
en
tify
im
pro
ve
me
nt
op
po
rtu
nitie
s f
or
the
fir
st-
tie
r su
pp
ort
pro
vid
ed
by t
he
CS
C6
6
7M
ea
su
re P
AB
X S
erv
ice
le
ve
lsP
AB
X S
ervi
ce L
eve
l7
7
88
89
99
10
10
10
Re
qu
ire
s im
me
dia
te a
tte
ntio
n
Re
qu
ire
s s
pe
cia
l a
tte
ntio
n
Ma
inta
in a
ctivity a
t th
is s
tag
e
Provide customer service of such high
quality that the business as a whole benefits
Bu
sin
es
s F
un
cti
on
Ac
tivit
ies
(N
ex
t P
eri
od
)
Provide high quality first-tier support for specified
solutions provided to PTSI customers by the LoBs
Provide impeccable customer service as a business
M&
BD
A3
(2
01
6/1
7)
- P
eri
od
: Ju
ly 2
01
6
Bu
sin
es
s F
un
cti
on
Ob
jec
tive
s B
us
ine
ss
Fu
nc
tio
n A
cti
vit
ies
(C
urr
en
t P
eri
od
)
CS
C M
an
ag
er
©© UUnniivveerrssiittyy ooff PPrreettoorriiaa

Appendix C
Industry sponsorship forms
65
©© UUnniivveerrssiittyy ooff PPrreettoorriiaa

©© UUnniivveerrssiittyy ooff PPrreettoorriiaa

©© UUnniivveerrssiittyy ooff PPrreettoorriiaa