measurements of solar total irradiance and its variability
TRANSCRIPT

M E A S U R E M E N T S OF SOLAR TOTAL I R R A D I A N C E AND ITS
V A R I A B I L I T Y
R I C H A R D C. W I L L S O N
Jet Propulsion Laboratory, Calif. Inst. of Technology, Pasadena, CA 91103, U.S.A.
(Received 20 March, 1984)
Abstract. The developmen t of electrically self calibrated cavity pyrheliometric instrumentation that occurred in the early 20th century provided the technological base for experiments to detect variability of the solar total irradiance. Experiments from ground based observatories, aircraft and balloons during the 1st half of the 20th century were unable to achieve sufficient accuracy or long term precision to unambiguously detect irradiance variations of solar origin. Refinements in pyrheliometric technology during the 1960's and 1970's and the accessibility of extended experimental opportunities above the Earth's atmosphere in recent years have provided the first direct observations of solar total irradiance variability and provided the cornerstone observations of a long term database on solar irradiance. A program of solar irradiance monitoring has evolved to sustain the database over at least 22 years, corresponding to a single cycle of solar magnetic activity, and the shortest well identified cycle of climate variation. Direct links between total irradiance variations, solar magnetic activity and the solar global '5 rain' oscillation phenomena have been derived from recent space flight observations by the SMM/ACRIM I experiment.
1. Introduction
The nature of the emission of radiation by the Sun is of overriding importance to all life on Earth. The Earth's weather and climate are completely determined by the amount of incident solar radiation and its interactions with the Earth's atmosphere, oceans and land masses. Sustained variations in the. total solar energy received by the Earth from the Sun, the solar total irradiance, could have significant effects on both. Variation of solar total irradiance may have caused some of the many past changes in the Earth's climate.
In spite of its importance, solar irradiance has not been systematically measured in the past. Total irradiance observations with the short term accuracy and long term precision required to unambiguously detect solar variations and provide a quantitative database for climatology and solar physics investigations did not begin until 1980 with the launch of the Solar Maximum Mission (SMM) by the National Aeronautics and Space Administration (NASA).
Because of the long thermal time constants of the Earth's oceans and polar ice caps, many years of such data will be required to understand the climatological significance of solar variability. The principal usefulness of the solar monitoring data- base on shorter timescales is in the field of solar physics. The discovery of solar total irradiance variability by the SMM and its relationship with the evolution of solar active regions has provided new insight into the physics of the outer solar atmosphere.
Space Science Reviews 38 (t984) 203-242. 0038-6308/84/0383-0203506.00. �9 1984 by D. Reidel Publishing Company.
204 RICHARD C. WILLSON
The detection of the total irradiance signature of solar global '5 min' oscillation by SMM will aid solar physicists in understanding the behavior of the Sun's interior.
The format of this review is a series of critical discussions of the salient research topics relevant to measurement of solar irradiance variations: the development of the present state of the art in solar total irradiance measurement technology, the historical evolution of experimental efforts to measure solar variability, a description of the results of the first such observations, a discussion of their potential significance for solar physics and climatology and an assessment of the experimental work required to sustain and improve the solar variability data base in the future.
2. Solar Irradiance Measurement Technology
2.1. PYRHELIOMETRY
The most accurate technology for measuring solar total irradiance is a specialized form of radiometry referred to as pyrheliometry in which the heat produced by the absorption of solar radiation is compared with the heat produced on the same detector by the dissipation of a known amounli of electrical power. At the solar total irradiance level (1368 W m - 2) pyrheliometric detectors are the most accurate means of defining the radiation scale.
Two principal types of pyrheliometric detectors have been used in solar observa- tions. The first is an absolute or electrically self-calibrating detector which can relate radiation measurements to the International System of units (SI) by its stand-alone operation. The second basic type is a relative detector that simply provides a signal in response to solar heating and must be calibrated by comparison to an electrically self-calibrating pyrheliometer to produce a quantitative result in SI units.
2.2. THE ]kNGSTROM AND SMITHSONIAN INSTRUMENTATION AND SCALES
Several radiation 'scales' have been used during the 20th century for referencing solar irradiance measurements to SI units. (A summary of these scales, their relationships and references to these early works is presented in FrOhlich, 1973.) Each has been based on the performance of one or more electrically self calibrated pyrheliometers. The Angstrrm scale, defined in 1905 and based on the performance of Angstr/3m electrically self calibrated pyrheliometers developed in Sweden in the late 19th century, has been widely used to reference meteorological solar irradiance measurements. Electrically self calibrated cavity pyrheliometers developed in the early 20th century at the Smithsonian Institution in the U.S. were the references for the 1913 Smithsonian scale used as the standard for their long term program to detect solar variability.
Solar observations on the two scales differed by about 5~o until a downward revision of the Smithsonian scale in 1932 reduced the difference to 2.5~o. The Inter- national Pyrheliometric Scale of 1956 (IPS 56), was adopted by international agree- ment in that year to provide a common reference for solar irradiance measurements during the International Geophysical 'Year' (1957-1958). Although intended to be a

MEASUREMENTS OF SOLAR TOTAL IRRADIANCE AND ITS VARIABILITY 205
compromise between the Smithsonian 1932 scale and the ,~ngstrOm 1905 scale, it was subsequently found to be much closer to the latter (Fr~Shlich, 1973, 1977). The IPS 56 was employed as the principal international reference for solar observations from 1956 until the mid 1970's.
2.3. M O D E R N P Y R H E L I O M E T R Y A N D R A D I A T I O N S C A L E S
A new generation of electrically self calibrating cavity pyrheliometers was developed in the latter half of the 1960's and early 1970's at several laboratories in the US and Europe. Development of new cavity pyrheliometers began in the US at the Jet Propulsion Laboratory (JPL) of the California Institute of Technology (CIT) in the mid 1960's (Haley, 1964; Plamondon and Kendall, 1965; Kendall, 1968, 1969; Willson, 1967, 1969, 1971a; Sydnor, 1970; and Kendall and Berdall, 1970). New pyrheliometers were under development by the late 1960's at the Physical Meteorological Observatory at Davos (PMOD), Switzerland (Brusa and Fr~Shlich, 1972), at the U.S. National Bureau of Standards (USNBS) (Geist, 1972), and at the Royal Institute of Meteorology in Brussels (IRMB), Belgium (Crommelynck, 1973).
A series of radiation scale experiments were conducted during 1968-1970 at the Table Mountain Observatory (TMO) (California, U.S.A.) using the new JPL cavity pyrheliometers. These instruments, capable of defining the radiation scale with less than + 0.5~o uncertainty found a systematic - 2.2~o error in the International Pyrheliometric Scale of 1956 (IPS 56) (Willson 1969, 1971a, 1971b, 1972a, 1972b). The TMO result was subsequently confirmed during the third and fourth International Pyrheliometric Comparison experiments (IPC's III and IV), conducted under the auspices of the World Meteorological Organization (WMO) at the Swiss PMOD (FrOhlich et al., 1973b; Brusa and FrOhlich, 1975).
An international solar irradiance reference scale, the World Radiometric Reference (WRR) was defined by the average performance of five of the new pyrheliometers (as shown in Table I) during the 1 st International Comparison of Absolute Pyrheliometers conducted as part of IPC IV. The WRR was again reproduced during the IPC V at the PMOD in 1980 by a subset of the original five instruments (FrOhlich, 1981a). This scale, 2.2~o higher than the IPS 56 and within 0.5~o of the 1932 Smithsonian Scale, is believed to represent SI units with less than 0.3Yo uncertainty.
By the late 1970's continued improvements in the cavity pyrheliometers developed by the JPL, PMOD, and IRMB groups had produced instruments theoretically capable of defining the radiation scale at the solar total irradiance level with an uncertainty approaching +0.1~o (Brusa, 1983; Willson, 1973a, 1973b, 1975, 1979, 1980a; Crommelynck, 1981a, 1981b). A principal thrust of present research is the experi- mental demonstration of the level of SI uncertainty achieved by the advanced pyrhelio- meters developed by these groups. An approach developed at the USNBS (Geist, 1972) and adapted in various forms at the PMOD and IRMB use stabilized lasers in laboratory experiments to characterize (quantify in SI units) sources of uncertainty in cavity pyrheliometers (Brusa, 1983; Crommelynck, 198 lb). Another characterization approach using the Sun as the irradiant source has been implemented at JPL's TMO

206 RICHARD C. WILLSON
TABLE I
Results of the First International Comparison of Absolute Cavity Radiometers at the Physical Meteorological Observatory, Davos (1975). The relative performance for the five cavity pyrheliometers whose average weighted results are used to define the World Radiometric Reference Scale (WRR) are shown. The WRR has replaced the IPS56 as the solar irradiance scale of reference sanctioned by the World Meteorological Organization. Solar total irradiance measurements on the WRR are 2.2% higher than on the IPS56. The SI uncertainty of the
WRR is + 0.3 %.
Instrument Developer Performance relative to WRR (%)
ACR 310 Willson + 0.04 PMO 2 Frohlich + 0.10 ACR 311 Willson + 0.11 PACRAD III Kendall - 0.19 CROM Crommelynk - 0.20
The affiliations of the developers of the instruments are: Kendall and Willson - Jet Propulsion laboratory, California Institute of Technology, U.S.A.; FrOhlich - World Radiation Center, Physical Meteorological Observatory, Davos, Switzerland; Crommelynck - Royal Meteoro- logical Institute of Belgium.
(Willson, 1981a). A combination of these experimental techniques, applied to the leading sensor technology, should lead to the definition of an international reference scale at the total solar irradiance level with _+ 0.1% uncertainty by the late 1980's.
A radiation scale experiment based on a promising new technology, a cryogenic pyrheliometer operating at liquid helium temperatures, has been under development at the National Physical Laboratories of the U.K. (Quinn and Martin, 1982). This approach is capable of defining the radiation scale with 0.01% uncertainty, nearly an order of magnitude smaller than current conventional (uncooled) pyrheliometers.
The cryogenic technology represents a major advance in the ability to define the radiation scale in a laboratory environment, but it is not clear what level of uncertainty it can achieve in solar irradiance measurements. This type of instrument must reside in a vacuum with the radiant source to be measured to achieve full accuracy. The obvious application for cryogenic pyrheliometers would be in space flight experiments.
3. The Evolution of Solar Irradiance Experiments
3.1. THE SMITHSONIAN SOLAR IRRADIANCE MONITORING PROGRAM
The task of routinely monitoring the total solar irradiance at the mean Earth-Sun distance (1 Astronomical Unit or 1 AU) was begun in the US by the Smithsonian Institution at the turn of the century (Abbot et al., 1908). They conducted a systematic,

MEASUREMENTS OF SOLAR TOTAL IRRADIANCE AND ITS VARIABILITY 207
long term program (1902-1962) to detect solar variability using measurements made from mountain top observatories. The record of 1 AU total irradiance derived from their observations was limited to a long term precision near 1 ~o by fluctuations in atmospheric transmittance, and provided no clear evidence of solar variability. (A comprehensive revue of the Smithsonian observations has been written by Hoyt (1979).)
Recognizing the possible uncertainties imposed by atmospheric transmittance varia- tions, the Smithsonian also conducted the first flight experiments to measure the total irradiance. Following a trial flight in 1913, observations by an automated version of the silver disk instrument on a balloon at 25 km altitude in 1914 was used to derive a 1 AU solar total irradiance result of 1326 W m -2, about 1.5~o lower than their average ground based result (1346 W m -2) (Abbot etal., 1922).
3 . 2 . F L I G H T E X P E R I M E N T S U S I N G N O N - S E L F - C A L I B R A T I N G D E T E C T O R S
The next flight experiments to measure solar total irradiance were not attempted until nearly a half century after the Smithsonian balloon flights. Experiments on high altitude balloons in the U.S.S.R. from 1962-1968 (Kondratyev and Nikolsky, 1970) and on aircraft in the US during 1967-1968 (Drummond and Hickey, 1967) did not achieve significantly higher accuracy or precision than the Smithsonian ground based measurements despite the decreased uncertainties of atmospheric transmittance in their results. Principal sources of uncertainty for both these investigations were the ground-based, preflight calibrations required to relate the observations of their non- self-calibrating flight instruments to SI units. The results of Drummond and Hickey included an additional large source of uncertainty due to the errors in determining transmittances for the aircraft windows in their B57 and CV990 flights and the trans- mittance of the instrument window for the X15 flight (FrOhlich, 1981b).
Kondratyev and Nikolsky initially reported a total irradiance variation over 6 years in excess of 2~o and attributed it to variations in solar activity. They later concluded the variation resulted from changes in atmospheric extinction brought about by secular changes in the concentrations of stratospheric aerosols and gases (Nikolsky, 1978).
High altitude balloon experiments conducted in the US by the University of Denver were reported to show a 0.4~o increase in the 1 AU total solar irradiance between their first set of experiments inn 1967-1968 and two later ones in 1978 and 1980 (Murcray etal., 1969; Kosters and Murcray, 1981). The claim that the increase is resolvable by the series of experiments has been questioned by FrOhlich (1981b).
The University of Denver flight instruments were not self calibrating so the traceability of their results over more than a decade relies on ground based, preflight calibrations using instrumentation and techniques with undemonstrated reproducibility at the 0.4~o level. The uncertainties accruing from such preflight calibrations, together with the uncertainties in necessary corrections to flight data for atmospheric extinction and the transmittance of instrument windows have been estimated in excess of 1 ~o for the 1967-1968 results of these experiments (Kondratyev et al., 1970). The University of Denver flight instruments have not been directly compared with other solar irradiance

208 RICHARD C. WILLSON
flight instrumentation over the 1968-1980 period, so no independent evidence exists to evaluate the significance of the 0.4~o increase in their results.
3.3. EARLY F L I G H T E X P E R I M E N T S U S I N G S E L F - C A L I B R A T E D D E T E C T O R S
The first flight experiments utilizing self calibrated, cavity pyrheliometers were conducted in 1967-1968 on the NASA CV990 research aircraft at altitudes of near 12 km (Thekaekara etaL, 1969; Kendall, 1973). Although the flight instruments, a cone radiometer developed by McNutt at NASA/GSFC and the PACRAD developed at JPL, were inherently capable of high accuracy, uncertainties in the transmittance of the overlying atmosphere and the aircraft and instrument windows resulted in overall uncertainties for these experiments in excess of 1 ~ .
A JPL high altitude balloon flight experiment was conducted using two active cavity radiometer type II (ACR II) electrically self calibrating, cavity pyrheliometers in 1968 (Willson, 1971a). The ACR II instruments were capable of defining the radiation scale with 0.5~ SI uncertainty under vacuum conditions but suffered degradation of the quartz windows, through which they viewed the Sun during the flight, which produced an overall SI uncertainty in the solar total irradiance results of more than lYo.
The first measurements by cavity pyrheliometers outside the Earth's atmosphere, and the first extended solar irradiance flight observations, were made by the JPL thermal control flux monitor (TCFM) experiment on NASA's Mariner 6 and 7 Missions in 1969 (Plamondon, 1969). During the 150 days required for the Mariner spacecraft to travel from Earth to Mars, the TCFM experiments conducted the first true solar monitoring.
The TCFM's were capable of operation in the electrical, self-calibrating mode, but the initial results were reduced using a preflight vacuum hohlraum calibration. The observations were flawed by a systematic drift in both sensors, caused by thermal relaxation of the winding stresses in their cavity heating coils. Following the encounter of both spacecraft with Mars, the spacecraft were turned to point the TCFM's toward a view of space without the Sun, providing the one true self-calibration of the mission. The uncertainties of the preflight calibrations and drift were decreased by the self calibration to an estimated measurement uncertainty of between 1 and 2~o.
None of the solar irradiance measurement experiments described thus far achieved a level of accuracy or long term precision required to detect presently known levels of solar variability. The uncertainties quoted for these experiments are those published or privately communicated by the original experiment team in most cases. In others, the original descriptions of the experiments have been combined with re-evaluations of the various sources of measurement error peculiar to each type of instrument and experiment, based on the results of more recent work. A summary of the results of the above experiments is presented in Table II.

MEASUREMENTS OF SOLAR TOTAL IRRADIANCE AND ITS VARIABILITY 209
TABLE II
Summary of initial experiments to determine the 1 AU total solar irradiance. None of the experiments listed have less than 1% SI uncertainty, long term precision or traceability to current experiments. None detected solar variability. The results shown (except for the Smithsonian) have been corrected to the
World Radiometric Reference by Fr6hlich (1977).
Yea r ( s ) Experimentor Instrument Type a Platform Result (W m- 2)
1902-62 Smithsonian Water Flow ESCC Ground 1346 1962-68 Kondratyev Yanishevsky RFPT Balloon 1376 1967-68 Murcray Eppley NIP RFPT Balloon 1373 1967 Drummond Eppley WWT RFPT Aircraft 1387 1967 McNutt Cone ES CC Aircraft 1375 1968 Kendall PACRAD ESCC Aircraft 1373 1968 Willson ACRII ESCC Balloon 1370 1969 Plamondon TCFM ESCC-P Spacecraft 1362
a Instrument types (in order of decreasing accuracy): ESCC - electrically self calibrating cavity; ESCC-P - partially implemented ESCC; RFPT - relative flat plate thermopile (require calibration by comparison to other standard or detector).
4. At the Threshold of Solar Variability Detection
4.1. A C R II I BALLOON FLIGHT
A J P L balloon flight experiment, conducted in 1969 using an A C R I I I detector (Willson,
1973a, 1973b), made solar irradiance observations in the electrically self calibrated
mode over a six hour period at an altitude of 36 km. The A C R III , which does not
require a vacuum for operation, viewed the Sun without windows in the optical path,
thereby eliminating the large source of uncertainty inherent in the 1968 A C R II
balloon experiment. After correcting for the remaining 1% atmospheric attenuation,
an average 1 A U solar total irradiance result of 1366 W m -2 was derived with a net
SI uncertainty of 0.5%, Through pre- and post-flight intercomparisons carried out
between the A C R I I I flight instrument and other JPL, W R R and international standard
pyrheliometers, the relationship between the 1969 result and subsequent flight experi-
ments is known with +0.2% uncertainty (Willson, 1971b, 1972a, 1981b; Fr~3hlich,
1977, 1981a, 1982).
4.2. THE N I M B U S 6 AND 7/ERB SATELLITE EXPERIMENTS
Earth Radiation Budget (ERB) experiments were launched on the Nimbus 6 and 7 satellites in mid 1975 and late 1978 to measure the radiative balance between incident
solar and upwelling solar and infrared fluxes from the earth. Solar incident flux
measurements are necessary for the ERB experiments but their required accuracy,
precision and sampling frequency are much lower than we now know to be required
for solar variability monitoring. The ERB solar sensors and their mode of operation

210 RICHARD C. WlLLSON
on the Nimbus satellites were designed accordingly to provide the + 1 ~o SI uncertainty, + 0.1 ~o measurement single sample resolution and sampling frequency (a few minutes per orbit on selected days) required by the ERB experiment (Hickey et al., 1974, 1976, 1977; Jacobowitz et aL, 1979; Smith et al., 1977).
Even though solar monitoring was not a science objective of the ERB experiments it was inevitable that their solar irradiance observations would be scrutinized for evidence of solar variability, given the long standing interest in the subject and the absence of other data at the time. Both the Nimbus 6 and 7 ERB solar observations have contributed to solar monitoring in some ways. However, the limitations of the ERB solar flux databases, imposed both by the design of the solar sensors and their operational environment on the Nimbus satellites, have not been succinctly presented in the scientific literature and are not well understood by many who have used the ERB results.
4.2.1. The Nimbus 6/ERB Solar Irradiance Experiment
The average value of the 1 AU total solar irradiance results for the Nimbus 6/ERB was initially reported to be 1393.5 W m -2, 2.0~o higher than the 1969 ACR balloon value (Hickey, 1978). The difference stimulated considerable interest, since it was larger than the mutual SI uncertainty bounds predicted for the ERB solar sensor (+ 1.0~) and the ACR balloon experiment (+ 0.5~o). If the result was valid, a large solar irradiance change had been detected over the intervening 6 years between the maximum and minimum periods of solar activity cycle 20.
Investigations of the difference focussed on the potential sources of uncertainty in the ERB solar measurements. The results of the 1969 ACR balloon experiment were considered to be less suspect by virtue of the greater inherent accuracy of the ACR sensors and their experimentally established relationships with other international reference instruments (FrOhlich, 1977).
The ERB solar sensor was a simple detector, comprised of a blackenned fiat plate attached to a thermopile. It was not capable of electrical self-calibration and relied on prelaunch calibrations to relate its observations to SI units. This approach has been a source of error comparable to the 1.6~o ERB/ACR difference for previous experiments and had to be considered a potential cause of the high ERB results.
The solar observation opportunity afforded the sensors on the Nimbus/ERB experi- ments was far from optimum, a result of the primacy of the nadir-looking Earth radiation observations, the Sun-synchronous polar orbit and the lack of a separate solar pointing system. The Sun was normally observed only during orbit sunrise when the spacecraft was over the Earth's south polar region. Measurements were limited to a few minutes per orbit, with the Sun moving through the instrument's relatively wide (26 degrees) field of view at a rate of about 4 deg min- 1. This convolved several significant sources uncertainty with the measurement's solar signal which, if not precisely corrected for, could provide both systematic and random sources of error.
There was a stringent requirement for precise correction of data for non-normal
MEASUREMENTS OF SOLAR TOTAL IRRADIANCE AND ITS VARIABILITY 211
solar incidence on the ERB detector. This relies on a preflight calibration of the detector's off-axis sensitivity as well as correction for the time dependent angle between the sensor's normal and the solar direction during observations. ERB's results were derived from the maximum irradiance observed each orbit, on the assumption that it represented the sensor's most nearly normal view of the Sun (Hickey et al.,
1976). Corrections were then made for the calculated ERB-solar offset angle, which varied over the year, and was periodically adjusted by re-orientating the ERB sensors relative to Nimbus 6 by + 1 degree increments.
The net uncertainty with which ERB's effective solar orientation could be determined for a given observational sequence can be estimated from a description of the analysis of the 1976-1977 data (Hickey and Griffin, 1979). After correcting for off-solar pointing, residual step functions in irradiance as large as 0.2?/0 appear in the results, coincident with changes of the ERB viewing angle (gamma angle) relative to Nimbus 6. This corresponds to an uncertainty of almost 4 degrees in solar pointing.
The wide field of view provided other potential sources of error by giving the sensor large and variable radiative transfer relationships with space and the Earth, and by allowing the sensor to receive scattered light from the Earth's limb during part of each orbit. The radiative transfer to space from the ERB solar sensor equals about 1.5~ of the solar signal. It had to be corrected for by a model based on measured instrument temperature or by near real time viewing of space without the Sun. It is unlikely that this source of error could be corrected with less than + 10~o uncertainty, leaving a residual + 0.157/o net contribution to overall measurement uncertainty.
Scattered sunlight from the Earth's limb in the south polar region could be included in solar measurements because of the wide field of view, the polar orbit and the sunrise observational opportunity. Such additional sources of flux would be inextricably convolved with the solar measurement and would bias the data set in the direction of higher results. Avoidance of this source of systematic error would require measurement selection to avoid samples of data early in the orbit sunrise period. Assessment of this problem cannot be found in the literature and its contribution to high ERB results cannot, therefore, be precluded.
Thermal transients for satellite instruments are large at orbit sunrise, creating sources of systematic instrumental error for the ERB's sensitive thermal detectors. Correction for the effects of such transients relies on precise preflight determination of the sensor's sensitivity to them as well as the precise measurement of the sensor's temperature variation during solar observations.
The published results available for the ERB solar observations are analyses of combinations of several different quality data sets, ranging from 'quick look' to final archived data. Correction of the results for the above sources of error have not been systematically applied to the entire data set (Hickey et al., 1977).
The considerable difficulty of analytically correcting ERB results for all the various sources of error indicated that an experimental approach might be the most definitive means of calibrating its flight results. A rocket solar irradiance experiment that provided real time, in-flight comparisons between the Nimbus 6/ERB and several other solar

212 RICHARD C. WILLSON
radiometers (described below), was conducted in 1976 for this purpose. The conclusions drawn from the rocket experiment results were that the ERB observations were higher than SI units by 1.5 (+ 0.3)~o (Duncan et al., 1977).
Corrected to SI units, Nimbus 6/ERB results were within the bounds of uncertainty of the ACR balloon result, eliminating the possibility of a detectable change in solar output between 1969 and t975 (Willson and Hickey, 1977). There are no published results indicating detection of solar variability on any timescale in the Nimbus 6 ERB observations that could be clearly separated from measurement noise and uncertainty.
4.2.2. The Nimbus 7/ERB Solar Irradiance Experiment
The follow-on ERB experiment on NIMBUS 7, launched in late 1978, included a Hickey-Freidan (HF) solar sensor with a cavity detector that is capable of electrical self-calibration. The HF's SI uncertainty and measurement precision are inherently superior to the thermopile on Nimbus 6 ERB due to its occasional use in the electrically self-calibrated mode, the decreased degradation sensitivity for its cavity detector and the smaller radiative transfer between the cavity and its smaller field of view. The full potential of the HF's measurement capability cannot be realized on the ERB experiment, however, since most of the operational constraints imposed on solar observations by the NIMBU S 6 ERB experiment are sources of error for the HF sensor on the Nimbus 7 ERB as well.
The record of HF measurements presently available is comprised of 'quick look' engineering results for 41/2 years of operation (shown in Figure 3), and fully reduced results for the first 22 months of the mission (Hickey, 1983). The average Nimbus 7 ERB HF result, initially reported as 1376 W m -2 (Hickey et al., 1980, 1981a), was found to be 0.6~o (+ 0.2}'0) higher than SI units by solar irradiance experiments on NASA sounding rockets in 1978 and 1980 (described below) (Willson, 1980c). Two balloon flight solar irradiance experiments by the Swiss PMOD (described below) in 1979 and 1980 found the Nimbus 7 ERB results to be an average of 0.75 ~o (+ 0.3~o) higher than SI units (Fr0hlich, 1982). These four independent flight experiments agree on the ERB SI error to well within their mutual uncertainties. The Nimbus 7 HF results were later revised downward by 0.2~o but are not currently reported on the basis of the rocket and balloon calibration results (Hickey, 1981b, 1983).
Variations of up to several tenths of one percent in the NIMBUS 7 ERB results on solar active region timescales were not originally recognized as being solar in origin due to the comparably large instability (+0.16~o) of the HF measurements (Hickey et al., 1980). Following the discovery of the relationship between solar total irradiance variability and solar active region evolution using the SMM/ACRIM I results (Willson, 1980b, 1980c; Willson etal., 1981c; Hudson and Willson, 1981; Eddy etal., 1982a; Oster etal., 1982, Sofia etal., 1982) a re-examination of the Nimbus 7 HF results found correlative evidence of some the larger examples of the 'sunspot deficit' phenomenon (Foukal et al., 1982).

MEASUREMENTS OF SOLAR TOTAL IRRADIANCE AND ITS VARIABILITY 213
TABLE III
Summary of the results from the 1st NASA total solar irradiance rocket flight (June 29, 1976) and the preflight comparison experiments at Mt. Baldy, New Mexico (May 29, 1976). The PMO2 instrument was included in the ground comparison experiment for an independent reference to the World Radiometrie
Reference Scale. Results shown as ratios to ACR 402A.
A. Preflight comparison results
Investigator Instrument/type a Ratio to ACR 402A
Rocket experiments: Willson ACR 402A/ESCC 1.0000 Willson ACR 402B/ESCC 1.0003 Kendall PACRAD/ESCC 0.9956 Hickey ESP/ESCC 1.0006 Hickey ERB CH 3/RFPT 1.0000
World radiometric reference experiment: Brusa PMO2/ESCC 0.9961
B. Rocket flight results
Investigator Instrument/type s Results Ratio to ~o change ACR 402A from
preflight
Rocket experiment: Willson ACR 402A/ESCC 1368.1 1.0000 - Willson ACR 402B/ESCC 1367.6 0.9996 - 0.07 Kendall PACRAD/ESCC-P 1364 0.9970 + 0.14 Hickey ESP/ESCC-P 1369 1.0007 - 0.01 Hickey ERB CH 3/RFPT 1389 1.0153 + 1.53
Nimbus 6 ERB experiment." Hickey ERB CH 3/RFPT 1393.5 1.0186
Instrument type: ESCC - electrically self calibrating cavity; ESCC-P - partially implemented ESCC; RFPT - relative, flat plate thermopile (not capable of self calibration). The ESP and PACRAD rocket instruments were operated in the ESCC mode during the preflight comparison experiment but not during the rocket flight. The ACR 402 operates in the ESCC mode at all times.
4.3. THE NASA SOUNDING ROCKET SOLAR IRRADIANCE EXPERIMENTS
A series of solar total irradiance experiments on sounding rockets was begun in 1976 to provide an independent calibration capability for satellite solar irradiance measurements. Four rocket experiments (1976, 1978, 1980, and 1983) have now been conducted in comparison with the NIMBUS 6 and 7 ERB's, the 1st Active Cavity Radiometer Irradiance Monitor experiment on the Solar Maximum Mission and the ACR and CROM solar irradiance experiments on the Spacelab 1 Mission.
Ground-based comparisons of the flight instruments and other solar irradiance reference instruments, using the Sun as the source, were conducted before and after each rocket flight experiment. Their purposes were: to establish relationships

214 RICHARD C. WILLSON
between the flight and reference instruments; to relate the flight observations to inter- national standards; and to determine the pressure dependence of the flight instruments' sensitivities.
Pre- and post-flight comparisons of flight and reference instruments are an important component of deriving the maximum science from solar total irradiance experiments. It provides a means of determining if the flight instruments suffered any degradation during the experiment that would alter their results and the rationale for either correcting or rejecting the results from degraded instruments.
Since the electrically self calibrating, cavity pyrheliometric instruments are themselves the most accurate means of defining the radiation scale at the solar total irradiance level, their intercomparison provides a means of evaluating the state of the art. In comparison experiments the simultaneous solar observations of several different types of pyrheliometer are tested for agreement against their theoretically projected bounds of mutual uncertainty. Agreement within these bounds adds confidence to the theoretical definition of the state of the art. Disagreement provides experimental feedback to improve both theory and instrumentation. There are no standard sources of radiation that can provide an independent calibration at the solar total irradiance level with comparable SI uncertainty.
One of the most important purposes of preflight comparison experiments for long term solar variability monitoring is the establishment of relationships between the solar observations of flight and reference instruments at their mutual levels of precision. Through such relationships the measurements of many flight experiments at different times and places can be tied together to compile a record of solar irradiance variation that is more accurate than the SI uncertainties of the individual experiments.
The lack of coherency in past (and present) solar monitoring programs has produced gaps in the flight experiment record. Preservation of the relative performances of non-overlapping flight experiments through preflight comparisons with a common set of reference instruments offers a means of bridging such gaps with minimum uncertainty in long term solar irradiance variability.
The precision comparisons can only be performed at atmospheric pressure, since no window material can be interposed between the instruments and the sun that wouldn't significantly degrade the measurements. All pyrheliometers have a pressure dependent sensitivity that must be taken into account when relating flight and ground-based solar observations. Relating ground-based precision air comparisons to flight measurements therefore requires the precise determination of this pressure dependence. The significance of the pressure dependence for solar irradiance measurements was not fully understood until the 2nd rocket flight experiment in 1978 (described below).
4.3.1. The 1976 Sounding Rocket Solar Irradiance Experiment
The science payload of the first rocket flight in June, 1976 included three types of electrically self-calibrated, cavity pyrheliometers (a PACRAD, Kendall and Berdahl, 1970; an ESP, Duncan etal., 1977; and two ACR IV's, Willson, 1979, and a sensor

MEASUREMENTS OF SOLAR TOTAL IRRADIANCE AND ITS VARIABILITY 215
equivalent to NIMBUS 6 ERB's total flux 'flat-plate' thermopile sensor, Hickey et al., 1980). An Aerobee 170 sounding rocket, launched from the White Sands Missile Range (WSMR) in New Mexico, provided 300 s of solar pointed observation time for the payload above 100 km on June 29, 1976. The instruments were flown in a vacuum canister, evacuated prior to launch, to guarantee operation at pressures below 0.01 Torr during the solar pointed period of the flight.
The preflight comparison test was carried out at Mt. Baldy, New Mexico, in May, 1976. The results of this test and the flight experiment are summarized in Table III. A comprehensive set of pre-flight results were obtained for each flight instrument and the relative results for the rocket experiment were therefore well determined experi- mentally.
The flight results for the ACR and ESP cavity pyrheliometers showed close agreement. The relativity of results for all four rocket pyrheliometers was nearly the same in flight and pre-flight measurements. The rocket version of the Nimbus 6 ERB thermopile agreed with the pyrheliometers in pre-flight tests and with the Nimbus 6 ERB in flight.
The flight results for the rocket and Nimbus 6 ERB channel 3 sensors were 1.6~o and 1.9~/o higher, respectively, than the 1367 W m -2 average value of the rocket cavity instruments for the 1 AU solar total irradiance. The SI uncertainty of the average rocket cavity result was about + 0.3 ~o, clearly indicating a systematic source of error for the Nimbus 6 ERB solar sensor (Duncan etal., 1977; Willson and Hickey, 1977; Duncan, 1981).
4.3.2. The 1978 Sounding Rocket Solar Irradiance Experiment
A second rocket solar irradiance experiment in 1978 was conducted to calibrate the Nimbus 7 ERB (HF) solar irradiance experiment and provide a second comparison with the Nimbus 6 ERB. The complement of rocket instruments included those flown in 1976 with the addition to the ERB of an HF cavity pyrheliometer equivalent to one in the Nimbus 7 ERB instrumentation. The 2nd flight, launched from WSMR by an Aerobee 170 sounding rocket on November 16, 1978, provided 300 s of solar observations for the science payload above 100 kin.
Preflight comparisons were held at the JPL Table Mtn. Observatory Solar Test Facility (TMO/STF) in September 1978. Comparisons were obtained for the ACR 402 and PACRAD rocket instruments sufficient to characterize them. Problems with the ERB rocket experiment instrumentation prevented acquisition of definitive results for the ESP, HF and CH 3 sensors. The principal result from this comparison was an unexplained increase in the PACRAD calibration, relative to 1976, of about 0.4%.
A post-flight comparison of the ACR and PACRAD rocket experiments was con- ducted at the JPL TMO/STF in December 1978 as part of the preflight testing of the SMM/ACRIM I solar total irradiance satellite experiment. A summary of these com- parison results are shown in Table IV. The ACR 402 and PMO2 results were within 0.15~o of their relative performances in the 1976 preflight comparisons. PACRAD

216 RICHARD C. WILLSON
TABLE IV
Summary of the results from the 2nd NASA total solar irradiance rocket flight (November 16, 1978) and the postflight comparison experiment held at the JPL Table Mtn. Observatory (December, 1978) as part
of the preflight testing of the SMM/ACRIM experiment. Results shown as ratios to ACR 402A.
A. Preflight comparison results
Investigator Instrument/type a Ratio to ~o change ACR 402A from 1976
Rocket experiments: Willson ACR 402A/ESCC 1.0000 - Willson ACR 402B/ESCC 0.9996 - 0.07 Kendall PACRAD/ESCC 0.9999 + 0.43 Hickey ERB No results -
World radiometric reference experiment: Frohlich PMO2/ESCC 0.9947 + 0.14 Crommelynck CROM2L/ESCC 0.9929 - Willson ACR 401/ESCC 1.0018 - Willson ACR 403/ESCC 1.0020 - Willson ACR 404/ESCC 1.0022 -
SMM/A CRIM experiment: Willson ACRIM A/ESCC 1.0044 Willson ACRIM B/ESCC 1.0007 Willson ACRIM C/ESCC 1.0034
B. Rocket flight results
Investigator Instrument/type a Results Ratio to ~o change (W m -2) ACR 402A from 1976
Rocket experi- ments:
Willson (1) ACR 402A/ESCC 1367.6 1.0000 + 0.04 Willson ACR 402B/ESCC No flight results - Kendall PACRAD/ESCC-P 1373 1.0039 + 0.40 Hickey (2) ESP/ESCC-P 1378 1.0076 + 0.69 Hickey HF/ESCC-P No flight results - Hickey ERB CH 3/RFPT 1383 1.0113 - 0.39
Nimbus 6 ERB experiment: Hickey ERB CH 3/RFPT 1387 1.0142 - 0.43
Nimbus 7 ERB experiment: Hickey ERB CH 3/RFPT 1383 1.0113 Hickey ERB HF/ESCC-P 1376 1.0061
a Instrument type - see Table III. Note (I): ACR402A result corrected by experimentally determined vacuum/air performance ratio of 0.9958. Note (2): ESP result based on post flight recalibration adjustment of + 2~ for primary aperture obscuration and +0.3~o for electrical calibration change from 1976.

MEASUREMENTS OF SOLAR TOTAL IRRADIANCE AND ITS VARIABILITY 217
results were 0.43~o higher than in 1976, agreeing closely with those of the ACR 402 in 1978. The ERB experiment team was not available to participate in the December test.
The 1978 rocket experiment had a number of shortcomings and failures that sub- stantially decreased its scientific value relative to the highly successful 1976 experiment. The absence of preflight comparison results for the ERB instruments made it impossible to evaluate their flight results in relation to the other instruments or to the 1976 rocket flight. The ACR 402B and HF rocket instruments saturated during the flight and returned no useful data. The ESP rocket instrument required extensive post flight testing to derive a 2.3~o correction factor used to report final results (Hickey, 1979; Duncan, 1981). The increase in PACRAD calibration since 1976 accounted for more than half the 0.7To increase reported for its solar irradiance results in 1978. The absence of an explanation of the PACRAD calibration shift left its results in both the 1976 and 1978 flights in doubt.
4.3.3. The Discovery of Pressure Dependent Effects
An additional source of systematic error arose in the 1978 flight whose significance was not fully understood at the time. The rocket instrument canister's vacuum integrity failed during launch and the payload failed to reach pressures in the vacuum operating regime for the instruments (below 0.01 Torr) during the brief flight.
Pyrheliometric detectors have two basic operating pressure regimes: above 10 Torr and below 0.01 Torr. In the 10 Torr and above range convective energy transfer occurs within pyrheliometers that can significantly affect the equivalence between the instru- ment's response to radiant and electrical power. The convective effect is impossible to model accurately and can contribute significant SI uncertainty to the definition of the radiation scale by pyrheliometers. The magnitude and direction of the effect varies with instrument design. Accurate modeling of pyrheliometer operation and prediction of its ability to define the radiation scale can only be achieved for pressures below 0.01 Torr. At this pressure and below no significant convection effects have been observed.
Comparison of the results of solar measurements in the two pressure regimes requires an experimental determination of the magnitude and direction of the air/vacuum ratio of performance for each pyrheliometer. The relationship between the 1978 rocket results, obtained at pressures above 10 Tort, and the 1976 results, obtained below 0.01 Torr, can only be accurately established using the results of an air/vacuum calibration.
An air/vacuum calibration was conducted for the ACR 402 at the JPL TMO/STF in 1980. The air/vacuum ratios of 1.0042 and 1.0037 were found for the A and B sensors, respectively, which means they overestimate the irradiance by 0.42 and 0.37~ in SI units when measuring in air.
The 1978 rocket results for ACR 402A must therefore be decreased by 0.42~o to yield a value comparable to that derived from the same sensor in the 1976 rocket experiment. The 0.4~o higher results initially reported for the 1978 ACR 402A sensor (Willson etal., 1980c) were therefore an artifact of the elevated pressure, to within
218 RICHARD C. WILLSON
the uncertainty of determining the air/vacuum ratio (about +0.05~0) (Willson, 1981a).
The 1 AU solar total irradiance results for the three rocket cavity sensors that obtained data during the 1978 rocket flight (ACR 402A, PACRAD, and ESP) were initially reported without adjustment for the effects of elevated pressure (Willson et aI., 1980d; Duncan, 1981). All three produced higher results than in 1976.
The results for the ACR 402A experiment shown in Table IV, incorporate the air/vacuum correction determined by measurement for the ACR 402A. The results for the PACRAD and ESP sensors have not been corrected for the elevated pressure and are listed as reported by Kendall and Hickey (Duncan, 1981). In this form, the true relativity of their results to the 1976 flight cannot be ascertained.
4.3.4. The 1980 Sounding Rocket Solar Irradiance Experiment
A third rocket solar irradiance experiment was conducted in May, 1980 to provide additional calibrations of the Nimbus6 and 7ERBs and the first of the SMM/ACRIM I experiment (launched in February, 1980). Since the launch integrity of the vacuum canister could not be guaranteed no preflight evacuation was performed to ensure operation in flight in the same pressure regime as in 1978 (above 10 Torr). The payload was flown from the WSMR (May 22,, 1980) on an Astrobee rocket, providing 300 s of solar observations above 100 kin.
Preflight comparisons were conducted at the JPL TMO/STF in April, 1980 (sum- marized in Table V). The preflight ratio of the ACR 402 and PACRAD measurements was within 0.1 ~o of that determined before the 2nd rocket flight. Instrumentation problems again prevented acquisition of sufficient comparison data to characterize the ERB sensors definitively.
The flight results are summarized in Table V, Part B. The relative performances of the ACR and PACRAD rocket instruments and the Nimbus 7 ERB HF are close to that of 1978. The five ACR type IV sensors, three on ACRIM I and two on ACR 402, agree within + 0.08~o.
The 2nd large increase in ESP results in as many flights is indicative of the progressive sensor failure later confirmed by Hickey (1983). The absence of definitive pre- or post-flight comparison results for the rocket ERB sensors in 1978 and 80 frustrates analysis of their relative performances in the series of flights. The channel 3 flat plate thermopile sensors on the Nimbus 6 and 7 ERB's both show substantial decreases since the 2nd rocket experiment, probably the result of degradation of their flat absorbing surfaces by long exposure to short wavelength solar radiation.
4.3.5. The 1983 Sounding Rocket Solar Irradiance Experiment
A fourth rocket flight experiment was planned for July, 1981 to provide an additional calibration of the experiments on the Nimbus 6, 7, and SMM satellites. The payload included a new flight instrument incorporating two Swiss PMO sensors (Brusa and Frt~hlich, 1981) in addition to the ACR 402, PACRAD, and ERB instruments flown

MEASUREMENTS OF SOLAR TOTAL IRRADIANCE AND ITS VARIABILITY 219
TABLE V
Summary of the results from the 3nd NASA total solar irradiance rocket flight (May 22, 1980) and the preflight comparison experiments at the JPL Table Mtn. Observatory (April, 1980) Results shown as
ratios to ACR 402A.
A. Preflight comparison results
Investigator Instrument/type a Ratio to ~o Change ~o Change ACR402A from 1976 from 1978
Rocket experiments: Willson ACR 402A/ESCC 1.0000 - - Willson ACR 402B/ESCC 1.0001 - 0.02 + 0.06 Kendall PACRAD/ESCC 0.9990 + 0.34 - 0.09 Hickey ESP/ESCC 1.0036 + 0.30 - Hickey HF/ESCC 0.9970 -
World radiometric reference experiments: Willson ACR 401/ESCC 1.0019 - + 0.01 Willson ACR 403/ESCC 1.0023 - + 0.03 Willson ACR 404/ESCC 1.0028 - + 0.06
B. Rocket flight results
Investigator Instrument/type s Results Ratio to ~o change ~o change ACR402A from 1976 from 1978
Rocket experiments: Willson (1) ACR 402A/ESCC 1367.8 1.0000 + 0.02 + 0.01 Willson ACR 402B/ESCC 1368.9 1.0008 + 0.12 - Kendall PACRAD/ESCC-P 1373 1.0038 + 0.82 + 0.01 Hickey ESP/ESCC-P 1385 1.0126 + 1.19 + 0.49 Hickey HF/ESCC-P 1376 1.0060 - - Hickey ERB CH 3/RFPT 1377 1.0067 - 0.84 - 0.45
SMM/A CRIM I experiment: Willson ACRIM A/ESCC 1367.5 0.9998 Willson ACRIM B/ESCC 1366.5 0.9992 Willson ACRIM C/ESCC 1367.0 0.9994
Nimbus 6 ERB experiment: Hickey ERB CH 3/RFPT 1377 1.0067 - 1.17 - 0.74
Nimbus 7 ERB experiment: Hickey ERB CH 3/RFPT 1367 0.9994 - - 1.18 Hickey ERB HF/ESCC-P 1376 1.0060 - - 0.01
a Instrument type - see Table III. Note (1): ACR 402A result corrected by a vacuum/air ratio of 0.9958.
before. The ACR 402 instrument failed during integration of the payload with the rocket and the flight was postponed.
Extensive preflight testing for the payload of the 4th rocket flight experiment was conducted during August and September, 1983 at the JPL TMO/STF. Air to vacuum

220 RICHARD C. WILLSON
sensitivity tests and precision air comparisons were conducted for the ACR, PMO, and ERB rocket instruments. The performances of the PMO and ACR instruments were well characterized by the test and judged flight ready. Insufficient quality and quantity of data was acquired by the ERB experiment team to characterize their instrument. Additionally, the ERB experienced some engineering problems that indicated it was not in flight ready condition.
The 4th rocket flight was conducted on December 7, 1983 during the NASA/ESA Spacelab 1 Mission. Simultaneous in-flight data was acquired by the CROM experiment on Spacelab 1 and the ACR and PMO rocket instruments. Data were acquired by the ACR instrument on Spacelab 1, the SMM/ACRIM and Nimbus 7 ERB on the same day as the rocket flight. The results from these experiments (not yet available) should provide the most definitive intercomparative solar irradiance experiment thus far.
4.3.6. Future Solar Irradiance Rocket Experiments
The solar irradiance rocket experiment will be flown at least twice again: in late 1984 to provide a calibration reference for the SMM/ACRIM experiment following the SMM Repair Mission, and in June, 1985 for comparison with the first reflight of the space shuttle experiments (the 1st Earth Observation Mission or EOM 1). If the rocket-EOM 1 in-flight comparisons are successful, the June, 1985 rocket flight will likely be the last. EOM reflights will be possible on approximately an annual basis thereafter and will provide the calibrations required for satellite solar monitoring experiments.
4.4. PMOD BALLOON SOLAR IRRADIANCE EXPERIMENTS
Solar total irradiance observations were made by the Swiss Physical Meteorological Observatory at Davos (PMOD) in June, 1979 as part of a French CNRS high altitude balloon experiment. The average result from the 5 hr of observations at 31-33 km altitude, after correcting for atmospheric extinction, was 1366.0 W m -2 (Frrhlich and Brusa,1981b). A second PMO balloon experiment conducted by Frrhlich and Brusa on June 20, 1980 found the average totalirradiance over four hours of observations at 33-34 km, after correction for atmospheric extinction, to be 1366.8 W m -2
5. Detection of Solar Total Irradiance Variability
5.1. T H E ACTIVE CAVITY RADIOMETER IRRADIANCE MONITOR
The first convincing evidence of solar total irradiance variability was provided by the Active Cavity Radiometer Irradiance Monitor I (ACRIM I) experiment on the NASA Solar Maximum Mission (SMM), the first flight experiment specifically designed for and dedicated to the task of solar total irradiance monitoring (Willson, 1980b). ACRIM I's primary objective, the establishment of a climatological solar total irradiance data base with + 0.1 ~o or better long term precision, has been accomplished during

MEASUREMENTS OF SOLAR TOTAL IRRADIANCE AND ITS VARIABILITY 221
the more than three years of operation since launch (February, 1980). Whether or not there is climatological significance in the results will likely not be apparent until many more years of continuous data are acquired, but the discovery of variability on solar active region time scales has provided substantial new insight into the physics of solar activity in the early years of the mission.
The three ACRIM I detectors were compared with other reference and flight sensors at the JPLTMO in December, 1978 prior to delivery for spacecraft integration (Table IV.A). The differences in performance by the three ACRIM I sensors during the air comparisons was due to differences in air/vacuum ratios. In flight the three ACRIM I sensors agreed within +0.04% of their average result. The third sounding rocket solar irradiance experiment in May, 1980 (see Section 4.8 above) compared two ACR's on the rocket with ACRIM I, demonstrating agreement between all five ACR sensors to within + 0.08% of their combined average result (see Table V).
1980 MONTH '98~ MONTH ~982 MONTH 1983 MONTH
, . t , t . I 1 .
S 0 L A R
- Sl-II I ii',
-8. iS
- 8 . 2 S ~ 100 200 300 100 200 300 190 200 300 100 200 308
1980 DAY I981 DAY 1982 DAY 1983 DAY SMM/ACRZM RESULTS (g VARIATION ) COMPUTED RESULTS: 3 DAY RUNNING MEAN LZNEAR F I T : NET CHANGE= - 8 . 8 8 7 ( + / - 9 . 0 8 2 ) (Z )
Fig. 1. Percentage variation of the 1 AU daily mean solar total irradiances derived from observations by the SMM/ACRIM I experiment. Results for adjacent days have been connected by lines to more clearly delineate major variabilities. The decreased quality of the results from the experiment beginning on 1980 day 350 marks the loss of precision solar pointing capability by the SMM spacecraft and the start of spin stabilized operation. The mean value of the total irradiance at 1 AU over the period is 1367.7Wm -2. During the 300 days of normal SMM operation in 1980 a precision of better than _+ 0.002% was sustained and all variations visible on this scale are believed to be solar in origin. In the SMM spin mode variability exceeding + 0.02% is solar in origin. The linear least mean square fit to the results exhibited a net decrease of about 0.09% over the life of the experiment to date. Repair of the SMM solar pointing capability by the Space Shuttle in 1984 should restore the high quality results
available during normal operation in 1980.
MEAN: 1 3 6 7 . 6

222 RICHARD C, WILLSON
ACRIM I's three active cavity radiometer type IV sensors are used with different frequencies to provide internal calibration of system degradation. A measurement precision smaller than + 0.002~o was sustained using this technique during the first 300 days of (normal) SMM operation. The standard error of single orbit averages of solar flux during this period were frequently as small as +_ 0.001 ~o (Willson, 1981c).
ACRIM I observations from launch through the end of 1982 are shown in Figure 1 as the percentage variation about the mean 1 AU solar total irradiance. The general character of the record is that of continuous variability whose major features are irradiance decreases lasting from a few days to a few weeks with a maximum amplitude of about - 0.25 %. The timescale of variability ranges from seconds to the duration of the record (Willson, 1980c-e, 1981a-d, 1982; Willson and Hudson, 1981b).
The solar pointing system of the SMM failed in December, 1980 and the satellite was placed into a spin stabilized mode with the spin axis nominally directed at the Sun. Since SMM was not designed for spin stabilization this axis wobbles slowly about the solar direction with a maximum pointing error of about 10 degrees. The ACRIM I experiment was placed into a new operating mode to take maximum advantage of the limited solar pointing provided by the spin stabilized spacecraft. In place of the normal procedure of opening or closing ACRIM I's shutters every minute, they were opened at orbit sunrise and closed at sunset. This procedure, with ACRIM I's tolerance for off-sun pointing of 0.75 degrees, has produced an average of 100 solar observations per day during the spin stabilized operation of the SMM. After correcting for small systematic differences between ACRIM I's response to solar irradiance in the normal and spin modes of solar pointing (the largest of which was -0.12~o) the relativity of the observations in the two phases of SMM operation are believed to be known with no more than 0.02% uncertainty (Willson, 1983).
The effects of the decreased quantity and quality of ACRIM I data in the spin mode can be seen in Figure 1 as noise at the + 0.01~o level in the results following 1980 day 350. Some of the information available from the normal 300 mission days in 1980, particularly that used to detect the signature of the 5 min solar global oscillation in the total irradiance, appears to be unavailable in data of the spin mode. All the major irradiance events found to be correlated with solar activity continue to be clearly resolved.
6. Solar Variability over Active Region Lifetimes
One of the major discoveries of the ACRIM I experiment was solar total irradiance variability on time scales of days to weeks (Willson, 1980b, 1980c, 1980e; Willson et al., 1981c). These variations have been found to result from the modulation of the average solar irradiance by sunspots and faculae in active regions (see Figure 2) (Hudson and Willson, 1981; Hudson etal., 1982; Eddy etal., 1981a; Oster etal., 1982). Correlative evidence of the larger variations has since been found in the results of the Nimbus-7 ERB experiment as well (Hickey et al., 1982).
Substantive new understanding of the physics of solar active regions has already

MEASUREMENTS OF SOLAR TOTAL IRRADIANCE AND ITS VARIABILITY 223
P L A 58
G E 9
-SO
-199
MEAN; 1367,7
1988 MONTH /981 MONTH 1982 NONTF
MEAN: 1.49
9 1S A C
9.18S R Z M - 9 . 8 5
- 8 . 1 s
9.1~
8.8Si
-8. gS:
-8 . 15
- 9 . 2 5
- 9 . 3 S 188 288 38e 180 288 308 188
! 9 8 8 DAY 1981 DAY 1982 DAY SNN/ACRIN RESULTS AND OTHER PARAMETERS CX VARIATION ABOU- MEAN}
Fig. 2. Percentage variation of the total solar irradiance derived from the SMM/ACRIM I experiment (middle panel) plotted with the total plage (top panel) and sunspot areas (bottom panel) projected in the earth's line of sight. Gaps in the data sets have been filled by linear interpolation and three day running means of the three solar parameters shown have been used as a low pass filters to emphasize their variability on longer timescales. The fraction of the visible solar disk not covered by sunspots is plotted to produce variation in the same direction as the irradiance deficits. Means for plage and sunspot are in percentage units, that for ACRIM I is total irradiance at 1 AU in W m - 2. The close correlation between most irradiance dips and projected sunspot area, the so-called sunspot deficit effect, is readily apparent. The plage radiative excess effect is more subtle, causing some irradiance peaks and offsetting the sunspot deficit in some cases, decreasing the amplitude of some sunspot induced dips. Sunspot and plage areas
were derived from NOAA Geophysical Parameters.
-0 .2S
MEAN: 99 .88
been derived from the ACRIM I results utilizing extant solar active region data. Derivation of new insight is fundamentally limited, however, by the quality of the active region database. Sunspot area has been monitored routinely for more than a century but not with uniformly high precision and without accurate determinations of radiative properties. Due to the difficulty of detecting and measuring facular area, except near the solar limb, it has never been routinely monitored. Precise, routine monitoring of both solar irradiance and solar active region properties will be required to advance beyond a first order understanding of the physical processes in active regions.
In the discussions here the areas of sunspots and faculae, projected in the Sun-Earth direction, have been derived from NOAA Geophysical Quantities tabula- tions. The presence of faculae is assumed to have a 1 : 1 correspondence in area and loction with the Ca plage areas and must be considered an approximate means of

224 RICHARD C. WILLSON
representing effective facular radiative extent. The plage database is less complete and precise, over the same period, than the sunspot record.
6.1. SUNSPOT RADIATIVE DEFICIT
Temporary decreases in solar total irradiance caused by the transit of solar active regions containing sunspot area across the Earth's side of the Sun are the dominant variable phenomenon in the ACRIM I results. These radiative deficits, lasting from days to weeks, have amplitudes as large as - 0.25~o of the average total irradiance. The detailed temporal correspondence of the total sunspot area with most of the irradiance decreases can be clearly seen in Figure 2.
Sunspots have long been known to be cooler than the undisturbed photosphere with (umbra-penumbra average) temperatures of about 5200 K and radiative intensities about 70~o of the solar average. They were therefore assumed to be a potential cause of variations in the solar radiative output. Measurement of their effects on total irradiance by ACRIM I has verified this assumption and provided a quantitative variability database capable of supporting empirical modeling of active region properties (Willson etal., 1981c; Hudson etal., 1982; Eddy etal., 1982b; Sofia etal., 1982; Oster et al., 1982b; Hirayama, 1982). The principal radiative effects of sunspots, insofar as the total flux is concerned, are confined to the photosphere. For this reason their radiative transfer characteristics (so-called limb darkening) relative to the solar disk center, as seen from the Earth, are similar to the undisturbed photosphere. Their maximum radiative effect occurs when they are on the longitude of the center of the solar disk. A simple model of the radiative effects of sunspots, using average radiative properties (Allen, 1983), sunspot areas from NOAA Geophysical Quantities and the standard photospheric limb darkening law predicts sunspot induced deficits in the total irradiance that, when added to the ACRIM I results, reduces their variability (Willson etal., 1981c; Hudson etal., 1982a, 1982b).
6.2. FACULAR RADIATIVE EXCESS
Facular regions have higher average temperatures and about 370 higher radiative intensities than the undisturbed photosphere. The large faculae frequently found in the same active regions as sunspots usually develop to their maximum size after the associated sunspots, have larger average areas and persist longer.
Large faculae, some co-located in active regions with sunspots, appear to be responsible for excesses of total irradiance on active region timescales. The clearest manifestations of facular radiative excess are found in two distinct patterns in the ACRIM I results: (1) The irradiance peaks found in synchronism with the rotation of large faculae onto and off the solar limb; and (2) the reduction of sunspot deficit on several occasions when active regions containing large areas of both sunspot and faculae were in transit across the visible solar disk (Willson etaI., 1981c; Willson, 1982; Eddy etal., 1982a, 1982b; Sofia etal., 1982). The amplitude of facular excess is smaller than sunspot deficit for the same areal extent and heliographic location.

MEASUREMENTS OF SOLAR TOTAL IRRADIANCE AND ITS VARIABILITY 225
None have been detected that exceed about + 0.1% relative to the average total irradiance.
The most obvious examples of the 1st kind of facular radiative effect can be seen in Figure 2 as the irradiance maxima just following the large sunspot deficits near days 100 and 200 and the maximum preceding day 250 in 1980. The fractions of the solar disk covered by facular area at these times was substantially in excess of the 1.4% average over the 2I/2 year record shown in Figure 2, and there were no coincident minima of sunspot area.
No additional examples of the 1st kind of facular effect can be clearly detected in the SMM spin mode period (following 1980 day 346) despite the large peaks of facular area occuring in late 1981 and early 1982. This is probably due the increased uncertainty level for the day-to-day record of ACRIM I irradiance in the spin mode, which at + 0.02% is 40% (peak-to-peak) of the maximum facular signal. The best examples of the 2nd kind of facular radiative effects are found near 1980 day 210 (see Figure 2),
198@ HONTH 1981 PIONTH ~982 HONTH O.&5; i t3 ' l P ' l 17' I ~ f 9' , I J , 1 ~ , , p , , @ 7 ~ ' , t 1.1' 11' , ~3'1 ~ ' , 17'1 ~ ' ' ,l~t
i
8 . 8 S L I I . | I i . . ~tt bL l t 3 6 7 . 7
- 8 . t 5 L i n e a r s NeE c h c l n g e = - 0 . 1 ~ 8 ~ i ' ] ,
- 0 . 2 S
,1 : , ,,L ~'tt v,~l i ~l (i]; :.1- e.es;
l - 0 . t5 : . . = ~ . v
- 0 . 2 5 0.15;
J, Ii II, 1 3 7 2 . 4
L i n e a r f ' i { : NeE c h c t n g e = - 0 . 0 6 i " ' '1 ~ i , .j, - 0 . 2 5 ; [ , I i I [ I ~ I ~ ~ ~ I I ~ I ~ I ~ I I
1 (30 200 300 108 200 308 100 200 300 1980 DAY 1981 DAY 1982 DAY PERCENTAGE VAR:] :AT]:ON OF PARAHETERS CUHULAT] :VE D A Z L Y NEAN RECORD
Fig. 3. Comparison plots of the percentage variation of the daily mean solar total irradianee observations made by the SMM/ACRIM I (top panel) and NIMBUS 7 ERB (middle panel) experiments from the start of the SMM through the end of 1982. The results from both are plotted with lines connecting observations made on adjoining days to emphasize the features of solar variability and the amount of missing data in both records. The bottom panel (ERBMOD) was compiled by adding data to the ERB record from the SMM/ACRIM I results for days when ACRIM I had results and ERB did not. The average results (in W m - 2 at 1 AU) and the net change in irradiance (in percentage units) resulting from the linear least mean square fits to the three records are shown. The remaining difference between ACRIM I and ERBMOD slopes is not significant with respect to the uncertainties in the long term
precision of the irradiance records.
HEAN: 1 3 7 2 . 4

226 RICHARD C. W1LLSON
A O.IE C R I 8.05 M
-g.OE
-~, 1E
- 8 , 2 E
MEAN: 1372.6
1989 MONTH ,4 p , p , ,7 p , ? , ,19 ,~1 ,17
Linear" s Net change=-9.94
L i n e a r f i ~ / . Ne[ change- - -13.92
MEAN: 1368.2
g , IS
0,0S
-8 .05
-9 . IS
- 0 . 2 5
g. IE I
,,
- ~ v v t/,v ' -e . is F II Y "1 w L'~176 chon o - 9 , . 9 S , , , , , ,
59 199 159 289 259 399 3Sg 1989 DAY PERCENTAGE VARIATZON OF PARAHETERS CUMULATIVE DAZLY MEAN RECORD
Fig. 4. Comparison plots of the percentage variation of the daily mean solar total irradiance observations made by the SMM/ACRIM I (top panel) and NIMBUS 7 ERB (middle panel) experiments during the 300 days of normal operation of the SMM in 1980. The results from both are plotted with lines connecting observations made on adjoining days to emphasize the features of solar variability and amount of missing data in both records. The bottom panel (ERBMOD) was compiled by adding data to the ERB record from the SMM/ACRIM I results for days when ACRIM I had results and ERB did not. The mean results (in W m -2 at 1 AU) and the net change in irradiance over the 300 days (in percentage units) resulting from the linear least mean square fits to the three records are shown. ACRIM I precision over this period was better than _+ 0.002%. Agreement between the ACRIM I and ERBMOD slopes to within
0.01% is within the uncertainty of constructing ERBMOD,
MEAN: 1372,8
1981 day 100 and 1982 day 30. The amplitudes of the irradiance decreases in these instances were smaller in proportion to the projected sunspot areas than in cases when little facular area was present (e.g. 1980 days 100 and 1981 day 210). In the last example, a broad irradiance dip lasting from 1982 day 25 to 45 has a secondary maximum near its center caused by a coincident peak in facular area.
One other interesting case is worth citing which demonstrates both kinds of facular effects. Near 1980 day 175 a large maximum of facular area created a pre-dip irradiance peak and offset the following sunspot deficit, shifting the apparent irradiance minimum to day 178, three days after the sunspot maximum.
6.3. EFFECT OF SOLAR ROTATION ON SUNSPOT AND FACULAR EFFECTS
The most obvious effects of sunspot and facular area on irradiance occur at different
M E A S U R E M E N T S O F S O L A R T O T A L I R R A D I A N C E A N D ITS V A R I A B I L I T Y
r ~ ~ I r T i �9 I
227
i
O
x
N '-r-"
,,,1
O 13-
2.5 3.0 3.5 FREQUENCY (mHz)
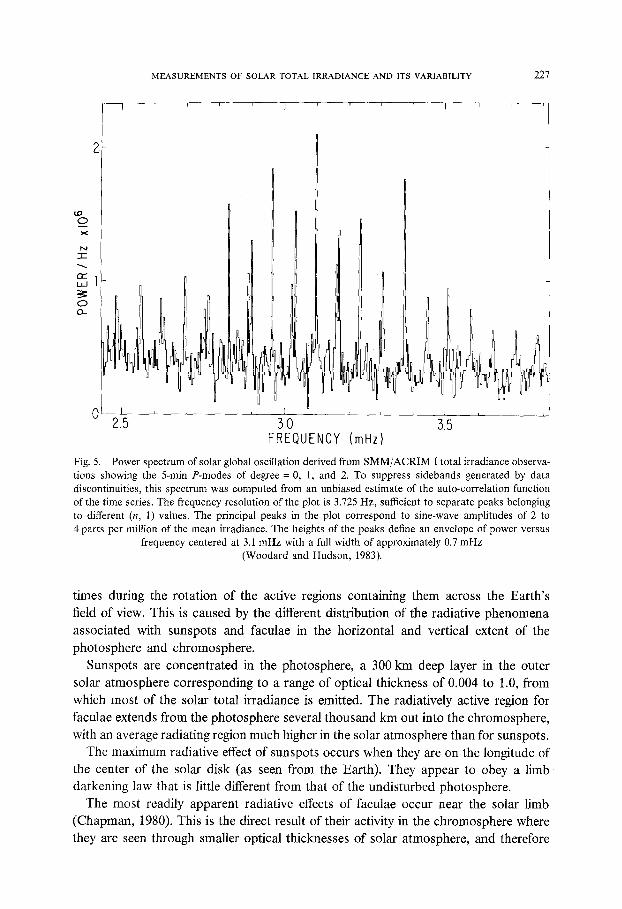
Fig. 5. Power spectrum of solar global oscillation derived from SMM/ACRIM I total irradiance observa- tions showing the 5-min P-modes of degree = 0, 1, and 2. To suppress sidebands generated by data discontinuities, this spectrum was computed from an unbiased estimate of the auto-correlation function of the time series. The frequency resolution of the plot is 3.725 Hz, sufficient to separate peaks belonging to different (n, 1) values. The principal peaks in the plot correspond to sine-wave amplitudes of 2 to 4 parts per million of the mean irradiance. The heights of the peaks define an envelope of power versus
frequency centered at 3.1 mHz with a full width of approximately 0.7 mHz (Woodard and Hudson, 1983).
times during the rotation of the active regions containing them across the Earth's
field of view. This is caused by the different distribution of the radiative phenomena
associated with sunspots and faculae in the horizontal and vertical extent of the
photosphere and chromosphere.
Sunspots are concentrated in the photosphere, a 300 km deep layer in the outer
solar atmosphere corresponding to a range of optical thickness of 0.004 to 1.0, from
which most of the solar total irradiance is emitted. The radiatively active region for
faculae extends from the photosphere several thousand km out into the chromosphere,
with an average radiating region much higher in the solar atmosphere than for sunspots.
The maximum radiative effect of sunspots occurs when they are on the longitude of
the center of the Solar disk (as seen from the Earth). They appear to obey a l imb darkening law that is little different from that of the undisturbed photosphere.
The most readily apparent radiative effects of faculae occur near the solar limb
(Chapman, 1980). This is the direct result of their activity in the chromosphere where
they are seen through smaller optical thicknesses of solar atmosphere, and therefore

228 RICHARD C. WILLSON
with less extinction of their radiation at any solar longitude, than co-located sunspots. Additionally, faculae usually have a larger total area than sunspots in solar active regions, making them the first and last component of a radiatively active region to be seen near the east and west solar limbs.
The enhanced contrast of facular radiative effects near the solar limb have led some researchers to ascribe a highly non-isotropic character to their emittance, con- cluding that their radiative effects are inconsequential elsewhere on the disk (Sofia et al., 1982; Oster et al., 1982). This is not supported by the ACRIM I observations in which the radiative excess of large facular area have been observed to offset sunspot deficit throughout the transit of radiatively active regions across the visible solar disk (Willson, 1982).
6.4. H E M I S P H E R I C C ONC E NT R AT ION OF ACTIVE REGIONS IN 1980
Investigation of a regular recurrence of sunspot deficit in the ACRIM I results led to the discovery of a related and even more regular recurrence of solar active regions over a six month period in 1980 (Willson, 1982). The irradiance decreases demonstrated an average period of 24 days from April to October, 1980, with a maximum deviation of 5 days. The principal solar active regions containing the sunspots responsible for the irradiance dips were also found to recur with an average period of 24 days but with a deviation of less than three days when the combined spot and plage areas were used to define the loci of the active regions.
During this six month interval the majority of the active regions were confined to one solar hemisphere (active region data derived from NOAA Geophysical Parameters). Time series analyses revealed prominent periods for both the ACRIM I irradiance and the total sunspot area near the 1st, 2nd, and 3rd harmonics of the 24 day periodicity. This provides an analytical link between the two phenomena and reflects the persistence of the large active regions, over at least several solar rotations, that were principally responsible for spawning the sunspot areas causing the irradiance deficits (Willson, 1982).
7. The Total Irradiance Signature of Solar Global Oscillation
The precision of the ACRIM I results led Hudson (Woodard and Hudson, 1981) and FrOhlich (1982) to search, independently, for a possible solar global oscillation signature in the total irradiance. They separately detected the low degree p-modes (l = 0, l = 1, l = 2) of a 5 rain oscillation in the ACRIM I results with amplitudes of a few parts per million (ppm) and coherence lifetimes of at least one week, in agreement with the predictions of Gough (1982). The analysis of Woodard and Hudson confirmed the frequencies reported by Claverie etal . (1981a, 1981b) using ground based data acquired from a different type of experiment. The 5 rain oscillation spectrum derived by Woodard and Hudson is shown in Figure 5.
Evidence of the 160 min oscillation reported by Severny et al. (1976, 1981) was not found in the ACRIM I results. A detection limit of 50 ppm of the total irradiance

MEASUREMENTS OF SOLAR TOTAL IRRADIANCE AND ITS VARIABILITY 229
signal was derived by Woodard and Hudson (1981) as the sensitivity threshold of the ACRIM I data for detection of this oscillatory phenomenon.
The irregular pattern of data acquisition by ACRIM I during the SMM spin mode (late 1980-early 1984) will not support global oscillation investigations. The repair of the SMM solar pointing system by the Space Shuttle in April, 1984 will, if successful, enable full and uniform solar irradiance data acquisition by the ACRIM I experiment again through 1988. Some operational modes will be tested during this period that may increase the utility of ACRIM I data for oscillation studies.
8. Energy Balance in Radiatively Active Regions
How and when energy balance is restored to a region of the solar atmosphere following its involvement as an active region are of great significance to the study of the physics of the solar convection zone and the Earth's climatology, respectively. The physics of the convection zone will be better understood when both questions are answered. If the length of time required to restore equilibrium is of the order of years, solar activity induced irradiance changes will have potential climatological significance.
Sunspot-induced irradiance deficit can be explained by a theory of energy diversion in the convection zone by magnetic fields (Spruitt, 1977; Foukal et aL, 1979; review by Newkirk, 1983). Intense magnetic fields within the convection zone are capable of inhibiting the flow of energy to the overlying photosphere, causing local cooling which appears as sunspot area. The energy thus delayed in reaching the photosphere (the sunspot deficit) is either forced to find alonger path around the magnetic obstruction, is stored temporarily by the magnetic field or a combination of both. A temporary solar radiative deficit is created of the character observed by the SMM/ACRIM I experiment.
The disposition of the diverted or stored flux and the process of eventual restoration of energy balance in solar active regions are not well understood. Rapid restoration of energy balance (i.e., on timescales short relative to active region lifetimes) is inconsistent with the ACRIM I observations unless physical mechanisms capable of transforming and/or redistributing the deficit flux in such a way that it is undetectable by ACRIM I are found.
The possibility of temporary storage and subsequent gradual release of the sunspot deficit energy by facular excess has received the most attention thus far. In this scheme, the diverted and/or stored sunspot deficit energy eventually reaches the photosphere and chromosphere, either through longer convection paths around the active region blockage in the case of thermal energy storage, or through eventual release from magnetic fields. The stored energy then combines with the normal upwelling flux and overheats the photosphere and chromosphere of the region, creating faculae which slowly dissipate the deficit flux, completing the lifecycle of the active region and restoring regional equilibrium.
The gradual restoration of energy balance in solar active regions by subsequent facular excess emission is a plausible mechanism for at least some of the deficit flux

230 RICHARD C. WILLSON
(Willson etal., 1981c; Hudson etal., 1981b; Eddy etal., 1982b). The timescale on which it would occur depends on the depth within the convection zone where impedance of energy transfer begins. If convective blockage occured near the base of the convection zone, transport of the deficit energy to the photosphere could take on the order of 100000 yr (Eddy etal., 1982b). An analysis of recent facular observations and the ACRIM I results indicates that facular excess emission is the principal mechanism for dissipating sunspot deficit flux and that it occurs on the timescale of active region lifetime (Chapman, 1982).
Bruning and Labonte (1982) used active region data derived from solar magnetograms in an analysis of ACRIM I results which indicated that on timescales of a year or less no net solar energy imbalances persists. Their analysis does not rule out the possibility that rapid or real time balance might occur. They suggest that poleward redirection of sunspot deficit flux through anisotropic radiation by faculae might be a mechanism that would permit real time balance and yet prevent ACRIM I from detecting it.
Real time or rapid solar radiative equilibrium conflicts with the findings of Eddy et al. (1982b) and Chapman (1982). An analysis by Eddy of the 1980 ACRIM I results and correlative records of sunspot and plage areas has produced an empirical model of the radiative effects of sunspots and faculae. They have used this model to reconstruct possible solar total irradiance variability extending more than 100 yr into the past, based on the historical records of sunspot area and a fixed, average faculae/sunspot area ratio. Their model does not indicate an energy balance on timescales shorter than a sizable fraction of one year.
The model of Eddy (1982a) is the most successful yet in terms of providing a fit to the 1980 ACRIM I results yet there are significant remaining discrepancies between measured and modeled total irradiance. Errors in the record of sunspot area compiled by various observatories are a significant source of uncertainty for the modeled sunspot deficit.
The most fundamental limitation of the Eddy/Hoyt model is the assumption of a fixed faculae/sunspot area ratio which biases its projections for equilibrium restoration in two important ways. It does not allow faculae to persist after sunspot area in active regions, substantially decreasing their contribution to restoration of energy equilibrium, and increasing the apparent time required. It automatically produces maximum irradiance during absences of sunspot area, a result not supported by the ACRIM I results thus far.
A fixed faculae/sunspot area ratio was not a good representation of the distribution of these components of active regions in 1980 during the 300 days of normal SMM/ACRIM I observations. A detailed analysis of the major solar active regions revealed that sunspot and facular areas within each of them showed a consistent pattern of phased evolution (Willson, 1982). The active regions responsible for most of the solar variability first developed sizeable sunspot areas lasting for one or more solar rotations. Facular area in the same regions peaked later and lasted longer, for up to six solar rotations.

MEASUREMENTS OF SOLAR TOTAL IRRAD1ANCE AND ITS VARIABILITY 231
No physical mechanism for achieving real time or rapid restoration of equilibrium has been proposed that appears to be singly capable of providing the magnitude of
energy transfer required for real or rapid offset of sunspot deficit flux. Yet insufficient information is at hand to reject the possibility that some or all may be acting together to contribute toward equilibrium restoration to the region on rapid timescales (Hudson and Willson, 1981b; Hudson, 1983).
The radiative excess of faculae is, at present, the most appealing cantidate process for restoring energy balance to solar active regions. A crude estimate of their ability to do so can be derived from average values of facular and sunspot radiative properties and lifetimes over the period of the ACRIM I database shown in Figure 2, Restoration of equilibrium by facular excess requires the magnitude of the radiative effects of faculae and sunspots to be equal over the lifetime of the active region. The products of their areas, lifetimes and radiative intensities relative to the undisturbed photosphere provides a measure of the total energy of the two phenomena.
Computation of the average facular excess and sunspot deficit for the February, 1980 through July, 1982 period shown in Figure 2 are summarized in Table VI. From Allen's Astrophysical Quantities: The average lifetimes of faculae in solar active regions are 1.8 times longer that of sunspots, faculae radiate about 3~o more flux than the undisturbed photosphere, and sunspots radiate about 31~o less (averaged over umbra and penumbra).
The approximations and uncertainties of the quantities used to calculate the total radiative energy index in Table VI should not be minimized. The 10~o difference
TABLE VI Approximate average radiative properties of sunspots and faeulae in solar active regions 1980-82. The nearness of their products is supportive of active region radiative models based on restoration of energy
balance in active regions by the radiative excess of faculae.
Property Sunspots Faculae Units
Area 1.2 14 Thousandths of solar disk Lifetime 1.5 2.7 Months Intensity - 0.69 + 0.03 Intensity relative to photosphere
Product - 1.2 1.1 (To nearest significant digit)
Sources: Areas - NOAA Solar Geophysical Data; Lifetimes and relative intensities - Allen's Astrophysical Quantities (1963).
between the total energies is fortuitously small, but even if they had demonstrated only approximate agreement it would have provided support for the possibility of restoration of energy balance in solai" active regions by facular radiative excess, at least for the period 1980-1982. This possibility is supported by the recent experimental results obtained by Chapman (1983) using precision, high resolution photometry of solar active regions.

232 RICHARD C. WILLSON
9. Solar V a r i a b i l i t y on T i m e s c a l e s o f Years
9.1. SMM/ACRIM I RESULTS
The SMM/ACRIM I results have provided a record of solar variability over a multi-year period with adequate precision to unambiguously detect subtle long term trends in irradiance. Although increases and decreases lasting up to six months can be seen in the results shown in Figure 1, a sustained downward trend has been resolved over the nearly three years of data analyzed thus far, resulting in a net irradiance decrease of about 0.08yo (see Figure 3). Intercomparisons of ACRIM I's three independent sensors over this time have demonstrated instrument degradation to be less than the _+0.02% uncertainty with which the ACRIM I results from the normal and spin
mode of SMM can be related. Most or all of the decrease is therefore solar in origin, unless some unknown factor outside the ability of ACRIM I's self calibration is uniformly affecting the results from all three ACR sensors.
The sustained irradiance decline may be the beginning a solar irradiance variation related to the solar magnetic activity cycle. Observations equivalent to ACRIM I's must be sustained well into the late 1980's, approaching the solar maximum period of solar cycle No. 22, to unambiguously determine the nature and cause of this apparent long term variation.
9.2. COMPARISON OF SMM/ACRIM I AND NIMBUS 7 ERB RESULTS
There is evidence of a long term downward trend in the total irradiance results from the Nimbus 7 ERB experiment that is similar to that in the ACRIM I results, but the slope quoted in published results is smaller. A least mean square linear fit to the ERB results over the 1050 days from the beginning of the SMM through 1982 (Figure 3, panel b) shows a net change of - 0.03 %, which is probably not significant with respect to the experiment's precision over the period. The absence of a trend is in direct dissagreement with the ACRIM I results and must be further analyzed for its significance.
There are several possible reasons why the ERB results do not exhibit the - 0.08~o trend detected by ACRIM I: The ERB experiment may lack the long term precision to resolve the trend, the large number of missing days of ERB data in 1981-1982 may have biased the trend, there may have been anintentional 'detrending' of ERB data, or a combination of these.
The long term precision of the ERB database has not been succinctly discussed in the literature. Some idea of the measurement's stability can be derived from the fact that the data has been re-evaluated several times during the six years of the Nimbus 7 Mission and the value of the 1 AU average irradiance has been successively revised downward. The initially reported value of 1376Wm -2 (Hickey etal., 1980) was decreased by 0.2~o in 1982 to 1373 W m -2 (Foukal et aL, 1982) and further decreased to 1371 W m -2 in 1983 (Hickey, 1983). Downward re-evaluations of the SI value of the results would not neccessarily change their slope, but such successive manipulations would have the potential of decreasing the experiment's long term precision.

MEASUREMENTS OF SOLAR TOTAL IRRAD1ANCE AND ITS VARIABILITY 233
The most important single published fact regarding ERB's long term precision is that its stability of sensitivity was + 0.16~o during the first two years of operation (Hickey et al., 1980). If this level of performance was maintained over the 1050 days of data analyzed here, it may represent the lower limit for detection of trends in the ERB results. During 1981-1982 ERB did not acquire solar data on a large number of days during which large irradiance decreases were observed by ACRIM I (see Figure 3). The absence of these data from ERB's database may have biased the slope of a linear fit to a smaller negative value. To test for this possibility gaps in the ERB record were filled using daily mean values proportional to the percentage variability detected by the ACRIM I experiment (wherever it had data and ERB did not) (Willson, 1983). Care was taken to scale the added data to the average value of the ERB irradiance (Hickey et aL, 1982).
The results are plotted in Figure 3. The period of time shown covers the 1050 days for which ERB results are presently available following the SMM/ACRIM I launch. The least mean square linear fits made to each of the ACRIM I, ERB, and augmented ERB (ERBMOD) results are shown superimposed on the data sets. The restoration of missing data to the ERB record produces a net irradiance change of -0.06~o over the 1050 day period, which agrees with the ACRIM I slope to within the uncertainty of the long term precision of both experiments.
The 1982 re-evaluation of NIMBUS 7 ERB data (Hickey etaL, 1982) appears to have decreased or eliminated any significant trend for at least some the results. Early in 1981 the data from the ACRIM I experiment during the 300 days of 'normal' SMM spacecraft operation were compared with the corresponding 300 days results from the Nimbus 7 ERB. At that time Hickey's analysis reported a -0.04970 net change for the linear fit to the ERB results over this period (Hickey, 1981) and Willson found a -0 .04~ slope for the ACRIM I results (Willson, 1982).
The re-evaluations of ERB data for the same period reported by Hickey in 1982 and 1983 have a much smaller slope for this subset of the database. The results for ACRIM I, ERB, and ERBMOD are plotted for 1980 days 50 to 350 in Figure 4. During this period the long term precision of the ACRIM I results was smaller than + 0.002~o, making its -0.0470 slope significant with less than + 5~o uncertainty (Willson, 1982). The net change of the linear fit to the re-evaluated ERB results ( - 0.02~o) is probably not significant with respect to the experiment precision over this period. The ERBMOD slope, however, agrees with that of ACRIM I to within the accuracy of constructing the augmented ERB database.
The absence of significant slope in the current ERB results for 1980 indicates that slope was removed as part of the re-evaluation, yet there has been no published statement to that effect or rationale for it. Hickey regularly removed long term slope from the results of the NIMBUS 6 ERB on the assumption that the slow decrease in results from that experiment was due to sensor degradation (Hickey and Griffin, 1979). There was justification for doing so, since the instrument had a flat plate detector that could not attenuate degradation of its solar absorption by UV and particulate fluxes in space. Since there was no capability within the experiment to

234 RICHARD C. WILLSON
separate solar trends from degradation, the 'detrending' removed all long term slope from the data, producing constant results to within the precision limit of the approach.
The same detrending is not justified for the Nimbus 7 ERB. Its cavity detector has similar properties to the ACR detectors in the ACRIM I experiment and might reasonably be expected to have similar sensitivity to degradation. Internal self calibration by the three ACRIM I ACR's placed an upper limit of 0.02~o on their degradation during the 1050 days shown in Figure 3. The upper limits on ERB degradation should not be very different.
The stated ERB stability limit of + 0.16~o is consistent with apparent noise in the database (see panels b in Figures 3 and 4) and is probably a reasonable measure of the experiment's precision. Trends in the results smaller than 0.16~o would then not have significance, but are artifacts of, and dependent on specific re-scaling and detrend- ing algorithms. The agreement between the ERBMOD and ACRIM I slopes within 0.02 ~o is probably fortuitous and only serves to indicate that the missing ERB data does in fact bias the apparent slope of its results to smaller values.
The probability of the trend in ACRIM I results being solar in origin is increased if the above arguments are correct and the ERB results lack long term significance below the + 0.16~o level. Such a solar trend may be the beginning of a secular variation in solar luminousity on a solar cycle timescale.
9.3. SUMMARY OF LONG TERM VARIABILITY
There are only a few scattered electrically self calibrated cavity (ESCC) total solar irradiance results between the 1st, the 1969 ACR balloon experiment, and the launch of the SMM/ACRIM I in 1980. This is far from a definitive solar monitoring data base but can provide an estimate for the upper limit to long term solar variability over the 11 year period separating the maxima of solar cycles 20 and 21.
The 1969 balloon and 1976 rocket ACR instruments were never directly compared but the relativity of their measurements was established through cross comparisons with WRR-defining pyrheliometers. The 0.15}'o difference between their flight results is comparable to the uncertainty of relating them, placing a probable upper limit of + 0.3 ~o on long term solar variability between 1969 and 1976.
The rocket ACR, SMM/ACRIM I, and PMO balloon experiments, extensively intercompared with each other and with WRR reference pyrheliometers, have demonstrated consistent performance throughout their various flight experiments at the +0.1~o level. The combined average of all ACR and PMO results is S = 1367.7Wm -2 with ACR results systematically 0.1~o higher. Accordingly, + 0.23 is both a likely lower limit of the SI uncertainty of any single measurement
by these instruments from 1976 through 1980, and the range in which long term solar variability over the period could have occured without detection.
MEASUREMENTS OF SOLAR TOTAL IRRADIANCE AND ITS VARIABILITY 235
10. Implications of Variability for Future Solar Monitoring
10.1. TOTAL IRRADIANCE M O N I T O R I N G
The discovery of significant short term solar variability has shown that continuous satellite solar irradiance monitoring is required to provide the precision, accuracy and sampling frequency to adequately characterize it. Isolated solar variations with the amplitudes (between 0.1~ o and -0.3~o) and time scales (days to weeks) observed thus far do not appear capable of altering the solar-terrestrial energy transfer sufficiently to have a measureable impact on weather. Yet if the solar physical processes that cause them are to be understood, their precise measurement and analysis are essential.
The goal of continuous solar monitoring should be to provide a precise irradiance data base that will aid in the development of quantitatively accurate solar physical models. The end result would be a predictive capability for solar irradiance variability at the levels of accuracy and precision, and on the time scales of significance to the Earth's weather and climate.
10.2. SPECTRAL IRRADIANCE MONITORING
Variations of the spectral distribution of solar irradiance at visible wavelengths have been detected by a balloon experiment (FrOhlich and Wehrli, 1982) that appear to have phase and amplitude relationships with ACRIM I measurements of total irradiance variability. The amount of data on the variations is limited. Observations were made at three wavelengths (0.368, 0.500, and 0.778 rtm) in a four hour experiment in 1980 and was acquired during a relatively quiet period of total irradiance variability. Yet there is a distinct wavelength dependence similar to that known to occur for higher energy solar radiation (UV and X-ray) in which the amplitude of variation is inversely proportional to wavelength.
Changes in spectral distribution during periods of large total irradiance variability could have significance for the terrestrial atmosphere. The percentage variation will likely be small, comparable to the few tenths of a percent maximum amplitude detected in the total irradiance variability, but they occur over the broad visible and IR spectral region including most of the Sun's total power output (90~o is included between 0.4 and 4.0 rtm). The effects on absorption by ozone, oxygen, water vapor, and carbon dioxide in this wavelength range may have measureable effects on dynamical processes in the Earth's atmosphere.
Future solar monitoring experiments should be able to measure both the total irradiance and its spectral distribution in near UV, visible, and IR wavelengths. A space shuttle experiment has been developed by the French CNRS (Thullier, 1982) that began measurements in this range during the Spacelab 1 Mission in 1983. The NASA Spacelab 1 ACR total irradiance experiment was designed to accomodate additional spectral monitoring modules for future reflights on the space shuttle.

236 RICHARD C. WILLSON
11. Present and Future Solar Irradiance Monitoring
11.1. INTERRUPTION OF THE SOLAR DATABASE IN SOLAR CYCLE 2 i
The investigation of the effects of solar irradiance variability on the Earth's climate requires a solar total irradiance record with at least 0.1% precision over decades. The current state of the art in solar pyrheliometry is capable of realizing SI uncertainty of no less than + 0.1 ~ . Until better instruments are available the only sure method of sustaining the necessary long term precision would be the overlapping deployment of successive solar monitoring experiments, relating their observations at the level of their mutual precision.
Because of the paucity of research satellites to be launched during the 1980's it is probable that deployment of overlapping satellite solar monitoring experiments will not be accomplished. The continuity of the solar irradiance data base begun by the SMM/ACRIM I is therefore clearly in jeopardy.
11.2. SOLAR TOTAL IRRADIANCE MONITORING STRATEGY FOR THE 80'S
A Solar Maximum Repair Mission using the space shuttle is currently planned for 1984 to repair the precision solar pointing capability of the SMM satellite. This will restore most of the capability of at least six of its seven experiments, including ACRIM I, and could prolong their experimental lifetimes until 1988. The next solar monitoring experiment, the ACRIM II, is presently under development for deployment on the Upper Atmospheric Research Satellite in 1990 (at the earliest).
Overlapping deployment of satellite solar monitors will not occur in the 1980's. There will be at least a two year gap in the total irradiance database at the beginning of the activity maximum of solar cycle 22. Since the absolute (SI) calibration of the pyrheliometric instruments will not meet the long term precision requirements for relating successive experiments, an alternative measurement strategy is required to relate the results of ACRIM I, ACRIM II, and other solar monitoring experiments with high precision.
A solar monitoring strategy for the 1983-1991 period has been devised to minimize the loss of precision in the total irradiance database during the last half of solar cycle 21 and the first part of cycle 22. The NASA components of it are comprised of a combination of satellite solar monitors (SMM/ACRIMI: 1980-1988 and UARS/ACRIM II: 1990-?) and shorter, annual solar irradiance flight experiments using Active Cavity Radiometer experiments developed for sounding rockets (1983-1985) and the Space Transportation System (Spacelab 1 (1983), Earth Observa- tion Missions (EOM's): 1985-1991 or beyond). ESA contributions to the strategy are total (IRMB CROM) and CNRS spectral irradiance experiments on the STS based Spacelab 1 Mission (1983) which will be reflown on the EOM's, a PMO experiment on balloons and the NASA sounding rocket flights and a combination of these on the proposed EURECA STS-launched platform.
Long term satellite monitoring experiments are required to provide a solar variability record with the sampling frequency, continuity and precision required by solar physics
MEASUREMENTS OF SOLAR TOTAL IRRADIANCE AND ITS VARIABILITY 237
and weather/climate studies. The short term irradiance experiments have the dual role of providing independent calibrations of the long term performance of the satellite solar monitors, and serving as intermediary experiments, linking successive, but non- overlapping satellite experiments with better precision than possible from absolute accuracy alone.
The objective of the ACRIM I experiment in the extended and repaired SMM is to sustain the solar irradiance database as far into the late 1980's as possible. As a precaution against its failure, it has been compared with sounding rocket solar irradiance experiments in 1980 and 1983 and will be compared with them again in 1984 and 1985.
Two total solar irradiance experiments, a JPL ACR and the IRMB CROM, were flown on the Spacelab 1 Mission in 1983, during which near real time in-flight com- parisons were made between them and the SMM/ACRIM I, and ACR and PMO rocket experiments. The rocket experiments will be reflown in 1984 and 1985. The last in the series of rocket experiments will provide another in-flight comparison with the ACR and CROM shuttle experiments in their first reflight on the Earth Observation Mission (EOM 1) in 1985. Thereafter the space shuttle experiments will be reflown on an annual basis, supplanting the rocket experiment as the provider of annual calibration and references for ACRIM I, ACRIM II and other satellite solar monitoring experiments as they are deployed.
11.3. S O L A R S P E C T R A L I R R A D I A N C E M O N I T O R I N G
There are no present plans to deploy a near-UV to mid-IR solar spectral irradiance monitoring experiment. The long lead times required to develop such experiments will probably defer spectral irradiance monitoring until after the maximum of solar cycle 22.
Development of prototype spectral irradiance monitoring experiments is planned during the 1980's with flight testing on the EOM's in the latter part of the decade and eventual deployment with satellite solar monitors in the 1990's. The EOM proto- types, along with the existing CNRS shuttle spectrometer, could later be used to provide annual calibration and reference observations for solar monitoring spectro- meters.
11.4. A D V A N C I N G T H E S T A T E O F T H E A R T I N P Y R H E L I O M E T R Y
Another important science objective of the EOM solar experiments will be to provide an optimum environment for comparisons of pyrheliometric instrumentation, since pyrheliometers define the radiation scale by their operation and there are no other standards to refer to, comparisons of different implementations of pyrheliometric principles are essential to understanding the state of the art. If the solar irradiance measurements by pyrheliometers of different design agree to within their bounds of mutual theoretical uncertainty, it is good evidence of the capability of the technology. If they don't agree within these limits, the comparisons should provide an empirical

238 RICHARD C. WILLSON
means of improving their design or theory. More accurate solar detectors and definition of the radiation scale have resulted from comparisons in the past.
The shuttle missions are ideal for such comparisons, removing the atmospheric variability that has provided an ultimate limit for ground based experiments to the present + 0.3 ~ . The EOM's will provide sufficient observational time for comparisons yet the week-long missions should not cause significant instrument degradation. The ability to test the flight instruments before and after each EOM will allow precise evaluation of the results from the flights.
The objective of improving the pyrheliometric state of the art is to develop experiments capable of sustaining the required long term precision of the solar database with their accuracy alone. This would eliminate the need to rely on implementation of a complex measurement strategy, the failure of any of whose links could cause a catastrophic loss of traceability for many years of the database.
11.5 . S U M M A R Y OF SOLAR IRRADIANCE M O N I T O R I N G REQUIREMENTS
The long term precision of the solar irradiance data base will determine the threshold for detection of trends in solar output that may be of consequence to life on Earth, and for solar variability that may provide new insights into the physics of the Sun and other stars. A measurement program that provides the optimum interim solar record, within the constraints of the experimental opportunities available during the 1980's, and the best solar irradiance record for the future can be summarized as follows:
(1) Continuous satellite based monitoring when possible. Continuous solar irradiance monitoring from satellite experiments is required to
provide the time resolution required to resolve the significant variable solar processes already detected. The best suited satellites would be those continuously in the Sun, such as libration point satellites.
(2) In-flight comparison of satellite solar monitoring experiments with annual short term experiments on rockets and the space shuttle.
The direct intercomparison of flight experiments relates their solar irradiance results at the level of their mutual precision which is subtantially smaller than the combined SI uncertainty of successive satellite experiments. Additionally, this strategy provides annual calibrations of possible degradation of satellite solar monitors that they may not be capable of detecting themselves, increasing the precision and accuracy of their long term solar record.
(3) Pre- and post-flight comparisons and characterizations of flight and reference instruments.
Precision pre-flight comparisons of flight and reference instruments, together with characterization of their air/vacuum sensitivity differences, provides the information required to unambiguously relate the observations of past, present, and future solar irradiance experiments. The combination of pre- and post-flight testing for short term flight experiments increases the accuracy and precision of their flight results by cali- brating them for any detectable changes induced by flight operations.

MEASUREMENTS OF SOLAR TOTAL 1RRADIANCE AND ITS VARIABILITY 239
(4) Use of the most advanced pyrheliometric detector technology and its continued improvement.
The measurement requirements of both climate and solar physics require observa- tions beyond the current state of the art. Until more accurate detectors are available the possibility of a catastrophic interuption in the solar irradiance database exists.
(5) Concurrent solar spectral irradiance variability monitoring. Instrumentation for monitoring the solar spectral irradiance over the 0.4 to 4.0 #
wavelength range must be developed for determining the wavelength dependence of solar irradiance variability. This spectral range, containing more than 90~o of the total irradiance, is not presently being monitored and will not be until the 1990's. The measurement requirements for this spectral range are high radiometric precision (but not necessarily high resolution).
Acknowledgements
The author wishes to thank Prof. S.-I. Akasofu, Dr Ishtak Rasool, and Dr Hugh Hudson for their reviews, helpful comments, and creative suggestions.
References
Abbot, C.G. and Fowle, F.E.: 1908, Annals of the Astrophysical Observatory of the Smithsonian Institution, Vol. II.
Abbot, C. G., Fowle, F. E., and Aldrich, L. B: 1922, in Annals of the Astrophysical Observatory of the Smithsonian Institution, Vol. IV, p. 15.
Bruning, D.H. and Labonte, B.J.: 1982, Bull. Am. Astron. Soc. 13, 858. Brusa, R.W. and Fr6hlich, C.: 1972, 'Entwicklung eines neuen absolutradiometers', Technical Note 1,
World Radiation Center, Davos, Switzerland. Brusa, R. W.: 1983, 'Solar Radiometry', Thesis, Pub. No. 598, PMOD World Radiation Center, Davos,
Switzerland. Brusa, R. and Fr6hlich, C: 1975, Scientific Discussions IPC IV, World Radiation Center, Davos, Switzerland.
Brusa, R. and Frfhlich, C.: 1981 Solar Variation and Its Variation in Time, Proc. of IAMAP 3rd Scientific Assembly, Hamburg, F.R.G.
Chapman, G.A.: 1980, Astrophys. J. Letters 242, 45. Chapman, G.A.: 1983, 'On the Energy Balance of Solar Active Regions', accepted by Nature. Chapman, G. A. and Klabunde, D.P.: 1982, Astrophys. J. 261, 387. Claverie, A., Isaak, G. R., McLeod, C. P., Van der Raay, H. B., and Cortes, T. R.: 1981a, Solar Phys. 74,
51. Claverie, A., lsaak, G. R., and McLeod, C. P.: 1981b, Solar Phys. 74, 73. Crommelynck, D.: 1973, 'Instrumentation Theory of Absolute Radiometry', Publication Series A, No. 81,
Royal Meteorological Institute of Belgium, Brussels, Belgium. Crommelynck, D.A.: 1981a, Solar Phys. 74, 509. Crommelynck, D.A.: 1981b, Fundamentals of Absolute Pyrheliometry and Objective Characterization, Notes
Techniques No. 46, Royal Meteorological Institute of Belgium. Drummond, A.J., Hickey, J. R., Scholes, W.J., and Laue, E. G.: 1967, J. Spacecraft Rockets 4, 1200. Duncan, C. H.: 1981, in S. Sofia (ed.), A Summary of Results from Solar Monitoring Rocket Flights, NASA
Conference Publ. No. 2191, S. Sofia, NASA Goddard Spaceflight Center, Greenbelt, M., November, 1980, p. 45.
Duncan, C.H., Harrison, R.G., Hickey, J.R., Kendall, J.M. Sr., Thekaekara, M.P., Willson, R.C.: 1977, Appl. Opt. 16, 2690.
240 RICHARD C. WILLSON
Eddy, J. A., Hoyt, D. V., White, O. R.: 1982a, Reconstructed Values of the Solar Constant from 1874 to the Present, Collection of extended abstracts presented at The Symposium on the Solar Constant and the Spectral Distribution of Solar Irradiance, IAMAP 3rd Scientific Assembly, 17-28 August, 1981, Hamburg, F.R.G,
Eddy, J. A., Gilliand, R. L., and Hoyt. D.V.: 1982b Nature 300, 689. Foukal, P. and Vernazza, J.: 1979, Astrophys. J. 215, 952. Foukal, P., Livshits, M., Fowler, L., and Hickey, J.: 1982, 'Nimbus-7 Observations of Solar Irradiance
and a Thermal Model of Sunspot Influence on Solar Luminosity', Science, in press. Fr6hlich, C.: 1973, 'The Relation between the IPS (56) Now in Use, the Smithsonian 1913 Scale, the
Angstrom (1905) Scale and the Absolute Scale, Proceedings of the Symposium on Solar Radiation Measurements and Instrumentation, Smithsonian Institution, Washington, D. C., p. 61.
Fr6hlich, C.: i977, in O. R. White (ed.), Solar Output and lts Variation, Univ. of Colorado Press, Boulder, Colo., p. 73.
Fr6hlich, C.: 1981a, Pyrheliometer comparisons 1980 - Results and Symposium, Working report No. 94, Physical Meteorological Observatory at Davos, Davos, Switzerland.
Fr6hlich, C. and Brusa, R.W.: 1981b, Solar Phys. 74, 209. Fr6hlich, C.: 1982, Radiometry of Solar Irradiance Variations over Long Time Scales, 18th General Assembly
of the International Astronomical Union, Patras, Greece, August, 1982. Fr6hlich, C. and Wehrli, C.: 1982, Short Term variationof the Solar Spectrum, Extended abstracts, Symposium
on the solar constant and the spectral distribution of solar irradiance, IAMAP 3rd Scientific Assembly, Hamburg, F.R.G., August, 1981.
Fr6hlich, C., Geist, J., Marchgraber, R. M., and Kendall, J. M. Sr.: 1973, Solar Energy 14, 157. Geist, J.:1972, 'Fundamental principles of Absolute Radiometry and the Philosophy of this NB S Program
(1968-1971)', Technical Note 591-1, National Bureau of Standards, Gaithersburgh, Md., U.S.A. Gough, D. O.: 1982, Nature 298, 334. Haley, F.: 1964, 'A Rapid Response Blackbody Cavity Radiometer', JPLNew Technology Report
30-521, Jet Propulsion Laboratory, Pasadena, Calif., U.S.A. Hickey, J.R.: 1979, Private communication. Hickey, J. R.: 1981b, Private communication, September 8, 1981. Hickey, J.R.: 1983, Results from Nimbus 7 ERB Solar Observations, Workshop on Solar Variability on
Active Region Timescales, Calif. Inst. of Technology, June 20-21, 1983. Hickey, J. R. and Griffin, F. J.: 1978, Solar Radiation Measurements from NIMBUS 6, American Meteoro-
logical Society's Third Conference on Radiation, Fort Collins, Colo., U.S.A. Hickey, J. R. and Karoli, A. R.: 1974, Appl. Opt. 13, 523. Hickey, J. R., Karoli, A. R., HiUeary, D. T., and Howell, H. B.: 1976, 'The extraterrestrial Solar Irradiance
Measurements from the Nimbus-6 Satellite', Proc. Meeting of Solar Energy Soc. of Canada, Winnipeg, p. 329.
Hickey, J. R., Griffin, F. J., and Howell, H. B.: 1977, 'Two Years of Solar Measurements from the Nimbus-6 Satellite', Proc. lntl. Solar Energy Soc. Solar World Conf., Orlando, Fla., Vol., p. 14.
Hickey, J. R., Stowe, L. L., Jacobowitz, H., Pellegrino, P., Maschoff, R. H., House, F., and Vonder Haar, T.H.: 1980, Science 208, 281.
Hickey, J. R., Alton, B. M., Griffin, F. J., Jacobowitz, H., Pellegrino, P., Smith, E. A., and Vonder Haar, T.H.: 1981, Solar Variability Indications from Nimbus 7 Satellite Data, in S. Sofia (ed.), NASA Con- ference Proceeding 2191, Variations of the Solar Constant, NASA Goddard Spaceflight Center, Greenbelt, MD.
Hickey, J. R., Alton, B.M., Griffin, F.J., Jacobowitz, H., Peltegrino, P., Smith, E.A., Vonder Haar, T. H., and Maschoff, R. H.: 1982, J. Solar Energy 29, 125.
Hirayama, T.: 1982, 'On the global energy balance of solar facular regions', Proc. of Hinitori Symposium, Tokyo, ISAS, p. 105.
Hirayama, T. and Moriyama, F.: 1979, Solar Phys. 63, 251. Hoyt, D.V.: 1979, Rev. Geophys. Space Phys. 17, 427. Hoyt, D. and Eddy, J.: 1982, An Atlas of Variations in the Solar Constant Caused Sunspot Blocking and
Facular Emissions from 1874 to 1981, National Center for Atmospheric Research Tech. Note - 194+ STR.
Hudson, H. S., Silva, S., Woodard, M., and Willson, R. C.: 1982a, Solar Phys. 76, 211. Hudson, H. S. and Willson, R. C.: 1982b, 'Sunspots and Solar Variability', in L. Cram and J. Thomas

MEASUREMENTS OF SOLAR TOTAL IRRADIANCE AND ITS VARIABILITY 241
(eds.), The Physics of Sunspots, Proc. Conference on Sunspots, Sacramento Peak Observatory, Sunspot, Ariz., U.S.A.
Jacobowitz, H., Smith, W. L., Howell, H. B., Nagle, F. W.: 1979, J. Arm. Sci. 36, 501. Kendall, J. M., Sr.: 1968, 'The JPL Standard Total Radiation Absolute Radiometer', Technical Report
32-1263, Jet Propulsion Laboratory, Pasadena, Calif., U.S.A. Kendall, J. M. S r.: 1969, 'Primary Absolute Cavity Radiometer, Technical Report 32-1396, Jet Propulsion
Laboratory, Pasadena, Calif., U.S.A. Kendall, J. M. Sr.: 1973, 'Factors Affecting Accuracy of Radiometer Measurements of Solar Irradiance
and Results of a Measurement of the Solar Constant', Proc. of Solar Radiation Symposium, Smithsonian Institution, Rockville, Md., p. 190.
Kendall, J. M. Sr. and Berdahl, M.: 1970, J. Appl. Opt. 9, 1082. Kondratyev, K. Ya. and Nikolsky, G.A.: 1970, Quart. J. Roy. Meteorol. Soc. 96, 509. Kosters, J. J. and Murcray, D. G.: 1981, in S. Sofia (ed.), Change in the Solar Constant between 1968 and
1978, NASA Conference Publication 2191, NASA Goddard Spaceflight Center, Greenbelt, Md., November 1980.
Murcray, D. G., Kosters, J. S., Kyle, T. G., and Gast, P. R.: 1969, Tellus XXI, 620. Newkirk, G. Jr.: 1983, Ann. Rev. Astron. Astrophys. 21, 382. Nikolsky, G. A.: 1978, Solar Constant Measurements from Balloons, US-USSR Bilateral Meeting on Solar
Radiation Measurements, Main Geophysical Observatory, Leningrad, U.S.S.R. Oster, L. F., Schatten, K. H., and Sofia, S.: 1982, Astrophys. J. 256, 768. Plamondon, J. A.: 1969, TCFM Solar Observations on Mariner 69, JPL Space Programs Summary, Vol. 3,
p. 162, Jet Propulsion Laboratory, Pasadena, Calif., U.S.A. Plamondon, J. A. and Kendall, J. M. Sr.: 1965, A Cavity-Type, Absolute Total Radiation Radiometer, Space
Programs Summary 37-35, Vol. IV, Jet Propulsion Laboratory, Pasadena, Calif., U.S.A. Quinn, T. and Martin, J.: 1982, in Temperature, Its Measurement and Control in Science and Industry,
American Institute of Physics, New York, Vol. 5, p. 169. Severny, A. B., Kotov, V. A., and Tsap, T.T.: 1976, Nature 259, 87. Severny, A. B., Kotov, V. A., and Tsap, T.T.: 1976, Solar Phys. 74, 65. Smith, W. L., Hilleary, D. T., Howell, H. B., Jacobowitz, H., Hickey, J. R., and Drummond, A. J.: 1977,
J. Appl. Opt, 16, 306. Smith, E.A., Hickey, J. R., and Vonder Haar, T.H.: 1981, The Nature of Short Period Fluctuations in
Solar Irradiance Observed by the Nimbus 7 Satellite, IAMAP 3rd scientific assembly, Hamburg, F.R.G. Sofia, S., Oster, L., and Schatten, K.: 1982, Solar Phys. 80, 87. Spruit, H.: 1977, Solar Phys. 55, 3. Sydnor, C. L.: 1970, 'A Numerical Study of Cavity Radiometer Emissivities', Technical Report 32-1463,
Jet Propulsion Laboratory, Pasadena, Calif., U.S.A. Thekaekara, M. P., Kruger, R., and Duncan, C, H.: 1969, J. AppL Opt. 8, 1713. Vonder Haar, T.H., Campbell, G.G., Smith, E.A., Arking, A., Coulson, K., Hickey, J., House, F.,
Ingersoll, A., Jacobowitz, H., Smith, L., and Stowe, L.: 1981, Adv. Space Res. (COSPAR) 1, 285. Willson, R. C.: 1967, 'Radiometer Comparison Tests', JPL Technical Memorandum 33-371, Jet Propulsion
Laboratory, Pasadena, Calif., U.S.A. Willson, R.C.: 1969, 'Experimental and Theoretical Comparison of the JPL Active Cavity Radiometric
Scale and the International Pyrheliometric Scale, Technical Report 32-1365, Jet Propulsion Laboratory, Pasadena, Calif., U.S.A.
Willson, R. C.: 1971a, J. Geoph. Res. 76, 4325. Willson, R.C.: 1971b, 'Radiometer Comparison Tests', Report 900-446, Jet Propulsion Laboratory,
Pasadena, Calif., U.S.A. Willson, R. C.: 1972a, 'Results of the 1972 Table Mountain Radiometer and Radiation Scale Comparisons',
Informal report, Jet Propulsion Laboratory, Pasadena, Calif., U.S.A. Willson, R.C.: 1972b, Nature 239, 208. Willson, R.C.: 1973a, Jr. Appl. Opt. 12, 810. Willson, R.C.: 1973b, J. Solar Energy 14, 203. Willson, R. C.: 1975, 'Instrumentation for Measurements of Solar Irradiance and Atmospheric Optical
Properties', Proc. Soc. Photo-Optical Instrumentation Engineers, San Diego, Calif., U.S.A., p. 31. Willson, R.C.: 1979, J. AppL Opt. 18, 179.

242 RICHARD C. WILLSON
Willson, R. C.: 1980a, J. Appl. Opt. 19, 3256. Willson, R.C.: 1980b, Solar Irradiance Observations from the SMM/ACRIM Experiment, American
Geophysical Union, Toronto, Canada, May, 1980. Willson, R. C.: 1980c, 'Solar Irradiance Variations', XIV ESLAB Symposium on Physics of Solar Variations,
Scheveningen, The Netherlands, September, 1980. Willson, R. C.: 1980d, 'Satellite Observations of Solar Irradiance Variability', 5th International Pyrheliometer
Comparisons Symposium, World Radiation Center, Physical Meteorological Observatory, Davos, Switzerland, (published in Working Report No. 94, Swiss Meteorological Institute, Zt~rich, 1981).
Willson, R. C.: 1981a, Solar Phys. 74, 218. Willson, R.C.: 1981b, 'Observation of Solar Irradiance Variations in Balloon, Rocket, and Satellite
Experiments', Proc. of lAMAP 3rd Scientific Assembly, Hamburg, F.R.G., August, 1981. Willson, R. C.: 1982, J. Geophys. Res. 86, 4319. Willson, R. C.: 1983, 'Solar Irradiance Variability from 1980-1983', in press. Willson, R.C. and Hickey, J.R., 1977, '1976 Rocket Measurements of the Solar Constant and Their
Implications for Variation in the Solar Output in cycle 20', in O. R. White (ed.), The Solar Output and Its Variation, Colorado Associated University Press, Boulder, Colo,, U.S.A.
Willson, R. C. and Hudson, H. S.: 1981, Astrophys. J, Letters 24, 185. Willson, R. C., Duncan, C. H. and Geist, J.: 1980, Science 207, 177. WiUson, R. C., Gulkis, S., Janssen, M., Hudson, H.S., and Chapman, G.A.: 1981, Science 211,700. Woodard, M. and Hudson, H.: 1983a, Solar Phys. 82, 67. Woodard, M. and Hudson, H.: 1983b, Nature 305, 589.