measurements of soil deformation by means of …
TRANSCRIPT
397
i) Laboratoire Central des Ponts et Chauss áees, Paris, France (refsteck@lcpc.fr).ii) LGC CUST, Clermont Ferrand, France.iii) Lankelma, Oirschot, The Netherlands.
The manuscript for this paper was received for review on August 30, 2007; approved on March 26, 2009.Written discussions on this paper should be submitted before January 1, 2010 to the Japanese Geotechnical Society, 4-38-2, Sengoku,Bunkyo-ku, Tokyo 112-0011, Japan. Upon request the closing date may be extended one month.
397
SOILS AND FOUNDATIONS Vol. 49, No. 3, 397–408, June 2009Japanese Geotechnical Society
MEASUREMENTS OF SOIL DEFORMATION BYMEANS OF CONE PENETROMETER
PH. REIFFSTECKi), L. THORELi), C. BACCONNETii), R. GOURV ÀESii) and H. C. van de GRAAFiii)
ABSTRACT
Measurement of the settlement of a cone submitted to incremental loading allows the determination of a moduluscorrelated to those obtained using laboratory tests or derived from other in situ tests. This test can be carried out withstandard static penetrometer equipment. After stopping the penetration of a static penetrometer cone at a selecteddepth, an incremental loading test is carried out until the failure of the ground under the cone is observed. Stress strainrelationships can be drawn from cone resistance and sleeve friction. In this manner, a modulus and a friction angle canbe obtained. Thus the classical CPT log is enriched oŠering new possibilities. In this paper the development of the ˆrstprototype and measuring devices and the proposed testing procedure are presented. A comparison of laboratory andˆeld tests and geotechnical centrifuge models shows the validity of the testing procedure and the chosen interpretationmethod. The results of site investigations carried out on French national experimental sites are also discussed and com-pared with high quality borehole expansion test and ˆeld measurement of shear wave velocity. These investigationshave been carried out using this new testing method in combination with a semi-heavy static Piezocone penetrometer inorder to check the potential use for geotechnical design. An attempt is made in this paper to validate the interpretationmethod of the results, which can be used for routine geotechnical engineering.
Key words: CPT, incremental loading test, in situ testing, modulus, penetrometer, stiŠness, Piezocone (IGC: C3/D6)
INTRODUCTION
The static cone penetration test is widely used in geo-technical engineering, because the results obtained are ofhigh quality and readily usable by engineers in day-to-daypractice. This quality is due to the development ofsophisticated measurement devices located in the coneand enrichment of the interpretation methods (Sangleratet al., 1974; Robertson, 1990; Fellenius and Eslami, 2000;Chen and Juang, 1996). However, this test provides onlycontinuous proˆles of point resistance, sleeve friction andpore pressures from which it is not possible to obtain di-rectly a stress-strain modulus. On the other handknowledge of an elastic modulus of the ground is moreoften required for geotechnical design. This last point ex-plains the interest of engineers on cone testing associatedwith other techniques (seismic-cone, full displacementpressuremeter test, etc.), which provide simultaneously acontinuous proˆle of the strength properties of theground and speciˆc measurements of deformation modu-lus (Mayne et al., 1995). Contrary to laboratory tests(Oedometer, triaxial), and borehole expansion tests (Pre-bored pressuremeter, self-boring pressuremeter), the fulltechnical potential oŠered by the static penetrometer hasnot been explored during these last decades. The eŠorts
were mainly focused on deriving parameters from theresults of the cone penetration test using approach likebearing capacity theory, cavity expansion theory andothers as reported by Yu and Mitchell (1998). As a matterof fact, the static penetration test is used to providestrength parameters rather than deformabilityparameters.
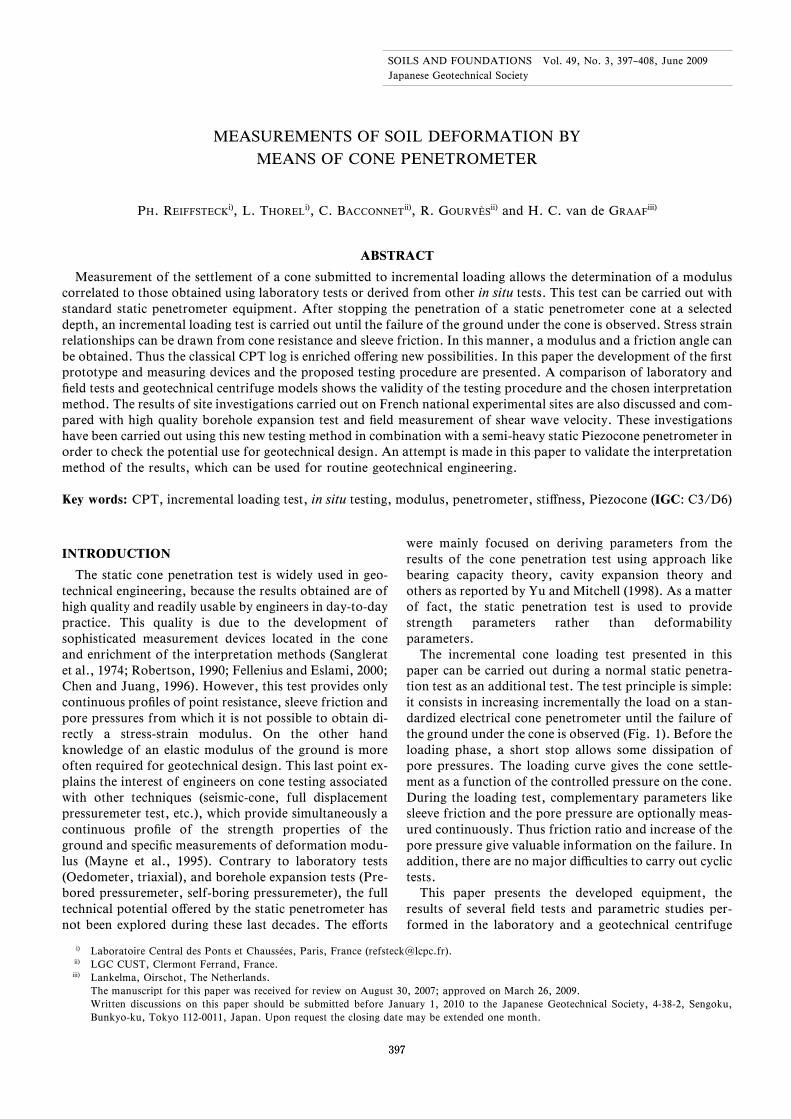
The incremental cone loading test presented in thispaper can be carried out during a normal static penetra-tion test as an additional test. The test principle is simple:it consists in increasing incrementally the load on a stan-dardized electrical cone penetrometer until the failure ofthe ground under the cone is observed (Fig. 1). Before theloading phase, a short stop allows some dissipation ofpore pressures. The loading curve gives the cone settle-ment as a function of the controlled pressure on the cone.During the loading test, complementary parameters likesleeve friction and the pore pressure are optionally meas-ured continuously. Thus friction ratio and increase of thepore pressure give valuable information on the failure. Inaddition, there are no major di‹culties to carry out cyclictests.
This paper presents the developed equipment, theresults of several ˆeld tests and parametric studies per-formed in the laboratory and a geotechnical centrifuge
398
Fig. 1. Principle of the cone loading test
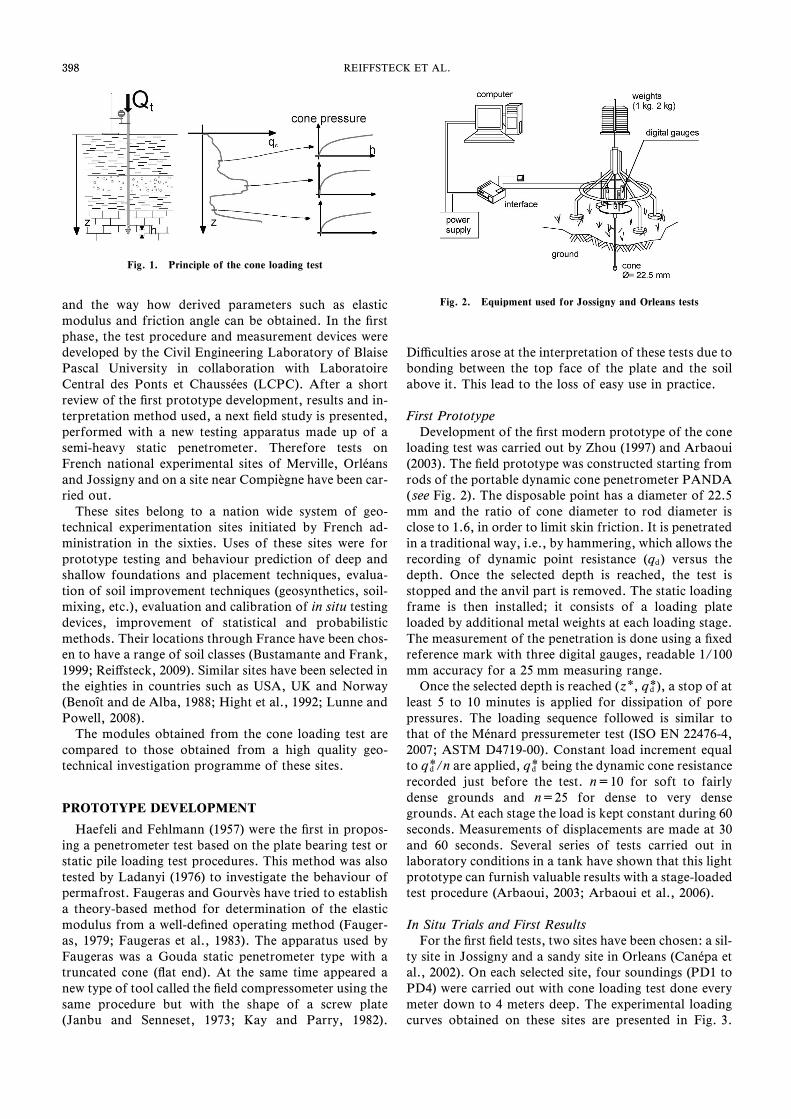
Fig. 2. Equipment used for Jossigny and Orleans tests
398 REIFFSTECK ET AL.
and the way how derived parameters such as elasticmodulus and friction angle can be obtained. In the ˆrstphase, the test procedure and measurement devices weredeveloped by the Civil Engineering Laboratory of BlaisePascal University in collaboration with LaboratoireCentral des Ponts et Chauss áees (LCPC). After a shortreview of the ˆrst prototype development, results and in-terpretation method used, a next ˆeld study is presented,performed with a new testing apparatus made up of asemi-heavy static penetrometer. Therefore tests onFrench national experimental sites of Merville, Orl áeansand Jossigny and on a site near Compi àegne have been car-ried out.
These sites belong to a nation wide system of geo-technical experimentation sites initiated by French ad-ministration in the sixties. Uses of these sites were forprototype testing and behaviour prediction of deep andshallow foundations and placement techniques, evalua-tion of soil improvement techniques (geosynthetics, soil-mixing, etc.), evaluation and calibration of in situ testingdevices, improvement of statistical and probabilisticmethods. Their locations through France have been chos-en to have a range of soil classes (Bustamante and Frank,1999; ReiŠsteck, 2009). Similar sites have been selected inthe eighties in countries such as USA, UK and Norway(Benoâƒt and de Alba, 1988; Hight et al., 1992; Lunne andPowell, 2008).
The modules obtained from the cone loading test arecompared to those obtained from a high quality geo-technical investigation programme of these sites.
PROTOTYPE DEVELOPMENT
Haefeli and Fehlmann (1957) were the ˆrst in propos-ing a penetrometer test based on the plate bearing test orstatic pile loading test procedures. This method was alsotested by Ladanyi (1976) to investigate the behaviour ofpermafrost. Faugeras and Gourv àes have tried to establisha theory-based method for determination of the elasticmodulus from a well-deˆned operating method (Fauger-as, 1979; Faugeras et al., 1983). The apparatus used byFaugeras was a Gouda static penetrometer type with atruncated cone (‰at end). At the same time appeared anew type of tool called the ˆeld compressometer using thesame procedure but with the shape of a screw plate(Janbu and Senneset, 1973; Kay and Parry, 1982).
Di‹culties arose at the interpretation of these tests due tobonding between the top face of the plate and the soilabove it. This lead to the loss of easy use in practice.
First PrototypeDevelopment of the ˆrst modern prototype of the cone
loading test was carried out by Zhou (1997) and Arbaoui(2003). The ˆeld prototype was constructed starting fromrods of the portable dynamic cone penetrometer PANDA( see Fig. 2). The disposable point has a diameter of 22.5mm and the ratio of cone diameter to rod diameter isclose to 1.6, in order to limit skin friction. It is penetratedin a traditional way, i.e., by hammering, which allows therecording of dynamic point resistance (qd) versus thedepth. Once the selected depth is reached, the test isstopped and the anvil part is removed. The static loadingframe is then installed; it consists of a loading plateloaded by additional metal weights at each loading stage.The measurement of the penetration is done using a ˆxedreference mark with three digital gauges, readable 1/100mm accuracy for a 25 mm measuring range.
Once the selected depth is reached (z*, qd*), a stop of atleast 5 to 10 minutes is applied for dissipation of porepressures. The loading sequence followed is similar tothat of the M áenard pressuremeter test (ISO EN 22476-4,2007; ASTM D4719-00). Constant load increment equalto qd*/n are applied, qd* being the dynamic cone resistancerecorded just before the test. n=10 for soft to fairlydense grounds and n=25 for dense to very densegrounds. At each stage the load is kept constant during 60seconds. Measurements of displacements are made at 30and 60 seconds. Several series of tests carried out inlaboratory conditions in a tank have shown that this lightprototype can furnish valuable results with a stage-loadedtest procedure (Arbaoui, 2003; Arbaoui et al., 2006).
In Situ Trials and First ResultsFor the ˆrst ˆeld tests, two sites have been chosen: a sil-
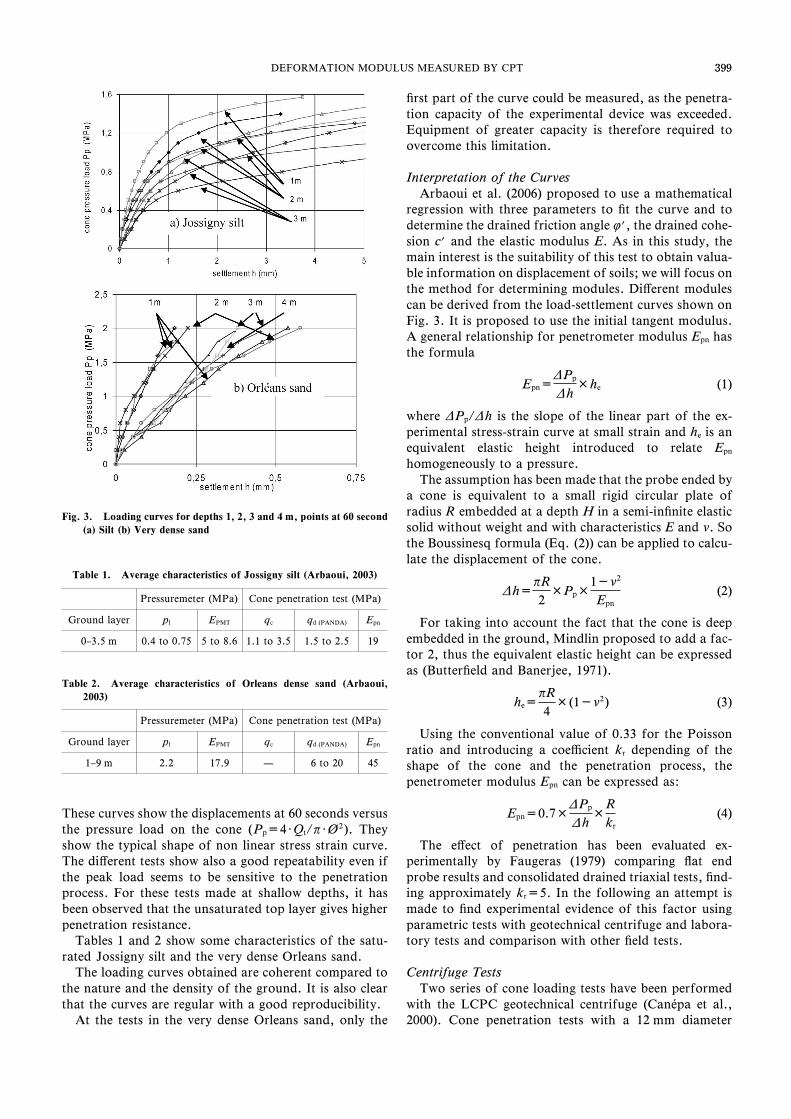
ty site in Jossigny and a sandy site in Orleans (Can áepa etal., 2002). On each selected site, four soundings (PD1 toPD4) were carried out with cone loading test done everymeter down to 4 meters deep. The experimental loadingcurves obtained on these sites are presented in Fig. 3.
399
Fig. 3. Loading curves for depths 1, 2, 3 and 4 m, points at 60 second(a) Silt (b) Very dense sand
Table 1. Average characteristics of Jossigny silt (Arbaoui, 2003)
Pressuremeter (MPa) Cone penetration test (MPa)
Ground layer pl EPMT qc qd (PANDA) Epn
0–3.5 m 0.4 to 0.75 5 to 8.6 1.1 to 3.5 1.5 to 2.5 19
Table 2. Average characteristics of Orleans dense sand (Arbaoui,2003)
Pressuremeter (MPa) Cone penetration test (MPa)
Ground layer pl EPMT qc qd (PANDA) Epn
1–9 m 2.2 17.9 — 6 to 20 45
399DEFORMATION MODULUS MEASURED BY CPT
These curves show the displacements at 60 seconds versusthe pressure load on the cone (Pp=4・Qt/p・Ø2). Theyshow the typical shape of non linear stress strain curve.The diŠerent tests show also a good repeatability even ifthe peak load seems to be sensitive to the penetrationprocess. For these tests made at shallow depths, it hasbeen observed that the unsaturated top layer gives higherpenetration resistance.
Tables 1 and 2 show some characteristics of the satu-rated Jossigny silt and the very dense Orleans sand.
The loading curves obtained are coherent compared tothe nature and the density of the ground. It is also clearthat the curves are regular with a good reproducibility.
At the tests in the very dense Orleans sand, only the
ˆrst part of the curve could be measured, as the penetra-tion capacity of the experimental device was exceeded.Equipment of greater capacity is therefore required toovercome this limitation.
Interpretation of the CurvesArbaoui et al. (2006) proposed to use a mathematical
regression with three parameters to ˆt the curve and todetermine the drained friction angle f?, the drained cohe-sion c? and the elastic modulus E. As in this study, themain interest is the suitability of this test to obtain valua-ble information on displacement of soils; we will focus onthe method for determining modules. DiŠerent modulescan be derived from the load-settlement curves shown onFig. 3. It is proposed to use the initial tangent modulus.A general relationship for penetrometer modulus Epn hasthe formula
Epn=DPp
Dh×he (1)
where DPp/Dh is the slope of the linear part of the ex-perimental stress-strain curve at small strain and he is anequivalent elastic height introduced to relate Epn
homogeneously to a pressure.The assumption has been made that the probe ended by
a cone is equivalent to a small rigid circular plate ofradius R embedded at a depth H in a semi-inˆnite elasticsolid without weight and with characteristics E and n. Sothe Boussinesq formula (Eq. (2)) can be applied to calcu-late the displacement of the cone.
Dh=pR2×Pp×
1-n2
Epn(2)
For taking into account the fact that the cone is deepembedded in the ground, Mindlin proposed to add a fac-tor 2, thus the equivalent elastic height can be expressedas (Butterˆeld and Banerjee, 1971).
he=pR4×(1-n2) (3)
Using the conventional value of 0.33 for the Poissonratio and introducing a coe‹cient kr depending of theshape of the cone and the penetration process, thepenetrometer modulus Epn can be expressed as:
Epn=0.7×DPp
Dh×
Rkr
(4)
The eŠect of penetration has been evaluated ex-perimentally by Faugeras (1979) comparing ‰at endprobe results and consolidated drained triaxial tests, ˆnd-ing approximately kr=5. In the following an attempt ismade to ˆnd experimental evidence of this factor usingparametric tests with geotechnical centrifuge and labora-tory tests and comparison with other ˆeld tests.
Centrifuge TestsTwo series of cone loading tests have been performed
with the LCPC geotechnical centrifuge (Can áepa et al.,2000). Cone penetration tests with a 12 mm diameter
400
Fig. 4. Cone penetration test in centrifuge-Container CT2 (gd=15, 20kN/m3)
Fig. 5. Secant modulus obtained by plate loading test and reloadingmodulus of cone loading test in centrifuge-Container CT1 (gd=15,95 kN/m3)
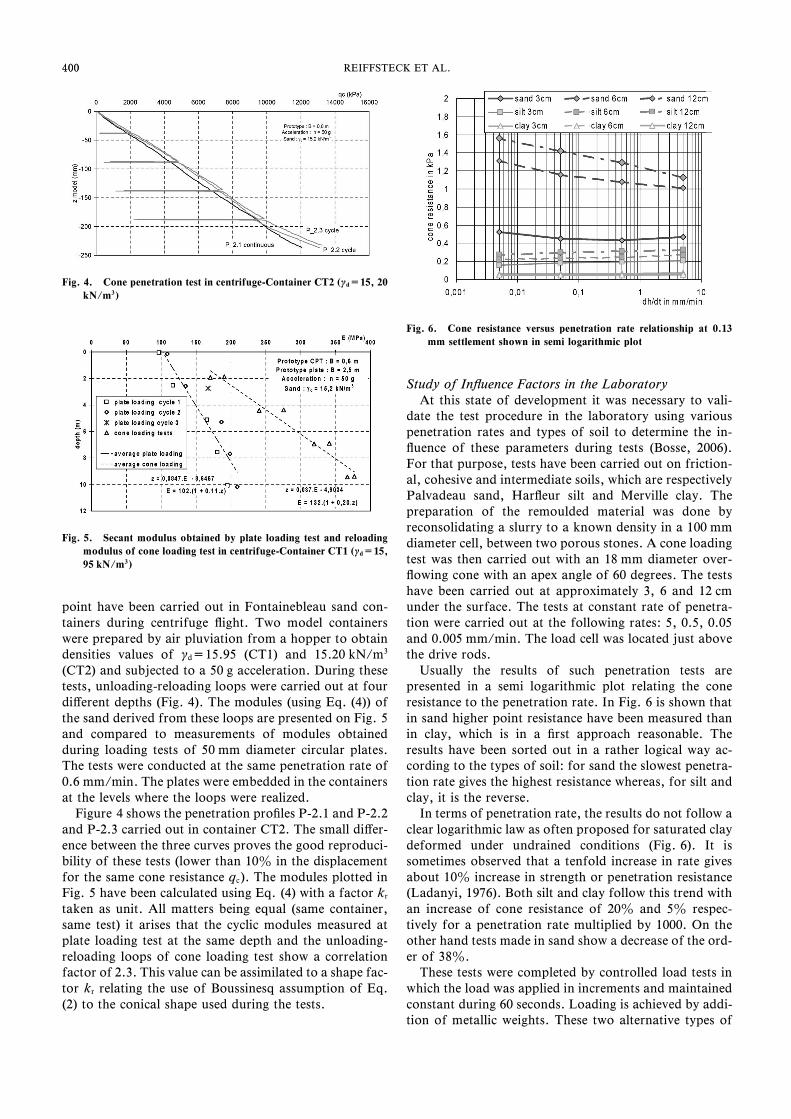
Fig. 6. Cone resistance versus penetration rate relationship at 0.13mm settlement shown in semi logarithmic plot
400 REIFFSTECK ET AL.
point have been carried out in Fontainebleau sand con-tainers during centrifuge ‰ight. Two model containerswere prepared by air pluviation from a hopper to obtaindensities values of gd=15.95 (CT1) and 15.20 kN/m3
(CT2) and subjected to a 50 g acceleration. During thesetests, unloading-reloading loops were carried out at fourdiŠerent depths (Fig. 4). The modules (using Eq. (4)) ofthe sand derived from these loops are presented on Fig. 5and compared to measurements of modules obtainedduring loading tests of 50 mm diameter circular plates.The tests were conducted at the same penetration rate of0.6 mm/min. The plates were embedded in the containersat the levels where the loops were realized.
Figure 4 shows the penetration proˆles P-2.1 and P-2.2and P-2.3 carried out in container CT2. The small diŠer-ence between the three curves proves the good reproduci-bility of these tests (lower than 10z in the displacementfor the same cone resistance qc). The modules plotted inFig. 5 have been calculated using Eq. (4) with a factor kr
taken as unit. All matters being equal (same container,same test) it arises that the cyclic modules measured atplate loading test at the same depth and the unloading-reloading loops of cone loading test show a correlationfactor of 2.3. This value can be assimilated to a shape fac-tor kr relating the use of Boussinesq assumption of Eq.(2) to the conical shape used during the tests.
Study of In‰uence Factors in the LaboratoryAt this state of development it was necessary to vali-
date the test procedure in the laboratory using variouspenetration rates and types of soil to determine the in-‰uence of these parameters during tests (Bosse, 2006).For that purpose, tests have been carried out on friction-al, cohesive and intermediate soils, which are respectivelyPalvadeau sand, Har‰eur silt and Merville clay. Thepreparation of the remoulded material was done byreconsolidating a slurry to a known density in a 100 mmdiameter cell, between two porous stones. A cone loadingtest was then carried out with an 18 mm diameter over-‰owing cone with an apex angle of 60 degrees. The testshave been carried out at approximately 3, 6 and 12 cmunder the surface. The tests at constant rate of penetra-tion were carried out at the following rates: 5, 0.5, 0.05and 0.005 mm/min. The load cell was located just abovethe drive rods.
Usually the results of such penetration tests arepresented in a semi logarithmic plot relating the coneresistance to the penetration rate. In Fig. 6 is shown thatin sand higher point resistance have been measured thanin clay, which is in a ˆrst approach reasonable. Theresults have been sorted out in a rather logical way ac-cording to the types of soil: for sand the slowest penetra-tion rate gives the highest resistance whereas, for silt andclay, it is the reverse.
In terms of penetration rate, the results do not follow aclear logarithmic law as often proposed for saturated claydeformed under undrained conditions (Fig. 6). It issometimes observed that a tenfold increase in rate givesabout 10z increase in strength or penetration resistance(Ladanyi, 1976). Both silt and clay follow this trend withan increase of cone resistance of 20z and 5z respec-tively for a penetration rate multiplied by 1000. On theother hand tests made in sand show a decrease of the ord-er of 38z.
These tests were completed by controlled load tests inwhich the load was applied in increments and maintainedconstant during 60 seconds. Loading is achieved by addi-tion of metallic weights. These two alternative types of
401
Table 3. Modules deduced from laboratory tests
Modules (MPa) sand silt clay
Oedometric 18.66 1.56 1.47
Incremental 15.00 4.41 1.02
5 mm/min 2.10 4.50 2.64
0.5 mm/min 4.14 4.40 1.45
0.05 mm/min 6.01 3.03 1.27
0.005 mm/min 6.27 2.02 0.54
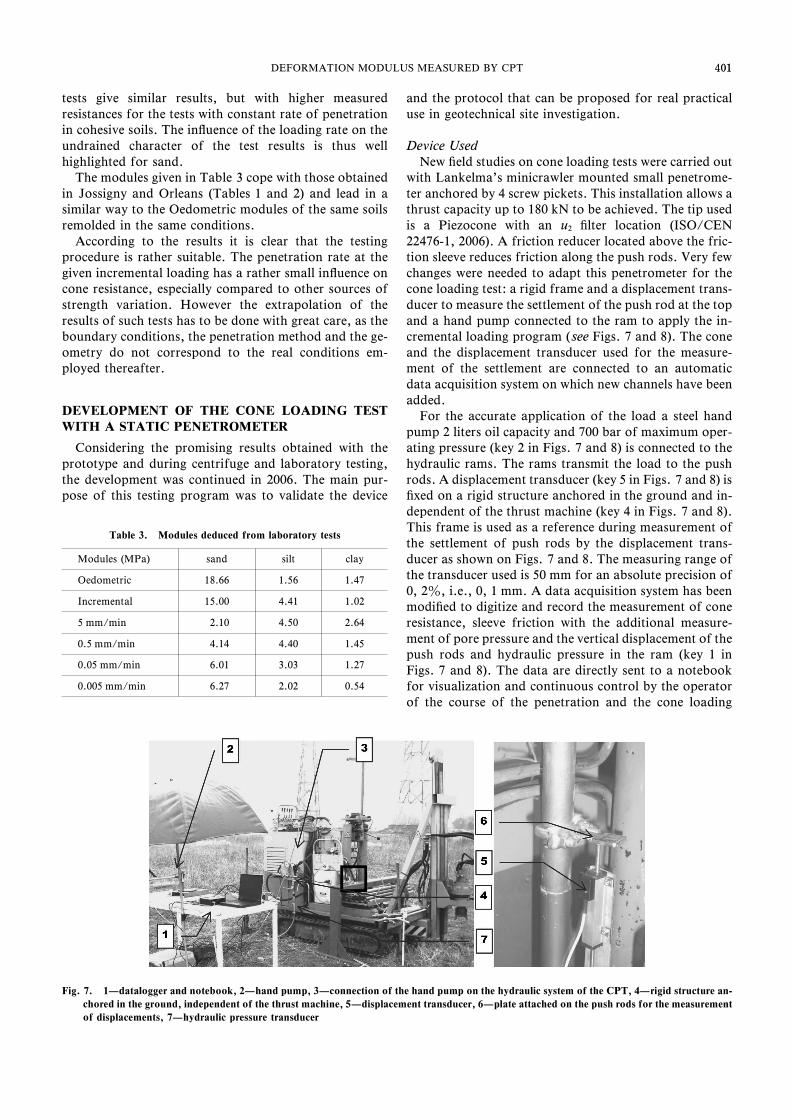
Fig. 7. 1—datalogger and notebook, 2—hand pump, 3—connection of the hand pump on the hydraulic system of the CPT, 4—rigid structure an-chored in the ground, independent of the thrust machine, 5—displacement transducer, 6—plate attached on the push rods for the measurementof displacements, 7—hydraulic pressure transducer
401DEFORMATION MODULUS MEASURED BY CPT
tests give similar results, but with higher measuredresistances for the tests with constant rate of penetrationin cohesive soils. The in‰uence of the loading rate on theundrained character of the test results is thus wellhighlighted for sand.
The modules given in Table 3 cope with those obtainedin Jossigny and Orleans (Tables 1 and 2) and lead in asimilar way to the Oedometric modules of the same soilsremolded in the same conditions.
According to the results it is clear that the testingprocedure is rather suitable. The penetration rate at thegiven incremental loading has a rather small in‰uence oncone resistance, especially compared to other sources ofstrength variation. However the extrapolation of theresults of such tests has to be done with great care, as theboundary conditions, the penetration method and the ge-ometry do not correspond to the real conditions em-ployed thereafter.
DEVELOPMENT OF THE CONE LOADING TESTWITH A STATIC PENETROMETER
Considering the promising results obtained with theprototype and during centrifuge and laboratory testing,the development was continued in 2006. The main pur-pose of this testing program was to validate the device
and the protocol that can be proposed for real practicaluse in geotechnical site investigation.
Device UsedNew ˆeld studies on cone loading tests were carried out
with Lankelma's minicrawler mounted small penetrome-ter anchored by 4 screw pickets. This installation allows athrust capacity up to 180 kN to be achieved. The tip usedis a Piezocone with an u2 ˆlter location (ISO/CEN22476-1, 2006). A friction reducer located above the fric-tion sleeve reduces friction along the push rods. Very fewchanges were needed to adapt this penetrometer for thecone loading test: a rigid frame and a displacement trans-ducer to measure the settlement of the push rod at the topand a hand pump connected to the ram to apply the in-cremental loading program ( see Figs. 7 and 8). The coneand the displacement transducer used for the measure-ment of the settlement are connected to an automaticdata acquisition system on which new channels have beenadded.
For the accurate application of the load a steel handpump 2 liters oil capacity and 700 bar of maximum oper-ating pressure (key 2 in Figs. 7 and 8) is connected to thehydraulic rams. The rams transmit the load to the pushrods. A displacement transducer (key 5 in Figs. 7 and 8) isˆxed on a rigid structure anchored in the ground and in-dependent of the thrust machine (key 4 in Figs. 7 and 8).This frame is used as a reference during measurement ofthe settlement of push rods by the displacement trans-ducer as shown on Figs. 7 and 8. The measuring range ofthe transducer used is 50 mm for an absolute precision of0, 2z, i.e., 0, 1 mm. A data acquisition system has beenmodiˆed to digitize and record the measurement of coneresistance, sleeve friction with the additional measure-ment of pore pressure and the vertical displacement of thepush rods and hydraulic pressure in the ram (key 1 inFigs. 7 and 8). The data are directly sent to a notebookfor visualization and continuous control by the operatorof the course of the penetration and the cone loading

402
Fig. 8. Schematic diagram of the test with minicrawler, 1—datalogger and notebook, 2—hand pump, 4—rigid structure anchored in the ground,independent of the thrust machine, 5—displacement transducer, 6—plate attached on the push rods for the measurement of displacements,7—hydraulic pressure transducer
Fig. 9. Location of Merville and Compi àegne sites and soil proˆles
Fig. 10. Cone penetration tests on Merville (left) and Compi àegne(right) sites
402 REIFFSTECK ET AL.
tests.
ProtocolAfter the installation of the thrust machine and the
measuring instruments, the preparation of the cone (satu-ration of the porous stone, zero reading), the cone ispushed at a constant rate of penetration of 2 cm/s whichenables to record a traditional cone penetration log. Atthe selected depth (z*, q c*), the penetration is stopped anda dissipation test is started until full dissipation or a maxi-mum of 15 minutes. The loading test starts then with anunloading up to a value ranging between the zero of conepressure and the estimated vertical stress. Then the in-cremental loading, using n stages of q c*/n. n is chosen be-tween 10 and 25. Each stage is held constant for 60 sec-onds. For good resolution measurements of displace-ment, cone pressure, pore water pressure and sleeve fric-tion are recorded every 5 seconds.
Merville and Compiegne SitesThe selected clayey site at Merville is adjacent to an old
WWII airˆeld. Merville lies within the Flandres clay zonelocated in northern France. Silts of low to medium plas-ticity occur at the test site to a depth of about 2.4 m un-derlain by a very plastic and overconsolidated clay layer(Fig. 9).
The ground conditions at the Compi àegne site are veryheterogeneous. At the locations where the penetrationtests have been carried out, there is clay with sand and siltlenses from 0 to 5.8 m, chalky coarse soil between 5.8 and8.0 m then weathered chalk between 8.0 and 21.5 m.Several cone loading tests were carried out on these sites(Godde, 2006). In Fig. 10 the point resistance proˆles ob-tained on these two sites.
ResultsThe cone pressures applied and measured during the
cone loading tests are represented versus the settlement of
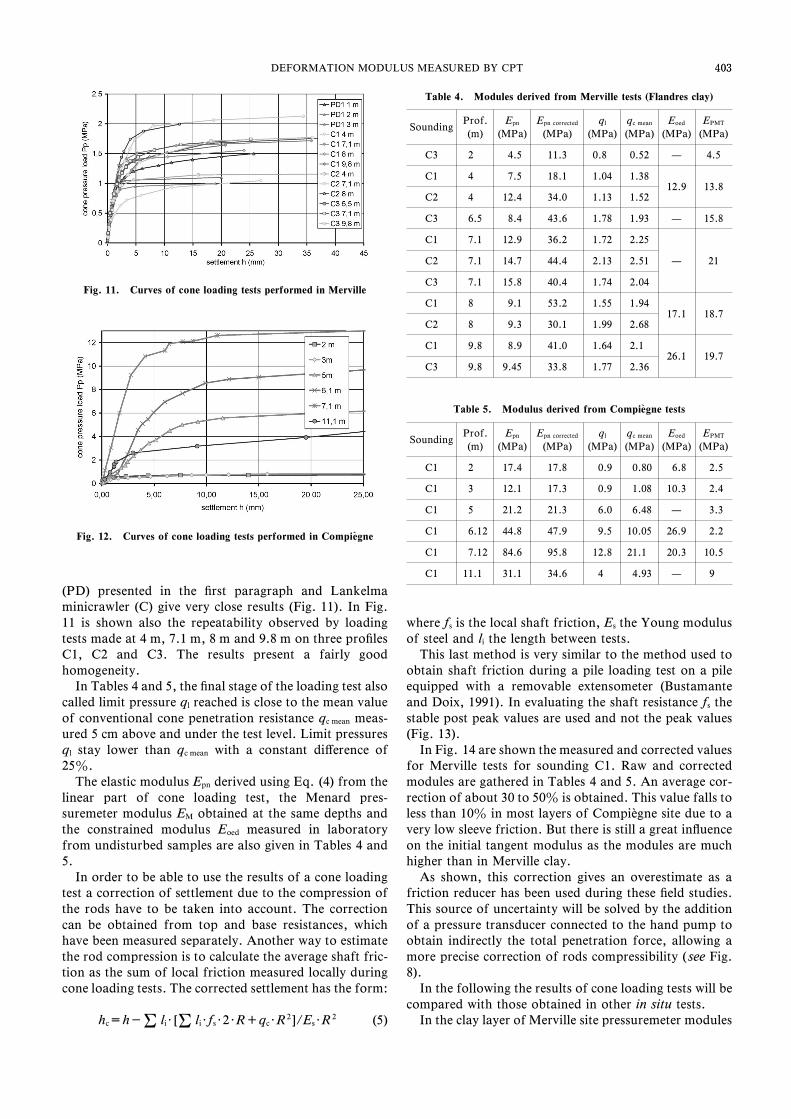
the top of the push rods (Figs. 11 and 12). The curvesconsist of a linear part at small strain level, then a curvedpart at the onset of plasticity and a linear part at higherstrain level. The curves are very regular.
Comparison of tests made with ˆrst prototype Panda
403
Fig. 11. Curves of cone loading tests performed in Merville
Fig. 12. Curves of cone loading tests performed in Compi àegne
Table 4. Modules derived from Merville tests (Flandres clay)
SoundingProf.(m)
Epn
(MPa)Epn corrected
(MPa)ql
(MPa)qc mean
(MPa)Eoed
(MPa)EPMT
(MPa)
C3 2 4.5 11.3 0.8 0.52 — 4.5
C1 4 7.5 18.1 1.04 1.3812.9 13.8
C2 4 12.4 34.0 1.13 1.52
C3 6.5 8.4 43.6 1.78 1.93 — 15.8
C1 7.1 12.9 36.2 1.72 2.25
— 21C2 7.1 14.7 44.4 2.13 2.51
C3 7.1 15.8 40.4 1.74 2.04
C1 8 9.1 53.2 1.55 1.9417.1 18.7
C2 8 9.3 30.1 1.99 2.68
C1 9.8 8.9 41.0 1.64 2.126.1 19.7
C3 9.8 9.45 33.8 1.77 2.36
Table 5. Modulus derived from Compi àegne tests
SoundingProf.(m)
Epn
(MPa)Epn corrected
(MPa)ql
(MPa)qc mean
(MPa)Eoed
(MPa)EPMT
(MPa)
C1 2 17.4 17.8 0.9 0.80 6.8 2.5
C1 3 12.1 17.3 0.9 1.08 10.3 2.4
C1 5 21.2 21.3 6.0 6.48 — 3.3
C1 6.12 44.8 47.9 9.5 10.05 26.9 2.2
C1 7.12 84.6 95.8 12.8 21.1 20.3 10.5
C1 11.1 31.1 34.6 4 4.93 — 9
403DEFORMATION MODULUS MEASURED BY CPT
(PD) presented in the ˆrst paragraph and Lankelmaminicrawler (C) give very close results (Fig. 11). In Fig.11 is shown also the repeatability observed by loadingtests made at 4 m, 7.1 m, 8 m and 9.8 m on three proˆlesC1, C2 and C3. The results present a fairly goodhomogeneity.
In Tables 4 and 5, the ˆnal stage of the loading test alsocalled limit pressure ql reached is close to the mean valueof conventional cone penetration resistance qc mean meas-ured 5 cm above and under the test level. Limit pressuresql stay lower than qc mean with a constant diŠerence of25z.
The elastic modulus Epn derived using Eq. (4) from thelinear part of cone loading test, the Menard pres-suremeter modulus EM obtained at the same depths andthe constrained modulus Eoed measured in laboratoryfrom undisturbed samples are also given in Tables 4 and5.
In order to be able to use the results of a cone loadingtest a correction of settlement due to the compression ofthe rods have to be taken into account. The correctioncan be obtained from top and base resistances, whichhave been measured separately. Another way to estimatethe rod compression is to calculate the average shaft fric-tion as the sum of local friction measured locally duringcone loading tests. The corrected settlement has the form:
hc=h-S li・[S li・fs・2・R+qc・R2]/Es・R 2 (5)
where fs is the local shaft friction, Es the Young modulusof steel and li the length between tests.
This last method is very similar to the method used toobtain shaft friction during a pile loading test on a pileequipped with a removable extensometer (Bustamanteand Doix, 1991). In evaluating the shaft resistance fs thestable post peak values are used and not the peak values(Fig. 13).
In Fig. 14 are shown the measured and corrected valuesfor Merville tests for sounding C1. Raw and correctedmodules are gathered in Tables 4 and 5. An average cor-rection of about 30 to 50z is obtained. This value falls toless than 10z in most layers of Compi àegne site due to avery low sleeve friction. But there is still a great in‰uenceon the initial tangent modulus as the modules are muchhigher than in Merville clay.
As shown, this correction gives an overestimate as afriction reducer has been used during these ˆeld studies.This source of uncertainty will be solved by the additionof a pressure transducer connected to the hand pump toobtain indirectly the total penetration force, allowing amore precise correction of rods compressibility ( see Fig.8).
In the following the results of cone loading tests will becompared with those obtained in other in situ tests.
In the clay layer of Merville site pressuremeter modules

404
Fig. 13. Measured shaft resistance during cone loading test
Fig. 14. Measured and corrected cone resistance during cone loadingtests in Merville
Fig. 15. Pressuremeter tests log on Merville (left) and Compi àegne(right) sites
404 REIFFSTECK ET AL.
EPMT increase linearly with the depth between 10 and 30MPa (Can áepa et al., 2002) (Fig. 15 and Table 4). In Fig.15 two pressuremeter proˆles of Compi àegne (see alsoTable 5) are given in addition. Both show the same trend:an EPMT around 2.5 MPa in the clayey layer and below 6m a somewhat erratic proˆle tending to increase. Thecomparison between modules obtained with Menardpressuremeter and those derived from cone loading andcorrected settlements show in the Flandres clay a ratio of2 and for Compi àegne a ratio of 6 if we reject the 6.12 mtest. The variation of this ratio observed at the Com-pi àegne sounding can partially be explained by the latechange of drilling technique employed to create the bore-hole for the pressuremeter tests at 9 m depth. Pres-suremeter modules are clearly underestimated in graveland the top of weathered chalk layers due to the use ofcontinuous ‰ight auger instead of rotary percussion.
As the M áenard pressuremeter modulus, the penetrome-ter modulus Epn is an undrained modulus that depends onsoil type and structure, stress history and drainage char-acteristics. Several correlations of such modulus derivedfrom undrained in situ test results versus the constrainedmodulus Eoed have already been published for clay show-ing reasonable accordance for practical use (Lunne et al.,1989; Marchetti, 1980; Sanglerat, 1972). Even if nounique relationship can be expected with Eoed, i.e., thetangent modulus as found from Oedometer tests, theelectric Piezocone provides the evolution of pore pressureclose to the tip giving some valuable information on the
quality of the drainage conditions of the test (seeDrainage Conditions).
Bachelier and Parez (1965) have proposed to relate theOedometric modulus Eoed to cone resistance qc using theexpression Eoed=a×qc with a equal to 7 for an overcon-solidated clay as Merville Flandres clay. This relationseems to be valid in the view of Oedometric modules ob-tained in laboratory. For the tests made at the Compi àegnesite at 2 and 3 m deep in plastic clay (qc§1 MPa), anaverage value of a is 6 (Cassan, 1978; Barata, 1995). Forthe test at 6 m in the clayey sand, use of a factor a=2.4seems more appropriate. These values are in accordancewith the correlation between the Oedometer modulus andthe cone penetration resistance given in annex D of Euro-code 7 part 2 (CEN, 2006).
The close values of cone resistance and Oedometricmodulus at 7.12 m can be explained by the scattered pro-ˆle of this level. The transition between calcareous gravelto fractured chalk gives coarse blocks in a matrix di‹cultto trim to obtain a representative sample (Fig. 9). ThediŠerence between limit pressure ql and cone resistance qc
and the large diŠerence between penetrometer modulusand Oedometric modulus have the same explanation.
The review of all the experimental results indicated afactor between E modulus measured with pressuremeterand cone loading of less than 3 in frictional soils as in thepreliminary tests of Jossigny and Orleans sites (Tables 1and 2), 2.3±0.3 in overconsolidated clays of Merville(Table 4) and with less conˆdence of 6±2.5 in clayeycoarse sand of Compi àegne (Table 5). An average factorof 2±0.5 links Oedometric modulus to cone loadingmodulus for all tests in ˆne soils.
Small Strain BehaviorIt is important to notice that each test has an applica-
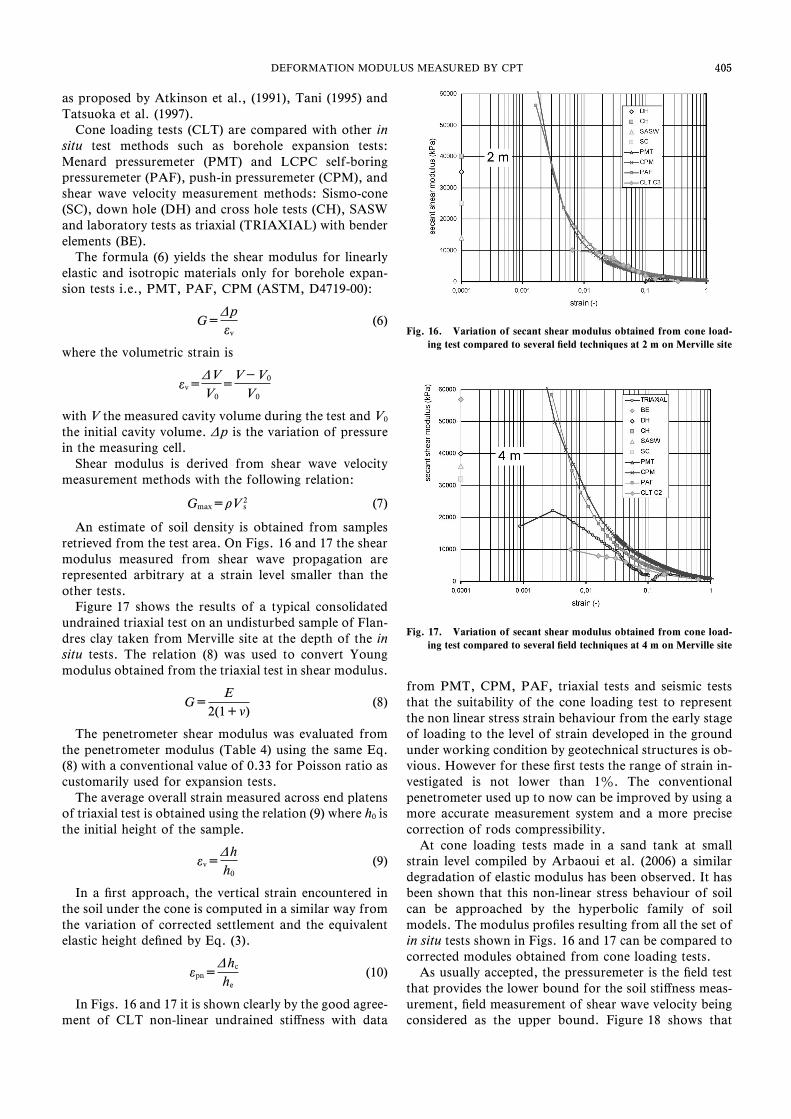
tion range depending on the strain generated in theground; the strain has to be related to those occurringduring construction of geotechnical works or during theirlifetime (Burland, 1989). On Figs. 16 and 17, we show theevolution of secant modulus versus strain obtained fromcone loading tests at Merville on a semi-logarithmic scale
405
Fig. 16. Variation of secant shear modulus obtained from cone load-ing test compared to several ˆeld techniques at 2 m on Merville site
Fig. 17. Variation of secant shear modulus obtained from cone load-ing test compared to several ˆeld techniques at 4 m on Merville site
405DEFORMATION MODULUS MEASURED BY CPT
as proposed by Atkinson et al., (1991), Tani (1995) andTatsuoka et al. (1997).
Cone loading tests (CLT) are compared with other insitu test methods such as borehole expansion tests:Menard pressuremeter (PMT) and LCPC self-boringpressuremeter (PAF), push-in pressuremeter (CPM), andshear wave velocity measurement methods: Sismo-cone(SC), down hole (DH) and cross hole tests (CH), SASWand laboratory tests as triaxial (TRIAXIAL) with benderelements (BE).
The formula (6) yields the shear modulus for linearlyelastic and isotropic materials only for borehole expan-sion tests i.e., PMT, PAF, CPM (ASTM, D4719-00):
G=Dpev
(6)
where the volumetric strain is
ev=DVV0
=V-V0
V0
with V the measured cavity volume during the test and V0
the initial cavity volume. Dp is the variation of pressurein the measuring cell.
Shear modulus is derived from shear wave velocitymeasurement methods with the following relation:
Gmax=rV s2 (7)
An estimate of soil density is obtained from samplesretrieved from the test area. On Figs. 16 and 17 the shearmodulus measured from shear wave propagation arerepresented arbitrary at a strain level smaller than theother tests.
Figure 17 shows the results of a typical consolidatedundrained triaxial test on an undisturbed sample of Flan-dres clay taken from Merville site at the depth of the insitu tests. The relation (8) was used to convert Youngmodulus obtained from the triaxial test in shear modulus.
G=E
2(1+n)(8)
The penetrometer shear modulus was evaluated fromthe penetrometer modulus (Table 4) using the same Eq.(8) with a conventional value of 0.33 for Poisson ratio ascustomarily used for expansion tests.
The average overall strain measured across end platensof triaxial test is obtained using the relation (9) where h0 isthe initial height of the sample.
ev=Dhh0
(9)
In a ˆrst approach, the vertical strain encountered inthe soil under the cone is computed in a similar way fromthe variation of corrected settlement and the equivalentelastic height deˆned by Eq. (3).
epn=Dhc
he(10)
In Figs. 16 and 17 it is shown clearly by the good agree-ment of CLT non-linear undrained stiŠness with data
from PMT, CPM, PAF, triaxial tests and seismic teststhat the suitability of the cone loading test to representthe non linear stress strain behaviour from the early stageof loading to the level of strain developed in the groundunder working condition by geotechnical structures is ob-vious. However for these ˆrst tests the range of strain in-vestigated is not lower than 1z. The conventionalpenetrometer used up to now can be improved by using amore accurate measurement system and a more precisecorrection of rods compressibility.
At cone loading tests made in a sand tank at smallstrain level compiled by Arbaoui et al. (2006) a similardegradation of elastic modulus has been observed. It hasbeen shown that this non-linear stress behaviour of soilcan be approached by the hyperbolic family of soilmodels. The modulus proˆles resulting from all the set ofin situ tests shown in Figs. 16 and 17 can be compared tocorrected modules obtained from cone loading tests.
As usually accepted, the pressuremeter is the ˆeld testthat provides the lower bound for the soil stiŠness meas-urement, ˆeld measurement of shear wave velocity beingconsidered as the upper bound. Figure 18 shows that
406
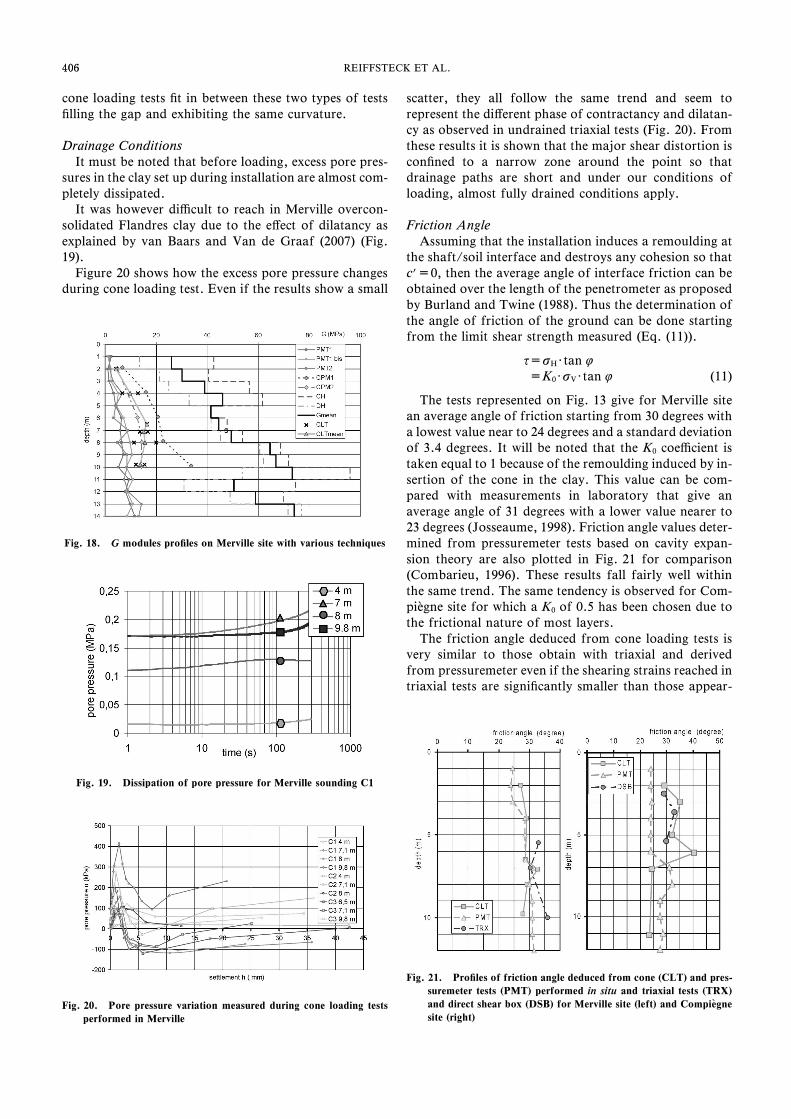
Fig. 18. G modules proˆles on Merville site with various techniques
Fig. 19. Dissipation of pore pressure for Merville sounding C1
Fig. 20. Pore pressure variation measured during cone loading testsperformed in Merville
Fig. 21. Proˆles of friction angle deduced from cone (CLT) and pres-suremeter tests (PMT) performed in situ and triaxial tests (TRX)and direct shear box (DSB) for Merville site (left) and Compi àegnesite (right)
406 REIFFSTECK ET AL.
cone loading tests ˆt in between these two types of testsˆlling the gap and exhibiting the same curvature.
Drainage ConditionsIt must be noted that before loading, excess pore pres-
sures in the clay set up during installation are almost com-pletely dissipated.
It was however di‹cult to reach in Merville overcon-solidated Flandres clay due to the eŠect of dilatancy asexplained by van Baars and Van de Graaf (2007) (Fig.19).
Figure 20 shows how the excess pore pressure changesduring cone loading test. Even if the results show a small
scatter, they all follow the same trend and seem torepresent the diŠerent phase of contractancy and dilatan-cy as observed in undrained triaxial tests (Fig. 20). Fromthese results it is shown that the major shear distortion isconˆned to a narrow zone around the point so thatdrainage paths are short and under our conditions ofloading, almost fully drained conditions apply.
Friction AngleAssuming that the installation induces a remoulding at
the shaft/soil interface and destroys any cohesion so thatc?=0, then the average angle of interface friction can beobtained over the length of the penetrometer as proposedby Burland and Twine (1988). Thus the determination ofthe angle of friction of the ground can be done startingfrom the limit shear strength measured (Eq. (11)).
t=sH・tan f=K0・sV・tan f (11)
The tests represented on Fig. 13 give for Merville sitean average angle of friction starting from 30 degrees witha lowest value near to 24 degrees and a standard deviationof 3.4 degrees. It will be noted that the K0 coe‹cient istaken equal to 1 because of the remoulding induced by in-sertion of the cone in the clay. This value can be com-pared with measurements in laboratory that give anaverage angle of 31 degrees with a lower value nearer to23 degrees (Josseaume, 1998). Friction angle values deter-mined from pressuremeter tests based on cavity expan-sion theory are also plotted in Fig. 21 for comparison(Combarieu, 1996). These results fall fairly well withinthe same trend. The same tendency is observed for Com-pi àegne site for which a K0 of 0.5 has been chosen due tothe frictional nature of most layers.
The friction angle deduced from cone loading tests isvery similar to those obtain with triaxial and derivedfrom pressuremeter even if the shearing strains reached intriaxial tests are signiˆcantly smaller than those appear-
407407DEFORMATION MODULUS MEASURED BY CPT
ing at the shaft/soil interface of the sleeve friction sensor(Fig. 12).
CONCLUSIONS
The present study was undertaken to investigate thepotential use of cone loading tests by the execution of acomprehensive programme of laboratory and ˆeld tests.The results presented in this paper show that the coneloading test allows us to obtain suitable curves for the de-termination of elastic modules of the ground, accordingto the strain level, even for very small strains. An advan-tage of this loading test is the simplicity of its procedureand its immediate integration in the normal cone penetra-tion test without major modiˆcation of the equipment.The simple and immediate relations, that can be drawnfrom the results obtained in laboratory and geotechnicalcentrifuge and those from tests carried out on sites, arepromising. The proposed test and analysis method enablethe estimation of modules using the slope of these loadingcurves.
The ˆeld studies carried out show that the test is applic-able in very varied soil conditions. In addition, theboundary conditions are well controlled and the penetra-tion is more repetitive than for borehole expansion testsrealised in pre-bored hole. The stress-strain curves ob-tained with a minicrawler mounted CPT-rig are similar tothose previously observed with the prototype and bothcentrifuge and laboratory studies. The use of a Piezoconegives rich information: variations of pore pressure, sleevefriction enabling the derivation of modules, friction an-gle. Thus, mechanical properties are based on the combi-nation of measurements from independent tests enhanc-ing the conˆdence in deriving constitutive parameters forgeotechnical design.
The correlation of cone loading tests results obtainedon Merville and Compiegne sites and Menard, Push-inand Self-boring pressuremeter results, Oedometer andtriaxial compression tests have proved the applicability ofthe technique.
Advantages of cone loading tests can be summarized asfollows:
– a theoretical background is proposed,– in situ stiŠness at low strain level can be evaluated,– soils are tested in their environment,– information of drainage conditions is obtained even
if it is not under the point,– test is sensitive to lithologic changes encountered as
seen on Compi àegne site including many layers,but some disadvantages have been assessed:
– soils are subjected to disturbance during installationof test, but this is repeatable,
– corrections are needed but achievable in situ and– complicated shearing mechanism occurs but well-
known and axi-symetric.For these reasons, interpretation of cone loading tests,
with installation by push-in with full displacement, willnot always be straightforward and may still require acombination of measurements from independent tests.
The state of the art of the test is such that it is possible toinclude henceforth the cone loading test in site investiga-tion programs.
REFERENCES
1) Arbaoui, H. (2003): Mesure de la d áeformabilit áe des sols en placeavec un p áen áetrom àetre, PhD Thesis, Blaise Pascal Univ., ClermontFerrand, 204 p.
2) Arbaoui, H., Gourv àes, R., Bressolette, Ph. and Bod áe, L. (2006):Mesure de la d áeformabilit áe des sols in situ àa l'aide d'un essai dechargement statique d'une pointe p áen áetrom áetrique, Can. Geotech.J., 43(4), 355–369.
3) ASTM D4719 (2000): Standard Test Method for Prebored Pres-suremeter, 9 p.
4) Atkinson, J. H. and S äallfors, G. (1991): Experimental determina-tion of soil properties, Proc. 10th Eur. Conf. SMFE, Firenze, 3,915–956.
5) Bachelier, M. and Parez, L. (1965): Contribution àa l' áetude de lacompressibilit áe des sols àa l'aide du p áen áetrom àetre àa c âone, Proc. 6thICSMFE, Montr áeal, 2, 3–7.
6) Barata, F. E. (1995): The use of CPT to evaluate the settlements ofshallow foundations on residual soils, Proc. Int. Symp. on ConePenetration Testing, CPT'95, Link äoping, Sweden, 2, 393–398.
7) Benoâƒt, J. and de Alba, P. A. (1988): Selection and management ofnational experimental sites, Proc. Workshop, Orlando, Florida,103 p.
8) Bosse, C. (2006): ÁEtude exp áerimentale et analyse du chargement depointe p áen áetrom áetrique en laboratoire, Master Thesis, U.P.M.C. &Cnam Paris, 42 p.
9) Burland, J. B. (1989): Ninth Laurits Bjerrum memorial Lecture:``Small is beautiful'' the stiŠness of soils at small strains, Can. Geo-tech. J., 26, 499–516.
10) Burland, J. B. and Twine, D. (1988): The shaft friction of boredpiles in terms of eŠective strength, Deep Foundations on Bored andAuger Piles (ed. by Van Impe), Balkema, 411–420.
11) Bustamante, M. and Doix, B. (1991): A new model of LPC remova-ble extensometers. Proc. 4th Int. Conf. on Piling and Deep Foun-dations, Stresa, Italy, April 7–12.
12) Bustamante, M. and Frank, R. (1999): Current French design prac-tice for axially loaded piles, Ground Engineering, 32(1), 38–44.
13) Butterˆeld, R. and Banerjee, P. K. (1971): A rigid disc embedded inan elastic half space, Geotechnical Engineering, 2, 35–52.
14) Can áepa, Y., Gaudin, C. and Noblet, S. (2000): Caract áerisation dela d áeformabilit áe des sols au moyen d'essais p áen áetrom áetriques: áetudede faisabilit áe, Internal Report, (FAER 2-24-59-09), 50 p.
15) Can áepa Y., Borel, S. and Deconinck, J. (2002): D áetermination de lacourbe d' áevolution du module de cisaillement d'un sol en fonctionde sa d áeformation àa partir d'essais en place, PARAM 2002 (eds. bypresses de l'ENPC), 25–32.
16) Cassan, M. (1978): Les essais in situ en m áecanique des sols, tome 2applications et m áethodes de calcul (ed. by Eyrolles), 331 p.
17) CEN (2006): EN 1997-2, Eurocode 7: Geotechnical design—Part 2:Ground investigation and testing, 209 p.
18) Chen, J. W. and Juang, C. H. (1996): Determination of drainedfriction angle of sands from CPT, J. Geot. Eng., ASCE, 122(5),374–381.
19) Combarieu, O. (1996): A propos de la d áetermination de l'angle defrottement des sols au pressiom àetre, Rev. Franç. de G áeotech., 77,51–58.
20) Faugeras, J. C. (1979): L'essai de compressibilit áe des sols aup áen áetrom àetre statique et son interpr áetation sur mod àele analogique,PhD Thesis, Univ. Paul Sabatier, Toulouse, 125 p.
21) Faugeras, J. C., Fortuna, G. and Gourv àes, R. (1983): Mesure de lacompressibilit áe des sols àa l'aide du p áen áetrom àetre statique, Int.Symp. In situ testing, Paris, 2, 269–274.
22) Fellenius, B. H. and Eslami, A. (2000): Soil proˆle interpreted fromCPTu data, ``Year 2000 Geotechnics'' Geotech. Eng. Conf., AIT,Bangkok, Thailand, 18 p.
408408 REIFFSTECK ET AL.
23) Godde, E. (2006): Caract áerisation de la d áeformabilit áe du sol avecun p áen áetrom àetre statique, Master, Univ. Blaise Pascal, ClermontFerrand, 98 p.
24) Haefeli, R. and Fehlmann, H. B. (1957): Measurement of soil com-pressibility in situ by means of the model pile test, Proc. 4thICSMFE, London, 1, 225–230.
25) Hight, D. W., Bond, A. J. and Legge, J. D. (1992): Characteriza-tion of the Bothkennar clay: an overview, G áeotechnique, 42(2),303–347.
26) ISO/CEN 22476-1 (2006): Geotechnical investigation and tes-ting—Field testing—Part 1: Electrical cone and piezocone penetra-tion tests (CPT et CPTU), 35 p.
27) ISO/CEN 22476-4 (2007): Geotechnical investigation and tes-ting—Field testing—Part 4: M áenard pressuremeter test, 66 p.
28) Janbu, N. and Senneset, K. (1973): Field compressometer—princi-ple and applications, Proc. 8th ICSMFE, Moscow, 1(1), 191–198.
29) Josseaume, H. (1998): Propri áet áes m áecaniques de l'argile des Flan-dres àa Dunkerque et àa Calais, Rev. Franç. de G áeotech., 84, 3–26.
30) Kay, J. N. and Parry, R. H. G. (1982): Screw plate tests in a stiŠclay, Ground Engineering, 15(6), 22–30.
31) Ladanyi, B. (1976): Use of the static penetration tests in frozensoils, Can. Geotech. J., 13(2), 95–110.
32) Lunne, T. and Powell, J. J. M. (2008): Comparative testing ofpiezocones at the Onsøy test site in Norway, Submitted for publica-tion.
33) Lunne, T., Lacasse, S. and Rad, N. S. (1989): General report/Dis-cussion session 2: SPT, CPT, pressuremeter testing and recent de-velopment in in-situ testing—Part 1: all except SPT, Proc. 12thICSMFE, Rio de Janeiro, 2339–2403.
34) Marchetti, S. (1980): In situ tests by flat dilatometer., J. Geotech.Engrg. Div., ASCE, 106(GT3), 299–321.
35) Mayne, P. W., Auxt, J. A., Mitchell, J. K. and Yilmaz, R. (1995):U.S. National Report on CPT, Proc. Int. Symp. on Cone Penetra-tion Testing, Vol. 1 (CPT 95), Swedish Geotechnical Society,Report 3:95, Link äoping, 263–276.
36) ReiŠsteck, Ph. (2009): Pile prediction revisited, IFCEE'09, ASCE-ADSC-PDCA, Orlando, Florida (under publication).
37) Robertson, P. K. (1990): Soil classiˆcation using the cone penetra-tion test, Can. Geotech. J., 27(1), 151–158.
38) Sanglerat, G. (1972): The penetrometer and soil exploration, Elsevi-er Publishing Company, Amsterdam, 464 p.
39) Sanglerat, G., Nhim, T. V., Sejourne, M. and Andina, R. (1974):Direct soil classiˆcation by static penetrometer with special frictionsleeve, Proc. 1st Eur. Symp. on Penetration Testing, ESOPT-1,June 5–7, Stockholm, 2.2, 337–344.
40) Tani, K. (1995): General report: Measurement of shear deforma-tion of geomaterials.—Field tests, Proc. 1st Int. Symp. onPrefailure Deformation of Geomaterials, Balkema, Sapporo,1115–1131.
41) Tatsuoka, F., Jardine, R. J., Lo Presti, D., Di Benedetto, H. andKodaka, T. (1997): Theme Lecture: Characterising the prefailuredeformation properties of geomaterials, Proc. 14th ICSMFE,Hamburg, 4, 2129–2164.
42) Van Baars, S. and Van De Graaf, H. (2007): Determination of or-ganic soil permeability using the piezocone dissipation test, Env.Engi. Geoscience, 13(3), 197–203.
43) Yu, H. S. and Mitchell, J. K. (1998): Analysis of cone resistance:Review of methods, J. Geotech. Geoenvir. Engrg., ASCE, 124(2),140–149.
44) Zhou, S. (1997): Caract áerisation des sols de surface àa l'aide dup áen áetrom àetre dynamique l áeger àa áenergie variable type PANDA.PhD Thesis, Blaise Pascal Univ., Clermont-Ferrand II, 179 p.