measurement using artificial pulse generator reliability
TRANSCRIPT
Full Terms & Conditions of access and use can be found athttp://www.tandfonline.com/action/journalInformation?journalCode=ijmt20
Download by: [National Taiwan University] Date: 17 August 2016, At: 00:50
Journal of Medical Engineering & Technology
ISSN: 0309-1902 (Print) 1464-522X (Online) Journal homepage: http://www.tandfonline.com/loi/ijmt20
Reliability assessment for pulse wavemeasurement using artificial pulse generator
Chi-Wei Chang & Wei-Kung Wang
To cite this article: Chi-Wei Chang & Wei-Kung Wang (2015) Reliability assessment forpulse wave measurement using artificial pulse generator, Journal of Medical Engineering &Technology, 39:3, 177-184, DOI: 10.3109/03091902.2015.1016190
To link to this article: http://dx.doi.org/10.3109/03091902.2015.1016190
Published online: 19 Feb 2015.
Submit your article to this journal
Article views: 44
View related articles
View Crossmark data
http://informahealthcare.com/jmtISSN: 0309-1902 (print), 1464-522X (electronic)
J Med Eng Technol, 2015; 39(3): 177–184! 2015 Informa UK Ltd. DOI: 10.3109/03091902.2015.1016190
INNOVATION
Reliability assessment for pulse wave measurement using artificialpulse generator
Chi-Wei Chang1 and Wei-Kung Wang*1,2
1Graduate Institute of Biomedical Electronics and Bioinformatics, National Taiwan University, Taipei, Taiwan, ROC and 2Biophysics Laboratory,
Institute of Physics, Academia Sinica, Taipei, Taiwan, ROC
Abstract
This study aimed to assess intrinsic reliabilities of devices for pulse wave measurement (PWM).An artificial pulse generator system was constructed to create a periodic pulse wave. Thestability of the periodic output was tested by the DP103 pressure transducer. The pulsegenerator system was then used to evaluate the TD01C system. Test–re-test and inter-devicereliability assessments were conducted on the TD01C system. First, 11 harmonic components ofthe pulse wave were calculated using Fourier series analysis. For each harmonic component,coefficient of variation (CV), intra-class correlation coefficient (ICC) and Bland-Altman plot wereused to determine the degree of reliability of the TD01C system. In addition, device exclusioncriteria were pre-specified to improve consistency of devices. The artificial pulse generatorsystem was stable to evaluate intrinsic reliabilities of devices for PWM (ICCs40.95, p50.001).TD01C was reliable for repeated measurements (ICCs of test–re-test reliability40.95, p50.001;CVs all53%). Device exclusion criteria successfully excluded the device with defect; therefore,the criteria reduced inter-device CVs of harmonics and improved consistency of the selecteddevices for all harmonic components. This study confirmed the feasibility of intrinsic reliabilityassessment of devices for PWM using an artificial pulse generator system. Moreover, potentialnovel findings on the assessment combined with device exclusion criteria could be a usefulmethod to select the measuring devices and to evaluate the qualities of them in PWM.
Keywords
Blood pressure, harmonic analysis, radialpulse wave, reproducibility
History
Received 18 August 2014Revised 22 January 2015Accepted 2 February 2015
1. Introduction
Pulse wave measurement (PWM) has drawn much attention
due to its informative value to evaluate the cardiovascular
system. The generalized transfer function (GTF), pulse wave
velocity (PWV), augmentation index (AI) and harmonic
analysis (HA) have been used to assess central aortic pressure
[1], arterial stiffness [2] and other cardiovascular diseases [3].
Validation of function or markers mentioned above highly
depends on a reliable contour record of pulse wave. Sensors
with less reliability could induce errors into the measuring
system and increase the variability of the markers. For
example, the GTF, scaling function of harmonic components
of pulse pressure wave in terms of amplitude and phase, was
used to transfer pressure wave from the limb artery to the
aortic artery [4]. This method has been validated using radial
applanation tonometry [5] and applied in recent decades [6].
However, Shih et al. [7] proved that the input error from the
sensor will mostly transfer to the GTF-derived central aortic
blood pressure. Therefore, the reliability qualification of
sensor is essential for validation of GTF.
Measurement of PWV and AI also rely on high fidelity
measurement of pulse wave. The PWV, a marker of arterial
stiffness, is the velocity of the pressure pulse wave
propagating through the aorta or through the arterial vessel.
The critical step in PWV measurement is identification of
wavefront of the pulse. There were several methods to detect
the wavefront such as measuring the minimum of pulse wave,
maximum of pulse wave or calculating the maximum of first
derivative of the pulse [8]. However, the change in high
frequency content of the pulse may interfere with the
wavefront identification process [9,10]. The AI, a represen-
tative surrogate of wave reflection, is defined as augmented
pressure divided by pulse pressure [11]. AI has also been
regarded as a marker of arterial stiffness [12], although that
has some arguments among studies [13,14]. Calculation of
augmented pressure used the fourth derivative of the pulse
wave [15] and also depended on high frequency content of the
pulse [5]. Hence, the accurate and reliable reading of PWV
and AI based on the high reliability of pulse measuring
system with less interference from frequency bias or noise.
Another way of PWM is to analyse the spectrum of blood
pressure pulse. The pulse was decomposed into harmonic
components (harmonics) by Nichols et al., [16] using Fourier*Corresponding author. Email: [email protected]
analysis. Milnor [17] investigated Fourier analysis and
described it as one of the most satisfactory approaches to
obtain a complete quantitative expression of the pressure
wave. Motivated by traditional Chinese medicine, Wang [18]
proposed that harmonic components could reveal information
about the circulation system in terms of different meridians.
To give a further explanation, Lin Wang et al. [19–21] built
up a PR wave model to elaborate the meaning of HA in
cardiovascular physiology.
The validations of GTF, PWV, AI and HA are based on a
fundamental assumption: a pulse measuring system with
qualified reliability. However, only few studies have been
conducted on the intrinsic reliability of the instrument for
PWM. The intrinsic reliability assesses the degree of
variability caused by the instrument, where the effects of
patient and observer are excluded. Without the intrinsic
reliability assessment before the clinical trial, there is no
reference to distinguish the source of variation. Therefore, the
purpose of this paper is to establish a standard protocol and a
pulse generator system to assess the intrinsic reliability of
instrument for PWM. The result of this survey may help
clinical practitioner to evaluate an instrument or technology
appropriate for PWM and validate its reliability in clinical
use.
2. Materials and methods
2.1. Pulse wave analyser TD01C
TD01C (MII-ANN Technology, Taiwan) is a non-invasive
system that detects the blood pressure pulse of the radial
artery and analyses the pressure pulse with HA. TD01C has
an effective and continuous sensing surface (42.0 cm2).
TD01C has architectures of dynamic range adjustment and
of automatic pulse-sensing such that it can analyse pressure
data within minutes and reach resolution of the 11 harmonic
waves. TD01C records 12-s data for each measurement.
TD01C should operate within working condition: 0� 2.5 PSI
(peak to peak pressure), 23–35 �C and 15–85% Relative
humidity. In this paper, six pulse wave analyser TD01Cs were
used and labelled TD01C-1, TD01C-2, TD01C-3, TD01C-4,
TD01C-5 and TD01C-6, respectively.
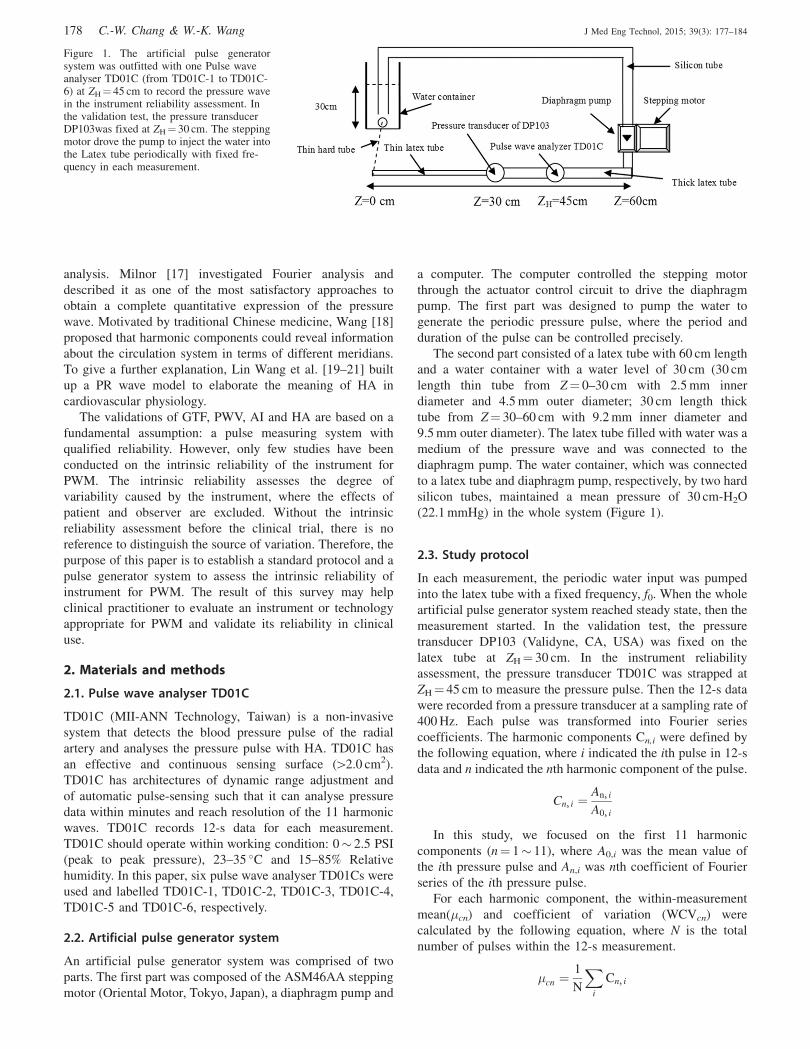
2.2. Artificial pulse generator system
An artificial pulse generator system was comprised of two
parts. The first part was composed of the ASM46AA stepping
motor (Oriental Motor, Tokyo, Japan), a diaphragm pump and
a computer. The computer controlled the stepping motor
through the actuator control circuit to drive the diaphragm
pump. The first part was designed to pump the water to
generate the periodic pressure pulse, where the period and
duration of the pulse can be controlled precisely.
The second part consisted of a latex tube with 60 cm length
and a water container with a water level of 30 cm (30 cm
length thin tube from Z¼ 0–30 cm with 2.5 mm inner
diameter and 4.5 mm outer diameter; 30 cm length thick
tube from Z¼ 30–60 cm with 9.2 mm inner diameter and
9.5 mm outer diameter). The latex tube filled with water was a
medium of the pressure wave and was connected to the
diaphragm pump. The water container, which was connected
to a latex tube and diaphragm pump, respectively, by two hard
silicon tubes, maintained a mean pressure of 30 cm-H2O
(22.1 mmHg) in the whole system (Figure 1).
2.3. Study protocol
In each measurement, the periodic water input was pumped
into the latex tube with a fixed frequency, f0. When the whole
artificial pulse generator system reached steady state, then the
measurement started. In the validation test, the pressure
transducer DP103 (Validyne, CA, USA) was fixed on the
latex tube at ZH¼ 30 cm. In the instrument reliability
assessment, the pressure transducer TD01C was strapped at
ZH¼ 45 cm to measure the pressure pulse. Then the 12-s data
were recorded from a pressure transducer at a sampling rate of
400 Hz. Each pulse was transformed into Fourier series
coefficients. The harmonic components Cn,i were defined by
the following equation, where i indicated the ith pulse in 12-s
data and n indicated the nth harmonic component of the pulse.
Cn, i ¼An, i
A0, i
In this study, we focused on the first 11 harmonic
components (n¼ 1� 11), where A0,i was the mean value of
the ith pressure pulse and An,i was nth coefficient of Fourier
series of the ith pressure pulse.
For each harmonic component, the within-measurement
mean(�cn) and coefficient of variation (WCVcn) were
calculated by the following equation, where N is the total
number of pulses within the 12-s measurement.
�cn ¼1
N
Xi
Cn, i
Figure 1. The artificial pulse generatorsystem was outfitted with one Pulse waveanalyser TD01C (from TD01C-1 to TD01C-6) at ZH¼ 45 cm to record the pressure wavein the instrument reliability assessment. Inthe validation test, the pressure transducerDP103was fixed at ZH¼ 30 cm. The steppingmotor drove the pump to inject the water intothe Latex tube periodically with fixed fre-quency in each measurement.
178 C.-W. Chang & W.-K. Wang J Med Eng Technol, 2015; 39(3): 177–184
�cn ¼
ffiffiffiffiffiffiffiffiffiffiffiffiffiffiffiffiffiffiffiffiffiffiffiffiffiffiffiffiffiffiffiffiffiffiffiffiffiPNi¼1 ðCn, i � �cnÞ
2
N� 1
s
WCVcn ¼�cn
�cn
Where �c1��c11 were representative parameters that
described the sequential pulses and WCVc1 � WCVc11
represented the degree of variation within the measurement.
2.4. Stability validation of artificial pulsegenerator system
The DP103 pressure transducer was used to assess the
stability of periodic output of the artificial pulse generator
system and to confirm the spectrum of the periodic output.
The 12-s signals were measured by a DP103 pressure
transducer at ZH¼ 30 cm and then were digitized by a PCI-
9111 A/D converter (ADLINK) with a sampling rate of
400 Hz.
The artificial pulse generator pumped with a fixed
frequency of 1 Hz and then five repeated measurements were
carried out using the DP103. There was at least a 5-min interval
between measurements. In each measurement, the �cn and
WCVcn were calculated and recorded. Furthermore, the
pumping frequency was changed from 1 Hz to 2 Hz with a
step of 0.2 Hz to simulate the population variation of the heart
rate. Five measurements were performed in each pumping
frequency with DP103. In total, 30 measurements were
performed.
2.5. Assessment of test–re-test reliability
At first, an artificial pulse generator pumped with a fixed
frequency of 1 Hz. Second, five measurements were carried
out using the same device, TD01C-1, following the study
protocol. The transducer of TD01C-1 was detached and retied
with at least a 5 min interval between measurements. In each
measurement, the �cn and WCVcn were calculated and
recorded. Furthermore, the pumping frequency was changed
from 1 Hz to 2 Hz with a step of 0.2 Hz to simulate the
population variation of the heart rate. Five measurements
were performed in each pumping frequency with TD01C-1. In
total, 30 measurements were performed.
In each pumping frequency, between-measurement coeffi-
cient of variation (BCV) was calculated as below, where j
indicated the jth measurement and n indicated the nth
harmonic component.
B�cn ¼1
5
X5
j¼1
�cn, j
B�cn ¼
ffiffiffiffiffiffiffiffiffiffiffiffiffiffiffiffiffiffiffiffiffiffiffiffiffiffiffiffiffiffiffiffiffiffiffiffiffiffiffiffiffiP5j¼1 ð�cn, j � B�cnÞ2
5� 1
s
BCVcn ¼B�cn
B�cn
Where B�cn and Bscn and were, respectively, mean and
standard deviation of �cns of the five measurements in the
same pumping frequency. BCVc1�BCVc11 represented the
degree of variation between the measurements.
2.6. Assessment of inter-device reliability
Initially, the artificial pulse generator pumped with a fixed
frequency of 1 Hz. Six measurements were carried out on
six different devices (TD01C-1 to TD01C-6) following the
study protocol. The transducer of TD01C was detached
and retied with at least a 1 min interval between measure-
ments. In each measurement, the �cn and WCVcn were
calculated and recorded.
Second, the pumping frequency was changed from 1 Hz
to 2 Hz, with a step of 0.2 Hz to simulate the population
variation of the heart rate. In each pumping frequency, six
measurements were performed from TD01C-1 to TD01C-6.
In total, 36 measurements were performed.
In each pumping frequency, inter-device coefficient of
variation (IDCV) was calculated as below, where k indicated
the measurement from the kth device and n indicated the
nth harmonic component. The quantity of devices was
denoted by M.
ID�cn ¼1
M
XMk¼1
�cn, k
ID�cn ¼
ffiffiffiffiffiffiffiffiffiffiffiffiffiffiffiffiffiffiffiffiffiffiffiffiffiffiffiffiffiffiffiffiffiffiffiffiffiffiffiffiffiffiffiffiffiPMk¼1 ð�cn, k � ID�cnÞ
2
M� 1
s
IDCVcn ¼ID�cn
ID�cn
where ID�cn and IDscn were, respectively, mean and standard
deviation of �cns of the six measurements from TD01C-1 to
TD01C-6 in the same pumping frequency. IDCVc1� IDCVc11
represented the degree of variation between the measurements
from difference devices.
2.7. Device exclusion criteria
In the assessment of inter-device reliability, the kth device
(TD01C-j) was excluded if �cn,k beyond the range
ID�cn(1±10%) for all n. This process excluded the devices
whose spectrum response of transducers was obviously
inconsistent with the others. Both data before and after
device exclusion calculated the IDCVcns and Intra-class
correlation coefficients to assess the effect of device
exclusion.
2.8. Statistics
2.8.1. Bland-Altman analysis
The test–re-test reliability assessment was evaluated using the
Bland-Altman analysis [22], which provides a good frame-
work for reliability validation. For each �cn, the difference
between first measurement and second measurement was
plotted against their mean value. Then the mean (d) and the
standard deviation (SD) of differences for all participants
DOI: 10.3109/03091902.2015.1016190 Reliability assessment for pulse wave measurement 179

were calculated. Limits of agreement (d� 2 SD) were marked
by dashes lines (Figure 2).
2.8.2. Intra-class correlation coefficient
For the stability validation, the test–re-test and inter-device
reliability assessment, two-way random single-measure intra-
class correlation coefficients, ICC (2, 1)¼ �, were calculated
for each mean harmonic (�C1��C11) with Matlab 2008
(USA); 95% confidence intervals and p values of ICC (2, 1)s
were reported. According to the suggestion of Fleiss [23], the
value �40.75 was deemed as excellent reliability.
Furthermore, Portney and Watkins [24] recommend that
�40.9 is appropriate for clinical application to ensure valid
interpretation.
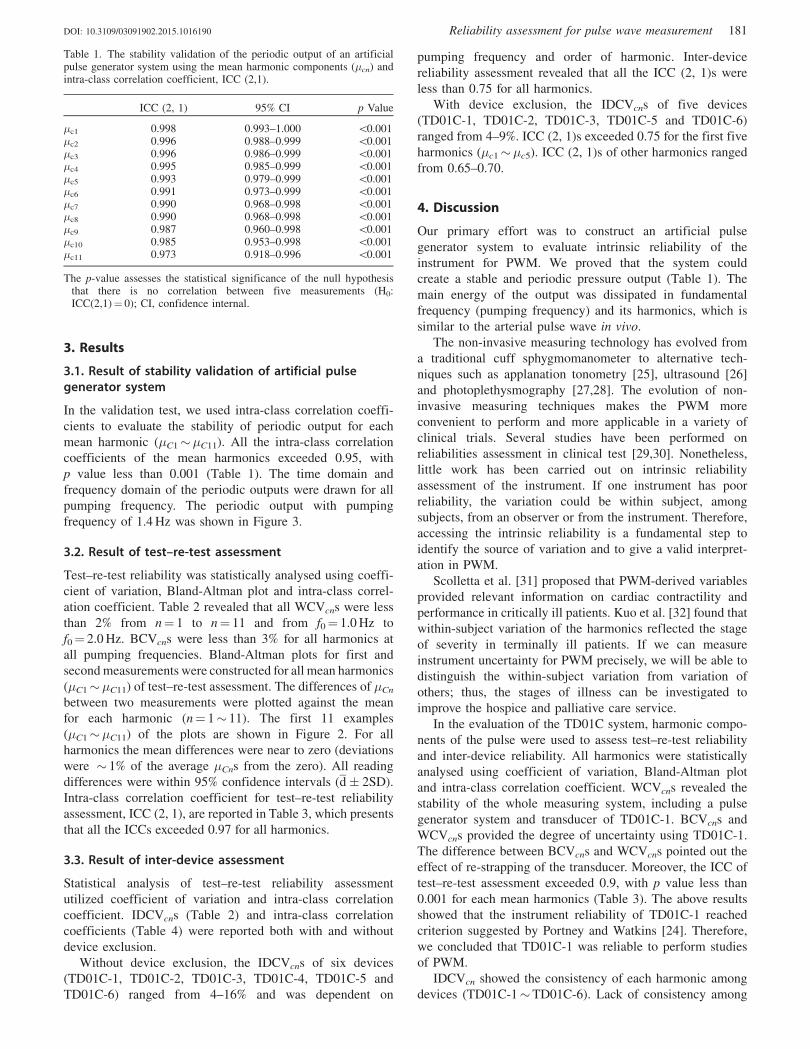
Figure 2. The Bland-Altman plots of the first 11 mean harmonic components (�C1��C11) of the arterial pulse wave in the test–re-test assessment.
180 C.-W. Chang & W.-K. Wang J Med Eng Technol, 2015; 39(3): 177–184
3. Results
3.1. Result of stability validation of artificial pulsegenerator system
In the validation test, we used intra-class correlation coeffi-
cients to evaluate the stability of periodic output for each
mean harmonic (�C1��C11). All the intra-class correlation
coefficients of the mean harmonics exceeded 0.95, with
p value less than 0.001 (Table 1). The time domain and
frequency domain of the periodic outputs were drawn for all
pumping frequency. The periodic output with pumping
frequency of 1.4 Hz was shown in Figure 3.
3.2. Result of test–re-test assessment
Test–re-test reliability was statistically analysed using coeffi-
cient of variation, Bland-Altman plot and intra-class correl-
ation coefficient. Table 2 revealed that all WCVcns were less
than 2% from n¼ 1 to n¼ 11 and from f0¼ 1.0 Hz to
f0¼ 2.0 Hz. BCVcns were less than 3% for all harmonics at
all pumping frequencies. Bland-Altman plots for first and
second measurements were constructed for all mean harmonics
(�C1��C11) of test–re-test assessment. The differences of �Cn
between two measurements were plotted against the mean
for each harmonic (n¼ 1� 11). The first 11 examples
(�C1��C11) of the plots are shown in Figure 2. For all
harmonics the mean differences were near to zero (deviations
were � 1% of the average �Cns from the zero). All reading
differences were within 95% confidence intervals (d� 2SD).
Intra-class correlation coefficient for test–re-test reliability
assessment, ICC (2, 1), are reported in Table 3, which presents
that all the ICCs exceeded 0.97 for all harmonics.
3.3. Result of inter-device assessment
Statistical analysis of test–re-test reliability assessment
utilized coefficient of variation and intra-class correlation
coefficient. IDCVcns (Table 2) and intra-class correlation
coefficients (Table 4) were reported both with and without
device exclusion.
Without device exclusion, the IDCVcns of six devices
(TD01C-1, TD01C-2, TD01C-3, TD01C-4, TD01C-5 and
TD01C-6) ranged from 4–16% and was dependent on
pumping frequency and order of harmonic. Inter-device
reliability assessment revealed that all the ICC (2, 1)s were
less than 0.75 for all harmonics.
With device exclusion, the IDCVcns of five devices
(TD01C-1, TD01C-2, TD01C-3, TD01C-5 and TD01C-6)
ranged from 4–9%. ICC (2, 1)s exceeded 0.75 for the first five
harmonics (�c1��c5). ICC (2, 1)s of other harmonics ranged
from 0.65–0.70.
4. Discussion
Our primary effort was to construct an artificial pulse
generator system to evaluate intrinsic reliability of the
instrument for PWM. We proved that the system could
create a stable and periodic pressure output (Table 1). The
main energy of the output was dissipated in fundamental
frequency (pumping frequency) and its harmonics, which is
similar to the arterial pulse wave in vivo.
The non-invasive measuring technology has evolved from
a traditional cuff sphygmomanometer to alternative tech-
niques such as applanation tonometry [25], ultrasound [26]
and photoplethysmography [27,28]. The evolution of non-
invasive measuring techniques makes the PWM more
convenient to perform and more applicable in a variety of
clinical trials. Several studies have been performed on
reliabilities assessment in clinical test [29,30]. Nonetheless,
little work has been carried out on intrinsic reliability
assessment of the instrument. If one instrument has poor
reliability, the variation could be within subject, among
subjects, from an observer or from the instrument. Therefore,
accessing the intrinsic reliability is a fundamental step to
identify the source of variation and to give a valid interpret-
ation in PWM.
Scolletta et al. [31] proposed that PWM-derived variables
provided relevant information on cardiac contractility and
performance in critically ill patients. Kuo et al. [32] found that
within-subject variation of the harmonics reflected the stage
of severity in terminally ill patients. If we can measure
instrument uncertainty for PWM precisely, we will be able to
distinguish the within-subject variation from variation of
others; thus, the stages of illness can be investigated to
improve the hospice and palliative care service.
In the evaluation of the TD01C system, harmonic compo-
nents of the pulse were used to assess test–re-test reliability
and inter-device reliability. All harmonics were statistically
analysed using coefficient of variation, Bland-Altman plot
and intra-class correlation coefficient. WCVcns revealed the
stability of the whole measuring system, including a pulse
generator system and transducer of TD01C-1. BCVcns and
WCVcns provided the degree of uncertainty using TD01C-1.
The difference between BCVcns and WCVcns pointed out the
effect of re-strapping of the transducer. Moreover, the ICC of
test–re-test assessment exceeded 0.9, with p value less than
0.001 for each mean harmonics (Table 3). The above results
showed that the instrument reliability of TD01C-1 reached
criterion suggested by Portney and Watkins [24]. Therefore,
we concluded that TD01C-1 was reliable to perform studies
of PWM.
IDCVcn showed the consistency of each harmonic among
devices (TD01C-1�TD01C-6). Lack of consistency among
Table 1. The stability validation of the periodic output of an artificialpulse generator system using the mean harmonic components (�cn) andintra-class correlation coefficient, ICC (2,1).
ICC (2, 1) 95% CI p Value
�c1 0.998 0.993–1.000 50.001�c2 0.996 0.988–0.999 50.001�c3 0.996 0.986–0.999 50.001�c4 0.995 0.985–0.999 50.001�c5 0.993 0.979–0.999 50.001�c6 0.991 0.973–0.999 50.001�c7 0.990 0.968–0.998 50.001�c8 0.990 0.968–0.998 50.001�c9 0.987 0.960–0.998 50.001�c10 0.985 0.953–0.998 50.001�c11 0.973 0.918–0.996 50.001
The p-value assesses the statistical significance of the null hypothesisthat there is no correlation between five measurements (H0:ICC(2,1)¼ 0); CI, confidence internal.
DOI: 10.3109/03091902.2015.1016190 Reliability assessment for pulse wave measurement 181
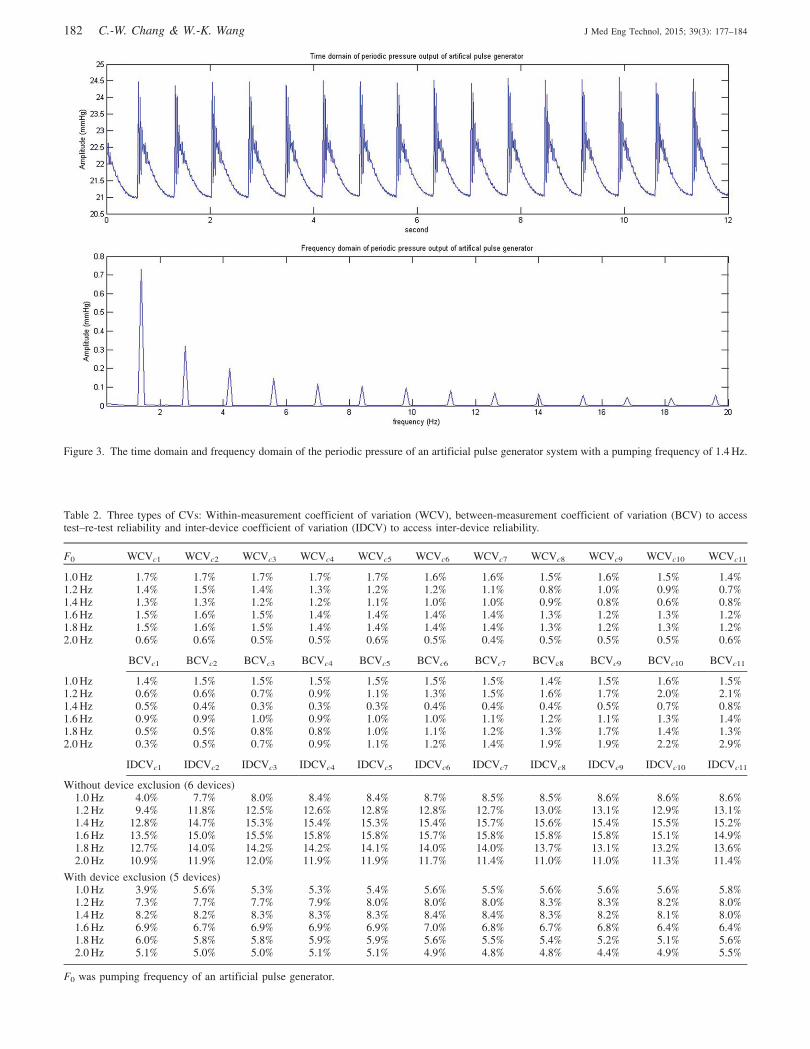
Figure 3. The time domain and frequency domain of the periodic pressure of an artificial pulse generator system with a pumping frequency of 1.4 Hz.
Table 2. Three types of CVs: Within-measurement coefficient of variation (WCV), between-measurement coefficient of variation (BCV) to accesstest–re-test reliability and inter-device coefficient of variation (IDCV) to access inter-device reliability.
F0 WCVc1 WCVc2 WCVc3 WCVc4 WCVc5 WCVc6 WCVc7 WCVc8 WCVc9 WCVc10 WCVc11
1.0 Hz 1.7% 1.7% 1.7% 1.7% 1.7% 1.6% 1.6% 1.5% 1.6% 1.5% 1.4%1.2 Hz 1.4% 1.5% 1.4% 1.3% 1.2% 1.2% 1.1% 0.8% 1.0% 0.9% 0.7%1.4 Hz 1.3% 1.3% 1.2% 1.2% 1.1% 1.0% 1.0% 0.9% 0.8% 0.6% 0.8%1.6 Hz 1.5% 1.6% 1.5% 1.4% 1.4% 1.4% 1.4% 1.3% 1.2% 1.3% 1.2%1.8 Hz 1.5% 1.6% 1.5% 1.4% 1.4% 1.4% 1.4% 1.3% 1.2% 1.3% 1.2%2.0 Hz 0.6% 0.6% 0.5% 0.5% 0.6% 0.5% 0.4% 0.5% 0.5% 0.5% 0.6%
BCVc1 BCVc2 BCVc3 BCVc4 BCVc5 BCVc6 BCVc7 BCVc8 BCVc9 BCVc10 BCVc11
1.0 Hz 1.4% 1.5% 1.5% 1.5% 1.5% 1.5% 1.5% 1.4% 1.5% 1.6% 1.5%1.2 Hz 0.6% 0.6% 0.7% 0.9% 1.1% 1.3% 1.5% 1.6% 1.7% 2.0% 2.1%1.4 Hz 0.5% 0.4% 0.3% 0.3% 0.3% 0.4% 0.4% 0.4% 0.5% 0.7% 0.8%1.6 Hz 0.9% 0.9% 1.0% 0.9% 1.0% 1.0% 1.1% 1.2% 1.1% 1.3% 1.4%1.8 Hz 0.5% 0.5% 0.8% 0.8% 1.0% 1.1% 1.2% 1.3% 1.7% 1.4% 1.3%2.0 Hz 0.3% 0.5% 0.7% 0.9% 1.1% 1.2% 1.4% 1.9% 1.9% 2.2% 2.9%
IDCVc1 IDCVc2 IDCVc3 IDCVc4 IDCVc5 IDCVc6 IDCVc7 IDCVc8 IDCVc9 IDCVc10 IDCVc11
Without device exclusion (6 devices)1.0 Hz 4.0% 7.7% 8.0% 8.4% 8.4% 8.7% 8.5% 8.5% 8.6% 8.6% 8.6%1.2 Hz 9.4% 11.8% 12.5% 12.6% 12.8% 12.8% 12.7% 13.0% 13.1% 12.9% 13.1%1.4 Hz 12.8% 14.7% 15.3% 15.4% 15.3% 15.4% 15.7% 15.6% 15.4% 15.5% 15.2%1.6 Hz 13.5% 15.0% 15.5% 15.8% 15.8% 15.7% 15.8% 15.8% 15.8% 15.1% 14.9%1.8 Hz 12.7% 14.0% 14.2% 14.2% 14.1% 14.0% 14.0% 13.7% 13.1% 13.2% 13.6%2.0 Hz 10.9% 11.9% 12.0% 11.9% 11.9% 11.7% 11.4% 11.0% 11.0% 11.3% 11.4%
With device exclusion (5 devices)1.0 Hz 3.9% 5.6% 5.3% 5.3% 5.4% 5.6% 5.5% 5.6% 5.6% 5.6% 5.8%1.2 Hz 7.3% 7.7% 7.7% 7.9% 8.0% 8.0% 8.0% 8.3% 8.3% 8.2% 8.0%1.4 Hz 8.2% 8.2% 8.3% 8.3% 8.3% 8.4% 8.4% 8.3% 8.2% 8.1% 8.0%1.6 Hz 6.9% 6.7% 6.9% 6.9% 6.9% 7.0% 6.8% 6.7% 6.8% 6.4% 6.4%1.8 Hz 6.0% 5.8% 5.8% 5.9% 5.9% 5.6% 5.5% 5.4% 5.2% 5.1% 5.6%2.0 Hz 5.1% 5.0% 5.0% 5.1% 5.1% 4.9% 4.8% 4.8% 4.4% 4.9% 5.5%
F0 was pumping frequency of an artificial pulse generator.
182 C.-W. Chang & W.-K. Wang J Med Eng Technol, 2015; 39(3): 177–184
devices could create artifact of pulse signal and, thus, could
lead to wrong conclusion in meta-analysis. Without device
exclusion, the maximum of IDCVcns reached 16%, which was
large uncertainty compared to WCVcns. The ICCs of inter-
device reliability were less than 0.75 (Fleiss criteria) for all
mean harmonics (�c1��c11). The result showed a lack of
consistency among six devices. We then exclude the TD01C-4
in accordance with the device exclusion criteria. We sent back
the TD01C-4 to the MII-ANN Technology and its QC
department found that a part of TD01C-4 had defects. It is,
therefore, proved that the method is powerful to assure
instrument reliability. Without TD01C-4, the maximum of
IDCVcns decreased to 9% and ICCs exceed 0.75 for the first
five mean harmonics (�c1��c5). Thus, the degree of
uncertainty was lower and the consistency was improved.
However, there was still room to improve consistency for
higher mean harmonics (�c6��c11).
This report focused on the fundamental frequency of the
heart and its harmonics, which approximately ranged from
1–20 Hz. However, some activities also affect the peripheral
pulse, such as respiration (0.15–0.4 Hz) and sympathetic
activity on microcirculation (0.04–0.15 Hz) [33,34]. The
reliabilities of TD01C in those frequency ranges are still not
validated and need more studies in the future. In addition,
TD01C records only 12-s data for each measurement. Thus,
TD01C is not suitable for measuring frequencies below
roughly 0.1 Hz [8].
This research demonstrated that an artificial pulse gener-
ator system could be used to statistically access intrinsic
reliability of one device or among devices. A Bland-Altman
plot for each mean harmonics showed the limitation of a
specific device to measure the index in PWM (Figure 2).
Furthermore, the device exclusion criteria could be set to
assure consistency of selected devices for PWM. The
investigator can choose appropriate device inclusion criteria
and validate the intrinsic reliability of selected devices to fit
their intended use.
Declaration of interest
The authors report no conflicts of interest. The authors alone
are responsible for the content and writing of the paper.
References
1. Cheng, H.M., Sung, S.H., Shih, Y.T., Chuang, S.Y., Yu, W.C., andChen, C.H., 2012, Measurement of central aortic pulse pressure:Noninvasive brachial cuff-based estimation by a transfer functionvs. a novel pulse wave analysis method. American Journal ofHypertension, 25, 1162–1169.
2. Laurent, S., Cockcroft, J., Van Bortel, L., Boutouyrie, P.,Giannattasio, C., Hayoz, D., Pannier, B., Vlachopoulos, C.,Wilkinson, I., and Struijker-Boudier, H., 2006, Expert consensusdocument on arterial stiffness: Methodological issues and clinicalapplications. European Heart Journal, 27, 2588–2605.
3. Wang, Y.Y.L., Hsu, T.L., Jan, M.Y., and Wang, W.K., 2010, Theoryand applications of the harmonic analysis of arterial pressure pulsewaves. Journal of Medical & Biological Engineering, 30, 125–131.
4. O’Rourke, M.F., 1970, Influence of ventricular ejection on therelationship between central aortic and brachial pressure pulse inman. Cardiovascular Research, 4, 291–300.
5. Chen, C.-H., Nevo, E., Fetics, B., Pak, P.H., Yin, F.C., Maughan,W.L., and Kass, D.A., 1997, Estimation of central aortic pressurewaveform by mathematical transformation of radial tonometrypressure validation of generalized transfer function. Circulation, 95,1827–1836.
6. Hirata, K., Kawakami, M., and O’Rourke, M.F., 2006, Pulse waveanalysis and pulse wave velocity: A review of blood pressureinterpretation 100 years after Korotkov. Circulation Journal, 70,1231–1239.
7. Shih, Y.-T., Cheng, H.-M., Sung, S.-H., Hu, W.-C., and Chen, C.-H.,2011, Quantification of the calibration error in the transfer function-derived central aortic blood pressures. American Journal ofHypertension, 24, 1312–1317.
8. Asmar, R., Benetos, A., Topouchian, J., Laurent, P., Pannier, B.,Brisac, A.M., Target, R., and Levy, B.I., 1995, Assessment ofarterial distensibility by automatic pulse wave velocity measure-ment. Validation and clinical application studies. Hypertension, 26,485–490.
9. Callaghan, F.J., Babbs, C.F., Bourland, J.D., and Geddes, L.A.,1984, The relationship between arterial pulse-wave velocity andpulse frequency at different pressures. Journal of MedicalEngineering & Technology, 8, 15–18.
10. Millasseau, S.C., Stewart, A.D., Patel, S.J., Redwood, S.R., andChowienczyk, P.J., 2005, Evaluation of carotid-femoral pulse wavevelocity: Influence of timing algorithm and heart rate.Hypertension, 45, 222–226.
Table 4. The inter-device reliability assessment of the mean harmoniccomponents (�cn) using intra-class correlation coefficient, ICC (2,1).Both ICCs before and after device exclusion were calculated as below.
Before device exclusion (6 devices)After device exclusion
(5 devices)
ICC (2, 1) 95% CI ICC (2, 1) 95% CI
�c1 0.663 0.246–0.932 0.868 0.454–0.979�c2 0.621 0.197–0.921 0.866 0.451–0.979�c3 0.556 0.156–0.899 0.842 0.399–0.975�c4 0.522 0.139–0.886 0.824 0.367–0.971�c5 0.445 0.104–0.851 0.778 0.299–0.962�c6 0.329 0.065–0.778 0.695 0.217–0.943�c7 0.292 0.055–0.747 0.657 0.188–0.933�c8 0.287 0.054–0.742 0.649 0.190–0.931�c9 0.310 0.060–0.762 0.666 0.204–0.935�c10 0.344 0.070–0.789 0.701 0.226–0.944�c11 0.337 0.068–0.784 0.692 0.218–0.942
The p-value assesses the statistical significance of the null hypothesisthat there is no correlation between five measurements (H0:ICC (2,1)¼ 0); All p-values of data were 5 0.001; CI, confidenceinternal.
Table 3. The test–re-test reliability assessment of themean harmonic components (�cn) using intra-class correl-ation coefficient, ICC (2,1).
ICC (2, 1) 95% CI p Value
�c1 0.989 0.991–1.000 50.001�c2 0.997 0.990–1.000 50.001�c3 0.997 0.987–0.999 50.001�c4 0.996 0.984–0.999 50.001�c5 0.995 0.979–0.999 50.001�c6 0.993 0.959–0.998 50.001�c7 0.987 0.945–0.997 50.001�c8 0.982 0.926–0.996 50.001�c9 0.976 0.918–0.996 50.001�c10 0.973 0.921–0.996 50.001�c11 0.975 0.906–0.995 50.001
The p-value assesses the statistical significance of the nullhypothesis that there is no correlation between fivemeasurements (H0: ICC (2,1)¼ 0); CI, confidenceinternal.
DOI: 10.3109/03091902.2015.1016190 Reliability assessment for pulse wave measurement 183

11. Murgo, J.P., Westerhof, N., Giolma, J.P., and Altobelli, S.A., 1980,Aortic input impedance in normal man - Relationship to pressurewave forms. Circulation, 62, 105–116.
12. Wei, L.Y., and Chow, P., 1985, Frequency distribution of humanpulse spectra. IEEE Transactions on Biomedical Engineering,BME-32, 245–246. http://ieeexplore.ieee.org/xpl/login.jsp?tp=&arnumber=4122034&url=http%3A%2F%2Fieeexplore.ieee.org%2Fxpls%2Fabs_all.jsp%3Farnumber%3D4122034.
13. Laurent, S., Cockcroft, J., Van Bortel, L., Boutouyrie, P.,Giannattasio, C., Hayoz, D., Pannier, B., Vlachopoulos, C.,Wilkinson, I., and Struijker-Boudier, H., 2006, Expert consensusdocument on arterial stiffness: Methodological issues and clinicalapplications. European Heart Journal, 27, 2588–2605.
14. Sakurai, M., Yamakado, T., Kurachi, H., Kato, T., Kuroda, K.,Ishisu, R., Okamoto, S., Isaka, N., Nakano, T., and Ito, M., 2007,The relationship between aortic augmentation index and pulsewave velocity: An invasive study. Journal of Hypertension, 25,391–397.
15. Gatzka, C.D., Cameron, J.D., Dart, A.M., Berry, K.L., Kingwell,B.A., Dewar, E.M., Reid, C.M., Jennings, G.L.R., and Investigators,A., 2001, Correction of carotid augmentation index for heart rate inelderly essential hypertensives. American Journal of Hypertension,14, 573–577.
16. Nichols, W.W., O’Rourke, M.F., and McDonald, D.A., 2005,McDonald’s blood flow in arteries: Theoretical, experimental, andclinical principles (New York: Oxford University Press).
17. Milnor, W.R., 1982, Hemodynamics (Baltimore, MD: Williams &Wilkins).
18. Wang, W., 1986, Modern view of Chinese medicine. Annual Reportof the Institute of Physics, 16, 269–275.
19. Lin Wang, Y.Y., Sze, W.K., Bau, J.G., Wang, S.H., Jan, M.Y., Hsu,T.L., and Wang, W.K., 2008, The ventricular-arterial couplingsystem can be analyzed by the eigenwave modes of the wholearterial system. Applied Physics Letters, 92, 2. http://ieeexplore.ieee.org/Xplore/defdeny.jsp?url=http%3A%2F%2Fieeexplore.ieee.org%2Fstamp%2Fstamp.jsp%3Ftp%3D%26arnumber%3D4832412%26userType%3Dinst&denyReason=-133&arnumber=4832412&productsMatched=null&userType=inst.
20. Lin Wang, Y.-Y., and Wang, W.-K., 2013, A hemodynamics modelto study the collective behavior of the ventricular-arterial system.Journal of Applied Physics, 113, 024702–024706.
21. Lin Wang, Y.Y., ad Wang, W.K., 2014, Anatomy of arterial systemsreveals that the major function of the heart is not to emit wavesassociated with the axial blood motion. The Journal of Physiology,592, 409.
22. Bland, J.M., and Altman, D.G., 1986, Statistical-methods forassessing agreement between 2 methods of clinical measurement.Lancet, 1, 307–310.
23. Fleiss, J.L., (1999), Front matter. The design and analysis of clinicalexperiments (Hoboken, NJ: John Wiley & Sons, Inc.). pp. i–xiv.
24. Portney, L.G., and Watkins, M.P., (2009), Foundations of clinicalresearch: Applications to practice (Upper Saddle River, NJ:Pearson/Prentice Hall).
25. Crilly, M., Coch, C., Bruce, M., Clark, H., and Williams, D., 2007,Repeatability of central aortic blood pressures measured non-invasively using radial artery applanation tonometry and peripheralpulse wave analysis. Blood Press, 16, 262–269.
26. Kips, J., Vanmolkot, F., Mahieu, D., Vermeersch, S., Fabry, I., deHoon, J., Van Bortel, L., and Segers, P., 2010, The use of diameterdistension waveforms as an alternative for tonometric pressure toassess carotid blood pressure. Physiological Measurement, 31, 543.
27. Hsiu, H., Huang, S.-M., Hsu, C.-L., Hu, S.-F., and Lin, H.-W., 2012,Effects of cold stimulation on the harmonic structure of the bloodpressure and photoplethysmography waveforms. Photomedicineand Laser Surgery, 30, 77–84.
28. Allen, J., 2007, Photoplethysmography and its application inclinical physiological measurement. Physiological Measurement,28, R1.
29. Avolio, A.P., Butlin, M., and Walsh, A., 2010, Arterial blood pressuremeasurement and pulse wave analysis–their role in enhancingcardiovascular assessment. Physiological Measurement, 31,R1–R47.
30. Crilly, M.A., Orme, K.M., Henderson, J., Allan, A.J., andBhattacharya, S., (2014), Repeatability of SphygmoCor pulsewave analysis in assessing arterial wave reflection in pregnancyusing applanation tonometry. Hypertens Pregnancy http://informahealthcare.com/doi/abs/10.3109/10641955.2013.877926.
31. Scolletta, S., Bodson, L., Donadello, K., Taccone, F.S., Devigili, A.,Vincent, J.L., and De Backer, D., 2013, Assessment of leftventricular function by pulse wave analysis in critically ill patients.Intensive Care Medicine, 39, 1025–1033.
32. Kuo, Y.C., Chiu, T.Y., Jan, M.Y., Bau, J.G., Li, S.P., Wang, W.K.,and Wang, Y.Y.L., 2004, Losing harmonic stability of arterial pulsein terminally ill patients. Blood Pressure Monitoring, 9, 255–258.
33. Rajendra Acharya, U., Paul Joseph, K., Kannathal, N., Lim, C.M.,and Suri, J.S., 2006, Heart rate variability: A review. Medical &Biological Engieering & Computing, 44, 1031–1051.
34. Akselrod, S., Gordon, D., Madwed, J.B., Snidman, N.C., Shannon,D.C., and Cohen, R.J., 1985, Hemodynamic regulation:Investigation by spectral analysis. American Journal ofPhysiology, 249, H867–H875.
184 C.-W. Chang & W.-K. Wang J Med Eng Technol, 2015; 39(3): 177–184