measurement techniques for red blood cell...
TRANSCRIPT

Chapter 10
© 2012 Park et al., licensee InTech. This is an open access chapter distributed under the terms of the Creative Commons Attribution License (http://creativecommons.org/licenses/by/3.0), which permits unrestricted use, distribution, and reproduction in any medium, provided the original work is properly cited.
Measurement Techniques for Red Blood Cell Deformability: Recent Advances
Youngchan Kim, Kyoohyun Kim and YongKeun Park
Additional information is available at the end of the chapter
http://dx.doi.org/10.5772/50698
1. Introduction
Human red blood cells (RBCs) or erythrocytes have remarkable deformability. Upon external forces, RBCs undergo large mechanical deformation without rupture, and they restore to original shapes when released. The deformability of RBCs plays crucially important roles in the main function of RBCs - oxygen transport through blood circulation. RBCs must withstand large deformations during repeated passages through the microvasculature and the fenestrated walls of the splenic sinusoids (Waugh and Evans, 1979). RBC deformability can be significantly altered by various pathophysiological conditions, and the alterations in RBC deformability in turn influence pathophysiology, since RBC deformability is an important determinant of blood viscosity and thus blood circulation. Hence, measuring the deformability of RBCs holds the key to understanding RBC related diseases. For the past years, various experimental techniques have been developed to measure RBC deformability and recent technical advances revolutionize the way we study RBCs and their roles in hematology. This chapter reviews a variety of tools for measuring RBC deformability. For each technique, we seek to provide insights how these deformability measurement techniques can improve the study of RBC pathophysiology.
2. Deformability of RBCs
RBCs are the most deformable cell in the human body. RBC deformabiltiy is an intrinsic mechanical property determined by (1) its geometry, (2) cytoplasmic viscosity, mainly attributed to hemoglobin (Hb) solution in the cytoplasm, and (3) viscoelastic properties of RBC membrane cortex structure.

Blood Cell – An Overview of Studies in Hematology 168
2.1. RBC geometry
Mature human RBCs have a biconcave disc shape and they do not contain nucleus or subcellular structures but mainly consist of Hb solution in the cytoplasm (Fig. 1a). A typical human RBC has a thickness of 2-3 μm, diameter of 6-8 μm, cell volume of 90 fl, and surface area of approximately 136 μm2 (Kenneth,2010). Depending on species, RBC shape and size vary. In mammals, RBCs develope from nucleated progenitor cells in bone mellow but RBCs discard their nucleus as they mature, whereas RBCs of other vertebrates have nuclei. Throughout their life span of 100-120 days, human RBCs circulate the body delivering oxygen from the lungs to tissues. RBCs gradually lose their deformability with age and eventually rupture in spleen. The biconcave shape of normal RBCs has advantages in having deformability. Compared to a spherical shape, RBCs with biconcave shape have less volume for a given surface area, which can decrease bending energy associated with the membrane (Canham,1970).
2.2. Membrane cortex structure
The unique deformability of RBCs is mainly determined by the structures of RBC membrane cortex. The membrane of human RBC is a multicomponent structure comprised of three layers: (1) an external carbohydrate-rich layer, (2) the phospholipid bilayer with 4-5 nm thickness, embedded with transmembrane proteins, and (3) a 2-D triangular mesh-like spectrin cytoskeleton network attached to the surface bilayers. The mesh size of the spectrin network is 60-80 nm. The spectrin network is anchored to the phospholipid bilayer via juntional complexes and ankyrin proteins. Junctional complexes and ankyrin proteins can diffuse in the lipid membrane.
(c)(b)(a)
~ 8 µm
~ 2 µm
Volume ~ 90 flSurface area ~ 136 µm2
Figure 1. (a) RBC morphology. (b) Spectrin network measured by high resolution negative staining electron microscopy. (b) Schematic model of the red cell membrane. Reproduced, with permission, from (Liu, Derick et al.,1987; Tse and Lux,1999).
2.3. Viscoelastic properties of RBC
In a view of classical mechanics, soft biomaterials can be characterized by viscoelastic properties - exhibiting both energy-storing elastic and energy-dissipating viscous characteristics. RBC is a typical soft biomaterial showing unique viscoelastic properties (Hochmuth and Waugh,1987).

Measurement Techniques for Red Blood Cell Deformability: Recent Advances 169
2.3.1. Elastic property
Elastic property chracterizes deformability of a material when a force is applied. Since RBC cytoplasm mainly consists of Hb solution, the elastic properties of RBC is determined by RBC membrane cortex structures. RBC membranes are only a few molecules thick, and they can be treated with a 2-D continuum model. Although the deformation of RBC membrane is highly complex, it can be simply explained by three fundamental deformation modes: area expansion, shear, and bend of the membrane (Fig. 2).
Area expansion Shear Bend
Figure 2. Schematic illustrations of area expansion, shear, and bend modes of a 2-D membrane.
The elastic property of a 2-D membrane cortex is characterized by three mechanical elastic moduli: area expansion modulus K, shear modulus µ, and bending modulus B. The detailed explanations for three elastic moduli are described as follow:
Area expansion modulus. The area expansion (or compression) modulus K reflects the elastic energy storage produced by an isotropic area dilation or compression of the membrane surface. The area expansion modulus K is described as
,to
AT KA
(1)
where Tt, A0, and A correpond to the isotopic tensile force, the original surface area, and the increase in surface area, respectively (Hochmuth and Waugh,1987). The area expansion modulus of RBC membranes is mainly dominated by the elasticity of the bilayer. Interestingly, the lipid bilayer itself is highly inextensible; the stand-alone lipid bilayer area compression modulus was given in the range of 200-300 mN/m (Rawicz, Olbrich et al.,2000). However, RBC membranes exhibit significant area extensibility. There is a wide range of measured values for K of RBCs that fall into two groupings. (1) Values reported from micropipette-based studies are in the range of 300-500 mN/m (Evans,1973; Waugh and Evans, 1979). (2) Recently, measurements based on dynamic membrane fluctuations report K of RBC membranes in the range of 10-100 N/m (Gov, Zilman et al.,2003; Betz, Lenz et al., 2009; Park, Best et al.,2010; Park, Best et al.,2011; Byun, Higgins et al., in press). These two techniques sample mechanical responses of the RBC under very different loading conditions and they involve different components of the cell; micropipette-based studies mainly probes lipid-bilayer dominated behavior while membrane fluctuation measurements primarily analyze spectrin network dominated behavior. In addition, the area expansion modulus K of RBC membranes can be changed by temperature; the micropipette asiperation techniques measured K at 25 °C is 450 mN/m and the temperature dependency of K was found to be -6 mN/m°C. (Waugh and Evans,1979).

Blood Cell – An Overview of Studies in Hematology 170
Shear modulus. The shear modulus µ of a 2-D structure reflects the elastic energy storage associated with extension of the membrane surface with the same membrane area. The shear modulus µ is described as
2 2 ,2sT (2)
where Ts is the shear force and is the the extension ratio (Evans,1973). Shear modulus of lipid bilayers is essentially zero due to its fluidity nature; shear modulus of RBC is mainly contributed from the spectrin network. The shear moduli of RBC membranes have been extensively measured by micropipette aspiration; the values for µ are in the range of 6-10 µ N/m (Evans and La Celle,1975; Chien, Sung et al.,1978; Waugh and Evans,1979; Evans, Mohandas et al.,1984). Techniques based on optial tweezers (Lenormand, Hénon et al.,2001; Dao, Lim et al.,2003), magnetic twisting cytometry (Puig-de-Morales-Marinkovic, Turner et al., 2007), and dynamic membrane fluctuation measurements (Park, Best et al.,2010; Park, Best et al.,2011) have also reported consistent values for µ. The shear modulus µ is sensitive to the environment condition of the membrane. The shear modulus decreased as temperature increased from 5 to 45C (Waugh and Evans,1979). Decreasing pH significantly increase the shear modulus of RBC membranes, but increasing pH above 7.2 does not cause a significant change (Crandall, Critz et al.,1978). More interestingly, bimodal distributions in the values for µ were observed in independently reported data (Lenormand, Hénon et al., 2001; Park, Best et al.,2010), suggesting the nonlinear stiffening of spectrin network (Park, Best et al.,2011). Malaria invasion cause significant increases in shear moduli values (Mills, Diez-Silva et al.,2007).
Bending modulus. Bending modulus (or fluxural modulus) B of a membrane is determined by the energy needed to deform a membrane from its original curvature to some other curvature. The bending modulus B of a 2-D membrane is described as
1 2 3M B C C C (3)
where M is the bending momemt. C1 and C2 are two principle curvatures, and C3 is the curvature in the stress-free state (Helfrich,1973; Evans,1974). Bending of a 2-D structure involves both area compression and expansion. For a lipid bilayer structure, the bending modulus, area expansion (or compression) modulus, and the thickness of the bilayer are related by B=h2K/4, where h is the bilayer separation distance, and K is the compressibility of the bilayer (Helfrich,1973; Evans,1974). The elastic bending moduli B of lipid bilayer is determined by chemical compositions of the lipids, and there is a broad range of reported bending moduli for lipid bilayers (Boal,2002). The elastic bending moduli B of RBC membranes have been measured with various techniques. The values for the bending modulus measured by micropipette-based studies are in the range of 50 kbT (~ 10-19 Nm) where kb is Boltzmann constant, and T is the temperature (Evans,1983). The bending modulus B of RBCs does not significantly change with temperature (Nash and Meiselman,

Measurement Techniques for Red Blood Cell Deformability: Recent Advances 171
1985) or cell Hb concentration for both normal and sickle cells (Evans, Mohandas et al., 1984). The recent experiments (Betz, Lenz et al., 2009; Yoon, Hong et al., 2009) have also measured that the bending modulus of RBCs is of the order of 50 kbT. However, several other techniques have measured lower bending moduli of RBC membranes. Studies based on measurements of RBC membrane fluctuations reported membrane bending moduli in the range of 10 kbT (~ 10-22 J) (Brochard and Lennon,1975; Zilker, Engelhardt et al.,1987; Zilker, Ziegler et al.,1992; Park, Best et al.,2010; Park, Best et al.,2011).
2.3.2. Viscous property
While the elasticic property of RBC membranes characterizes its resistance to deformation, the viscous property characterized its resistance to a rate of deformation (Hochmuth and Waugh, 1987). The viscous properties of RBC membranes can be determined by 3-D cytoplasmic viscosity and 2-D membrane viscosity.
Cytoplasmic viscosity. The values for the 3-D viscosity of blood plasma and cytosolic Hb solutions are ~ 1 mPa·s and ~ 5 mPa·s, respectively (Cokelet and Meiselman,1968). Cytosolic viscosity depends on the concentration and viscosity of Hb. By measuring the dynamic contour fluctuations of RBC membrane, the cytoplasmic viscosity has been obtained in the range of 2-5 mPa·s (Yoon, Hong et al.,2009). Recently, the dynamic membrane fluctuation measurements retrieved the cytoplasmic visocity of the RBCs at physiological osmotic pressure as 5-6 mPa·s, and the cytosol viscosity increases monotonically from with increasing osmolality (Park, Best et al.,2011).
Membrane viscosity. The major source of viscous dissipation in RBC membranes is the membrane viscosity. During the recovery process after large deformation of RBCs, 2-D membrane viscosity dominates energy dissipation (Evans and Hochmuth,1976). The 2-D viscosity of lipid membranes 2D can be qualitatively related to a 3-D bulk visosity of phospholipid 3D as 2D ~3D ·d where d is the thickness of the 2D structure. For a typical lipid bilayer, 3D ~ 103 mPa·s and d ~ 1-10 nm, and thus 2D ~ 10-10-10-9 Ns/m. Reported surface viscosities for lipid bilayers are of the order of 10-10-10-9 Ns/m (Waugh,1982; Evans and Yeung,1994). Considering viscous dissipation due to a 2-D membrane viscosity, the modified version of the shear force from Eq. (2) is described as
2 22
ln2 ,2s DT
t
(4)
where t is time (Evans and Hochmuth,1976). Assuming the RBC membrane follows Kelvin-Voigt model, Eq. (4) can be simply expressed as
2 / .c Dt (5)
where tc is the recovery time after large deformation of RBC membranes (Evans and Hochmuth,1976). Typically, tc ~ 0.06 s at 37C (Hochmuth, Buxbaum et al.,1980), and thus if

Blood Cell – An Overview of Studies in Hematology 172
µ ~ 1-10 µN/m, ~ 0.06 – 0.6 µNs/m. The 2-D surface viscosity of RBC membranes has been measured by several experiments. Tether experiments performed on model membrane systems, where cytoskeleton structure was absent, obtained a resultant upper bound of 5×10-
3 µN·s/m for 2D (Waugh,1982). The diffusion constant of membrane-bound proteins can be used to calculate the membrane viscosity (Saffman and Delbrück,1975). Using this method, the 2-D membrane viscosity values of RBC membranes have been reported in the range of (0.5-14)x10-9 Ns/m with various technqiues including fluorescence photobleaching recovery (Golan and Veatch,1980), fluorescence photo-bleaching technique (Kapitza and Sackmann, 1980), and restriction of the lateral motion of membrane embedded proteins (Tsuji and Ohnishi,1986).
2.4. Mathematical models and simulations
Using mathematical models, the mechanics of the membrane cortex structures has been simulated. Using a worm-like-chain model with surface and bending energy, the force-displancement relations for the spectrin network of RBCs have been described (Discher, Boal et al.,1998; Dubus and Fournier,2006). The viscoelastic properties of the RBC membrane was described using an effective continuum membrane model that simulates a finite-thickess 2-D continuum plane model with in-plane shear modulus and bending modulus (Dao, Lim et al.,2003). Recently developed numerical models accurately describes the complex viscoelastic properties of RBCs deformabilty (Fedosov, Caswell et al.,2010).
3. RBC deformability and blood microcirculation
The RBC deformability can influence blood microcirculation since viscosity and flow can be significantly changed by the viscoelastic properties of RBCs.
3.1. Blood viscosity
Viscosity of liquid characterizes its resistance to flow under certain deforming force, especially shear stress. Under laminar flow conditions where particles move parallel to adjacent neighbors with minimal turbulence, the fluidity is classified by the dependence of viscosity to shear strain or shear stress: (1) Newtonian fluid, if the viscosity is independent of shear stress or shear strain so that shear stress is linearly proportional to shear strain, (2) non-Newtonian fluid whose viscosity either decrease (shear-thinning) or increase (shear-thickening) depending on the changes of shear stress (Merrill,1969).
Blood is non-Newtonian fluid which exhibits shear-thinning behavior. Blood viscosity decreases at high shear stress due to the deformation of RBCs, while it increases at low shear stress because RBCs aggregate with each others and form stacked coin structure, called rouleaux (Shiga, Maeda et al.,1990). For normal blood at 37°C, blood viscosity at high shear rate (100~200 s-1) is measured as 4 ~ 5 cP, while it increases rapidly up to 10 cP as shear stress decreases less than 10 s-1 (Rand, Lacombe et al.,1964).

Measurement Techniques for Red Blood Cell Deformability: Recent Advances 173
Whole blood is a two-phase liquid consisting of a liquid medium (plasma) and formed elements such as RBCs, white blood cells, and platelets. Thus, its viscosity is mainly determined by (1) viscous properties of plasma, (2) the fraction of RBCs in the blood (hematocrit, normal range is 42 – 47%), and (3) viscoelastic properties of the formed elements.
Hematocrit (%)
Visc
osity
(mPa
s)
0
20
40
60
80
100
120
10 20 30 40 50 600
0.11 s-1
0.51 s-1
2.0 s-1
20 s-1
(b)(a)
Aggregation
DeformationElongation andorientation
0.1 1 10 100 1000
1
10
100
Shear rate (s-1)
Visc
osity
(mPa
s)
Normal plasmaNormal red cells in plasmaHardened red cells in plasmaNormal red cells in fibrinogen-free plasma
VC-Veins Ven. AO-Art. Arterioles Cap.
Figure 3. (a) Apparent viscosity of blood as a function of shear rates. (b) Hematocrit effects on blood as a function of shear rates. Modified, with permission, from (Somer and Meiselman,1993; Baskurt,2007)
Plasma is a Newtonian fluid which viscosity in normal condition varies 1.10 ~ 1.35 cP at 37°C, while the viscosity of pure water is 1.0 cP at 20°C (Lowe, Drummond et al.,1980). Plasma proteins such as fibrinogen are thought to cause RBC aggregation by facilitating binding between RBCs. Elevated levels of fibrinogen concentration in plasma enhance RBC aggregation and thus it increases blood viscosity.
Formed elements in the stream lines of laminar flow of blood can be considered as the source of turbulence which significantly increases blood viscosity. Among formed elements, RBCs cause the most significant effects since RBCs concentration is the highest among the formed elements in blood. The blood viscosity increases as hematocrit increases; the hematocrit effect becomes more severe when shear stress decreases since more aggregation of RBCs takes place (Dormandy,1970; Baskurt,2007).
3.2. Blood flow in microcirculation
Microcirculation transports blood to the small vessels in the vasculature embedded within organs. The arterial side of vessels in the microcirculation, surrounded by smooth muscle cells, has the inner diameter of ~ 10 – 100 μm. Capillaries, parts of the microcirculation, have only one RBC thick, having the diameter of ~ 5 – 10 μm. Blood flow in microcirculation has low Reynold number and thus it is governed by Stoke’s law (Baskurt,2007). Flow dynamics in microcirculation requires deep consideration of (1) fluid dynamics in capillaries, (2) interaction between formed elements with vessel walls, and (3) the structure and network of microvessels. Blood flow in microcirculation is not only determined by the geometric features of blood vessels and hydrostatic blood pressure, but also affected by the rheological properties. RBC deformability can significantly alter blood flow in microcirculation (Chien,

Blood Cell – An Overview of Studies in Hematology 174
1987). The reduction in RBC deformability under certain physiological or pathological conditions results into the retardation of blood-flow thourgh the microcirculation, which plays important roles in the stages of peripheral vascular insufficiency (Reid, Dormandy et al.,1976); reduced RBC deformability in sickle cell disease and malaria results into occlusions in the microcirculation.
4. Measurement techniques for individual RBCs
4.1. Micropipette aspiration
Micropipette aspiration techniques have been extensively used to measure the mechanical properties of RBC membranes (Evans and La Celle,1975; Shiga, Maeda et al.,1990; Hochmuth, 2000). Micropipette aspiration uses a glass micropipette, having inner diameter of 1~3 μm, to apply negative pressure onto RBC membranes. When negative pressure is applied, RBC membrane is aspirated into the micropipette and the amount of aspiration depends on the viscoelastic properties of cell membrane. Detailed measurement techniques vary depending on the mechanical property of interest (Fig. 4): (1) measuring pressure necessary to aspirate the membrane when the aspirated distance is equal to the radius of the pipette; (2) measuring the ratio between aspirated length of membrane and the radius of the pipette in given pressure; (3) measuring pressure required to aspirate whole RBC inside the micropipette (Evans,1973; Evans and La Celle,1975). The area expansion modulus of RBC membranes can be measured by using micropipette aspiration based on Eq. (1); the measured value for K for normal RBCs at room temperature was 450 mN/m (Evans and Waugh, 1977). In order to measure the shear modulus of RBC membranes, the second method (Fig. 4b) can be used and the shear modulus µ of the RBCs can be related to the aspirated length (or “tongue length”) of membrane Dp as,
/ ~ / ,p p pD R pR (6)
where Rp is the radius of the micropipette, p is the applied pressure (Evans,1973; Chien, Sung et al.,1978). Using micropipette aspiration, the value for µ was measured as 91.7 µN/m (Evans, Mohandas et al.,1984).
(A) (C)(B)
Figure 4. Various methods for micropipette aspiration. (A) Measuring pressure P to aspirate the distance same with the micropipette radius. (B) Measuring the ratio between the aspirated length of membrane D and the micropipette radius at a certain negative pressure. (C) Measuring pressure Pt necessary to aspirate a whole RBC into the pipette. Reproduced, with permission, from (Evans and La Celle,1975)

Measurement Techniques for Red Blood Cell Deformability: Recent Advances 175
Micropipette asperation technique can measure the bending elastic modulus B of RBC membranes (Evans,1983; Shiga, Maeda et al.,1990). The value for B depends directly on the magitude of the aspiration pressure when RBCs start to buckle and inversely on the pipette area; measuring negative pressure with varying radius of the pipette can measure B of RBCs. The measured value for B was 43.5 kBT (Evans,1983). By measuring the time for recovering original shape from releasing negative pressure, the 2-D viscosity of RBC membranes can also be obtained by Eq. (5).
4.2. Atomic force microscopy
Atomic force microscopy (AFM) is a tip-scanning technique that images topographies of materials in atomic or molecular scale (Binnig, Quate et al.,1986). It uses a cantilever with a sharp tip as a probe. Depending on the amount of force to apply or sensitivity, diverse tip shapes are used such as triangular, parabolic, or cylindrical shapes (Weisenhorn, Khorsandi et al.,1993). As a tip scans over a sample with physical contact, the vertical motion of the tip is monitored by photodiodes which precisely detect small changes in laser beam position reflected from the tip. As shown in Figs. 5a-b, the topographic images of RBCs can be obtained in high spatial resolution; cytoskeleton structure of membrane can even be revealed (Kamruzzahan, Kienberger et al.,2004).
(a) (b)
10 µm 3 µm
(c) (d)
Figure 5. AFM measures RBC topography and deformability. (A) Topogram of normal RBCs. (B) Detailed texture of the RBC membrane surface. (C) Indentation depth measurement. (D) Different force-versus-indentation depth curves of RBCs in various conditions: a. anisocytosis; s. hereditary spherocytosis; d. G6PD deficiency; and n. normal condition. Reproduced, with permission, from (Kamruzzahan, Kienberger et al.,2004; Dulinska, Targosz et al.,2006)
Since AFM can apply forces to sample surfaces at the nN scales, it can measure mechanical properties of soft materials such as RBCs. The displacement of the stage required for the same deflection of the tip is different between solid- and soft-materials, from which applied forces can be calibrated. For a parabola-shaped or a spherical tip having the radius of curvature Rc, the indentation depth z relates an applied force F and a relative Young’s modulus E* (Weisenhorn, Khorsandi et al.,1993):
* 3/24( ) .
3cR
F E z (7)
The relative Young's modulus E* is defined as:
Blood Cell – An Overview of Studies in Hematology 176
2 2 21 2 1
1 2*1 2 1
1 1 11 for ,E EE E EE
(8)
where E1, E2, 1, and 2 are the Young’s moduli and Poisson ratios for the simple and the tip, respectively. Since typical value of E2 (~150 GPa for Si3N4 tip) is much greater than that of biological samples (1 ~ 100 kPa), the rightmost equation is valid for biological samples (Radmacher,1997). The Poisson ratio is 0.5 for a perfectly incompressible and elastic material deformed elastically; the Poisson ratio of soft tissues varies with 0.490 ~ 0.499 (Fung,1993). Young’s moduli of RBCs at various pathophysiological conditions have been measured using AFM. Young’s moduli of healthy RBCs have been obtained to be is 4.4 ± 0.6 kPa (Dulinska, Targosz et al.,2006). RBCs from hereditary spherocytosis, thalassemia (Dulinska, Targosz et al.,2006) and diabetes mellitus (Fornal, Lekka et al.,2006), and sickle cell traits (Maciaszek and Lykotrafitis,2011) have measured.
4.3. Optical tweezers
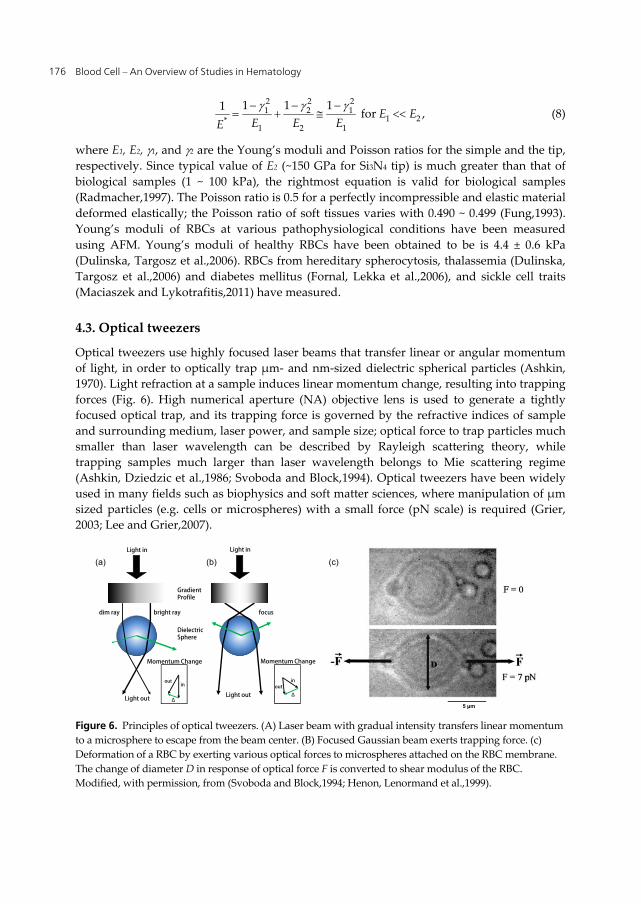
Optical tweezers use highly focused laser beams that transfer linear or angular momentum of light, in order to optically trap μm- and nm-sized dielectric spherical particles (Ashkin, 1970). Light refraction at a sample induces linear momentum change, resulting into trapping forces (Fig. 6). High numerical aperture (NA) objective lens is used to generate a tightly focused optical trap, and its trapping force is governed by the refractive indices of sample and surrounding medium, laser power, and sample size; optical force to trap particles much smaller than laser wavelength can be described by Rayleigh scattering theory, while trapping samples much larger than laser wavelength belongs to Mie scattering regime (Ashkin, Dziedzic et al.,1986; Svoboda and Block,1994). Optical tweezers have been widely used in many fields such as biophysics and soft matter sciences, where manipulation of μm sized particles (e.g. cells or microspheres) with a small force (pN scale) is required (Grier, 2003; Lee and Grier,2007).
GradientProfile
DielectricSphere
focusbright raydim ray
Momentum Change Momentum Change
outin
Δ
outin
Δ
Light in Light in
Light out Light out
5 µm
(a) (b) (c)
Figure 6. Principles of optical tweezers. (A) Laser beam with gradual intensity transfers linear momentum to a microsphere to escape from the beam center. (B) Focused Gaussian beam exerts trapping force. (c) Deformation of a RBC by exerting various optical forces to microspheres attached on the RBC membrane. The change of diameter D in response of optical force F is converted to shear modulus of the RBC. Modified, with permission, from (Svoboda and Block,1994; Henon, Lenormand et al.,1999).

Measurement Techniques for Red Blood Cell Deformability: Recent Advances 177
Since optical tweezers can apply forces at the pN level, it has been employed for measuring the deformability of RBCs. Measurements of the mechanical properties of RBCs with optical tweezers can be done either by applying optical force to microspheres attached to RBCs (Henon, Lenormand et al.,1999; Dao, Lim et al.,2003) or stretching RBCs by diverging beams from opposite directions (Guck, Ananthakrishnan et al.,2001). In the former approach, two silica beads are attached to the opposite sides of a RBC, then these beads are trapped with a Nd:YAG laser beam ( = 1064 nm) with maximum power of ~ 605 mW, corresponding maximum optical force is 80 pN (Henon, Lenormand et al.,1999). The change in the projected diameter of the RBC in response of optical force is converted to shear modulus of the RBC using mathematical membrane models. The shear modulus of discotic RBCs were measured as ~ 10 μN/m (Dao, Lim et al.,2003). Using optical twezers system with a high power laser, the shear modulus values of RBCs under large deformation (corresponding to 400 pN) was measured as 11-18 μN/m while initial values were 19-30 μN/m, showing hyperelastic constitutive response (Lim, Dao et al.,2004). Optical stretcher, a variant of optical tweezers, uses two diverging laser beams from opposite directions (Guck, Ananthakrishnan et al.,2001). Linear momentum changes by two laser beams apply stretching force to the RBC along the optical axis, and the RBC deformations under varying optical force are measured from which mechnical properties are retrieved. Optical tweezers can also be used for detecting membrane fluctuation dynamics of RBCs by imposing a deformation (Yoon, Kotar et al.,2011).
4.4. Magnetic twisting cytometry
Magnetic twisting cytometry (MTC) applies both static and oscillating magnetic field to ferromagnetic microbeads attached to the surface of cell membrane (Wang, Butler et al.,1993). Depending on the applied magnetic field, the microbeads exhibit both translational and rotational motion, which applies torques to the cell membrane. The motion of beads is recorded by a CCD camera, and the stiffness G’ and loss modulus G of the membrane can be obtained by analyzing the displacement of bead in response to applied torque. By varying oscillating frequency (0.1 to 100 Hz) and the magnitude of applied magnetic field (~ 1 - 10 Gauss), the stiffness and loss modulus of RBC membranes are measured at different driving frequencies (Puig-de-Morales-Marinkovic, Turner et al.,2007).
(a) (c)(b)
Figure 7. Magnetic Twisting Cytometry (a) Bright field and (b) Scanning electron microscopy images of RBCs with ferromagnetic beads attached. (c) Principles of magnetic twisting cytometry. Reproduced, with permission, from (Puig-de-Morales-Marinkovic, Turner et al.,2007)

Blood Cell – An Overview of Studies in Hematology 178
The torsional stiffness modulus is independent of frequency, whose value is ~ 10-3 Pa/nm at sinusoidal magnetic field of 1 G, while the loss modulus increases as frequency increases; these values correspond to the bending moduli in the range of 0.2 - 0.8 pN·μm and the shear moduli in the range of 6-12 μN/m (Puig-de-Morales-Marinkovic, Turner et al.,2007). MTC technique also revealed dramatic increases in the stiffness of malaria-infected RBC at the febrile temperature (41°C) (Marinkovic, Diez-Silva et al.,2009).
4.5. Quantitative phase imaging
Quantitaitve phase imaging technqiues measure the electric field, i.e. amplitude and phase images whereas conventional brightfield microscopy only images light intensity (Fig. 8) (Popescu, 2011). Employing the principle of laser interference, electric field information of target sample is modulated onto intereferograms recorded by a CCD camera. By using appropriate field retrieval algorithms, the field information can be retrieved from the measured holograms (Debnath and Park, 2011). Typical interferogram and quantitative phase image of a RBC are shown in Fig. 8b-c. Quantitative phase imaging techniques can measuring dynamic membrane fluctuations of RBCs (Popescu, Ikeda et al.,2005; Popescu, Park et al.,2008; Park, Best et al.,2011) as well as cellular dry-mass (Popescu, Park et al.,2008). Dynamic membrane fluctuation, consisting of submicron displacement of the membrane, has a strong correlation with deformability of RBCs and can be altered by biochemical changes in protein level (Waugh and Evans,1979). By measuring membrane fluctuation of RBCs, bending modulus and tension factor of RBCs were calcualated (Popescu, Ikeda et al., 2006).
(a)
20 pixels 1.5um
[rad]
0
0.5
1
1.5
2
2.5(b) (c)
Figure 8. Quantitative phase imaging. (A) Schematic of the principle of quantitative phase imaging. (B) Measured interferogram and (C) retrieved phase image of a RBC using quantitative phase imaging. Reproduced, with permission, from (Park, Best et al.,2011).
Diffraction phase microscopy (DPM), a highly stable technique for quantitative phase imaging, has been widely used for investigating the deformability of RBCs. Employing common-path laser interferometry, DPM provides full-field quantitative phase imaging with unprecedented stability (Park, Popescu et al.,2006; Popescu, Ikeda et al.,2006). DPM measured spatiotemporal coherency in dynamic membrane fluctuations (Popescu, Park et al.,2007), shear modulus for the RBCs invaded with malaria-inducing parasite Plasmodium falcifarum (Pf-RBCs) (Park, Diez-Silva et al.,2008), and effective viscoelastic properties of RBCs (Wang, Ding et al.,2011). Recently, integrated with a mathematical model, DPM provide the mechanical properties of individual RBCs from membrane fluctuations: shear modulus, bending modulus, area expansion modulus, and cytoplasmic viscosity (Park, Best

Measurement Techniques for Red Blood Cell Deformability: Recent Advances 179
et al.,2010). Several alterations in the deformability of RBCs have been studied using DPM, including the effects of ATP (Park, Best et al.,2010; Ben-Isaac, Park et al.,2011), the nonlinear behavior of RBC deformability in response to different osmotic pressure (Park, Best et al., 2011), and malaria egress mechanism (Chandramohanadas, Park et al.,2011). Employing spectroscopic quantitative phase imaging, cytoplasmic Hb concentration that is tightly related to the cytoplasmic viscosity, can also be simultaneously quantified (Park, Yamauchi et al.,2009; Jang, Jang et al.,2012). In addition, polarization-sensitive quantitative phase microscopy will be potentially used for the study of sickle cell disease and its implications to RBC deformability (Kim, Jeong et al.,2012).
4.6. Dynamic light scattering
Dyanmic light scattering signals provide rheological information about RBCs (Tishler and Carlson, 1987; Amin, Park et al.,2007). Although dynamic light scattering have been extensively used in combination with ektacytometry, it provides averaged signals from many RBCs. Thus it is difficult to access the deformability of individual RBCs.
Fourier transform light scattering (FTLS) provides both static and dynamic light scattering signal from individual cells. Light field, measured by quantitative phase microscopy or digital holographic microscopy, contains both amplitude and phase information, and thus far-field light scattering pattterns can be directly calculated by numerically propagating the measured field – technically applying Fourier transformation (Ding, Wang et al.,2008). FTLS technique can provide both morphological and rheological information about individual biological cells. By analyzing dynamic light scattering signals measured by FTLS, one can qualitatively access the membrane surface tension and viscosity of individual RBCs (Park, Diez-Silva et al.,2010). Due to its capability of measuring light scattering signals from individual cells with high signal-to-noise ratio, FTLS has been employed to study several pathophysiological effects to the deformabiltiy of RBCs, including malaria infection (Park, Diez-Silva et al.,2010), depletion of ATP (Park, Best-Popescu et al.,2011), and sickle cell disease (Kim, Higgins et al.,2012).
5. Measurement techniques for blood rheology
5.1. Blood viscometer and ektacytometry
Blood viscometer measures the viscosity of blood over a wide range of shear rates. Blood viscometer controls either shear stress or shear rate of blood using rational objects. Stress-controlled blood viscometer applys a constant torque which corresponds to constant rotational speed in a well-designed rotational rheometer. In a rate-controlled system, applied torque is controlled by a stress-sensing device so that a constant rotational speed is achieved. Viscometers can be classified by the cylinder shape: a concentric cylinder, a cone plate, and a parallel plate viscometer (Fig. 9).
Cylinder-type viscometer uses two concentric cylinders: a rotational inner cup and a stationary outer cylinder. Time-independent shear rate can be precisely measured by

Blood Cell – An Overview of Studies in Hematology 180
concentric cylinder viscometer (Nguyen and Boger,1987). Cone and plate viscometer rotates an inverted cone having very shallow angle (~ 5°); the shear rate under the plate is maintained consistently and independent of a flow curve. Parallel plate viscometer is a simplified version of the cone and plate viscometer and has a advantage of flexible space between two parallel plates. The viscous fluid can confined and rotated in narrow space between two circular parallel plates (Gent,1960).
Figure 9. Schematic diagrams of typical viscometers. (a) Concentric cylinder viscometer (or Couette viscometer), (b) cone and plate viscometer, and (c) parallel plate viscometer. (d) Experimental setup of ektacytometer.
Ektacytometer employes a laser diffraction technique with blood viscometer in order to measure RBC deformabiltiy. Conventional blood viscometer applys controlled shear stress to the RBCs in the blood viscometer, and deformability of RBCs can be measured from laser diffraction pattern. Ektacytometer consists of a concentric rotational outer cup and a stationaly inner cylinder; outer cup produces varying shear stress field on blood (Fig. 9d). Through the measurement of diffraction patterns of the laser passing through the blood, RBC deformability can be obtained. The RBC deformation is quantitatively calculated from the scattered laser beam intensity pattern. Under a certain shear rate, isointensity curves in the intensity pattern of the scattered beam will show elliptical shapes, which represent elliptically deformed RBC population (Bessis, Mohandas et al.,1980). From the measured isointensity curves, a deformaion index (DI) of RBCs is calculated as
,l sDIl s
(9)
where l and s are distances along the long- and short- axes in the elliptical isointensity curves. DI values are measured at different angular velocities (and thus different shear rate) of the outer cyliner in the ektacytometer. Ektacytometer is a simple and effective technique to measure the deformability of RBC population, and it has been widely used for the study pathophysiology of RBCs. Abnormal deformability in RBCs from patients with hereditary pyropoikilocytosis, hereditary spherocytosis, and Hb CC disease were studies by ektacytometer (Mohandas, Clark et al.,1980).
5.2. Microfluidic device technique
Microfluidic device has emerged as a promising tool to precisely control fluids with small volumes of fluid containing samples and reagents in channels with dimensions of 10-100

Measurement Techniques for Red Blood Cell Deformability: Recent Advances 181
μm. Microfludic device reduced space, labor, and measurement time on numerous experiments, and also enabled precise control and manipulation of the small volume of samples. Microfludic device has been used to study the deformabiltiy of RBCs. Microfluidic channel with a few micrometer diameter mimics micro-capillary structure in blood circulation system. Rheological behaviors of Pf-RBCs were studies in microfludic devices (Shelby, White et al.,2003). Microfludic device was used to induce large deformation of RBCs and its mechanical behavior was studied (Fig. 10) (Li, Lykotrafitis et al.,2007) .
0 s 0.4 s 0.8 s 1.4 s
Figure 10. (a-d) Snapshot showing the fluidization of a healthy RBC when it passes through a microfluidic channel. Reproduced, with permission, from (Li, Lykotrafitis et al.,2007).
For the study of sickle cell disease, microfluidic device has been used to measure the resistance change rate of blood flow under the sudden change of oxygen concentration (Wang, Ding et al.,2011). Recently, microfludic channels with obstracles have measured the deformabiltiy of malaria infected RBCs in high throughput (Bow, Pivkin et al.,2011; Diez-Silva, Park et al.,in press).
5.3. Filtration test
Filtration test measures RBC deformabiltiy using a membrane filter with holes of diameter of 3-5 μm (JANDL, SIMMONS et al.,1961). By applying a negative pressure, whole blood is subject to pass through holes in the membrane filter. The deformability of RBCs can affect the speed of flow. RBC deformabiltiy can be calculated from either the flow time or the volume of blood filteres in a certain amount of time (~1 min). Since the filteration test requires for a relatively simple instrument and provides clinically relevant results with high reproducibility, it has been widely used in various studies related to RBC deformability, including the effects of diabetes (Juhan, Buonocore et al.,1982), spesis (Baskurt, Gelmont et al.,1998), sickle cell disease (JANDL, SIMMONS et al.,1961), and oxygen radical (Srour, Bilto et al.,2000).
6. Pathophysiological coditions affecting RBC deformability
Mechanical properties of RBCs is crucial for cell physiology of RBCs. This essential deformability is in turn affected by various physiological and pathological cues.
6.1. Temperature
Temperature plays important roles in RBC deformabilty. The elastic properties of RBC membrane were investigated as function of temperature using the micropipette aspiration

Blood Cell – An Overview of Studies in Hematology 182
technique (Waugh and Evans,1979). Over the temperature range of 2-50C, both the shear modulus and the area expansion modulus decrease as temperature increased; the changes were -610-2 μN/mC and 6103 μN/mC, respectively. Due to the structual transitions of proteins occuring at certain critical tempertures, RBC deformabiltiy exhibits complex behaviors. At the transition temperature, RBCs undergo a sudden change from blocking to passing through a micropipette with a diameter of ~ 1 μm (Artmann, Kelemen et al.,1998). Body temperature or febril temperature are particularly important in various pathophysiology of RBCs. Membrane fluctuation measurements using DPM revealed that the shear modulus of Pf-RBCs significantly increases as temperature increases from body temperature to febrile temperature whereas healthy RBCs do not show noticible changes (Park, Diez-Silva et al., 2008). MTC study also reported that Pf-RBCs becomes significantly stiffened with temperature compared to the healthy RBCs (Marinkovic, Diez-Silva et al.,2009).
6.2. Morphology
RBCs exhibit diverse morphological features depending on pathophysiological conditions (Diez-Silva, Dao et al.,2010). A healthy human RBC shows a smooth and biconcave disc shape (discocyte). However, atypical shapes of RBCs can be found under abnormal pathophysiological conditions, including acanthocyte, stomatocyte, schizocyte, and tear drop cells (Kenneth,2010). Our understanding of what determines RBC morphology and how RBC morphologies are related to the mechanics of RBCs still remains incomplete. One of the hypotheses describing RBC morphology is the bilayer-couple hypothesis (Sheetz and Singer,1974); small changes in the relaxed area difference between two layers of phospholipids. Later, this model can be used for explaning stomatocyte–discocyte–echinocyte morphological transitions (Lim HW, Wortis et al.,2002).
(a) (c)
(d) (e) (f)
(b)
Figure 11. (a-c) Topographies of (a) discocyte, (b) echinocyte, and (c) spherocyte. (d-f) Retrieved mechanical properties: (d) bending modulus , (e) shear modulus µ, and (f) area modulus KA of discocytes (DCs), ATP-depleted discocytes [DCs (-ATP)], echinocytes (ECs), and spherocytes (SCs). Reproduced, with permission, from (Park, Best et al.,2010)

Measurement Techniques for Red Blood Cell Deformability: Recent Advances 183
Increased deformability of RBCs in abnormal shapes has been reported with various experimental methods. Ektacytometer measured increased DI values for SCs and ECs that were induced by 2,4-dinitrophenol treatment (Meiselman,1981). Recently, using DPM, the mechanical properteis of RBCs in different morphologies were quantified from dynamic membrane fluctuations (Park, Best et al.,2010). Bending modulus and area expansion modulus of ECs and SCs showed significantly high values compared to normal DCs. The shear moduli values show bimodal distributions (Fig. 11e), suggesting two independent conformations of the spectrin network: a soft configuration (µ ~ 7 µN/m) and a stiff one (µ ~ 12 µN/m). Aging of RBCs also cause significant morphological alterations: aged RBCs exhibit decreased surface area and volume (Waugh, Narla et al.,1992). The aged RBCs were found by ektacytometry to have decreases shear modulus mainly because of decreased surface area and increased cytoplasmic viscosity.
6.3. Osmotic pressure
Different osmolalities of extracellular medium can bring significant changes in RBC shape and thus deformability. At normal physiological condition (295mOsm/kg), RBCs maintain their biconcave shapes. In hypotonic medium, RBCs are swollen due to water intake. At the osmotic pressure less than 100mOsm/kg, most of RBCs are lysed. In the hypertonic case, RBCs lose its volumes, which result in significant cell shrinkage. Although the total amount of Hb molecules in RBCs, or the mean corpuscular Hb (MCH), does not significantly change at different osmolality, Hb concentration can be considerably changed due to water influx and efflux. RBCs exhibit the maximum deformability at physiological condition; under either hypertonic or hypotonic condition, the deformability of RBCs decreases (Mohandas, Clark et al.,1980).
0 100 200 300 400 5000
20
40
60
80
100
DI (%)
Osmolarity (mOsm/kg)
40
50
60
70
0 100 200 300 400 500Osmolarity (mOsm/kg)
Membrane fluctuation (nm)
0 200 400 600 8000
5
10
15
0
20
40
60
[mPa.s], K A[mNm-1]
[mN/m], [xk BT]
KA
(a) (b) (c)
Osmolarity (mOsm/kg)
Figure 12. (a) DI of RBCs as a function osmolality, measured by ektacytometer. Modified, with permission, from (Mohandas, Clark et al.,1980). (b) Membrane fluctuations of RBCs as a function of osmotic pressure, measured by DPM. (c) Retrieved mechanical properties of RBCs from membrane fluctuations. 20 individual RBCs were measured at each osmotic pressure. Modified, with permission, from (Park, Best et al.,2011).
A recent study, based on membrane fluctuation measurements, retrieved mechanical properties of RBC membrane under diffferent osmolarities (Park, Best et al.,2011). Although membrane fluctuation or deformability decreases either in hypotonic or hypertonic case; the

Blood Cell – An Overview of Studies in Hematology 184
reasons for the decreased deformability are different. Under hypotonic cases, both shear moduli and area expansion moduli increase, suggesting nonlinear stiffening in streached membrane structure. Under hypertonics cases, other mechanical parameters are not significantly changed except that cytoplasmic viscosity increases.
6.4. ATP effect
The presence of adenosine 5’-triphosphate (ATP) is important in maintaining the biconcave shape of RBCs and also significantly affects the RBC deformability. In the absence of ATP, RBCs loss its biconcave shapes and become flattened echinocytes (Sheetz and Singer,1977). The metabolic state of RBCs, determined by the level of ATP, is crucial for maintaining cellular deformability. When celullar ATP level decreases, the stored RBCs significantly lose the deformability (Weed, LaCelle et al.,1969). Micropipette aspiration technqiue measured mechanical properties of RBCs upon ATP depletion; shear modulus and elastic area compression modulus increase by 17% and 14%, respectively (Meiselman, Evans et al.,1978). Decreased membrane fluctuation in the absence of ATP was first observed by using dark-field microscopy (Tuvia, Levin et al.,1998). Membrane fluctuation measurements studied the effects of ATP to the mechanical properties of RBCs (Betz, Lenz et al.,2009; Park, Best et al.,2010). Analysis on dynamic membrane fluctutions further showed non-Gaussian dynamics in the presence of ATP, suggesting the metabolic remodelling in the lipid membrane and spectrin network structure (Park, Best et al.,2010). ATP-dependent RBC deformability has been also studied using theoretical models (Gov and Safran,2005; Ben-Isaac, Park et al.,2011).
6.5. Malaria: Parasite invasion
Pathogenesis of malaria causes structural and mechanical modifications to the host RBCs. During intra-erythrocytic development, the malaria-inducing parasite exports proteins that interact with the host cell membrane and spectrin cytoskeletal network (Simmons, Woollett et al.,1987). Parasite-exported proteins modify material properties of host RBCs, resulting in altered cell circulation. Despite the genetic and biochemical approaches identified, proteins exported by parasites have remained elusive as well as the mechanism and effect of these proteins on the host cells.
Pf-RBCs exhibits significantly decreased deformability. Microfluidic technique demonstrated the occlusion of small channels by infected RBCs (Shelby, White et al.,2003). Optical tweezers technique measured that membrane shear modulus continuously increases as the disease progesses during the intraerythrocytic cycle (Suresh, Spatz et al.,2005). Employing genetic knock-out assay, the effects of RESA protein to the host RBC deformabiltiy has been studied (Mills, Diez-Silva et al.,2007). Membrane fluctuation measurement also showed increased shear modulus of malaria-invaded RBCs (Park, Diez-Silva et al.,2008). Recently, the loss of deformability in the malaria-invaded RBCs has been simulated using multiscale numerical models (Fedosov, Lei et al.,2011).

Measurement Techniques for Red Blood Cell Deformability: Recent Advances 185
(a)(b)
Healthy RBC
Pf-RBC (Schizont stage)
sporozitesInside the liver
Liver
merozoite
InsideRed Blood Cells
Ringgamatocyte
gamates
Ookinete
Oocyst
Salivary gland
sexual cycle
Inside the mosquito
Schizont
Hemozoin
Parasitophorusvacuoles
Trophozoite
Figure 13. Malaria parasite life cycle in human body. Reproduced, with permission, from (Cho, Kim et al.,2011). (b) Optical images of a healthy RBC and a Pf-RBC (schizont stage) stretched by optical tweezers. Reproduced, with permission, from (Suresh, Spatz et al.,2005).
6.6. Genetic diseases: sickle cell disease
Sickle cell disease, characterized by abnormal rheological properties and a sickle-shape of RBCs, is an autosomal recessive inherited blood disorder. A point mutation in β-globin gene encoding Hb results in the production of sickle Hb (HbS) instead of normal Hb (HbA) (Barabino, Platt et al.,2010). Under deoxygenated conditions, HbS molecules becomes self-assembled and grows to fibers inside RBCs up to a few micrometer lengths. Due to these highly stiff HbS fibers, sickle RBCs have elongated- and crescent-shape at deoxygenated conditions and the deformabiltiy of sickle RBCs significantly decreases.
Sickle RBCs have different morphologies depending on its density (Kaul, Fabry et al.,1983; Evans, Mohandas et al.,1984). After repeated sicklings, a fraction of RBCs becomes irreversibly sickled cells and they exhibit the most significant loss in deformability. While Hb concentrations does not affect static rigidity of normal RBCs, static rigidity of sickle RBCs depends on Hb concentration (Evans, Mohandas et al.,1984). Earlier studies using ektacytometry and filteration techniques reported decreased deformability of sickle RBCs even under oxygenated conditions (Chien, Usami et al.,1970; Klug, Lessin et al.,1974).
Quantitative phase microscopy measured decreased membrane fluctuations for sickle RBCs (Shaked, Satterwhite et al.,2011). FTLS showed significantly altered elastic and viscous membrane properties in sickle RBCs (Kim, Higgins et al.,2012). Recently, four important mechanical properties of sickle RBCs were retrieved with memebrane fluctuations measurements (Byun, Higgins et al.,under review). Using AFM technique, decresed deformability was measured in sickle RBCs (Maciaszek, Andemariam et al.,2011). RBCs in sickle cell trait, having only one abnormal allele of the Hb beta gene, also exhibit decreased deformability compared to healthy RBCs (Maciaszek and Lykotrafitis,2011).

Blood Cell – An Overview of Studies in Hematology 186
(b) (c) (d)
5 μm0
1
2
3[μm]
(a)
SpectrinMembrane
Cytoskeleton
Normal Cellmembrane
Unexposed transmembrane segment
Abnormal cellmembrane
Hbpolymer
Exposed transmembrane segment
PS flip
PSTransmembraneprotein
Transmembraneprotein
Figure 14. (a) Illustration showing structural modifications inside a sickle RBC. Modified, with permission, from (Barabino, Platt et al.,2010). (b-d) Typical morphologies of sickle RBCs measured by DPM; (b) echinocyte, (c) discocyte, and (d) crescent-shaped irreversibly sickled cell. Reproduced, with permission, from (Kim, Higgins et al.,2012).
6.7. Other conditions altering RBC deformability
There are still many pathophysiological conditions that affect the deformabiltiy of RBCs, which are not covered in the above sections. Several hereditary disorders associated with formation of RBC membrane structures and Hb protein can result into altered RBC deformability. Thalassemias, causing the formation of abnormal Hb molecules due to the limited synthesis of the globin chain, results into loss of RBC deformability. Thalassemia is thus often accompanied by the destruction of a large number of RBCs in spleen, accompanying with the enlargement of spleen. In addition, abnormal Hb molecules in thalassemia often caues the formation of Heinz bodies, inclusions within RBCs composed of denatured Hb, and it causes the local rigidification of RBC membrane (Reinhart, Sung et al., 1986). Ektacytometer study measured that RBCs in hereditary spherocytosis showed markedly diminished deformability while their surface/volume ratio was normal (Nakashima and Beutler,1979). RBCs from the patients with homozygous hereditary elliptocytosis exhibits marked abnormalities in deformability and membrane fragility; these changes are closely related to the reduced levels of band 4.1 proteins (Tchernia, Mohandas et al.,1981). Since band 4.1 plays an important role in the modulation of spectrin-actin interaction, it has been suggested to be closely related to the maintenance of normal

Measurement Techniques for Red Blood Cell Deformability: Recent Advances 187
membrane shape and deformability. In addition, it will be possible to study RBC deformability in vivo in the near future, by directly imaging and manipulating RBCs through highly scattering skin tissues. Recent works have demonstrated that it is indeed possible to control and suppress multiple light scattering (Vellekoop, Lagendijk et al.,2010; Vellekoop and Aegerter,2010; Mosk, Lagendijk et al.,2012; Park, Park et al.,2012; Park, Park et al.,2012). In diabetes mellitus, RBCs exhibit reduced deformability (McMillan, Utterback et al.,1978), which has been attributed to the changes in lipid composition of the membranes. This impaired RBC deformability in diabetes occurs before significant histological vascular changes (Diamantopoulos, Kittas et al.,2004). RBCs from the patients with diabetes mellitus undergoes substantial alterations in the lipid composition, membrane proteins, and Hb molecules. Saturated fatty acid levels in diabetes mellitus were significantly elevated compared to normal RBCs while the amount of polyunsaturated fatty acids were decreased in diabetes (Prisco, Paniccia et al.,1989).
7. Conclusion and outlook
We have highlighted techniques for studying RBC deformabilty. Due to various deformability test techniques developed in the last years, our understandings on pathophysiology of RBCs have been significantly improved. Recent advances have enabled the precise measurements of various biomechanical properties of RBCs under systemically controlled conditions that mimic complex in vivo physiological environments. However, three major technical issues should be resolved in order to bring a much significant impact. First, the molecular mechanisms on RBC deformability should be directly accessed and studied. Employing biochemical assays such as molecular imaging and genetic knock-out methods, the relation between molecule-level changes and cellular-level deformability alterations can be studied. Second, such measurements should be performed at individual cell levels. Profiling mechanical, chemical, and biological properties at the cellular levels and their correlations may allow accessing to unexplored regimes of diseases mechanisms. Third, interactions between cell-to-protein, cell-to-cell, and cell-to-vessel should be considered, since these interactions can be affected and in turn modify RBC deformability. As more knowledge is gained about the pathophysiology of RBCs and their circulation through biomechanical studies, the potential for the development of novel diagnostic and treatment strategies for various RBC-related disease will become real and answer to important questions in hematology.
Author details
Youngchan Kim, Kyoohyun Kim and YongKeun Park Department of Physics, Korea Advanced Institute of Science and Technology, Daejeon, South Korea
Acknowledgement
The authors wish to acknowledge supports from KAIST, KAIST Institute for Optical Science and Technology, Korean Ministry of Education, Science and Technology (MEST) grant No.

Blood Cell – An Overview of Studies in Hematology 188
2009-0087691 (BRL), and National Research Foundation (NRF) (2011-355-c00039, 2012R1A1A1009082). YKP acknowledges support from TJ ChungAm Foundation. KHK is supported by Global Ph.D. Fellowship from NRF of Korea.
8. References
Amin, M., Y. Park, et al. (2007). "Microrheology of red blood cell membranes using dynamic scattering microscopy." Opt Express 15(25): 17001-17009.
Artmann, G., C. Kelemen, et al. (1998). "Temperature transitions of protein properties in human red blood cells." Biophysical Journal 75(6): 3179-3183.
Ashkin, A. (1970). "Acceleration and trapping of particles by radiation pressure." Physical Review Letters 24(4): 156-159.
Ashkin, A., J. M. Dziedzic, et al. (1986). "Observation of a Single-Beam Gradient Force Optical Trap for Dielectric Particles." Opt Lett 11(5): 288-290.
Barabino, G. A., M. O. Platt, et al. (2010). "Sickle cell biomechanics." Annual review of biomedical engineering 12: 345-367.
Baskurt, O. K. (2007). Handbook of hemorheology and hemodynamics, Ios Pr Inc. Baskurt, O. K., D. Gelmont, et al. (1998). "Red blood cell deformability in sepsis." American
journal of respiratory and critical care medicine 157(2): 421-427. Ben-Isaac, E., Y. K. Park, et al. (2011). "Effective Temperature of Red-Blood-Cell Membrane
Fluctuations." Physical Review Letters 106(23): 238103. Bessis, M., N. Mohandas, et al. (1980). "Automated ektacytometry: a new method of
measuring red cell deformability and red cell indices." Blood cells 6(3): 315. Betz, T., M. Lenz, et al. (2009). "ATP-dependent mechanics of red blood cells." Proc. Natl.
Acad. Sci. U. S. A. 106(36): 15312–15317. Binnig, G., C. F. Quate, et al. (1986). "Atomic force microscope." Physical Review Letters 56(9):
930-933. Boal, D. (2002). Mechanics of the Cell, Cambridge Univ Pr. Bow, H., I. V. Pivkin, et al. (2011). "A microfabricated deformability-based flow cytometer
with application to malaria." Lab on a chip. Brochard, F. and J. F. Lennon (1975). "Frequency spectrum of the flicker phenomenon in
erythrocytes." J. Physique 36: 1035-1047. Byun, H.-S., J. Higgins, et al. (in press). "Non-invasive measurement of biomechanical
properties of individual erythrocytes from sickle cell anemia patients." Acta Biomat. Canham, P. B. (1970). "The minimum energy of bending as a possible explanation of the
biconcave shape of the human red blood cell*." Journal of Theoretical Biology 26(1): 61-81. Chandramohanadas, R., Y. K. Park, et al. (2011). "Biophysics of Malarial Parasite Exit from
Infected Erythrocytes." PLoS ONE 6(6): e20869. Chien, S. (1987). "Red Cell Deformability and its Relevance to Blood Flow." Annual. Rev.
Physiol. 49(1): 177-192. Chien, S., K. Sung, et al. (1978). "Theoretical and experimental studies on viscoelastic
properties of erythrocyte membrane." Biophysical Journal 24(2): 463-487. Chien, S., S. Usami, et al. (1970). "Abnormal rheology of oxygenated blood in sickle cell
anemia." Journal of Clinical Investigation 49(4): 623.

Measurement Techniques for Red Blood Cell Deformability: Recent Advances 189
Cho, S., S. Kim, et al. (2011). "Optical imaging techniques for the study of malaria." Trends in biotechnology 30(2): 71-79.
Cokelet, G. R. and H. J. Meiselman (1968). "Rheological comparison of hemoglobin solutions and erythrocyte suspensions." Science 162(3850): 275-277.
Crandall, E., A. Critz, et al. (1978). "Influence of pH on elastic deformability of the human erythrocyte membrane." American Journal of Physiology-Cell Physiology 235(5): C269-C278.
Dao, M., C. Lim, et al. (2003). "Mechanics of the human red blood cell deformed by optical tweezers." Journal of the Mechanics and Physics of Solids 51(11-12): 2259-2280.
Debnath, S. K. and Y. Park (2011). "Real-time quantitative phase imaging by spatial phase shifting algorithm." Optics Letters 36(23): 4677-4679.
Diamantopoulos, E., C. Kittas, et al. (2004). "Impaired erythrocyte deformability precedes vascular changes in experimental diabetes mellitus." Hormone and metabolic research 36(3): 142-147.
Diez-Silva, M., M. Dao, et al. (2010). "Shape and biomechanical characteristics of human red blood cells in health and disease." MRS bulletin 35(05): 382-388.
Diez-Silva, M., Y. Park, et al. (in press). "Pf155/RESA protein influences the dynamic microcirculatory behavior of ring-stage Plasmodium falciparum infected red blood cells." Scientific Reports.
Ding, H. F., Z. Wang, et al. (2008). "Fourier Transform Light Scattering of Inhomogeneous and Dynamic Structures." Physical Review Letters 101(23).
Discher, D. E., D. H. Boal, et al. (1998). "Simulations of the erythrocyte cytoskeleton at large deformation. II. Micropipette aspiration." Biophys. J. 75(3): 1584-1597.
Dormandy, J. A. (1970). "Clinical significance of blood viscosity." Ann R Coll Surg Engl 47(4): 211-228.
Dubus, C. and J. B. Fournier (2006). "A Gaussian model for the membrane of red blood cells with cytoskeletal defects." EPL (Europhysics Letters) 75: 181.
Dulinska, I., M. Targosz, et al. (2006). "Stiffness of normal and pathological erythrocytes studied by means of atomic force microscopy." Journal of Biochemical and Biophysical Methods 66(1-3): 1-11.
Evans, E. (1973). "New membrane concept applied to the analysis of fluid shear-and micropipette-deformed red blood cells." Biophysical Journal 13(9): 941-954.
Evans, E., N. Mohandas, et al. (1984). "Static and dynamic rigidities of normal and sickle erythrocytes. Major influence of cell hemoglobin concentration." Journal of Clinical Investigation 73(2): 477.
Evans, E. and R. Waugh (1977). "Osmotic correction to elastic area compressibility measurements on red cell membrane." Biophysical Journal 20(3): 307-313.
Evans, E. and A. Yeung (1994). "Hidden Dynamics in Rapid Changes of Bilayer Shape." Chemistry and physics of lipids 73(1-2): 39-56.
Evans, E. A. (1974). "Bending resistance and chemically induced moments in membrane bilayers." Biophysical Journal 14(12): 923-931.
Evans, E. A. (1983). "Bending elastic modulus of red blood cell membrane derived from buckling instability in micropipet aspiration tests." Biophysical Journal 43(1): 27-30.
Evans, E. A. and R. M. Hochmuth (1976). "Membrane Viscoelasticity." Biophys J 16(1): 1-11.

Blood Cell – An Overview of Studies in Hematology 190
Evans, E. A. and P. L. La Celle (1975). "Intrinsic material properties of the erythrocyte membrane indicated by mechanical analysis of deformation." Blood 45(1): 29-43.
Fedosov, D. A., B. Caswell, et al. (2010). "A multiscale red blood cell model with accurate mechanics, rheology, and dynamics." Biophysical Journal 98(10): 2215-2225.
Fedosov, D. A., H. Lei, et al. (2011). "Multiscale Modeling of Red Blood Cell Mechanics and Blood Flow in Malaria." PLoS computational biology 7(12): e1002270.
Fornal, M., M. Lekka, et al. (2006). "Erythrocyte stiffness in diabetes mellitus studied with atomic force microscope." Clin Hemorheol Microcirc 35(1-2): 273-276.
Fung, Y. (1993). Biomechanics: mechanical properties of living tissues, Springer. Gent, A. (1960). "Theory of the parallel plate viscometer." British Journal of Applied Physics 11:
85. Golan, D. E. and W. Veatch (1980). "Lateral Mobility of Band 3 in the Human Erythrocyte
Membrane Studied by Fluorescence Photobleaching Recovery: Evidence for Control by Cytoskeletal Interactions." Proc. Natl. Acad. Sci. U. S. A. 77(5): 2537-2541.
Gov, N. and S. Safran (2005). "Red blood cell membrane fluctuations and shape controlled by ATP-induced cytoskeletal defects." Biophysical Journal 88(3): 1859-1874.
Gov, N., A. G. Zilman, et al. (2003). "Cytoskeleton Confinement and Tension of Red Blood Cell Membranes." Phys. Rev. Lett. 90(22): 228101.
Grier, D. G. (2003). "A revolution in optical manipulation." Nature 424(6950): 810-816. Guck, J., R. Ananthakrishnan, et al. (2001). "The optical stretcher: a novel laser tool to
micromanipulate cells." Biophysical Journal 81(2): 767-784. Helfrich, W. (1973). "Elastic properties of lipid bilayers: theory and possible experiments." Z.
naturforsch 28(11): 693-703. Henon, S., G. Lenormand, et al. (1999). "A new determination of the shear modulus of the
human erythrocyte membrane using optical tweezers." Biophys J 76(2): 1145-1151. Hochmuth, R., K. Buxbaum, et al. (1980). "Temperature dependence of the viscoelastic
recovery of red cell membrane." Biophysical Journal 29(1): 177-182. Hochmuth, R. and R. Waugh (1987). "Erythrocyte membrane elasticity and viscosity."
Annual review of physiology 49(1): 209-219. Hochmuth, R. M. (2000). "Micropipette aspiration of living cells." J Biomech 33(1): 15-22. JANDL, J. H., R. L. SIMMONS, et al. (1961). "Red cell filtration and the pathogenesis of
certain hemolytic anemias." Blood 18(2): 133-148. Jang, Y., J. Jang, et al. (2012). "Dynamic spectroscopic phase microscopy for quantifying
hemoglobin concentration and dynamic membrane fluctuation in red blood cells." Optics Express 20(9): 9673-9681.
Juhan, I., M. Buonocore, et al. (1982). "Abnormalities of erythrocyte deformability and platelet aggregation in insulin-dependent diabetics corrected by insulin in vivo and in vitro." The Lancet 319(8271): 535-537.
Kamruzzahan, A. S. M., F. Kienberger, et al. (2004). "Imaging morphological details and pathological differences of red blood cells using tapping-mode AFM." Biological Chemistry 385(10): 955-960.
Kapitza, H. G. and E. Sackmann (1980). "Local measurement of lateral motion in erythrocyte membranes by photobleaching technique." Biochim Biophys Acta 595(1): 56-64.

Measurement Techniques for Red Blood Cell Deformability: Recent Advances 191
Kaul, D. K., M. Fabry, et al. (1983). "Erythrocytes in sickle cell anemia are heterogeneous in their rheological and hemodynamic characteristics." Journal of Clinical Investigation 72(1): 22.
Kenneth, K. (2010). Williams hematology, McGraw-Hill New York:. Kim, Y., J. M. Higgins, et al. (2012). "Anisotropic light scattering of individual sickle red
blood cells." Journal of Biomedical Optics 17: 040501. Kim, Y., J. Jeong, et al. (2012). "Polarization holographic microscopy for extracting spatio-
temporally resolved Jones matrix." Optics Express 20(9): 9948-9955. Klug, P. P., L. S. Lessin, et al. (1974). "Rheological aspects of sickle cell disease." Archives of
Internal Medicine 133(4): 577. Lee, S. H. and D. G. Grier (2007). "Holographic microscopy of holographically trapped three-
dimensional structures." Opt. Express 15(4): 1505-1512. Lenormand, G., S. Hénon, et al. (2001). "Direct measurement of the area expansion and shear
moduli of the human red blood cell membrane skeleton." Biophysical Journal 81(1): 43-56. Li, J., G. Lykotrafitis, et al. (2007). "Cytoskeletal dynamics of human erythrocyte." Proc. Natl.
Acad. Sci. U. S. A. 104(12): 4937. Lim, C. T., M. Dao, et al. (2004). "Large deformation of living cells using laser traps." Acta
Materialia 52(7): 1837-1845. Lim HW, G., M. Wortis, et al. (2002). "Stomatocyte–discocyte–echinocyte sequence of the
human red blood cell: Evidence for the bilayer–couple hypothesis from membrane mechanics." Proc Natl Acad Sci U S A 99(26): 16766.
Liu, S. C., L. H. Derick, et al. (1987). "Visualization of the hexagonal lattice in the erythrocyte membrane skeleton." The Journal of cell biology 104(3): 527-536.
Lowe, G. D. O., M. M. Drummond, et al. (1980). "Relation between Extent of Coronary-Artery Disease and Blood-Viscosity." British Medical Journal 280(6215): 673-674.
Maciaszek, J. L., B. Andemariam, et al. (2011). "Microelasticity of red blood cells in sickle cell disease." The Journal of Strain Analysis for Engineering Design 46(5): 368.
Maciaszek, J. L. and G. Lykotrafitis (2011). "Sickle cell trait human erythrocytes are significantly stiffer than normal." Journal of biomechanics 44(4): 657-661.
Marinkovic, M., M. Diez-Silva, et al. (2009). "Febrile temperature leads to significant stiffening of Plasmodium falciparum parasitized erythrocytes." American Journal of Physiology-Cell Physiology 296(1): C59-C64.
McMillan, D., N. Utterback, et al. (1978). "Reduced erythrocyte deformability in diabetes." Diabetes 27(9): 895.
Meiselman, H. J. (1981). "Morphological determinants of red cell deformability." Scandinavian Journal of Clinical & Laboratory Investigation 41(S156): 27-34.
Meiselman, H. J., E. A. Evans, et al. (1978). "Membrane mechanical properties of ATP-depleted human erythrocytes." Blood 52(3): 499-504.
Merrill, E. W. (1969). "Rheology of blood." Physiol Rev 49(4): 863-888. Mills, J. P., M. Diez-Silva, et al. (2007). "Effect of plasmodial RESA protein on deformability
of human red blood cells harboring Plasmodium falciparum." Proc Natl Acad Sci U S A 104(22): 9213-9217.
Mohandas, N., M. R. Clark, et al. (1980). "Analysis of factors regulating erythrocyte deformability." Journal of Clinical Investigation 66(3): 563.

Blood Cell – An Overview of Studies in Hematology 192
Mosk, A. P., A. Lagendijk, et al. (2012). "Controlling waves in space and time for imaging and focusing in complex media." Nature photonics 6(5): 283-292.
Nakashima, K. and E. Beutler (1979). "Erythrocyte cellular and membrane deformability in hereditary spherocytosis." Blood 53(3): 481-485.
Nash, G. and H. Meiselman (1985). "Alteration of red cell membrane viscoelasticity by heat treatment: effect on cell deformability and suspension viscosity." Biorheology 22(1): 73.
Nguyen, Q. and D. Boger (1987). "Characterization of yield stress fluids with concentric cylinder viscometers." Rheologica acta 26(6): 508-515.
Park, J. H., C. Park, et al. (2012). "Dynamic active wave plate using random nanoparticles." Optics Express 20(15): 17010-17016.
Park, J. H., C. H. Park, et al. (2012). "Active spectral filtering through turbid media." Optics Letters 37(15): 3261-3263.
Park, Y., C. A. Best, et al. (2010). "Metabolic remodeling of the human red blood cell membrane." Proc Natl Acad Sci U S A 107(4): 1289-1294.
Park, Y., M. Diez-Silva, et al. (2010). "Static and dynamic light scattering of healthy and malaria-parasite invaded red blood cells." Journal of Biomedical Optics 15(2): 020506.
Park, Y., M. Diez-Silva, et al. (2008). "Refractive index maps and membrane dynamics of human red blood cells parasitized by Plasmodium falciparum." Proc Natl Acad Sci U S A 105(37): 13730-13735.
Park, Y., T. Yamauchi, et al. (2009). "Spectroscopic phase microscopy for quantifying hemoglobin concentrations in intact red blood cells." Optics Letters 34(23): 3668-3670.
Park, Y. K., C. A. Best-Popescu, et al. (2011). "Light scattering of human red blood cells during metabolic remodeling of the membrane." Journal of Biomedical Optics 16: 011013.
Park, Y. K., C. A. Best, et al. (2010). "Measurement of red blood cell mechanics during morphological changes." Proceedings of the National Academy of Sciences 107(15): 6731.
Park, Y. K., C. A. Best, et al. (2011). "Measurement of the nonlinear elasticity of red blood cell membranes." Physical Review E 83(5): 051925.
Park, Y. K., C. A. Best, et al. (2011). Optical Sensing of Red Blood Cell Dynamics. Mechanobiology of Cell-cell and Cell-matrix Interactions, Springer: 279.
Park, Y. K., G. Popescu, et al. (2006). "Diffraction phase and fluorescence microscopy." Optics Express 14(18): 8263-8268.
Popescu, G. (2011). Quantitative Phase Imaging of Cells and Tissues, McGraw-Hill Professional. Popescu, G., T. Ikeda, et al. (2005). "Erythrocyte structure and dynamics quantified by
Hilbert phase microscopy." J. Biomed. Opt. 10: 060503. Popescu, G., T. Ikeda, et al. (2006). "Diffraction phase microscopy for quantifying cell
structure and dynamics." Optics Letters 31(6): 775-777. Popescu, G., T. Ikeda, et al. (2006). "Optical Measurement of Cell Membrane Tension."
Physical Review Letters 97(21): 218101. Popescu, G., Y. Park, et al. (2008). "Imaging red blood cell dynamics by quantitative phase
microscopy." Blood Cells, Molecules, and Diseases 41(1): 10-16. Popescu, G., Y. Park, et al. (2008). "Optical imaging of cell mass and growth dynamics." Am.
J. Physiol.: Cell Physiol. 295(2): C538. Popescu, G., Y. K. Park, et al. (2007). "Coherence properties of red blood cell membrane
motions." Physical Review E 76(3): 31902.

Measurement Techniques for Red Blood Cell Deformability: Recent Advances 193
Prisco, D., R. Paniccia, et al. (1989). "Red blood cell lipid alterations in type II diabetes mellitus." Thrombosis research 54(6): 751-758.
Puig-de-Morales-Marinkovic, M., K. T. Turner, et al. (2007). "Viscoelasticity of the human red blood cell." Am J Physiol Cell Physiol 293(2): C597-605.
Radmacher, M. (1997). "Measuring the elastic properties of biological samples with the AFM." Engineering in Medicine and Biology Magazine, IEEE 16(2): 47-57.
Rand, P. W., E. Lacombe, et al. (1964). "Viscosity of normal human blood under normothermic and hypothermic conditions." journal of applied physiology 19(1): 117-122.
Rawicz, W., K. Olbrich, et al. (2000). "Effect of chain length and unsaturation on elasticity of lipid bilayers." Biophysical Journal 79(1): 328-339.
Reid, H., J. Dormandy, et al. (1976). "Impaired red cell deformability in peripheral vascular disease." The Lancet 307(7961): 666-668.
Reinhart, W. H., L. A. Sung, et al. (1986). "Quantitative Relationship between Heinz Body Formation and Red-Blood-Cell Deformability." Blood 68(6): 1376-1383.
Saffman, P. and M. Delbrück (1975). "Brownian motion in biological membranes." Proceedings of the National Academy of Sciences 72(8): 3111.
Shaked, N. T., L. L. Satterwhite, et al. (2011). "Quantitative microscopy and nanoscopy of sickle red blood cells performed by wide field digital interferometry." Journal of Biomedical Optics 16: 030506.
Sheetz, M. and S. Singer (1977). "On the mechanism of ATP-induced shape changes in human erythrocyte membranes. I. The role of the spectrin complex." Journal of Cell Biology 73(3): 638-646.
Sheetz, M. P. and S. Singer (1974). "Biological membranes as bilayer couples. A molecular mechanism of drug-erythrocyte interactions." Proceedings of the National Academy of Sciences 71(11): 4457.
Shelby, J. P., J. White, et al. (2003). "A microfluidic model for single-cell capillary obstruction by Plasmodium falciparum infected erythrocytes." Proc Natl Acad Sci U S A 100(25): 14618-14622.
Shiga, T., N. Maeda, et al. (1990). "Erythrocyte Rheology." Critical Reviews in Oncology/Hematology 10(1): 9-48.
Simmons, D., G. Woollett, et al. (1987). "A malaria protein exported into a new compartment within the host erythrocyte." EMBO J. 6(2): 485-491.
Somer, T. and H. J. Meiselman (1993). "Disorders of Blood-Viscosity." Annals of Medicine 25(1): 31-39.
Srour, M., Y. Bilto, et al. (2000). "Exposure of human erythrocytes to oxygen radicals causes loss of deformability, increased osmotic fragility, lipid peroxidation and protein degradation." Clinical hemorheology and microcirculation 23(1): 13-22.
Suresh, S., J. Spatz, et al. (2005). "Connections between single-cell biomechanics and human disease states: gastrointestinal cancer and malaria." Acta Biomaterialia 1(1): 15-30.
Svoboda, K. and S. Block (1994). "Biological applications of optical forces." ANNUAL REVIEW OF BIOPHYSICS AND BIOMOLECULAR STRUCTURE 23(1): 247-285.
Tchernia, G., N. Mohandas, et al. (1981). "Deficiency of skeletal membrane protein band 4.1 in homozygous hereditary elliptocytosis. Implications for erythrocyte membrane stability." Journal of Clinical Investigation 68(2): 454.

Blood Cell – An Overview of Studies in Hematology 194
Tishler, R. and F. Carlson (1987). "Quasi-elastic light scattering studies of membrane motion in single red blood cells." Biophysical Journal 51(6): 993-997.
Tse, W. T. and S. E. Lux (1999). "Red blood cell membrane disorders." British journal of haematology 104(1): 2-13.
Tsuji, A. and S. Ohnishi (1986). "Restriction of the lateral motion of band 3 in the erythrocyte membrane by the cytoskeletal network: dependence on spectrin association state." Biochemistry 25(20): 6133-6139.
Tuvia, S., S. Levin, et al. (1998). "Mechanical fluctuations of the membrane-skeleton are dependent on F-actin ATPase in human erythrocytes." J. Cell Biol. 141(7): 1551-1561.
Vellekoop, I., A. Lagendijk, et al. (2010). "Exploiting disorder for perfect focusing." Nature photonics 4(5): 320-322.
Vellekoop, I. M. and C. M. Aegerter (2010). "Scattered light fluorescence microscopy: imaging through turbid layers." Opt. Lett 35(8): 1245-1247.
Wang, N., J. P. Butler, et al. (1993). "Mechanotransduction across the Cell-Surface and through the Cytoskeleton." Science 260(5111): 1124-1127.
Wang, R., H. Ding, et al. (2011). "Effective 3D viscoelasticity of red blood cells measured by diffraction phase microscopy." Biomedical optics express 2(3): 485-490.
Waugh, R. and E. A. Evans (1979). "Thermoelasticity of red blood cell membrane." Biophysical Journal 26(1): 115-131.
Waugh, R. E. (1982). "Surface viscosity measurements from large bilayer vesicle tether formation. II. Experiments." Biophysical Journal 38(1): 29-37.
Waugh, R. E., M. Narla, et al. (1992). "Rheologic Properties of Senescent Erythrocytes - Loss of Surface-Area and Volume with Red-Blood-Cell Age." Blood 79(5): 1351-1358.
Weed, R. I., P. L. LaCelle, et al. (1969). "Metabolic dependence of red cell deformability." Journal of Clinical Investigation 48(5): 795.
Weisenhorn, A. L., M. Khorsandi, et al. (1993). "Deformation and height anomaly of soft surfaces studied with an AFM." Nanotechnology 4: 106.
Yoon, Y. Z., H. Hong, et al. (2009). "Flickering analysis of erythrocyte mechanical properties: dependence on oxygenation level, cell shape, and hydration level." Biophysical Journal 97(6): 1606-1615.
Yoon, Y. Z., J. Kotar, et al. (2011). "Red blood cell dynamics: from spontaneous fluctuations to non-linear response." Soft Matter 7(5): 2042-2051.
Zilker, A., H. Engelhardt, et al. (1987). "Dynamic reflection interference contrast (RIC-) microscopy: a new method to study surface excitations of cells and to measure membrane bending elastic moduli." Journal De Physique 48(12): 2139-2151.
Zilker, A., M. Ziegler, et al. (1992). "Spectral analysis of erythrocyte flickering in the 0.3-4 mm-1 regime by microinterferometry combined with fast image processing." Phys. Rev. A 46(12): 7998-8001.