measurement – session 5 wages and income. issues in mst of wages and income wages = individual...
TRANSCRIPT
Measurement – session 5
Wages and Income

Issues in mst of wages and income
• Wages = individual
• Self-employment, capital : how to measure their income?
• Other (non-monetary) resources?
• How to compare households of different size and composition?
• Income = a household level variable?

Issues in mst of wages and income
• Why do we want to measure income?– We assume income = money = a “universal
equivalent” with which each consumer can buy whatever s/he wants
– Should we not be measuring consumption, or “capabilities”? Or (subjective) welfare/happiness?
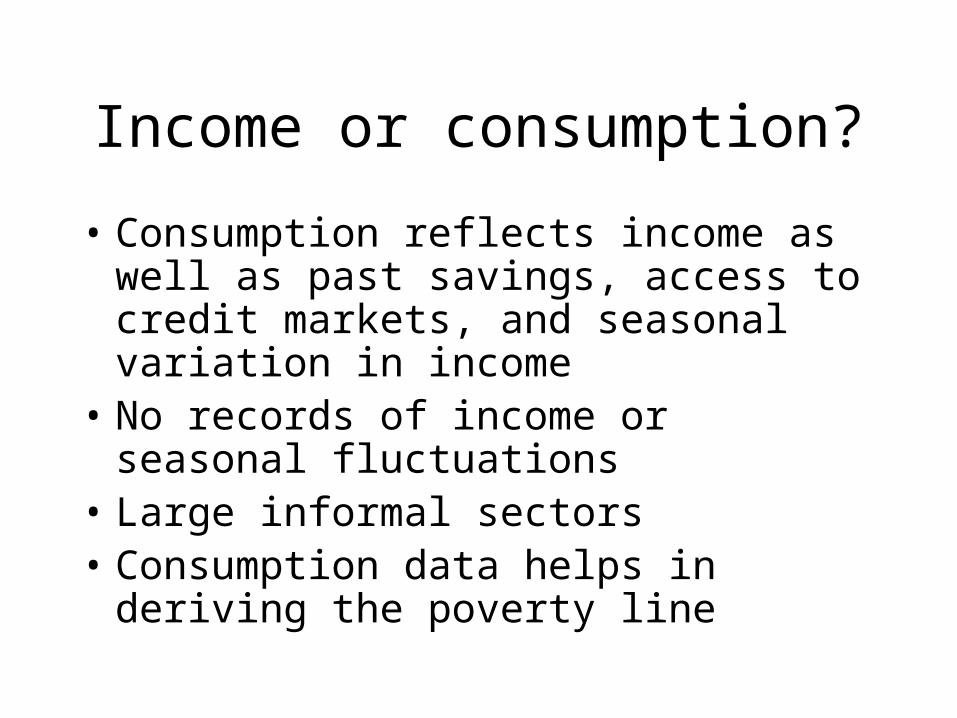
Income or consumption?
• Consumption reflects income as well as past savings, access to credit markets, and seasonal variation in income
• No records of income or seasonal fluctuations
• Large informal sectors• Consumption data helps in deriving the
poverty line

Income or consumption?
• Measuring income is a theoretical, ethical choice: income is supposed to offer potentially anything, whereas consumption is the outcome of a choice
• It’a a liberal point of view : we want to measure situations before choices, and not care about the outcomes
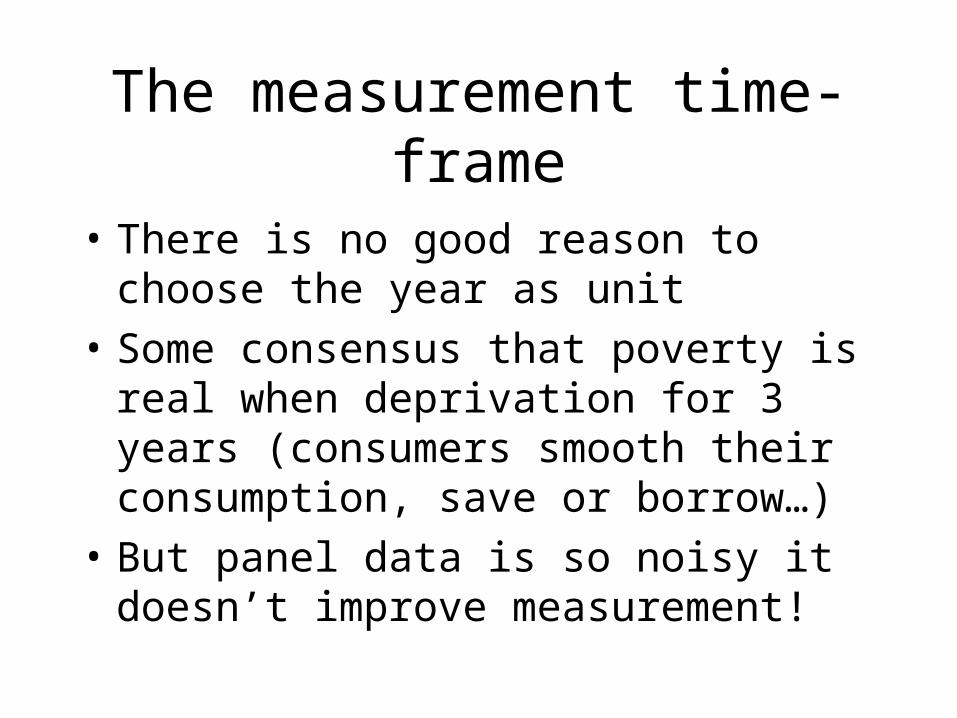
The measurement time-frame
• There is no good reason to choose the year as unit
• Some consensus that poverty is real when deprivation for 3 years (consumers smooth their consumption, save or borrow…)
• But panel data is so noisy it doesn’t improve measurement!

Data needs for poverty analysis
• National level data– National accounts – GDP, consumption,
savings, investment, imports, exports, etc.– Ministry of Finance, Central Statistical Agency– Budgets, price surveys, and data collection– Monthly, quarterly, and yearly
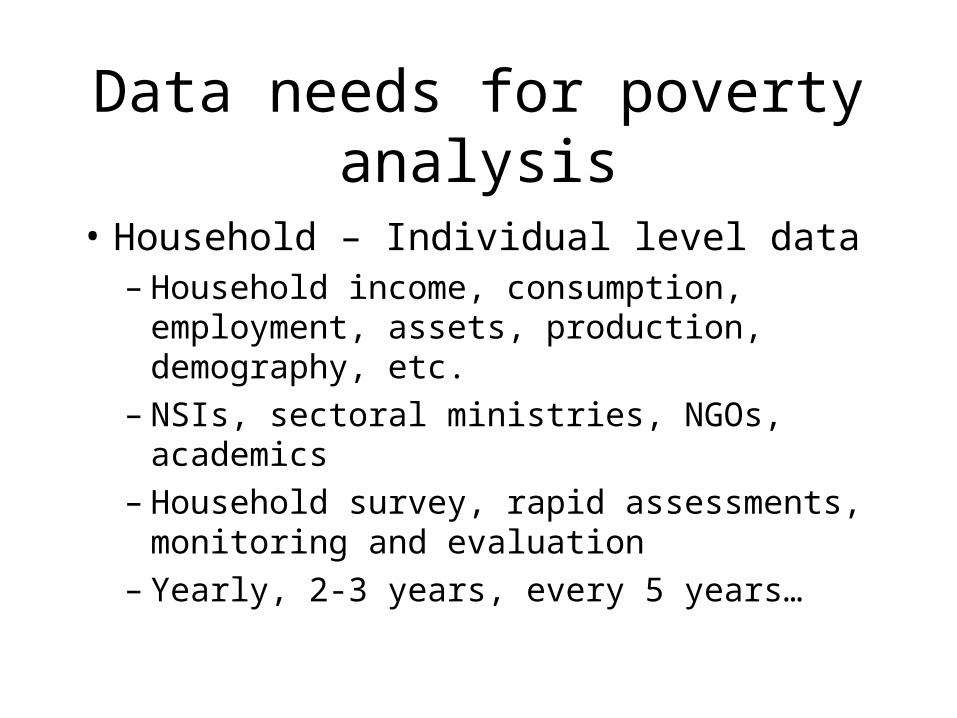
Data needs for poverty analysis
• Household – Individual level data– Household income, consumption, employment,
assets, production, demography, etc.– NSIs, sectoral ministries, NGOs, academics– Household survey, rapid assessments,
monitoring and evaluation– Yearly, 2-3 years, every 5 years…

Available data
• Administrative data: taxes and payrolls, mainly
• Population Census• Household surveys – Labor Force Survey,
HBS, SILC (European Panel)• Qualitative and Participatory Assessments –
ethnographic, village studies, beneficiary assessments, etc.

(1) Wages
• What’s in a wage?– Much is excluded: all the in-kind payments– Time frame: hourly, monthly, yearly wage?
• Statistical sources– Wages: employer’s tax declarations– Wages and employment: Labor Force Survey– Income: households’ income tax declarations
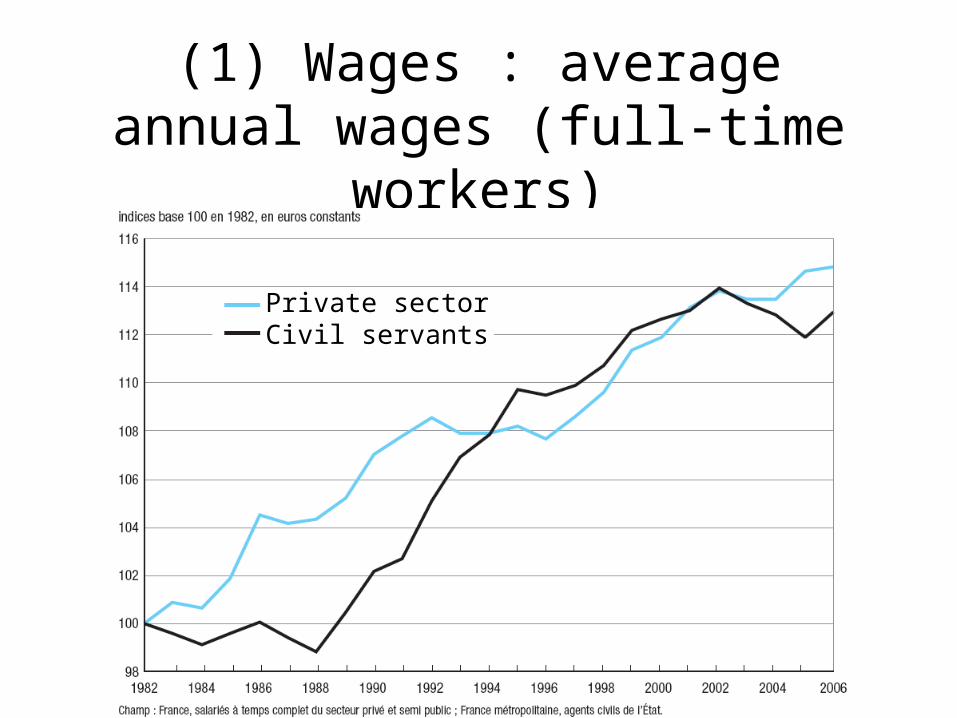
(1) Wages : average annual wages (full-time workers)
Private sectorCivil servants
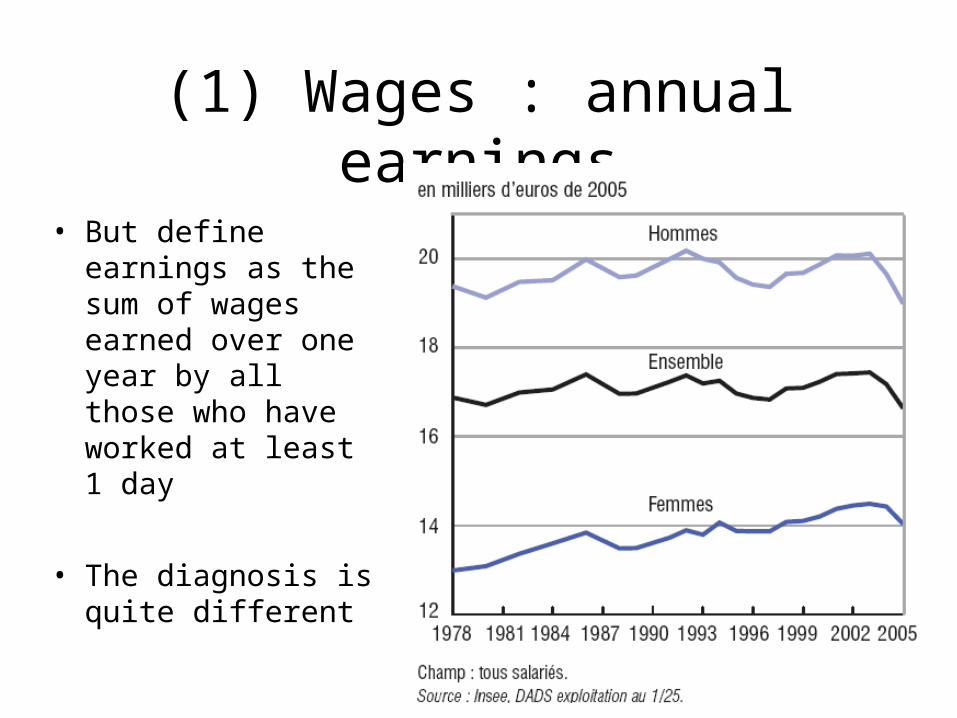
(1) Wages : annual earnings
• But define earnings as the sum of wages earned over one year by all those who have worked at least 1 day
• The diagnosis is quite different

(1) Wages : annual earnings
That is because earnings are a composition of wages earned * number of days worked
Here are the average number of worked days for men and women
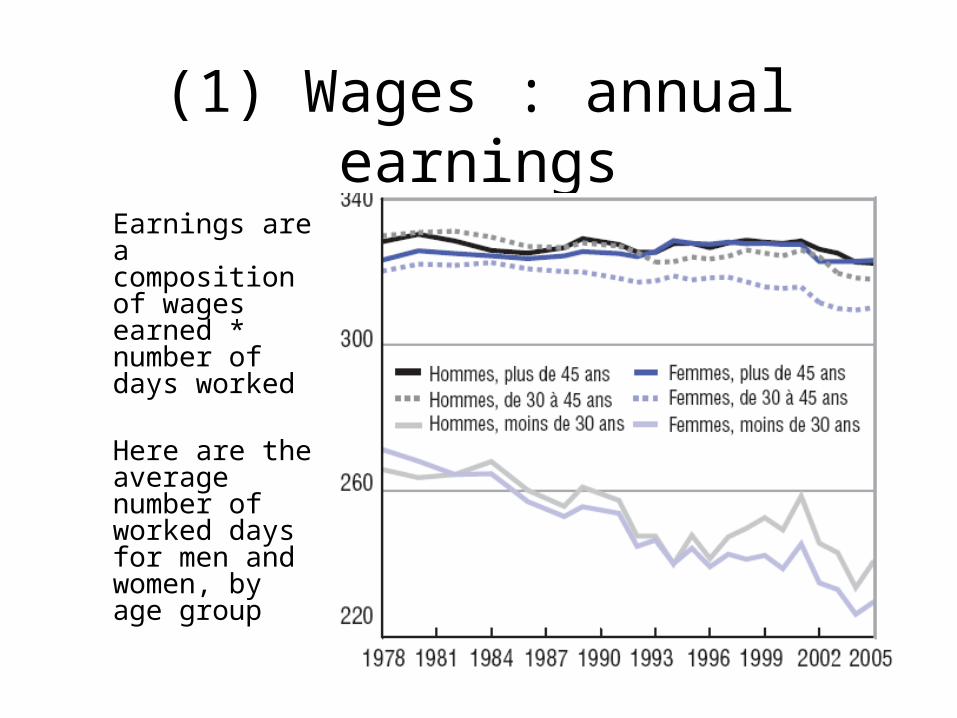
(1) Wages : annual earnings
Earnings are a composition of wages earned * number of days worked
Here are the average number of worked days for men and women, by age group

(1) Wages : annual earnings
The average yearly wage from national accoutning sources can also look very different depending on the numerator and denominator you choose
(1) Wages : annual earnings
• National accounting: – all wages/ ”average labor force”: (number of employed
at beginning of year+ at end of year) /2
– Alternative denominator: all those who have worked at least 1 day during the year
– Gross wages have increased much more than net wages because taxes on wages have increased
– The diagnosis is definitely not the same!
(2) Other income
• Self-employed– Taxes are an unreliable source– Depend on the legal status of the business
• More fundamental problem: for themselves, there is no conceptual difference between their household budget and their business’

(2) Other income
• Survey data: – Finally, European comparisons are made from
survey data– SILC: survey on income and living conditions– Many questions on income
• Survey effect: the more numerous the questions, the richer the respondents!

What’s in an income
• Things that are ill-measured:– Income from capital (wealth): would have little
impact on poverty since almost entirely above the median
– Yet changes a lot when considering inequality

Taxes
• Again, not simple:– Income tax = is removed from disposable
income– But what about local taxes?– Again, it depends on what you consider a
choice or not – Ex: is living in Paris a choice? Yes you use
your income to pay local taxes. No local taxes should be removed from income

Transfers between HH
• Alimonies and the money transfers of migrants to their homeland are removed from disposable income
• But it may underestimate income: migrants send money for their own future use, too

What’s in an income
• Choices of what to include are often made for no good theoretical reason but practical ones
Recent pushes towards better income measurement
• French official report (CNIS)+ general Eurostat tendency
• Goal = take better account of non monetary resources

Recent pushes towards better income measurement
• Imputed rent– Owning your home

Recent pushes towards better income measurement
• Home production

Recent pushes towards better income measurement
• Public goods (that can be individualized)

Niveaux de vie
• D’abord faut le définir:– Income (gross – net – including non market
goods?)– By consumption unit

(1) Wages : annual earnings
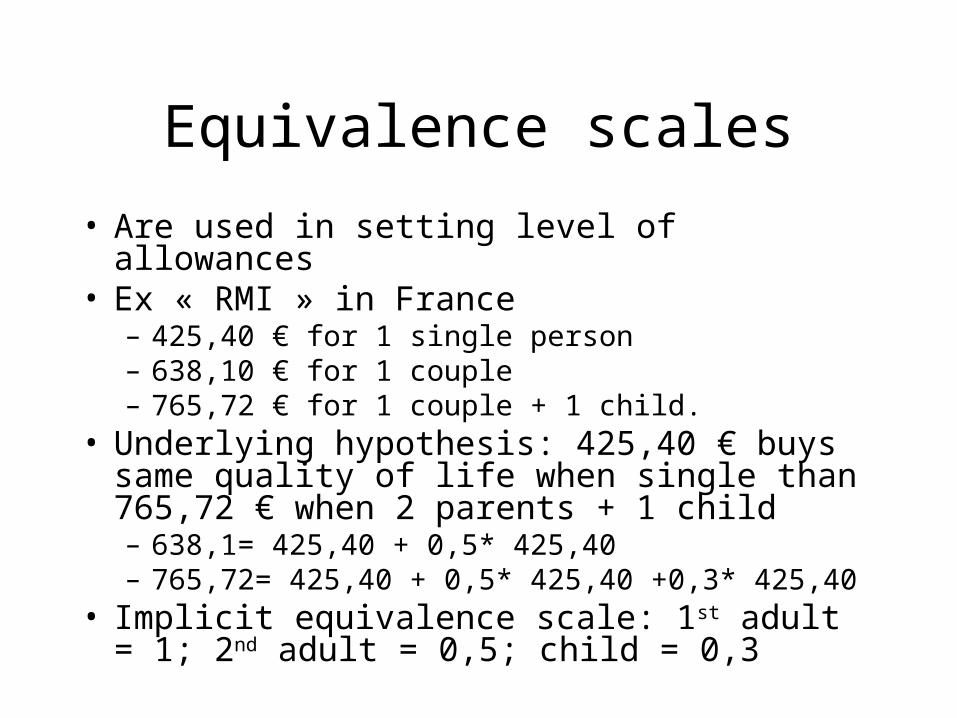
Equivalence scales
• Are used in setting level of allowances• Ex « RMI » in France
– 425,40 € for 1 single person– 638,10 € for 1 couple – 765,72 € for 1 couple + 1 child.
• Underlying hypothesis: 425,40 € buys same quality of life when single than 765,72 € when 2 parents + 1 child – 638,1= 425,40 + 0,5* 425,40 – 765,72= 425,40 + 0,5* 425,40 +0,3* 425,40
• Implicit equivalence scale: 1st adult = 1; 2nd adult = 0,5; child = 0,3
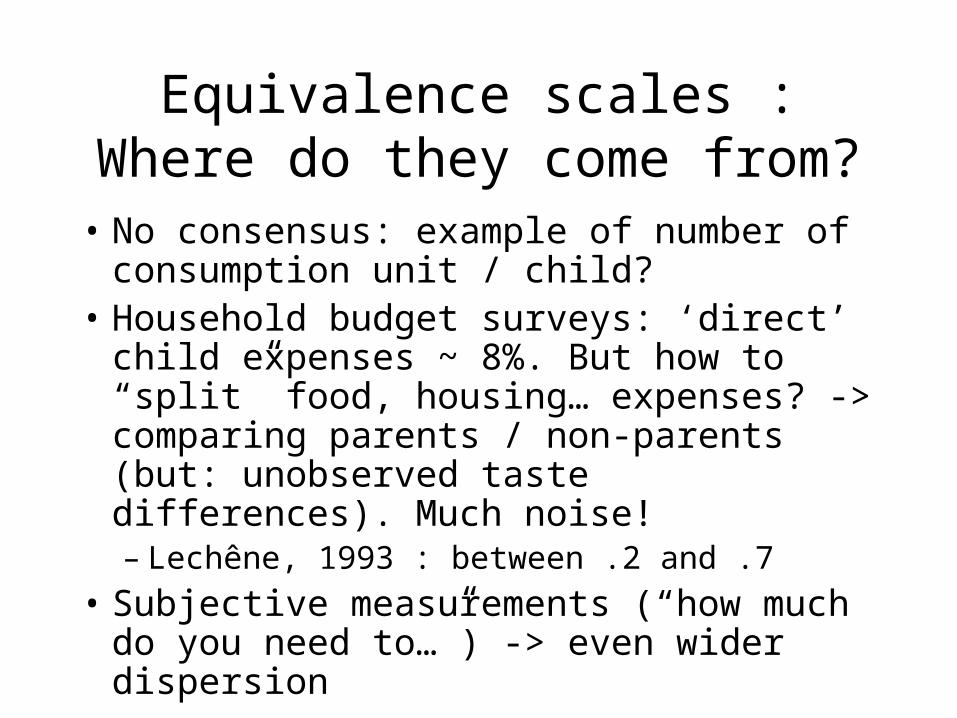
Equivalence scales : Where do they come from?
• No consensus: example of number of consumption unit / child?
• Household budget surveys: ‘direct’ child expenses ~ 8%. But how to “split” food, housing… expenses? -> comparing parents / non-parents (but: unobserved taste differences). Much noise!– Lechêne, 1993 : between .2 and .7
• Subjective measurements (“how much do you need to…”) -> even wider dispersion

Equivalence scales : example on 4 variants
Source: “Du bon usage des échelles d’équivalence L’impact du choix de la mesure”, Jérôme Accardo. http://www.cairn.info/revue-informations-sociales-2007-1-page-36.htm
1st adult 2nd adult Other adults Child<14OECD modified 1 0,5 0,5 0,3Oxford 1 0,7 0,7 0,5No economies of scale 1 1 1 1Strong economies of scale 1 0,2 0,2 0,2
• The 4 variants

Equivalence scales : example on 4 variants
All figures calculated on fiscal data for 2001Source: “Du bon usage des échelles d’équivalence L’impact du choix de la mesure”, Jérôme Accardo. http://www.cairn.info/revue-informations-sociales-2007-1-page-36.htm
• ResultsPovty threshold (€/year)
Poverty rate (%)
Gini inequality coefficient
change in poverty rate, 1996-2001
OECD modified 7227 6,1 0,27 -1,1Oxford 6113 6,8 0,28 -1,4No ec.s of scale 4820 9,7 0,3 -1Strong ec.s of scale 9442 6,9 0,28 -0,5

Equivalence scales : example on 4 variants
Source: “Du bon usage des échelles d’équivalence L’impact du choix de la mesure”, Jérôme Accardo. http://www.cairn.info/revue-informations-sociales-2007-1-page-36.htm
Composition of “the poor” depending of equivalence scale used
From top to bottom:
- Couple w. children
- Couple w.out children
- Single parent w. children
- Single adult

Intra-household allocation
• Duflo and Udry (2004) [NBER Working Paper 10498]
• Data : the Côte d’Ivoire Living Standards Measurement Survey (CILSS). 1985-1988. 1,500 HH
• Some crops are cultivated by men, others by women
• They do not benefit equally from rain
Intra-household allocation
• Results:– Rainfall shocks associated with high yields of
women’s crops shift expenditure towards food– Rainfall-induced fluctuations in income from
yams are transmitted to expenditures on education and food, not to expenditures on private goods
– Other crops fluctuations are associated with more consumption of private goods

Intra-household allocation
• Evidence from sociology in the US and France– Income is not 100% shared among household
members– There are intra-household variations in
disposable income and consumption– But we know way too little to take them into
account statistically… so far.

In 2001 in a few European countries
Lessons to be learnt
• On child poverty: policy impact of measurement linked with ideology of those you want to convince (figures for advocacy)