measurement report test of pv/t-module ”solarwall...
TRANSCRIPT

Measurement Report – Test of PV/T-module ”SolarWall PVT”
A Report of IEA SHC – Task 35
PV/Thermal Solar Systems
Report DC4-2
June, 2007
Ivan Katic
Measurement Report – Test of PV/T-module ”SolarWall PVT”
by
Ivan Katic
A technical report of Subtask C Report DC4-2
Ivan Katic Solar Energy Center
Danish Technological Institute Taastrup Denmark
Phone: +45 7220 2482 E-mail: [email protected]

IEA Solar Heating and Cooling Programme
The International Energy Agency (IEA) is an autonomous body within the framework of the
Organization for Economic Co-operation and Development (OECD) based in Paris. Established in
1974 after the first “oil shock,” the IEA is committed to carrying out a comprehensive program of
energy cooperation among its members and the Commission of the European Communities.
The IEA provides a legal framework, through IEA Implementing Agreements such as the Solar
Heating and Cooling Agreement, for international collaboration in energy technology research and
development (R&D) and deployment. This IEA experience has proved that such collaboration
contributes significantly to faster technological progress, while reducing costs; to eliminating
technological risks and duplication of efforts; and to creating numerous other benefits, such as swifter
expansion of the knowledge base and easier harmonization of standards.
The Solar Heating and Cooling Programme was one of the first IEA Implementing Agreements to
be established. Since 1977, its members have been collaborating to advance active solar and passive
solar and their application in buildings and other areas, such as agriculture and industry. Current
members are:
Australia Finland Portugal
Austria France Spain
Belgium Italy Sweden
Canada Mexico Switzerland
Denmark Netherlands United States
European Commission New Zealand
Germany Norway
A total of 44 Tasks have been initiated, 33 of which have been completed. Each Task is managed by
an Operating Agent from one of the participating countries. Overall control of the program rests with
an Executive Committee comprised of one representative from each contracting party to the
Implementing Agreement. In addition to the Task work, a number of special activities—
Memorandum of Understanding with solar thermal trade organizations, statistics collection and
analysis, conferences and workshops—have been undertaken.
To find Solar Heating and Cooling Programme publications and learn more about the Programme
visit
www.iea-shc.org or contact the SHC Executive Secretary, Pamela Murphy, e-mail:

The Tasks of the IEA Solar Heating and Cooling Programme, both underway and completed are as
follows:
Current Tasks & Working Group:
Task 35 PV/Thermal Solar Systems
Task 36 Solar Resource Knowledge Management
Task 37 Advanced Housing Renovation with Solar & Conservation
Task 38 Solar Thermal Cooling and Air Conditioning
Task 39 Polymeric Materials for Solar Thermal Applications
Task 40 Net Zero Energy Solar Buildings
Task 42 Compact Solar Thermal Energy Storage
Working Group Daylight Research Group
Completed Tasks:
Task 1 Investigation of the Performance of Solar Heating and Cooling Systems
Task 2 Coordination of Solar Heating and Cooling R&D
Task 3 Performance Testing of Solar Collectors
Task 4 Development of an Insolation Handbook and Instrument Package
Task 5 Use of Existing Meteorological Information for Solar Energy
Application
Task 6 Performance of Solar Systems Using Evacuated Collectors
Task 7 Central Solar Heating Plants with Seasonal Storage
Task 8 Passive and Hybrid Solar Low Energy Buildings
Task 9 Solar Radiation and Pyranometry Studies
Task 10 Solar Materials R&D
Task 11 Passive and Hybrid Solar Commercial Buildings
Task 12 Building Energy Analysis and Design Tools for Solar Applications
Task 13 Advance Solar Low Energy Buildings
Task 14 Advance Active Solar Energy Systems
Task 16 Photovoltaics in Buildings
Task 17 Measuring and Modeling Spectral Radiation
Task 18 Advanced Glazing and Associated Materials for Solar and Building
Applications
Task 19 Solar Air Systems
Task 20 Solar Energy in Building Renovation
Task 21 Daylight in Buildings
Task 23 Optimization of Solar Energy Use in Large Buildings
Task 22 Building Energy Analysis Tools
Task 24 Solar Procurement
Task 25 Solar Assisted Air Conditioning of Buildings
Task 26 Solar Combisystems
Task 28 Solar Sustainable Housing
Task 27 Performance of Solar Facade Components
Task 29 Solar Crop Drying
Task 31 Daylighting Buildings in the 21st Century
Task 32 Advanced Storage Concepts for Solar and Low Energy Buildings
Task 33 Solar Heat for Industrial Processes
Task 34 Testing and Validation of Building Energy Simulation Tools
Completed Working Groups:
CSHPSS, ISOLDE, Materials in Solar Thermal Collectors, and the Evaluation of Task 13 Houses

IEA SHC Task 35 PV/Thermal Solar Systems
Objective
The objectives of the Task are to catalyze the development and market introduction of high quality and
commercial competitive PV/Thermal Solar Systems and to increase general understanding and contribute to
internationally accepted standards on performance, testing, monitoring and commercial characteristics of
PV/Thermal Solar Systems in the building sector.
The Task is organized in 5 subtasks:
• Subtask A: Market and Commercialization of PV/T
• Subtask B: Energy Analysis and Modeling
• Subtask C: Product and System Development, Tests and Evaluation
• Subtask D: Demonstration Projects
• Subtask E: Dissemination
Organisation
IEA SHC Task 35 "PV/Thermal Solar Systems" is a three year Task initiated by the International Energy
Agency (IEA) Solar Heating and Cooling (SHC) Programme in January 2005.
The Danish Energy Authority, acting through Mr. Henrik Sørensen, Esbensen Consulting Engineers A/S,
Denmark, is designated as Operating Agent for the Task.
Task 35 is a so-called "minimum-level" collaboration task with IEA PVPS (Photovoltaic Power Systems
Programme). At this level, experts selected by the PVPS Executive Committee participate in experts
meetings of the Task managed by the SHC Executive Committee. The Task is fully defined and managed by
the SHC Executive Committee with appropriate input from the PVPS Executive Committee. In this project
Israel participated as a PVPS country member.
The official participants in the Task are listed in the table below:
Country Organization Person
Canada Dept. of Mechanical Engineering, University of
Waterloo, Waterloo, Ontario, Canada
Mike Collins
Denmark Esbensen Consulting Engineers A/S Henrik Sørensen
Solar Energy Center, Danish Technological Institute Ivan Katic
Israel Millennium Electric Ami Elazari
Sweden Lund Technical University
Björn Karlsson
Johan Nilsson
Bengt Perers
The Netherlands ECN (Energy Research Centre of the Netherlands)
Wim van Helden
Herbert Zondag
Marco Bakker
Apart from the above mentioned a number of manufacturers, universities, and research institutes from the
countries Germany, Greece, Hong Kong, Italy, South Korea, Thailand, and Spain have been involved in the
work.
Visit the Task 35 website: http://www.iea-shc.org/task35 for more details on activities and results.

IEA SHC – Task 35 – PV/Thermal Solar Systems 6
IEA Task 35
Measurement report:
Test of PVT module “SolarWall PVT”
Ivan Katic
Solar Energy Center
Danish Technological Institute
June 2007

IEA SHC – Task 35 – PV/Thermal Solar Systems 7
Table of Content:
0. Foreword .......................................................................................................................................... 8 1. Product identification ....................................................................................................................... 8
2. Test conditions ................................................................................................................................. 9 4. Data acquisition system ................................................................................................................. 12 5. Measurement results ...................................................................................................................... 14 6. Summary ........................................................................................................................................ 17
IEA SHC – Task 35 – PV/Thermal Solar Systems 8
0. Foreword
This measurement report was produced as part of the Danish contribution to the IEA co-operation
on photovoltaic/thermal solar energy conversion (Task 35). The measurements took place at Danish
Technological Institutes outdoor test facility in Taastrup, Denmark in the period May-June 2007.
The results are valid for the tested prototype exclusively.
1. Product identification
SolarWall PVT prototype by
Multisol ApS
Lysmosevej 13
8670 Låsby
Denmark
Tel.: 70 212 777
Fax: 70 212 877
E-mail: [email protected]
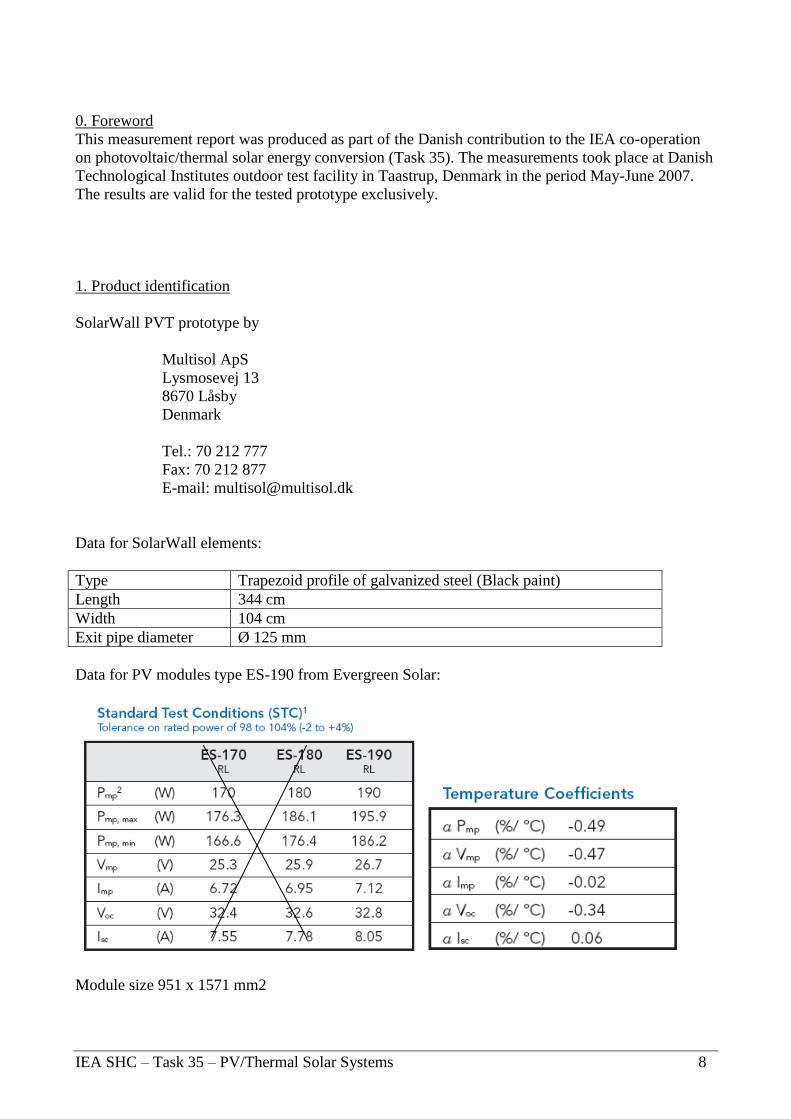
Data for SolarWall elements:
Type Trapezoid profile of galvanized steel (Black paint)
Length 344 cm
Width 104 cm
Exit pipe diameter Ø 125 mm
Data for PV modules type ES-190 from Evergreen Solar:
Module size 951 x 1571 mm2

IEA SHC – Task 35 – PV/Thermal Solar Systems 9
Two PV elements have been mounted directly on the SolarWall elements, leaving an uncovered
area at the lowest part of the elements.
2. Test conditions
Mounting: 45 deg slope, facing south
PV modules 4 sections, 2x2 series connection
Load: No electric load (Open circuit)
Fluid: Ambient air
Flow rate: Variable speed fan
Wind: No control
Fans: LINDAB 70-140 W
3. Preparation of measurements
System configuration
System 1: SolarWall with two PV modules on top, variable flow (high)
System 2: SolarWall with two PV modules on top, variable flow (low)
System 3: SolarWall alone, variable flow (thermal reference)
System 4: PV module alone, natural ventilation (electrical reference)
Fig.1 Side-by-side configuration of solar converters #1-4
PVT PVT Therm. PV

IEA SHC – Task 35 – PV/Thermal Solar Systems 10
Each of the SolarWall elements have been fitted with a 125 mm duct and a fan as shown in figure 2.
Fig.2 SolarWall PVT panel with two PV modules and exhaust fan.
Fig.3 Photo of the mounted PVT collectors

IEA SHC – Task 35 – PV/Thermal Solar Systems 11
Fig.4 The frame of the PV modules are mounted directly on the SolarWall element. Air is transpired
through all the small holes in the black metal profile.
Fig.5 Iris damper with pressure ports used in the flow sensor calibration. The flow sensor is covered
by the T-joint.

IEA SHC – Task 35 – PV/Thermal Solar Systems 12
Test method
The test is carried out in open air at variable insolation and wind speed. The data must therefore be
sorted, and periods of quasi-stationary operation identified, according to the guidelines for test of
uncovered PVT collectors.
Side-by-side testing eliminates errors due to different ambient conditions, and it is therefore
possible to see the effect of additional cooling of the pv modules directly. Nominal flow rates
according to the supplier are:
#1: 140 m3/h pr m
2
#2: 75 m3/h pr m
2
#3: 75 m3/h pr m
2
The last PV panel#4 is only cooled by natural convection and should represent an ordinary roof or
ground mounted PV system with open back surface.
4. Data acquisition system
A PC and a rack of A/D converters from Analog Devises were used to collect data as 1 minute
mean values based on 5 second scans. In the table, all sensors are listed. The Pt 100 sensors are flat
surface sensors, which have been taped to the respective surfaces. The wind speed is indicative
only, and is measured in the plane of array with a cup anemometer. The air flow sensors are of the
heat flux type VentCap.
Measurement Sensor Channel Device Cable+wire
no.
Weather data
Irradiance (in plane) Soldata solarimeter 1 6B11 2
Ambient temperature Pt100 2 6B13 2
Wind speed (in plane) Thies Anemometer 0-4.67 mA 3 6B11 2
2
System 1 2
Velocity 1 Air speed sensor 4-20 mA 4 6B11 2
Tout 1 Pt100 5 6B13 2
Tplate 1 Pt100 6 6B13 2
Tpv1 Pt100 7 6B13 2
2
System 2
Velocity 2 Air speed sensor 4-20 mA 8 6B11 2
Tout 2 Pt100 9 6B13 1
Tplate 2 Pt100 10 6B13 1
Tpv 2 Pt100 11 6B13 1
1
System 3 1
Velocity 3 Air speed sensor 4-20 mA 12 6B11 1

IEA SHC – Task 35 – PV/Thermal Solar Systems 13
Tout 3 Pt100 13 6B13 1
Tplate 3 Pt100 14 6B13 1
1
System 4 1
Tpv 4 Pt100 15 6B13 1
Flow calibration:
The air speed sensors only measure the air speed at a specific point of the air flow. In order to find
the volume and mass flow, one has to measure the air speed across the entire velocity profile, and
integrate the parts of the flow. A hot wire anemometer is used for this purpose.
The actual flow is obtained by speed control of the fans.
PV output:
The power from the PV panels is directly proportional to the temperature – the cooler the better.
The cell temperature of each module is therefore taken as an indicator of the possible power output
from that specific module. Temperatures are measured near the middle of the arrays. No actual
electric power is tapped from the modules, and this introduces a small error. If some of the solar
power was converted to electricity, the modules would be slightly cooler.
IEA SHC – Task 35 – PV/Thermal Solar Systems 14
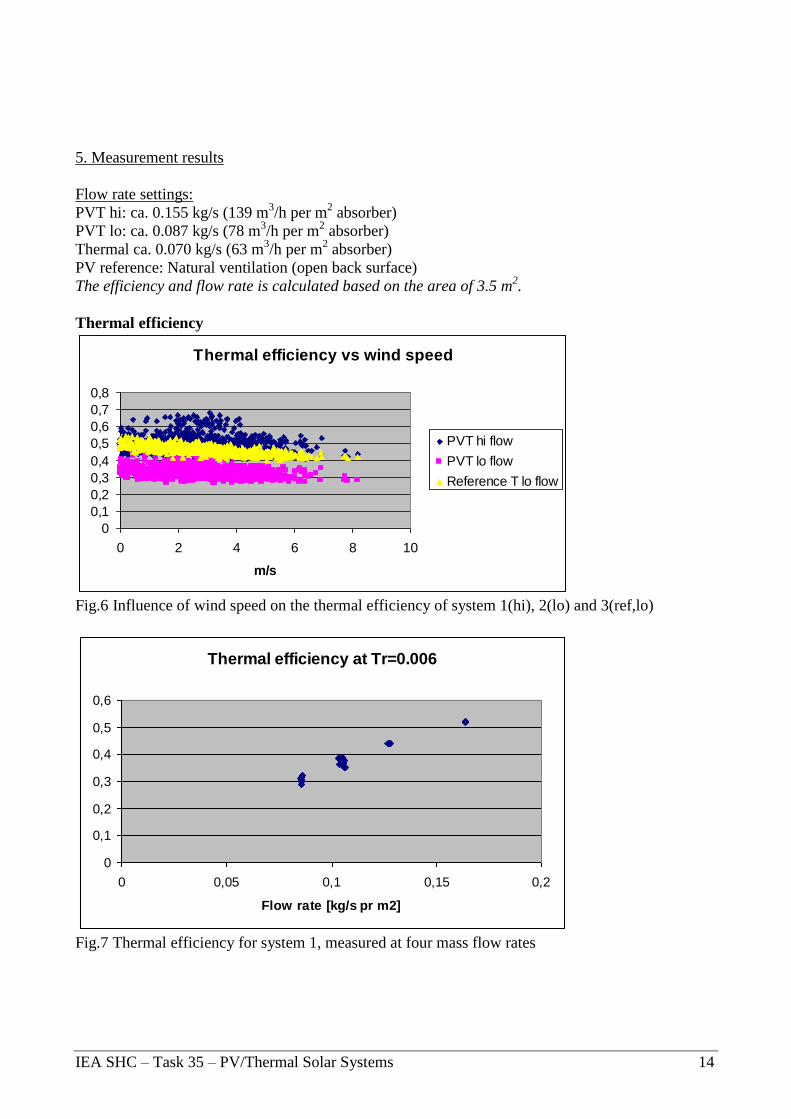
5. Measurement results
Flow rate settings:
PVT hi: ca. 0.155 kg/s (139 m3/h per m
2 absorber)
PVT lo: ca. 0.087 kg/s (78 m3/h per m
2 absorber)
Thermal ca. 0.070 kg/s (63 m3/h per m
2 absorber)
PV reference: Natural ventilation (open back surface)
The efficiency and flow rate is calculated based on the area of 3.5 m2.
Thermal efficiency
Thermal efficiency vs wind speed
0
0,1
0,2
0,3
0,4
0,5
0,6
0,7
0,8
0 2 4 6 8 10
m/s
PVT hi flow
PVT lo flow
Reference T lo flow
Fig.6 Influence of wind speed on the thermal efficiency of system 1(hi), 2(lo) and 3(ref,lo)
Thermal efficiency at Tr=0.006
0
0,1
0,2
0,3
0,4
0,5
0,6
0 0,05 0,1 0,15 0,2
Flow rate [kg/s pr m2]
Fig.7 Thermal efficiency for system 1, measured at four mass flow rates

IEA SHC – Task 35 – PV/Thermal Solar Systems 15
Measured PV module back surface temperature for three different modules
PV overtemperature. V<0,5 m/s
0
5
10
15
20
25
30
35
40
45
0 200 400 600 800 1000
Irradiance [W/m2]
PVT hi flow
PVT lo flow
PV reference
Fig.8 Data points from 04 May 09.00-15.00
The higher temperature of the PV modules mounted on top of the SolarWall elements, may be
explained by a poor heat transfer from the modules to the air, despite a rather high flow rate. The
reference module is cooler because the back surface is fully open, and can exchange heat by
convection as well as by radiation. If the reference was mounted on a solid surface, things would
look different.
At high flow, the PV modules become about 3K cooler than at low flow, and this would cause the
PV power to rise with 3 * 0.49% = 1.5% at an irradiance level of 800 W/m2.
The next graph shows the same experiment another sunny day with little wind, but in this case the
flow in system 1 has been blocked.
PV overtemperature. V<0.5 m/s
y = 0,0383xy = 0,0477xy = 0,0504x0
10
20
30
40
50
0 200 400 600 800 1000
Irradiance [W/m2]
PVT no flow
PVT lo flow
PV reference
Fig.9 Data points from 10 June 2007 09.00-15.00

IEA SHC – Task 35 – PV/Thermal Solar Systems 16
The linearised correlation between irradiance and over temperature relative to ambient (at low wind
speed) can be expressed as:
Flow rate in m3/h pr
m2
PVT module Back side
temperature at 800
W/m2 / 25
0C
Corresponding PV
power [W]
0 T = 0.050 * G + Ta 65.0 122.2
78 T = 0.048 * G + Ta 63.4 123.4
139 T = 0.044 * G + Ta 60.2 125.8
PV reference module
Not defined T = 0.039 * G + Ta 56.2 128.8
It is evident that the improvement of the electrical performance due to forced convection is not very
significant for this particular construction, even at the highest of the tested flow rates.
The cell temperature has been estimated by measurement of the open circuit voltage of the modules.
It seems that the actual cell temperature is up to 10 degrees higher than the temperature measured
by the sensors taped to the surface of the module, but this does not change the relative difference
between the modules.
Flow rate in m3/h pr
m2
PV open circuit
voltage[V]
Theoretical cell
temperature [0C]
0 26.6 80,3
78 27.3 74,5
139 Not measured
PV reference module
Not defined 28.0 67,7
Measured 11 June 2007 13:19
The reason for the different temperature results obtained by this method may be explained by
variations from the nominal open circuit voltage for the individual modules.

IEA SHC – Task 35 – PV/Thermal Solar Systems 17
PV over temperature vs flow (V<2m/s)
0
0,005
0,01
0,015
0,02
0,025
0,03
0,035
0,04
0,045
0,05
0 0,05 0,1 0,15 0,2
Mass flow rate [kg/s pr m2]
Red
uced
PV
back t
em
pera
ture
Fig 10. Measurements from 12 June 2007, where the fan speed of system #1 was adjusted in four
steps. T reduced = (Tpv-Tamb)/G
6. Summary
The test results of this study are in line with other measurement results of air PVT collectors, and
the main conclusion is that it is difficult to achieve a significant cooling effect with the tested design
under the specific measurement conditions, when comparing with a free-standing PV module with
natural ventilation. The most likely reason is that heat transfer from the PV laminate to the
underlying air is limited due to a very low air speed along the surface of the module, and that the
natural cooling by the surrounding wind supersedes the forced ventilation. The conclusion may
possibly be different for higher flow rates with larger fans.
If the measured PV power output is compared with a roof-mounted PV module without forced
ventilation, the result is an increase of the performance of 2-4% with PV/T, depending on the
weather conditions and ventilation rate. The annual increase for a specific PV plant must be
simulated with the actual weather data in order to estimate this effect on an annual basis. For
information, a PVsyst simulation for a mulicrystalline PV system in Münich gives additional yield
of 2.2% and 3.2% for a partly and fully (naturally) ventilated PV system. For warmer climates the
benefit of ventilation could be higher.
The thermal efficiency of the SolarWall absorber was found to be somewhat reduced when a PV
module is mounted on top of it, which was expected, but the combined efficiency of PV and
thermal energy conversion is higher than for side by side system configuration.
Outdoor testing means that the quality of the measurements is highly depending on the stability of
the weather, and it was therefore necessary to discard most of the data.

IEA SHC – Task 35 – PV/Thermal Solar Systems 18
Log:
02-05-2007 Fans adjusted as close as possible to nominal flow, measurements started
07-05-2007 Fan #1 stopped
12-06-2007 Experiments with variable flow
Fans stopped