measurement procedures - emerson · asael sharabi, emerson automation solutions, usa, explains how...
TRANSCRIPT
ASAEL SHARABI, EMERSON AUTOMATION SOLUTIONS, USA, EXPLAINS HOW THE LATEST 3D LEVEL SCANNER TECHNOLOGY ENABLES ACCURATE VOLUME MEASUREMENT OF UREA TO IMPROVE INVENTORY MANAGEMENT.
SOLID MEASUREMENT PROCEDURES
Inventory is one of the most important facets of a production and storage process, and its effective management is increasingly recognised as a key component of an
organisation’s financial health and profitability. Accurate and reliable measurement of bulk solids, such as urea, is critical for inventory control and maintaining efficient operations. However, many types of level instrumentation used successfully in other process industries cannot withstand the special challenges of the fertilizer industry, such as dusty conditions that can obstruct measurement readings or the need for volume measurements to support bulk solid inventory management.
Within fertilizer production, raw materials and final products are stored in large silos or warehouses. Unlike liquids that have a relatively easy to measure level surface, the surface of solid materials is rarely flat, with peaks and troughs that change as the storage unit is filled and emptied. Performing manual measurements is time-consuming, inaccurate and fails to provide the data needed to support best practice in inventory management. It also creates safety concerns, as

| WORLD FERTILIZER | REPRINTED FROM MAY / JUNE 2017
workers can be required to perform duties in hazardous locations. This is especially the case when materials such as urea are involved.
The traditional approach to monitoring inventory in this industry has been to use load cells to monitor incoming and outgoing movements, with mechanical devices known as yo-yos deployed to measure levels in vessels. However, both technologies have limitations in terms of accuracy, reliability and repeatability of measurement. Yo-yos feature a weight attached to a wire being lowered onto the surface of the solids at scheduled times. The device calculates the level of the product based
on the length of wire required before the weight touches the surface. However, as the spool mechanism is in contact with the product, these systems require regular maintenance – exposing operators to hazardous products and trips up to the top of tall silos. Also, losing the weight due to a broken wire can cause serious problems further down the production process.
Typically, accuracy with this measurement technique is no better than ±10 – 15%. In a warehouse, capable of storing thousands of tonnes, that adds up to a large ‘invisible’ inventory, which is a problem. Such unreliable measurements leave process operators with insufficient information for effective day-to-day decision-making and inventory reports.
Automated solutions can help with some of these issues. Technologies such as radar and ultrasonic enable continuous measurements in silos. These technologies, when correctly applied and installed, help to improve safety and enable process levels to be monitored remotely from the comfort of a control room. However, devices that measure the level at a single point within a vessel do not account for variations caused by peaks and troughs, making any measurement of volume extremely inaccurate and unreliable. At large storage facilities, installing multiple devices to obtain additional level data helps to provide a more accurate calculation of the total volume of materials in the vessel. However, the calculation may still be inaccurate if the surface of the media does not follow the expected shape.
The dramatic undulations and varying surface of solids makes measuring the level in a vessel less than useful when trying to determine the amount of product being stored. For example, the level at one point in the vessel might be at a height that suggests the vessel is 50% full, directly beneath a filling point it could be 100% or above the emptying point it could be 0% full. These huge variations make it impossible to calculate how much material is actually being stored. Instead of a ‘level’ at one location (or even several), and maximum or minimum levels, the metric required is the total volume of the solids.
Technologies for measuring solids level and volumeNew acoustic frequency scanner technologies can now replace traditional single point level measurements with continuous online volume measurement, and also offer visualisation of peaks and valleys within vessels.
Measurement devices called acoustic scanners are based on sonic (acoustic) technology and are similar to ultrasonic, but operate at lower frequencies. This is useful in a typical dusty solids application because low-frequency sound waves are absorbed less as they travel through dust than high-frequency sound waves. Acoustic-based scanners are unaffected by environmental conditions, such as dust, filling noise, humidity or temperature. In addition, acoustic devices are inherently self-cleaning, with any dust particles that coat the horns being driven out by the vibrating membranes. Although solids being measured must have a bulk density above 0.2 short t/m3, there is no need to perform any special calibration for different materials.
Figure 1. Solids level measurement technologies.
Figure 2. Rosemount 5708 series 3D scanner.

REPRINTED FROM MAY / JUNE 2017 | WORLD FERTILIZER |
A further benefit of lower frequency devices is that they use a wider beam angle. In solids applications, where the objective is to map as much of the surface as possible, a wide beam angle is preferred as it allows more of the surface to be mapped with fewer antennas.
3D mapping technologies provide accurate and reliable resultsRecognising the need for accurate volume measurements of bulk solids and powders in large storage vessels, Emerson has developed a range of 3D solids scanners that use a combination of acoustic measurement and 3D mapping technologies. They provide accurate and reliable results, even when measuring uneven or sloping surfaces under humid or dusty conditions.
Rosemount 5708 Series 3D scanners use an integral array of three antennas that generate unique dust-penetrating low-frequency acoustic waves and receive echoes from the contents. Using these antennas, the 3D scanner not only measures the time/distance of each echo, but also its direction. Collecting multiple echoes from different directions and distances enables the scanner to calculate the volume of stored material with great accuracy.
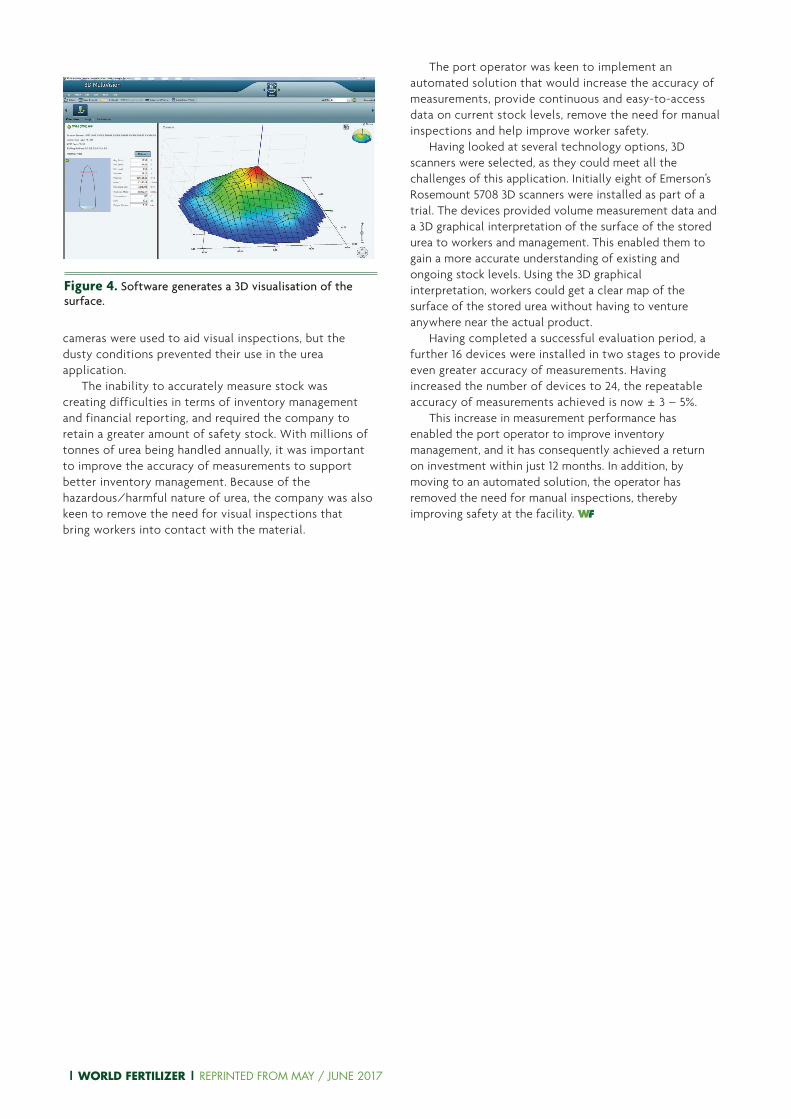
Rosemount 3D solids scanners can be used with Emerson’s PC software Rosemount 3DMultiVision™ to generate a 3D visualisation of the measured surface. Once a detailed map of the surface has been obtained, total volume is calculated from the known vessel shape. This data can then be integrated into a SCADA system. For very large storage warehouses or irregularly-shaped vessels, bins and silos, multiple 3D scanners can merge their individual measurements to provide operators with one combined complete ‘wall-to-wall’ surface map.
Using multi-point surface mapping capabilities, 3D solids scanners reliably and accurately measure the volume of stored contents. In addition, their 3D visualisation tool allows operators to see the distribution inside the vessels in real time. Matching the received data with known container or warehouse dimensions allows an easy calculation of product volume. In addition, it allows for an annual or rolling measurement of inventory, a key requirement to prevent over- or under-purchasing of products. When the density of the material is known and accurate, mass can also be calculated.
Efficient inventory management allows companies to have the right amount of stock in the right place at the right time, and ensures that capital is not tied up unnecessarily. Replacing a level measurement device with a 3D solids scanner can immediately save between 8% and 13% of on-hand inventory cost. Based on an annual inventory carrying cost of between 25% and 52% of on-hand inventory, this translates into a lot of money. A 3D solids scanner quickly pays for itself based on the reduction of annual carrying costs, typically within a year.
Improved inventory managementA good example of how 3D scanners are helping to improve inventory management can be found at one of India’s largest private ports. As part of its operation the port has 40 warehouses to store a range of materials, including grain, coal, iron ore and urea. Urea is stored in a
large warehouse measuring 78 x 25 x 6.5 m, which sees the fastest turnover of stock at the facility.
Because of the size of the warehouse, the large variations in the surface height of the stored urea and the rapid turnover of material, it was very difficult to monitor the stock accurately. Single point level solutions provide no value when trying to measure such a big surface area, the large amount of dust meant that laser-based devices would be ineffective, and the hazardous nature of urea meant that regular manual inspections were not appropriate.
To estimate stock levels, calculations were based on incoming truck loads and outgoing use measured by load cells under conveyor belts. However, this method of measurement did not provide the required level of accuracy. Visual inspections were also performed from the two entrances to the warehouse, but large peaks in the material prevented a clear picture of the stored stock being gained. Within some of the other warehouses,
Figure 3. Multiple scanners provide complete coverage in larger vessels.
| WORLD FERTILIZER | REPRINTED FROM MAY / JUNE 2017
cameras were used to aid visual inspections, but the dusty conditions prevented their use in the urea application.
The inability to accurately measure stock was creating difficulties in terms of inventory management and financial reporting, and required the company to retain a greater amount of safety stock. With millions of tonnes of urea being handled annually, it was important to improve the accuracy of measurements to support better inventory management. Because of the hazardous/harmful nature of urea, the company was also keen to remove the need for visual inspections that bring workers into contact with the material.
The port operator was keen to implement an automated solution that would increase the accuracy of measurements, provide continuous and easy-to-access data on current stock levels, remove the need for manual inspections and help improve worker safety.
Having looked at several technology options, 3D scanners were selected, as they could meet all the challenges of this application. Initially eight of Emerson’s Rosemount 5708 3D scanners were installed as part of a trial. The devices provided volume measurement data and a 3D graphical interpretation of the surface of the stored urea to workers and management. This enabled them to gain a more accurate understanding of existing and ongoing stock levels. Using the 3D graphical interpretation, workers could get a clear map of the surface of the stored urea without having to venture anywhere near the actual product.
Having completed a successful evaluation period, a further 16 devices were installed in two stages to provide even greater accuracy of measurements. Having increased the number of devices to 24, the repeatable accuracy of measurements achieved is now ± 3 – 5%.
This increase in measurement performance has enabled the port operator to improve inventory management, and it has consequently achieved a return on investment within just 12 months. In addition, by moving to an automated solution, the operator has removed the need for manual inspections, thereby improving safety at the facility.
Figure 4. Software generates a 3D visualisation of the surface.