measurement of vibration and noise...
TRANSCRIPT

Paper No. 4.05 1
MEASUREMENT OF VIBRATION AND NOISE DURING THE INSTALLATION OF RAMMED AGGREGATE PIERS
Gregg L. Fiegel, PhD, PE, GE Tom M. Farrell, PE, GE California Polytechnic State University Farrell Design Build Companies San Luis Obispo, California-USA 93407 Placerville, California-USA 95667 ABSTRACT The objective of the study was to record and evaluate ground vibration and noise generated during the installation of rammed aggregate piers (RAPs). Summarized are ground vibration and noise induced by the ramming equipment (i.e. the hydraulic break hammer and rammer) during the installation of forty-five RAPs at a single site. Data were collected during the entire installation process for each pier, which allowed for the measurement of ground vibration and noise levels for periods when the ramming equipment was positioned at different depths within the RAP. Measurements were also taken at different horizontal distances from the ramming equipment and RAP being installed. The entire data set consists of over 160 ground vibration measurements and over 260 noise measurements. Peak ground velocities measured during the study ranged between approximately 0.5 and 15 millimeters per second for horizontal distances ranging between 1.5 and 10.5 meters. Corresponding vibration frequencies ranged between approximately 20 and 60 Hz. Measured noise levels ranged between approximately 82 and 111 dBA for measurement locations between approximately 1.5 and 10.5 meters from the hammer. Overall, these measured ground vibrations and noise levels are moderate in nature and below those typically generated during pile driving. INTRODUCTION In recent years, Geopier® rammed aggregate piers (RAPs) have been used more and more in geotechnical engineering design and construction to help strengthen and reduce the compressibility of soft clays, undocumented fills, and loose sands. The principle behind the RAP construction technique is as follows: remove the weak and compressible soil by excavating in a discrete fashion; then, replace the excavated soil with rammed and highly compacted aggregate backfill. The resulting composite soil mass has greater stiffness and strength and is better able to support foundation loads. Rammed aggregate piers are used as an alternative to deep foundations and various ground improvement techniques, including mass excavation and replacement. Often, RAPs are installed immediately adjacent to existing structures and facilities. Because the aggregate of a RAP is highly compacted (i.e. rammed) during installation, ground vibrations and construction noise are typically a concern of designers, contractors, owners, and the general public. The objective of this study was to record and evaluate ground vibration and noise induced by the ramming equipment (i.e. hydraulic break hammer and rammer) during the installation of several rammed aggregate piers (RAPs). Vibration and noise levels were measured using a triaxial
geophone and a portable sound level meter. Data were collected during the complete installation of numerous RAPs. Thus, ground vibration and noise measurements were obtained with the ramming equipment positioned at different depths within the RAP. In addition, measurements were taken at different horizontal distances from the ramming equipment and RAP. Summarized in the following paper are vibration and noise levels that were measured at California Polytechnic State University, San Luis Obispo during the installation of forty-five rammed aggregate piers. RAPs were used to provide foundation support for the new 3-story Engineering IV classroom and laboratory. All measurements for this study were taken by the authors over two weeks in June 2005. RAMMED AGGREGATE PIER CONSTRUCTION The RAP construction process is illustrated on Figure 1. Installation involves drilling a 762- to 838-millimeter (30- to 33-inch) diameter shaft and replacing the excavated soil with rammed lifts of aggregate. Constructed depths ranging from about 2 to 9 meters (6 to 30 feet) are typical. The ramming equipment consists of a 200 kilo-Newton (45,000 pound) hydraulic excavator equipped with a 15.6 kilo-

Paper No. 4.05 2
Newton (3,500 pound) hydraulic break hammer and a specially designed 45º beveled ram. The hammer hits the rammer at a rate of 300 to 500 blows per minute. The resulting energy delivered by the hammer is between 1,300 and 2,600 kilo-Joules (1 and 2 million foot-pounds). Figure 2 shows the RAP installation equipment.
Fig. 1. Typical RAP construction process: (A) drill a 762 to 838 mm (30 to 33 inch) RAP shaft; (B) ram 50 mm (2-inch)
crushed rock into the bottom bulb; (C) ram 304 mm (12 inch) lifts of 19 to 38 mm aggregate base rock to152mm (6 inches)
above the bottom of footing design elevation.
Fig. 2. Typical RAP installation equipment. The specially designed ram is used to form thin, expanded rock lifts inside the RAP (Majchrzak 2004). After drilling, a lift of crushed rock is embedded into the bottom of the drilled shaft. This initial lift is commonly referred to as the RAP "bottom bulb." In weak soil, up to a cubic meter of crushed rock can be rammed in order to stabilize the bottom bulb. Once the bottom bulb is stabilized, the remainder of the shaft is filled, typically using about 0.16 cubic meters of well graded aggregate base to form the roughly 304 mm (12-inch) compacted lifts.
The end result after RAP installation is a stiff, highly compacted aggregate pier along with improved soil up to one diameter from the drilled edge (Pitt et. al. 2003). Overall, the ramming action used during installation increases the lateral stress in the surrounding soil and increases the stiffness of the stabilized composite soil mass. The increased lateral stress and the undulated RAP shape effectively couples the RAP aggregate to the surrounding soil matrix thus providing an efficient mechanism for shear resistance along the sides of the RAP (Handy 2000; White et. al 2002). Rammed aggregate piers have been shown to exhibit friction angles varying from 48 to 52 degrees and dry unit weights from 22 to 24 kilo-Newtons per cubic meter (140 to 148 pounds per cubic foot) (Fox and Cowell 1998). Depending on RAP depth, soil conditions, and construction site conditions, typical installation rates vary from about 35 to 60 RAPs per day. Slower rates are typical for installations that require temporary casing. A discussion of quality control testing for rammed aggregate pier installations can be found in ICC Evaluation Service Inc. (2006). ENGINEERING IV SITE CONDITIONS The project site is located on the campus of California Polytechnic State University in San Luis Obispo, California. The Engineering IV structure is located on the northwest corner of the campus adjacent to a seasonal creek. The soils encountered at the site generally consisted of medium stiff to stiff clays and silts with varying amounts of sand and gravel. A typical site boring log is illustrated on Figure 3.
Fig. 3. Typical site boring log and soil profile.

Paper No. 4.05 3
As shown on Figure 3, the site consists of approximately 8.5 meters (28 feet) of alluvial clays and silts overlying claystone bedrock. Representative standard penetration test (SPT) blow-counts are illustrated on the boring log along with soil types as defined by the Unified Soil Classification System (USCS). At the time of the subsurface investigation, the groundwater table was encountered at a depth approximately 5 meters (17 feet) below the ground surface. However, the depth of the groundwater table was approximately 3.6 meters (12 feet) at the time of RAP installation. RAP INSTALLATION AT ENGINEERING IV Prior to installation of the RAPs, the building site was cleared of vegetation, existing pavement, and utilities. Grading was performed to over-excavate and remove approximately 1.2 meters (4 feet) of surface soil from the site. This soil was replaced with approximately 1 meter (3 feet) of engineered fill composed of locally imported silty sand (decomposed granite). The depth of the engineered fill varied between approximately 1 and 1.5 meters (3 and 5 feet) depending on the foundation elevations and the depth of the over-excavation. The project plans called for the installation of 180 bearing RAPS and 120 uplift RAPs. Uplift RAPs are described in Majchrzak et al. (2004). The bearing RAPS measured 762 millimeters (30 inches) in diameter and were 3.6 meters (12 feet) deep below footings. The uplift RAPS measured 838 millimeters (33 inches) in diameter and were 4.6 meters (15 feet) deep below footings. The RAPs were designed to support shallow spread footings using a RAP-improved bearing pressure of 311 kilo-Pascals (6,500 pounds per square foot) ASD for dead plus live loads. A RAP design stiffness modulus of 59.7 MN/m3 (200 pci) was selected for settlement estimates. A 200 kilo-Newton (45,000 pound) hydraulic excavator and a 15.6 kilo-Newton (3,500 pound) hydraulic break hammer were used to install the RAPs at the site. As part of this project, several test RAPs were installed at the site and subsequently load tested. Load test results showed repeatable stiffness after multiple load test cycles. In the RAP bearing load test, the measured RAP stiffness modulus exceeded 135 MN/m3 (498 pci). At a top stress of 7,660 kilo-Pascals (16,000 pounds per square foot), the load tested RAPs exhibited less than 50 millimeters of deflection. INSTRUMENTATION Triaxial Geophone Ground vibration levels were recorded using a Minimate Plus™ portable seismograph manufactured by Instantel®. The seismograph is capable of recording multiple blast or construction events at sampling rates from 1024 to 16K
samples per second. Ground vibration is measured using the seismograph and a small triaxial geophone. The triaxial geophone allows for the measurement of ground velocity in three orthogonal directions (i.e. transverse, vertical, and longitudinal). During testing, the longitudinal direction is typically directed toward the source of the vibration. Prior to recording, the geophone is placed on a level ground surface. The instrument is either anchored to the ground surface using three spikes or held firmly in place using a heavy sandbag. In this study, a heavy sandbag was used hold the instrument in place and provide for firm contact with the ground. Sound Level Meter Noise levels were recorded using a Model 2700 hand held sound level meter manufactured by Quest Technologies®. Measured sound pressure levels are displayed on a liquid crystal display (LCD) window that contains both a numeric readout and a bar indicator. The Model 2700 sound level meter is capable of measuring sound pressure levels up to 140 decibels (dB) for A, B, C, and linear weighting modes. The meter allows for tripod mounting and comes with a foam windscreen. Prior to obtaining measurements in the field, the sound level meter was calibrated using a Quest Technologies® Model QC-20 sound calibrator. MONITORING Ground vibration and/or noise levels were recorded during the installation of forty-five rammed aggregate piers. Figure 4 shows a photograph of the typical monitoring station. The instrumentation was placed in essentially the “free-field” away from construction equipment, stock piles, slopes, and other RAPs. Measurement locations were selected so as to limit interference with construction operations. For each RAP examined, a similar procedure was followed to set-up the equipment and take readings. Placement of Instrumentation After a measurement location was selected, the geophone was placed on a smoothed ground surface and leveled. The longitudinal axis of the geophone was pointed toward the pier. Effort was made to ensure firm contact between the geophone and the underlying ground, and a sandbag weighing 110 to 130 Newtons (25 to 30 pounds) was placed completely over the geophone to hold it in place. The seismograph was connected to the geophone with a data cable and positioned several feet behind the measurement location. Figure 4 shows the geophone and seismograph as placed next to a RAP installation location. The sound level meter was mounted on a tripod and placed immediately next to the geophone and seismograph, as shown on Figure 4. Prior to testing, the microphone of the sound

Paper No. 4.05 4
level meter was leveled, fitted with a foam windscreen, and pointed toward the pier. With the tripod mounting, the sound level meter was positioned approximately 1 meter (3 feet) above the ground surface.
Fig. 4 Photograph showing typical instrumentation set-up. Instrument Readings Ground vibration and noise measurements began with the placement and ramming of the “bottom bulb” of the RAP. Before initial ramming, the seismograph was activated. The seismograph then recorded ground vibration (i.e. particle velocity) during the entire RAP installation process. During installation a hand-written monitoring log was maintained. Lift placement times, ramming periods, ramming depths, noise measurements, and construction notes were recorded on the log. Times noted on the log were coordinated with the clock of the seismograph. Ground Vibration. Ground vibration was typically recorded with the seismograph set for “histogram record mode.” In this mode the seismograph continuously sampled ground velocity for all three geophone components at a rate of 2048 samples per second. However, the only data stored in the seismograph’s memory were the peak velocities recorded over 2 second intervals. For each sample interval, the seismograph calculated the maximum peak velocity (positive or negative), the peak vector sum velocity (PVS), and the frequency of the largest peak.
The vector sum represents the resultant particle velocity magnitude and is calculated using the following equation: 222 LVTSumVector ++= (1) where: T = particle velocity in the transverse direction V = particle velocity in the vertical direction L = particle velocity in the longitudinal direction Note that the peak vector sum does not necessarily occur at the same time as the peak velocity for an individual waveform recorded in the transverse, vertical, or longitudinal directions. The frequency of the largest peak in cycles per second (Hz) is found by taking the inverse of the estimated period of the waveform. The period is estimated by knowing the time between two successive zero crossings of the velocity waveform immediately before and after the peak velocity value. The calculation of this zero crossing (ZC) frequency assumes a single predominant frequency at the peak velocity, or a sinusoidal waveform. In practice, the peak velocity may be the result of two or more major frequency components representing a compound waveform. Therefore, the ZC frequency only represents an approximation of the frequency of the peak velocity. Construction Noise. Noise levels were measured using the sound level meter in A-weighting mode. While ramming was being conducted for a particular RAP, a research assistant hand recorded sound measurements on the monitoring log at a rate of approximately 1 to 2 readings per second. The sound readings were numeric decibel (dBA) values displayed on the sound level meter. The assistant stood away from the meter as far as possible when taking readings to limit sound wave reflections. The depth of the rammer was recorded on the monitoring log with each set of sound readings. Sound data collected during the installation of a RAP included a series of sound readings for each ramming period. The average noise level for a particular ramming period was estimated by simply taking the arithmetic mean of the sound readings that were recorded. RESULTS Summarized in this section are ground vibration and noise levels recorded during this study. Ground vibration and noise measurements were obtained with the ramming equipment positioned at different depths within the RAP. In addition, measurements were taken at different horizontal distances from the ramming equipment and RAP. Hand written monitoring logs and seismograph event reports were matched so that all of the recorded data could be examined as a function of rammer depth and horizontal distance.
SANDBAG & GEOPHONE
SOUND LEVEL METER
RAMMER
SEISMOGRAPH
Paper No. 4.05 5
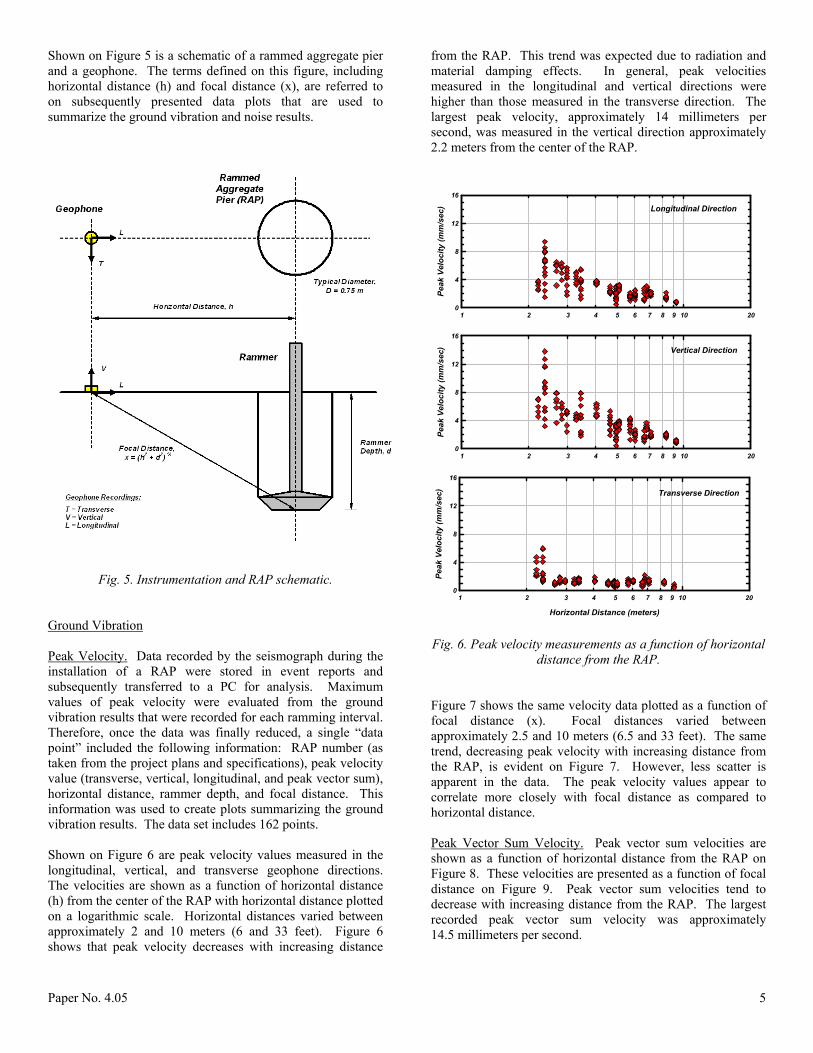
Shown on Figure 5 is a schematic of a rammed aggregate pier and a geophone. The terms defined on this figure, including horizontal distance (h) and focal distance (x), are referred to on subsequently presented data plots that are used to summarize the ground vibration and noise results.
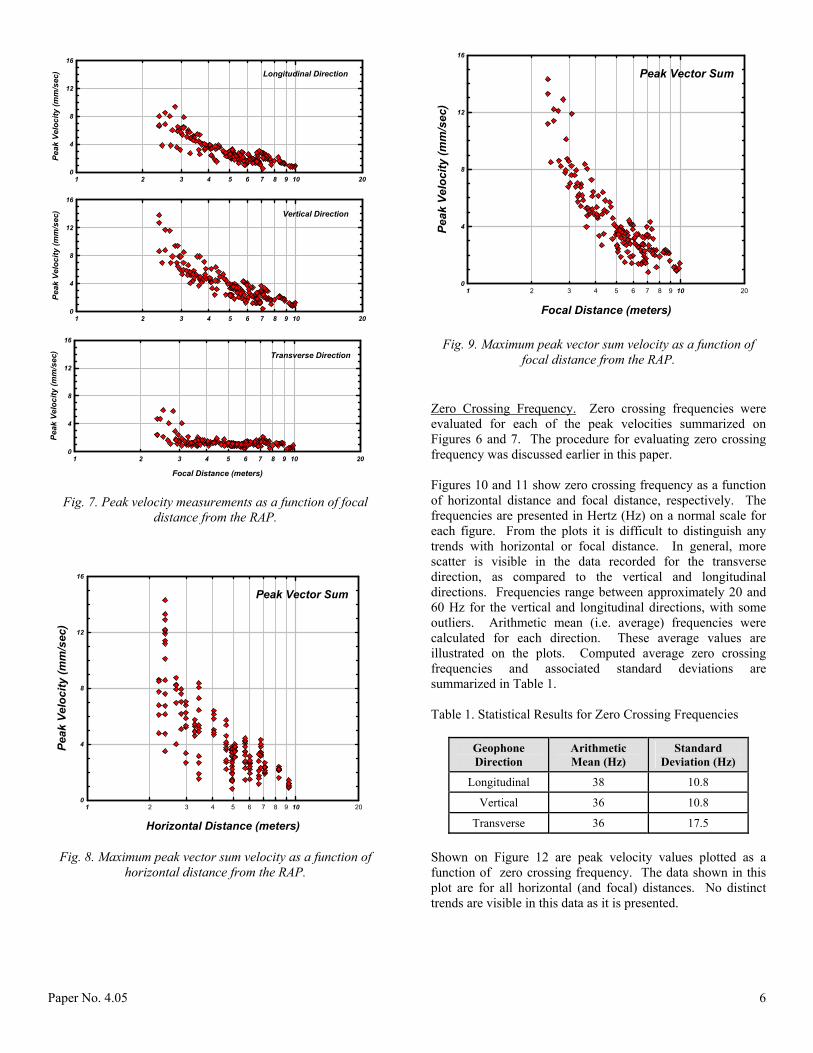
Fig. 5. Instrumentation and RAP schematic. Ground Vibration Peak Velocity. Data recorded by the seismograph during the installation of a RAP were stored in event reports and subsequently transferred to a PC for analysis. Maximum values of peak velocity were evaluated from the ground vibration results that were recorded for each ramming interval. Therefore, once the data was finally reduced, a single “data point” included the following information: RAP number (as taken from the project plans and specifications), peak velocity value (transverse, vertical, longitudinal, and peak vector sum), horizontal distance, rammer depth, and focal distance. This information was used to create plots summarizing the ground vibration results. The data set includes 162 points. Shown on Figure 6 are peak velocity values measured in the longitudinal, vertical, and transverse geophone directions. The velocities are shown as a function of horizontal distance (h) from the center of the RAP with horizontal distance plotted on a logarithmic scale. Horizontal distances varied between approximately 2 and 10 meters (6 and 33 feet). Figure 6 shows that peak velocity decreases with increasing distance
from the RAP. This trend was expected due to radiation and material damping effects. In general, peak velocities measured in the longitudinal and vertical directions were higher than those measured in the transverse direction. The largest peak velocity, approximately 14 millimeters per second, was measured in the vertical direction approximately 2.2 meters from the center of the RAP.
2 3 4 5 6 7 8 9 201 10
Peak
Vel
ocity
(mm
/sec
)
0
4
8
12
16
2 3 4 5 6 7 8 9 201 10
Peak
Vel
ocity
(mm
/sec
)0
4
8
12
16
Horizontal Distance (meters)
2 3 4 5 6 7 8 9 201 10
Peak
Vel
ocity
(mm
/sec
)
0
4
8
12
16
Transverse Direction
Vertical Direction
Longitudinal Direction
Fig. 6. Peak velocity measurements as a function of horizontal distance from the RAP.
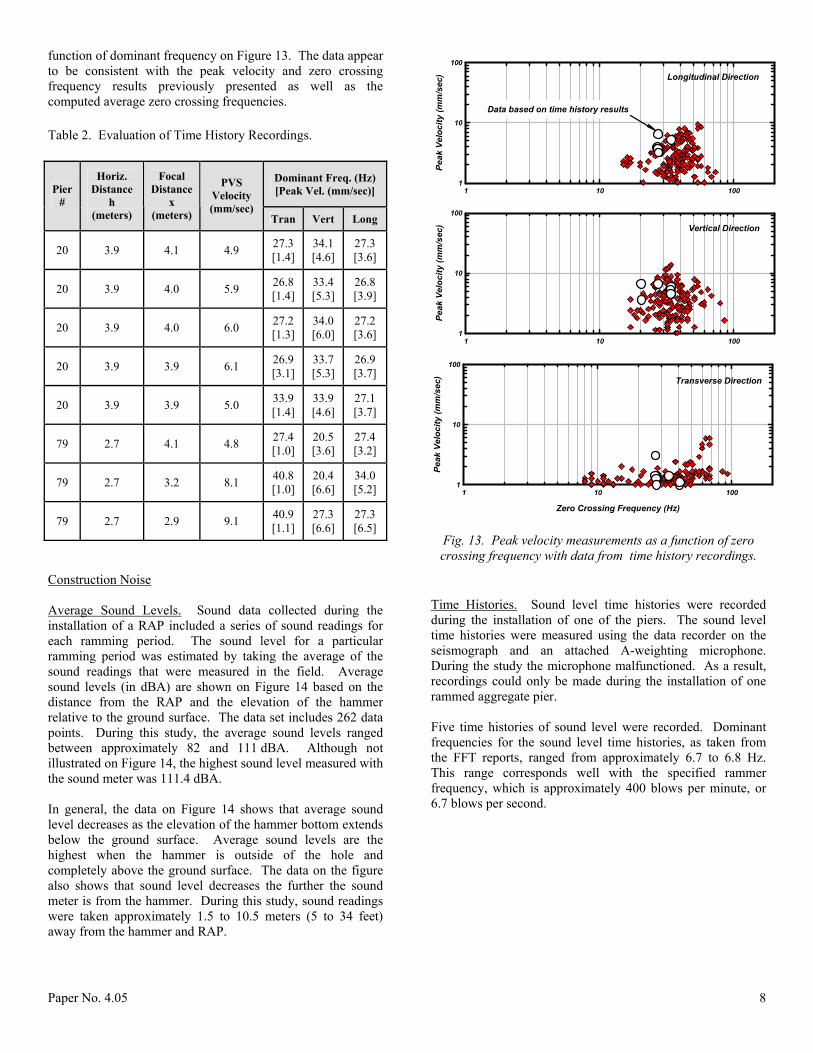
Figure 7 shows the same velocity data plotted as a function of focal distance (x). Focal distances varied between approximately 2.5 and 10 meters (6.5 and 33 feet). The same trend, decreasing peak velocity with increasing distance from the RAP, is evident on Figure 7. However, less scatter is apparent in the data. The peak velocity values appear to correlate more closely with focal distance as compared to horizontal distance. Peak Vector Sum Velocity. Peak vector sum velocities are shown as a function of horizontal distance from the RAP on Figure 8. These velocities are presented as a function of focal distance on Figure 9. Peak vector sum velocities tend to decrease with increasing distance from the RAP. The largest recorded peak vector sum velocity was approximately 14.5 millimeters per second.
Paper No. 4.05 6
2 3 4 5 6 7 8 9 201 10
Peak
Vel
ocity
(mm
/sec
)
0
4
8
12
16
2 3 4 5 6 7 8 9 201 10
Peak
Vel
ocity
(mm
/sec
)
0
4
8
12
16
Focal Distance (meters)
2 3 4 5 6 7 8 9 201 10
Peak
Vel
ocity
(mm
/sec
)
0
4
8
12
16
Transverse Direction
Vertical Direction
Longitudinal Direction
Fig. 7. Peak velocity measurements as a function of focal distance from the RAP.
Horizontal Distance (meters)
2 3 4 5 6 7 8 9 201 10
Peak
Vel
ocity
(mm
/sec
)
0
4
8
12
16
Peak Vector Sum
Fig. 8. Maximum peak vector sum velocity as a function of horizontal distance from the RAP.
Focal Distance (meters)
2 3 4 5 6 7 8 9 201 10
Peak
Vel
ocity
(mm
/sec
)
0
4
8
12
16
Peak Vector Sum
Fig. 9. Maximum peak vector sum velocity as a function of focal distance from the RAP.
Zero Crossing Frequency. Zero crossing frequencies were evaluated for each of the peak velocities summarized on Figures 6 and 7. The procedure for evaluating zero crossing frequency was discussed earlier in this paper. Figures 10 and 11 show zero crossing frequency as a function of horizontal distance and focal distance, respectively. The frequencies are presented in Hertz (Hz) on a normal scale for each figure. From the plots it is difficult to distinguish any trends with horizontal or focal distance. In general, more scatter is visible in the data recorded for the transverse direction, as compared to the vertical and longitudinal directions. Frequencies range between approximately 20 and 60 Hz for the vertical and longitudinal directions, with some outliers. Arithmetic mean (i.e. average) frequencies were calculated for each direction. These average values are illustrated on the plots. Computed average zero crossing frequencies and associated standard deviations are summarized in Table 1. Table 1. Statistical Results for Zero Crossing Frequencies
Geophone Direction
Arithmetic Mean (Hz)
Standard Deviation (Hz)
Longitudinal 38 10.8
Vertical 36 10.8
Transverse 36 17.5 Shown on Figure 12 are peak velocity values plotted as a function of zero crossing frequency. The data shown in this plot are for all horizontal (and focal) distances. No distinct trends are visible in this data as it is presented.

Paper No. 4.05 7
2 3 4 5 6 7 8 9 201 10
Zero
Cro
ssin
g Fr
eque
ncy
(Hz)
0
20
40
60
80
100
2 3 4 5 6 7 8 9 201 10
Zero
Cro
ssin
g Fr
eque
ncy
(Hz)
0
20
40
60
80
100
Horizontal Distance (meters)
2 3 4 5 6 7 8 9 201 10
Zero
Cro
ssin
g Fr
eque
ncy
(Hz)
0
20
40
60
80
100
Transverse Direction
Vertical Direction
Longitudinal Direction
Average
Average
Average
Fig. 10. Zero crossing frequency versus horizontal distance.
2 3 4 5 6 7 8 9 201 10
Zero
Cro
ssin
g Fr
eque
ncy
(Hz)
0
20
40
60
80
100
2 3 4 5 6 7 8 9 201 10
Zero
Cro
ssin
g Fr
eque
ncy
(Hz)
0
20
40
60
80
100
Focal Distance (meters)
2 3 4 5 6 7 8 9 201 10
Zero
Cro
ssin
g Fr
eque
ncy
(Hz)
0
20
40
60
80
100
Transverse Direction
Vertical Direction
Longitudinal Direction
Average
Average
Average
Fig. 11. Zero crossing frequency versus focal distance.
1 10 100
Peak
Vel
ocity
(mm
/sec
)
1
10
100
1 10 100
Peak
Vel
ocity
(mm
/sec
)
1
10
100
Zero Crossing Frequency (Hz)
1 10 100Pe
ak V
eloc
ity (m
m/s
ec)
1
10
100
Transverse Direction
Vertical Direction
Longitudinal Direction
Fig. 12. Peak velocity measurements as a function of zero crossing frequency.
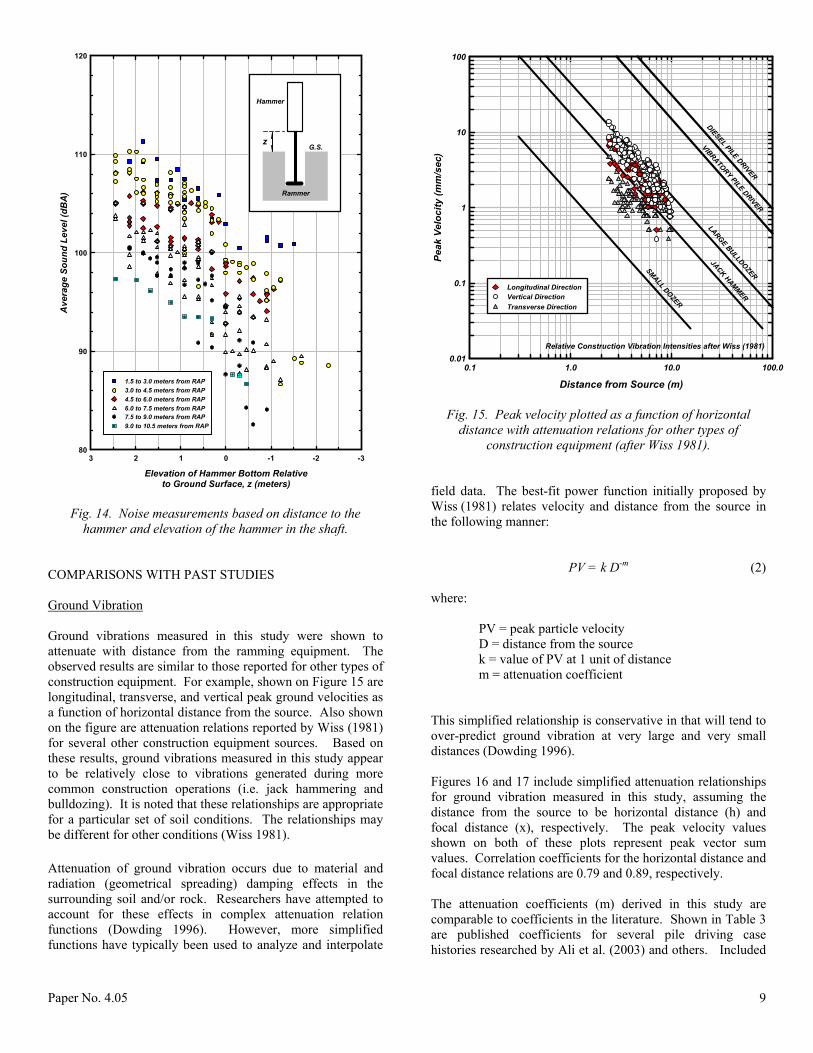
Time Histories. The Minimate Plus™ portable seismograph is capable of recording time histories of ground vibration. Prior to monitoring, the user must first program the seismograph by entering the sample interval, sampling rate, and trigger values for the geophone. On two occasions during this study the seismograph was used to measure time histories of ground vibration during the installation of a RAP. During this monitoring, both 5 and 9 second sample intervals were used with a sampling rate of 2048 samples per second. The time histories were “triggered” by the vibration induced in the ground during ramming. Ramming of the RAP typically continued for a period longer than the sample interval, which was set at 5 or 9 seconds. Software provided with the Minimate Plus™ allows for the generation of Fast Fourier Transform (FFT) reports for time history recordings of ground vibration. FFT results for the vibration recordings can be summarized as plots of Fourier amplitude versus frequency. Dominant frequencies can be evaluated for each recording by evaluating the FFT plots. As part of this study, time history recordings were obtained during the installation of two rammed aggregate piers. A summary of the data collected is presented in Table 2. The table shows dominant frequencies along with associated velocity levels for several different focal distances. The peak transverse, vertical, and longitudinal velocities are plotted as a
Paper No. 4.05 8
function of dominant frequency on Figure 13. The data appear to be consistent with the peak velocity and zero crossing frequency results previously presented as well as the computed average zero crossing frequencies.
Table 2. Evaluation of Time History Recordings.
Dominant Freq. (Hz) [Peak Vel. (mm/sec)] Pier
#
Horiz. Distance
h (meters)
Focal Distance
x (meters)
PVS Velocity (mm/sec)
Tran Vert Long
20 3.9 4.1 4.9 27.3 [1.4]
34.1 [4.6]
27.3 [3.6]
20 3.9 4.0 5.9 26.8 [1.4]
33.4 [5.3]
26.8 [3.9]
20 3.9 4.0 6.0 27.2 [1.3]
34.0 [6.0]
27.2 [3.6]
20 3.9 3.9 6.1 26.9 [3.1]
33.7 [5.3]
26.9 [3.7]
20 3.9 3.9 5.0 33.9 [1.4]
33.9 [4.6]
27.1 [3.7]
79 2.7 4.1 4.8 27.4 [1.0]
20.5 [3.6]
27.4 [3.2]
79 2.7 3.2 8.1 40.8 [1.0]
20.4 [6.6]
34.0 [5.2]
79 2.7 2.9 9.1 40.9 [1.1]
27.3 [6.6]
27.3 [6.5]
Construction Noise Average Sound Levels. Sound data collected during the installation of a RAP included a series of sound readings for each ramming period. The sound level for a particular ramming period was estimated by taking the average of the sound readings that were measured in the field. Average sound levels (in dBA) are shown on Figure 14 based on the distance from the RAP and the elevation of the hammer relative to the ground surface. The data set includes 262 data points. During this study, the average sound levels ranged between approximately 82 and 111 dBA. Although not illustrated on Figure 14, the highest sound level measured with the sound meter was 111.4 dBA. In general, the data on Figure 14 shows that average sound level decreases as the elevation of the hammer bottom extends below the ground surface. Average sound levels are the highest when the hammer is outside of the hole and completely above the ground surface. The data on the figure also shows that sound level decreases the further the sound meter is from the hammer. During this study, sound readings were taken approximately 1.5 to 10.5 meters (5 to 34 feet) away from the hammer and RAP.
1 10 100
Peak
Vel
ocity
(mm
/sec
)
1
10
100
1 10 100
Peak
Vel
ocity
(mm
/sec
)
1
10
100
Zero Crossing Frequency (Hz)
1 10 100
Peak
Vel
ocity
(mm
/sec
)
1
10
100
Transverse Direction
Vertical Direction
Longitudinal Direction
Data based on time history results
Fig. 13. Peak velocity measurements as a function of zero crossing frequency with data from time history recordings.
Time Histories. Sound level time histories were recorded during the installation of one of the piers. The sound level time histories were measured using the data recorder on the seismograph and an attached A-weighting microphone. During the study the microphone malfunctioned. As a result, recordings could only be made during the installation of one rammed aggregate pier. Five time histories of sound level were recorded. Dominant frequencies for the sound level time histories, as taken from the FFT reports, ranged from approximately 6.7 to 6.8 Hz. This range corresponds well with the specified rammer frequency, which is approximately 400 blows per minute, or 6.7 blows per second.
Paper No. 4.05 9
Elevation of Hammer Bottom Relativeto Ground Surface, z (meters)
-3-2-10123
Ave
rage
Sou
nd L
evel
(dB
A)
80
90
100
110
120
Hammer
Rammer
zG.S.
6.0 to 7.5 meters from RAP
9.0 to 10.5 meters from RAP7.5 to 9.0 meters from RAP
4.5 to 6.0 meters from RAP3.0 to 4.5 meters from RAP1.5 to 3.0 meters from RAP
Fig. 14. Noise measurements based on distance to the hammer and elevation of the hammer in the shaft.
COMPARISONS WITH PAST STUDIES Ground Vibration Ground vibrations measured in this study were shown to attenuate with distance from the ramming equipment. The observed results are similar to those reported for other types of construction equipment. For example, shown on Figure 15 are longitudinal, transverse, and vertical peak ground velocities as a function of horizontal distance from the source. Also shown on the figure are attenuation relations reported by Wiss (1981) for several other construction equipment sources. Based on these results, ground vibrations measured in this study appear to be relatively close to vibrations generated during more common construction operations (i.e. jack hammering and bulldozing). It is noted that these relationships are appropriate for a particular set of soil conditions. The relationships may be different for other conditions (Wiss 1981). Attenuation of ground vibration occurs due to material and radiation (geometrical spreading) damping effects in the surrounding soil and/or rock. Researchers have attempted to account for these effects in complex attenuation relation functions (Dowding 1996). However, more simplified functions have typically been used to analyze and interpolate
Distance from Source (m)0.1 1.0 10.0 100.0
Peak
Vel
ocity
(mm
/sec
)
0.01
0.1
1
10
100
Longitudinal DirectionVertical DirectionTransverse Direction
SMALL DOZER
JACK HAMMER
VIBRATORY PILE DRIVER
DIESEL PILE DRIVER
LARGE BULLDOZER
Relative Construction Vibration Intensities after Wiss (1981)
Fig. 15. Peak velocity plotted as a function of horizontal
distance with attenuation relations for other types of construction equipment (after Wiss 1981).
field data. The best-fit power function initially proposed by Wiss (1981) relates velocity and distance from the source in the following manner: PV = k D-m (2) where: PV = peak particle velocity D = distance from the source k = value of PV at 1 unit of distance m = attenuation coefficient This simplified relationship is conservative in that will tend to over-predict ground vibration at very large and very small distances (Dowding 1996). Figures 16 and 17 include simplified attenuation relationships for ground vibration measured in this study, assuming the distance from the source to be horizontal distance (h) and focal distance (x), respectively. The peak velocity values shown on both of these plots represent peak vector sum values. Correlation coefficients for the horizontal distance and focal distance relations are 0.79 and 0.89, respectively. The attenuation coefficients (m) derived in this study are comparable to coefficients in the literature. Shown in Table 3 are published coefficients for several pile driving case histories researched by Ali et al. (2003) and others. Included

Paper No. 4.05 10
on Figure 18 are attenuation relations for vibratory construction equipment (Dowding 1996). Also included on this figure is the attenuation relation from this study that relates peak velocity to horizontal distance.
Horizontal Distance (meters)2 3 4 5 6 7 8 9 201 10
Peak
Vel
ocity
(mm
/sec
)
0.1
1
10
100
PV = 20h-1.17
Fig. 16. Peak velocity attenuation relation based on horizontal distance, h.
Focal Distance (meters)2 3 4 5 6 7 8 9 201 10
Peak
Vel
ocity
(mm
/sec
)
0.1
1
10
100
PV = 40x-1.49
Fig. 17. Peak velocity attenuation relation based on focal distance, x.
Table 3. Published Attenuation Coefficients.
Reference Soil Type Attenuation Coefficient
Sand1 0.88 to 1.02 Ali et al. (2003)-driven piles1 and vibrated sheet piles2 Sand2 0.97 Amick and Unger (1987) Clay 1.5
Attewell and Farmer (1973) Various 1.0 Sand 1.5 Brenner and Chittikuladiok
(1999) Sand over soft clay 0.8 to 1.0
Hajduk et al. (2004) Sand 0.50 to 1.03 Clay 1.4
Martin (1980) Silt 0.8
Nichols et al. (1971) Firm soil and rock 1.4 to 1.7 Sand 1.0
Wiss (1981) Clay 1.5
Dense Sand 1.1 Woods and Jedele (1985)
Med. Dense Sand 1.5
Current Study Clay and Silt 1.17 & 1.49
With knowledge of the attenuation relationship, one can estimate the size of the vibration influence zone during the installation of a RAP. If one assumes that a particle velocity of about 0.5 millimeters per second is equivalent to slightly perceptible steady state ground motion for humans (Wiss 1981), then an appropriate influence zone around RAP during installation would be approximately 20 meters. One would expect the size of this influence zone to be similar to influence zones for other impact-type construction equipment with similar attenuation coefficients and input energy levels.
Distance from Source (m)1 10 100 1000
Peak
Vel
ocity
(mm
/sec
)
0.01
0.1
1
10
100
VIBROFLOTATION, "S" VIBRATOR
VIBRATORY ROLLER (2410)
TUNNEL BORING MACHINE (SOIL)
RAP HAMMER AND RAMMER - HORIZONTAL DISTANCE
Fig. 18. Attenuation relations for vibratory construction equipment (after Dowding 1996).
Paper No. 4.05 11
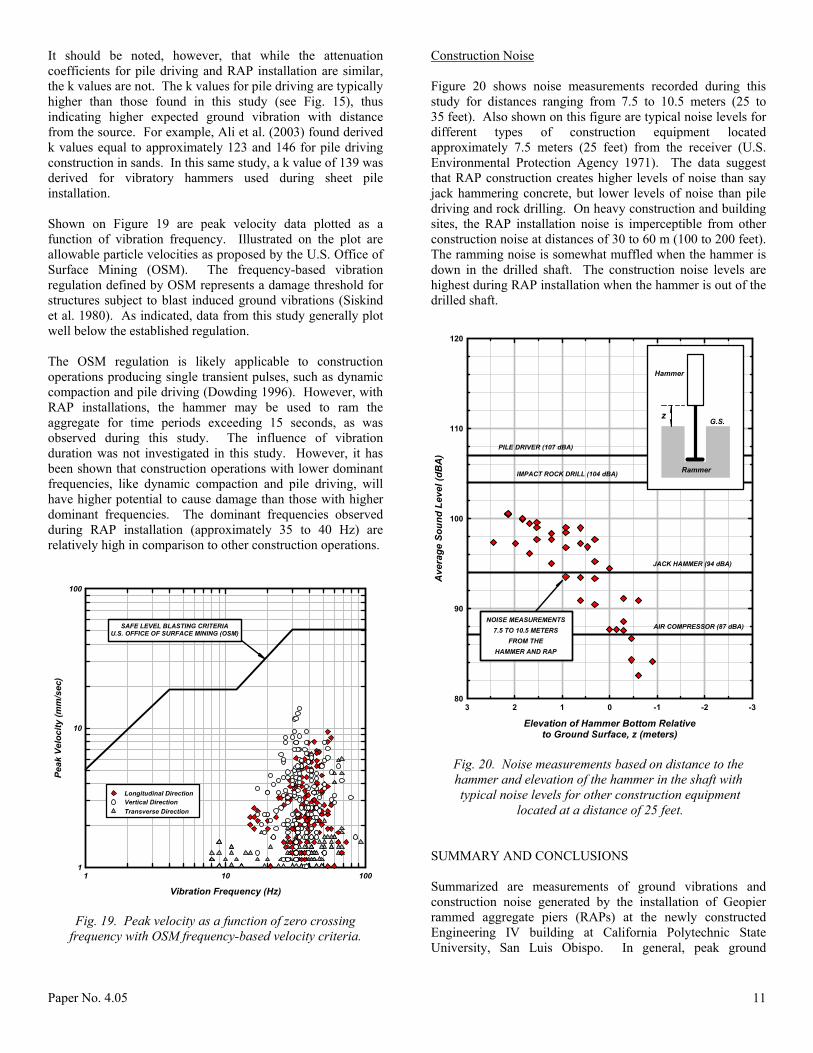
It should be noted, however, that while the attenuation coefficients for pile driving and RAP installation are similar, the k values are not. The k values for pile driving are typically higher than those found in this study (see Fig. 15), thus indicating higher expected ground vibration with distance from the source. For example, Ali et al. (2003) found derived k values equal to approximately 123 and 146 for pile driving construction in sands. In this same study, a k value of 139 was derived for vibratory hammers used during sheet pile installation. Shown on Figure 19 are peak velocity data plotted as a function of vibration frequency. Illustrated on the plot are allowable particle velocities as proposed by the U.S. Office of Surface Mining (OSM). The frequency-based vibration regulation defined by OSM represents a damage threshold for structures subject to blast induced ground vibrations (Siskind et al. 1980). As indicated, data from this study generally plot well below the established regulation. The OSM regulation is likely applicable to construction operations producing single transient pulses, such as dynamic compaction and pile driving (Dowding 1996). However, with RAP installations, the hammer may be used to ram the aggregate for time periods exceeding 15 seconds, as was observed during this study. The influence of vibration duration was not investigated in this study. However, it has been shown that construction operations with lower dominant frequencies, like dynamic compaction and pile driving, will have higher potential to cause damage than those with higher dominant frequencies. The dominant frequencies observed during RAP installation (approximately 35 to 40 Hz) are relatively high in comparison to other construction operations.
Vibration Frequency (Hz)1 10 100
Peak
Vel
ocity
(mm
/sec
)
1
10
100
Longitudinal DirectionVertical DirectionTransverse Direction
SAFE LEVEL BLASTING CRITERIAU.S. OFFICE OF SURFACE MINING (OSM)
Fig. 19. Peak velocity as a function of zero crossing frequency with OSM frequency-based velocity criteria.
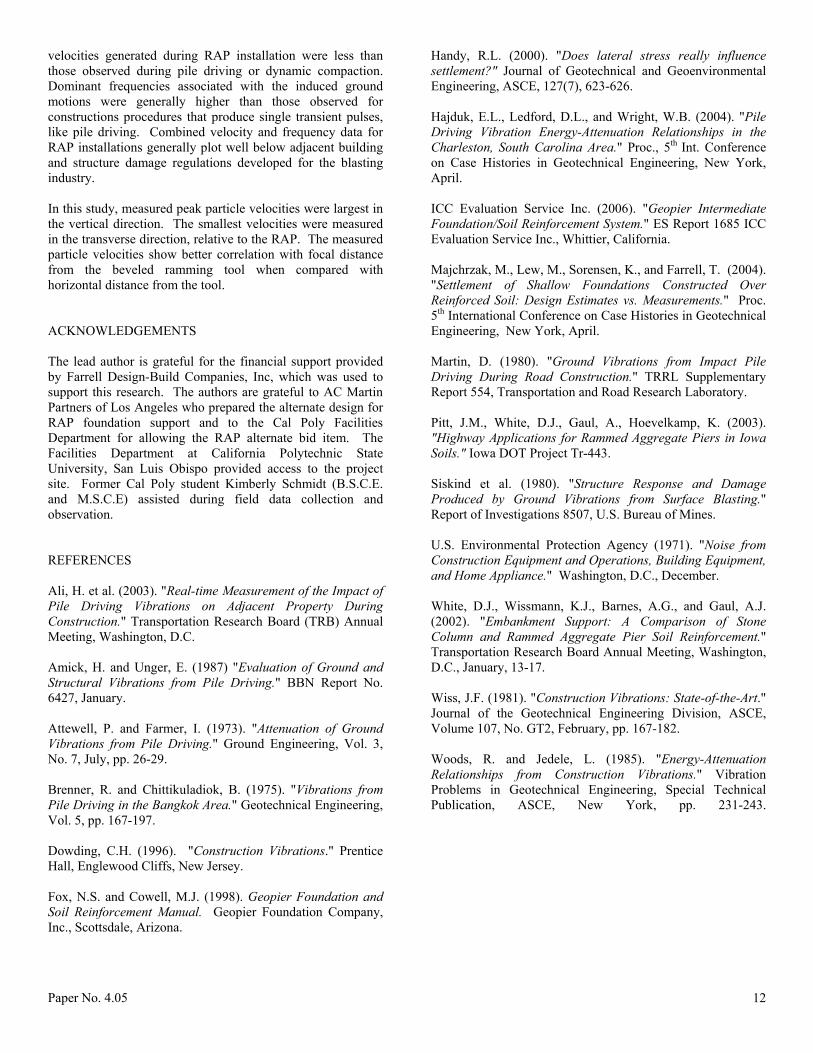
Construction Noise Figure 20 shows noise measurements recorded during this study for distances ranging from 7.5 to 10.5 meters (25 to 35 feet). Also shown on this figure are typical noise levels for different types of construction equipment located approximately 7.5 meters (25 feet) from the receiver (U.S. Environmental Protection Agency 1971). The data suggest that RAP construction creates higher levels of noise than say jack hammering concrete, but lower levels of noise than pile driving and rock drilling. On heavy construction and building sites, the RAP installation noise is imperceptible from other construction noise at distances of 30 to 60 m (100 to 200 feet). The ramming noise is somewhat muffled when the hammer is down in the drilled shaft. The construction noise levels are highest during RAP installation when the hammer is out of the drilled shaft.
Elevation of Hammer Bottom Relativeto Ground Surface, z (meters)
-3-2-10123
Ave
rage
Sou
nd L
evel
(dB
A)
80
90
100
110
120
Hammer
Rammer
zG.S.
PILE DRIVER (107 dBA)
JACK HAMMER (94 dBA)
AIR COMPRESSOR (87 dBA)
IMPACT ROCK DRILL (104 dBA)
NOISE MEASUREMENTS7.5 TO 10.5 METERS
FROM THEHAMMER AND RAP
Fig. 20. Noise measurements based on distance to the hammer and elevation of the hammer in the shaft with typical noise levels for other construction equipment
located at a distance of 25 feet. SUMMARY AND CONCLUSIONS Summarized are measurements of ground vibrations and construction noise generated by the installation of Geopier rammed aggregate piers (RAPs) at the newly constructed Engineering IV building at California Polytechnic State University, San Luis Obispo. In general, peak ground
Paper No. 4.05 12
velocities generated during RAP installation were less than those observed during pile driving or dynamic compaction. Dominant frequencies associated with the induced ground motions were generally higher than those observed for constructions procedures that produce single transient pulses, like pile driving. Combined velocity and frequency data for RAP installations generally plot well below adjacent building and structure damage regulations developed for the blasting industry. In this study, measured peak particle velocities were largest in the vertical direction. The smallest velocities were measured in the transverse direction, relative to the RAP. The measured particle velocities show better correlation with focal distance from the beveled ramming tool when compared with horizontal distance from the tool. ACKNOWLEDGEMENTS The lead author is grateful for the financial support provided by Farrell Design-Build Companies, Inc, which was used to support this research. The authors are grateful to AC Martin Partners of Los Angeles who prepared the alternate design for RAP foundation support and to the Cal Poly Facilities Department for allowing the RAP alternate bid item. The Facilities Department at California Polytechnic State University, San Luis Obispo provided access to the project site. Former Cal Poly student Kimberly Schmidt (B.S.C.E. and M.S.C.E) assisted during field data collection and observation. REFERENCES Ali, H. et al. (2003). "Real-time Measurement of the Impact of Pile Driving Vibrations on Adjacent Property During Construction." Transportation Research Board (TRB) Annual Meeting, Washington, D.C. Amick, H. and Unger, E. (1987) "Evaluation of Ground and Structural Vibrations from Pile Driving." BBN Report No. 6427, January. Attewell, P. and Farmer, I. (1973). "Attenuation of Ground Vibrations from Pile Driving." Ground Engineering, Vol. 3, No. 7, July, pp. 26-29. Brenner, R. and Chittikuladiok, B. (1975). "Vibrations from Pile Driving in the Bangkok Area." Geotechnical Engineering, Vol. 5, pp. 167-197. Dowding, C.H. (1996). "Construction Vibrations." Prentice Hall, Englewood Cliffs, New Jersey. Fox, N.S. and Cowell, M.J. (1998). Geopier Foundation and Soil Reinforcement Manual. Geopier Foundation Company, Inc., Scottsdale, Arizona.
Handy, R.L. (2000). "Does lateral stress really influence settlement?" Journal of Geotechnical and Geoenvironmental Engineering, ASCE, 127(7), 623-626. Hajduk, E.L., Ledford, D.L., and Wright, W.B. (2004). "Pile Driving Vibration Energy-Attenuation Relationships in the Charleston, South Carolina Area." Proc., 5th Int. Conference on Case Histories in Geotechnical Engineering, New York, April. ICC Evaluation Service Inc. (2006). "Geopier Intermediate Foundation/Soil Reinforcement System." ES Report 1685 ICC Evaluation Service Inc., Whittier, California. Majchrzak, M., Lew, M., Sorensen, K., and Farrell, T. (2004). "Settlement of Shallow Foundations Constructed Over Reinforced Soil: Design Estimates vs. Measurements." Proc. 5th International Conference on Case Histories in Geotechnical Engineering, New York, April. Martin, D. (1980). "Ground Vibrations from Impact Pile Driving During Road Construction." TRRL Supplementary Report 554, Transportation and Road Research Laboratory. Pitt, J.M., White, D.J., Gaul, A., Hoevelkamp, K. (2003). "Highway Applications for Rammed Aggregate Piers in Iowa Soils." Iowa DOT Project Tr-443. Siskind et al. (1980). "Structure Response and Damage Produced by Ground Vibrations from Surface Blasting." Report of Investigations 8507, U.S. Bureau of Mines. U.S. Environmental Protection Agency (1971). "Noise from Construction Equipment and Operations, Building Equipment, and Home Appliance." Washington, D.C., December. White, D.J., Wissmann, K.J., Barnes, A.G., and Gaul, A.J. (2002). "Embankment Support: A Comparison of Stone Column and Rammed Aggregate Pier Soil Reinforcement." Transportation Research Board Annual Meeting, Washington, D.C., January, 13-17. Wiss, J.F. (1981). "Construction Vibrations: State-of-the-Art." Journal of the Geotechnical Engineering Division, ASCE, Volume 107, No. GT2, February, pp. 167-182. Woods, R. and Jedele, L. (1985). "Energy-Attenuation Relationships from Construction Vibrations." Vibration Problems in Geotechnical Engineering, Special Technical Publication, ASCE, New York, pp. 231-243.