measurement of the sixth overtone band of no using cavity-enhanced frequency modulation spectroscopy...
TRANSCRIPT

Measurement of the Sixth Overtone Band of NO Using Cavity-Enhanced Frequency Modulation Spectroscopy
David OsbornJoakim Bood and Andrew McIlroy
Combustion Research FacilitySandia National Laboratories
Livermore, CA 94551USA

Absorption methods provide quantitative measurements
• Measures absolute number densities
• Unaffected by quenching or predissociation
Enhance absorption signal
Reduce background noiseto the quantum limit
S
NmaximizedGoal:

Sensitivity enhancement by an optical cavity
cavLFWHMFSR
F2
The effective absorption length is increased by a factor 2F/the minimum detectable absorption is reduced by 2F/
Lcav = Total cavity losses
• High reflectivity mirrors (R>99.99%)• High cavity finesse (F>10000)• Large number of passes (>10000)• Long effective pathlengths (>1 km)
FSR
FWHM
Optical cavity Cavity modes

Cavity Ringdown Technique
Trigger
R R
L
0
1)(
11
c
• Cavity decay time is a function of the intracavity absorption
• Time-domain measurement avoids laser technical noise very high sensitivity
Large time delay betweenMeasurements of () and 0

Shot-noise limit: the highest possible sensitivity in direct absorption
L = absorption cell pathlength (cm)= absorption coefficient (cm-1)e = electron charge (C)B = detection bandwidth (Hz) = detector responsivity (A/W)P = photon power at detector (W)
P
eBL
2
min
P
e
LBL
LD
21)( min
min (cm-1 Hz-1/2)
• Shot noise = Noise due to quantum fluctuations of the photons arriving at the detector
• The experiment will have the least noise when this is the dominant noise source
• If Beer’s Law is written as:
•Minimum detectable absorption:
LeII 0

Basic Principle and Setup for FM spectroscopy
EOMLaser
Phase shifter
RF Source RF amp.
Low-passfilter
c c
c-m
c+m
Mixer
Signal
Simultaneous comparison betweenon-resonant and off-resonant cases
c-m
c c+m
Sample PD

• High modulation frequency (to decrease N)
• High finesse (to increase S)
Cavity Enhancement + Frequency Modulation
High modulation frequency
No signal!
Low modulation frequency
Technical noise(1/f-noise)
Apparent dilemma:The modulation frequency is limited by the cavity linewidth
No modulation
FM to AMconversion

Empty cavity (FSR = )Transmission is pure FMZero backgroundFrequency noise immune
One mode shifted by moleculesFM unbalanced and signal appears(due to differential change of modes)
FSR
Moleculardispersion
Laser EOM ()
Detection at =FSR
The NICE-OHMS* solutionNoise-Immune Cavity-Enhanced Optical Heterodyne Molecular Spectroscopy
*J. Ye, L. S. Ma, and J. L. Hall, Opt. Lett. 21, 1000 (1996).

AOM2
PID2
/4
PID3AO
M3
EOM3
EOM2
EOM1
AOM1
541 MHzLock-in
PID1
NICE-OHMSsignal
Laser
4 MHz
Ref
ere
nce
etal
on
High-finesse cavity
/2
OI
PBS/2
PBS1
PBS2 BS
BSPD1
PD2 BS
ML
BD1
BD2
WavemeterBS
PID 4
Electrical
Optical
Experimental Design
Linewidth 1 x 10⁻⁷ cm-1

Empty Cavity Parameters
Free spectral range (FSR)
541 MHz
Finesse (F) 20000
Cavity FWHM 27 kHz
Cavity transmission 15%
Effective path length 3.5 km

Balanced detection reduces residual amplitude modulation
Residual amplitude modulation (RAM) background signal
Balanceddetector I1-I2
Bea
m 2
2
Requirements for efficient suppression of RAM:1. Equal amplitudes at the two detectors (balanced)2. The two signals must be in phase
-0.6
-0.4
-0.2
0.0
0.2
0.4
0.6 Balanced detection
-0.6
-0.4
-0.2
0.0
0.2
0.4
0.6 Single detector
Scans over an NO line
ND filter disc
BS
Beam 1
1
Accidental etalon
Imperfections in EOMAccidental etalons

Calibration measurement in C2H2 Transition: P(11) in the (11 + 33) band
T = 296 KP = 77 mTorr
p = 1.80(7)10-5 cm‑1torr‑1
at 296 K
= 210-11 cm-1Hz-1/2Dmin
= 610-13 cm-1Hz-1/2Dshot
12646.96 12647.00 12647.04 12647.08
-3
0
3
Re
s. (
V)
Wavenumber (cm-1)
-6
-3
0
3
6
Inte
nsi
ty (
V)
12646.96 12647.00 12647.04 12647.08
-1.9
-1.8
-1.7
-1.6
-1.5
-1.4 Exp Fit
Inte
nsi
ty (
V)
Cavity-enhanceddirect absorption
NICE-OHMS
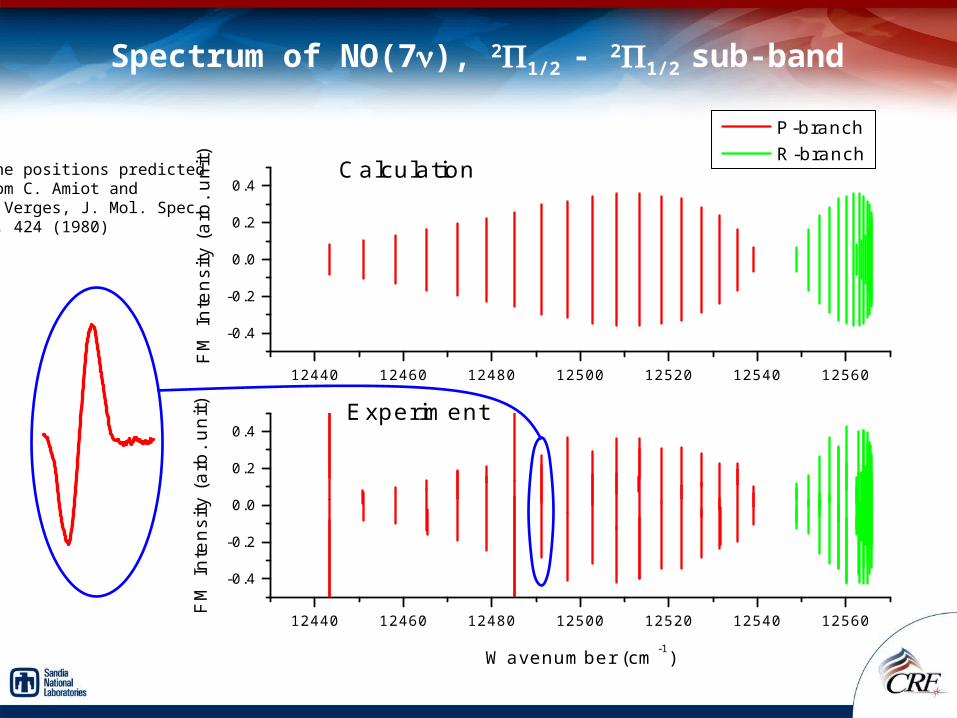
12440 12460 12480 12500 12520 12540 12560
-0.4
-0.2
0.0
0.2
0.4Experiment
FM
Inte
nsi
ty (
arb
. un
it)
Wavenumber (cm-1)
P-branch R-branch
12440 12460 12480 12500 12520 12540 12560
-0.4
-0.2
0.0
0.2
0.4Calculation
FM
Inte
nsi
ty (
arb
. un
it)
Spectrum of NO(7), 21/2 - 21/2 sub-band
Line positions predicted from C. Amiot andJ. Verges, J. Mol. Spec.81, 424 (1980)

12562.92 12562.96 12563.00 12563.04 12563.08
-0.2
0.0
0.2
Re
s. (
V)
Inte
nsi
ty (
V)
Wavenumber (cm-1)
-0.4
0.0
0.4 NICE-OHMS
Exp Fit
Inte
nsi
ty (
V)
-2.1
-2.0
-1.9
-1.8Direct absorption
NO(7 0) spectrum R(7.5) in the 21/2 - 21/2 sub-band
T = 296 KP = 67 Torr
Cavity-enhanceddirect absorption
NICE-OHMS
dTNL
S )(ln1
Line Intensity
S = 1.24(37) x 10-27 cm/molecule = 5.2 x 10⁻²⁶ cm2/molecule
Sensitivity ~ 1 ppt(parts per ten)

Fitting Intensity Data
Line intensity(cm/molecule)
)()(2
3
8
4
1)(
2
70
22"
3
0
mFmm
m
Q
e
hcmS
rot
kT
E
Honl-Londonfactor
Constants
Boltzmann fraction
vibrational transitiondipole moment
F(m) = 1 + am + bm2
Herman-Wallis factor
|70| = 3.09(47) x 10-6 Debyea = -0.0085(26)b = 0.00125(45)
~

Extracting the Dipole Moment Function
(r - re) = M0 + M1(r-re) + M2(r-re)2 + M3(r-re)3 +…
2'"
2
",' )()()( drrrrrrrR eveevvv
DW = M. Drabbels and A. M. Wodtke, J. Chem. Phys. 106, 3024 (1997).LBP = S. R. Langhoff, C. W. Bauschlicher, and H. Partridge, Chem. Phys. Lett. 223, 416 (1994).
= 0
= 7
= 21

Extracting the Dipole Moment Function
(r - re) = M0 + M1(r-re) + M2(r-re)2 + M3(r-re)3 +… 2'"
2
",' )()()( drrrrrrrR eveevvv

Transient NICE-OHMS
Probelaser
EOM Demod.
Pumplaser
NICE-OHMS is a cw technique
• Pump laser dissociates precursor• Probe laser tuned to an absorption line of the species to study
Monitor complete time evolution of reactant or product

The First Transient NICE-OHMS Signal
-0.04 -0.02 0.00 0.02 0.04 0.06 0.08
-0.02
0.00
0.02
0.04
0.06
0.08
[NH
2] (a
rb.
unit)
Bandwidth = 10 kHz
NICE-OHMS signal
[NH
2] (a
rb.
unit)
Time (sec)
-0.04 -0.02 0.00 0.02 0.04 0.06 0.08
1.9
2.0
2.1
2.2
2.3Direct absorption signal
Monitored NH2 transition
X2B1(170 000) 3313 3422
540.12681~ cm-1
PNH3=10 mTorr, T = 296 K(Single-shot signal)
Cavity-enhanced direct absorption
NICE-OHMS signal

NH2 signals at higher pressures
-0.04 -0.02 0.00 0.02 0.04 0.06 0.08NH
2 si
gnal
(ar
b. u
nit)
Time (sec)
NICE-OHMS signal
-0.04 -0.02 0.00 0.02 0.04 0.06 0.08NH
2 si
gnal
(ar
b. u
nit)
Direct absorption signalMonitored NH2 transition
X2B1(170 000) 3313 3422
540.12681~ cm-1
PNH3=150 mTorr, T = 296 K
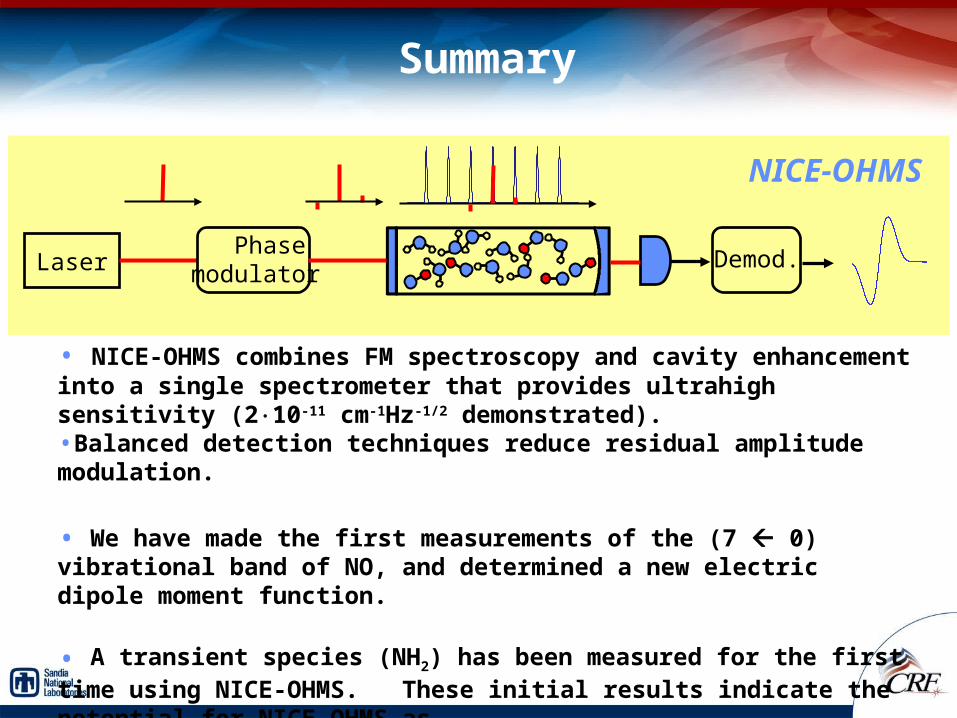
Summary
• NICE-OHMS combines FM spectroscopy and cavity enhancement into a single spectrometer that provides ultrahigh sensitivity (210-11 cm-1Hz-1/2 demonstrated).•Balanced detection techniques reduce residual amplitude modulation.
• We have made the first measurements of the (7 0) vibrational band of NO, and determined a new electric dipole moment function.
• A transient species (NH2) has been measured for the first time using NICE-OHMS. These initial results indicate the potential for NICE-OHMS asa powerful chemical diagnostic technique.
Laser Phasemodulator
Demod.
NICE-OHMS

Outline
Motivation Basic concept of cavity-enhanced frequency modulation
spectroscopy (NICE-OHMS) Experimental arrangement Measurement of the 6th overtone of NO Recent results and future projects
- Transient measurement of NH2
- Flame diagnostics Summary

Motivations for ultrasensitive spectroscopy
To probe weak transitions: Molecular spectroscopy – Overtone/combination bands can be explored
– Fundamental tests: forbidden transitions, perturbations, etc.
To measure low concentrations– Trace gas monitoring
– Medical diagnostics
– Chemical kinetics
– Flame chemistry
Example: A• + RH AH + R (1) Rate = k1[A•][RH] 1st order in [A•]
A• + A• products (2) Rate = k2[A•]2 2nd order in [A•]
k1
k2

Acknowledgments
Dr. Joakim Bood and Dr. Andrew McIlroy
Mr. Paul Fugazzi
Mr. Gary Wilke
Dr. Ray Bambha
Dr. Jun Ye (JILA, University of Colorado, and NIST, Boulder)
Dr. Richard Fox (NIST, Boulder)
Financial Support: Division of Chemical Sciences, Geosciences, and Biosciences,
the Office of Basic Energy Sciences of the United States Department of Energy.

• Cavity ringdown provides quantitative measurements
• Problems- Large time delay between on and
off-resonant measurements
- Need large dynamic range to monitor intensity decay
- Low frequency (1/f)
noise dominates
Cavity Ringdown in Flames
Thoman Jr, J.W., McIlroy A., J. Phys. Chem. A 104, 4953 (2000)
130
140
150
160
170
180
23,440 23,450 23,460
To
tal C
av
ity
Lo
ss
(p
pm
/pas
s)
Wavenumber (cm-1)
12CH (1,1) R(8) 12CH (0,0) R(8)12CH (2,2) R(12)
13CH (0,0) R(8)13CH (1,1) R(8)
Backgroundnoise
•Differential measurement•Monitor E field, not intensity•Detect at high frequency

First test of Transient NICE-OHMS: Detection of NH2
Phot
on F
lux
1400013000120001100010000
Wavenumber (cm-1
)
current mirrors
NH2 A X
Flash photolysis using Excimer laser (193 nm):
NH3 H + NH2
Time-resolved FTIR spectrum

Challenges of Transient NICE-OHMS
All cavity fringes will be shifted due to change in refractive index upon photodissociation.
– Instantaneous (sub-ps) number density increase as NH3 H + NH2
– Slower temperature rise as excess energy equilibrates with bath gas. Temperature rise (at constant pressure) lowers density
FSR
P = -800 HzT = 13 kHz
0.5 mTorr NH3, 1mJ/cm2 @ 193 nm1.6 x 1011 molecules/cm3 NH2
before photolysis after photolysis

Experimental DesignC
W 5
32 N
d:Y
AG
CW Ti:Sapphire
PD1
Intensityservo
AOM driver
BS
/4
Opt. Isol.
Etalon (FSR = 300 MHz)
Freq.servo
Function gen. 2, = 4 MHz
PD4
PD2
PD3
To AOMDriver (VCO)
To laser’sRef. cavity
Phase trimmer
3 PZTs
LP
Phase trim.FunctionGenerator 1 = 540 MHz
NICE-OHMS signal
BP
EOM 1
AOMEOM 3
Z EOM 2
AOM
ToEOM3
Lock-in
error
servocontroller
Dither
Function gen.
/2
Laser-to-cavity lock
FSR tracking

Laser-to-cavity locking is a big issue– Heat from the flame will introduce thermal motion to the flame chamber
– The cavity mirror mounts have to be decoupled from the motion
of the flame chamber external stabilization of the mirror mounts is needed
– Laser lock must withstand refractive index changes
– Mirrors of lower reflectivity and cavity locked to laser (instead of vice versa)
• Cavity twice as long as the previously used cavity– Sidebands have to be lined up with cavity modes located
two modes apart from the central mode
Challenges of NICE-OHMSfor flame diagnostics

Low-pressure flame experiment
Invar rod
Bellow
Mirror mount
Mirror mount

FM Spectroscopy ApplicationsFM Spectroscopy demonstrated for detection of stable molecules
Bjorklund, G. C., Opt. Lett. 5, 15 (1980)
Gas-phase kinetics using time-resolved FM spectroscopyNorth et al., Int. J. Chem. Kinet. 29, 127 (1997)
Quantitative concentration measurements in shock tube kinetic experimentsVotsmeier et al., Int. J. Chem. Kinet. 31, 323 (1999)Votsmeier et al., Int. J. Chem. Kinet. 31, 445 (1999)Friedrichs et al., J. Chem. Phys. 4, 5778 (2002)
Deppe et al., Ber. Bunsenges. Phys. Chem. 102, 1474 (1998)Friedrichs and Wagner, Z. Phys. Chem. 214, 1723 (2000)
Chemical kinetics using flash photolysis/CW FM spectroscopyPilgrim et al., J. Phys. Chem. A 101, 1873 (1997)
Flame measurements using Intra-Cavity Laser Absorption SpectroscopyCheskis, S., J. Chem. Phys. 102, 1851 (1995)

Vibrational transition dipole moment for various overtones
0 1 2 3 4 5 6 7 81E-6
1E-5
1E-4
1E-3
0.01
0.1V
ibr.
tra
nsiti
on d
ipol
e m
omen
t (D
ebye
)
v'
Coudert et al. (1995) Mandin et al. (1997) Snels et al. (1999) Lee and Ogilivie (1988) Our measurement
12830
10
v
v
2550
30
v
v
670
50
v
v

Basic Principle and Setup for FM spectroscopy
EOMLaser
Phase shifter
RF Source RF amp.
Low-passfilter
PD
c c
c-m
c+m
Sample
Mixer
c-m
c c+m
Signal
Simultaneous comparison betweenon-resonant and off-resonant cases