measurement of test metrics – a point of view kiran marri, infosys technologies limited...
TRANSCRIPT

Measurement of Test Metrics – A Point of View
Kiran Marri, Infosys Technologies Limited
2
Disclaimer
This article is an output of the author’s experience and perspective on this subject in an individual capacity as a Group Test manager at Infosys Technologies Limited. This article is not an official document of Infosys on this subject. The data and the examples used in this article are illustrative and do not represent any true project data.

3
Background
• Too many metrics around testing – Quality and Productivity, then why do need them?– Test Metrics are more targeted towards the project and program metrics– Defects are injected in the stages from requirements, design and development
phase of the project. The testing effort increases depending on increasing degree of the defect injection
– The cost of fixing or correcting the defect is higher during the later phases of the software development life cycle. One should plan to trap defects earlier in the cycle
• 35% of the IT projects are successfully completed and implemented– Test estimation done by two individuals is most likely to be different

4
Objectives of the Session
The objective of this session is to address the problems and challenges faced in using and identifying test metrics and address the below scenarios
Categorization of metrics: What we need to do before deciding on the metricsHow to measure metrics that are relevant for the projectCan historical data be used for identifying the test metricsChallenges faced in arriving at good test metricsArrive at Transformed Test Metrics

5
The phases of the software projects..
Requirements &Analysis
Design Phase
Coding & Unit Testing
Integration/ System Testing
Release Phase
Development lead/ Manager
Project (Senior) Manager
Test lead/ Manager
Development Phase Testing Phase
Development Lead,Manager
Test Lead,Manager
- Project manager can be a Client or a Vendor
- The development manager and the Test manager can be a Single or Multi-vendor
- Product development with a Development manager and a Test manager

6
Industry References & historical data indicate a strong need for metrics
• From Watts Humphrey article– An analysis of data on more than 8,000
programs written by 810 industrial software developers
– The average injection rate for these developers is 120 defects per KLOC, or one defect in every eight lines of code.
– The top 10% of the developers injected 29 defects / KLOC
– The top 1% injected 11 defects / KLOC • Even at the injection rate for the top 1% of
software developers, a 1,000,000 LOC system would enter compiling and testing with 11,000 defects.
• As per Caper Jones– The U.S. average defect rate for released
software is in the range of 5.9 to 7 defects per thousand lines of code
– This means a system with 1MLOC (Million Lines of Code) has about 5,900 to 7,000 defects.
– The more recent article in 2002 [6], indicates the defect removal efficiencies on 1500 projects
Defect Removal Efficiency
Number of Projects
% of projects
>99 6 0.40%
95-99 104 6.93%
90-95 263 17.53%
85-90 559 37.26%
80-85 408 27.20%
<80 161 10.73%
TOTAL 1500 100.00%
7
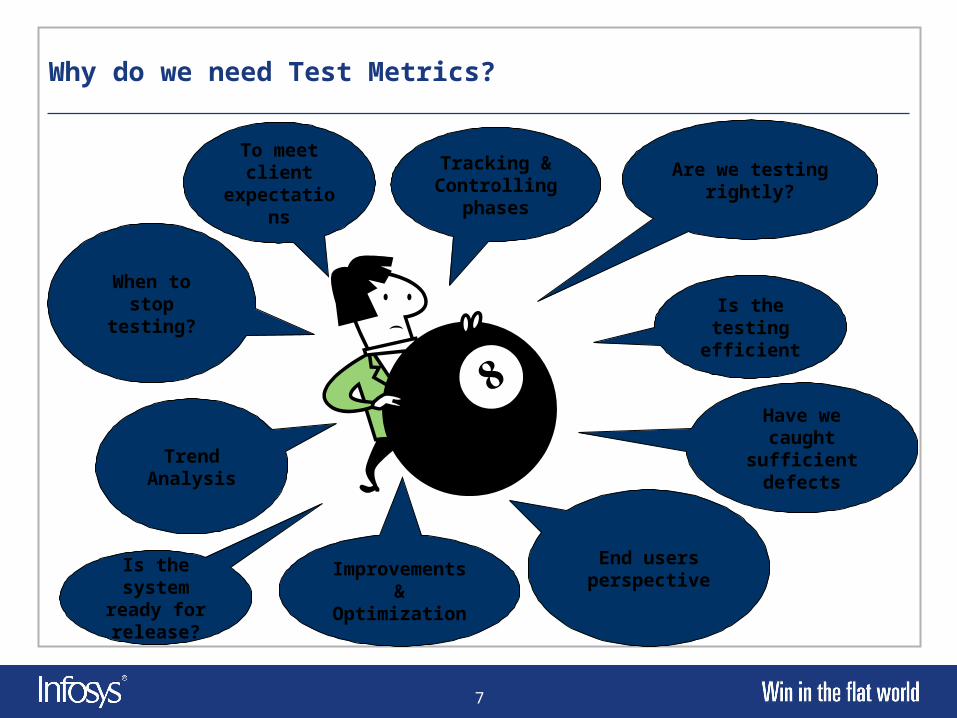
Why do we need Test Metrics?
End users perspective
Is the testing efficient
Improvements & Optimization
Trend Analysis
When to stop testing?
Tracking & Controlling
phases
To meet client
expectations
Is the system
ready for release?
Have we caught sufficient defects
Are we testing rightly?

8
Identifying the right Test metrics for the project or a program
• The stakeholders for the project– Senior Executives at the Client site– Client Manager– Senior Executives at the vendor/QA Unit– Test Manager (Project)– Testing Team members (Project)– Development team (Project)
• Procure the right tools for collection of data
• Categorize the QA project
• Too many metrics versus Too little metrics
• Ease of data collection
• Understand the goal for deriving the Test Metrics

9
Definition and Purpose of each Test Metric
• Critical to define each Test metric
• Purpose of the Test metric– Whether it is meaningful– Understand the impact of the metric and the variance– Reliable and consistency– Economical and ease to measure– Comparison to some benchmark or process capability baseline
• Classify the Test metric with– Quality– Productivity– Cost– Defect– Coverage– Effort– Stability– Effectiveness

10
Definition and Purpose of each Test Metric .. (cont)
Definition of Testing efficiency is the number of test cases that a tester can execute in a unit time.
How can one used the test metric - Testing efficiency:
• Measure productivity• Reduce the release time of the testing phase• Improving the time to market• Quicker identification of the critical features• Cost of the testing phase• Revalidate the estimation model• Input for future estimation mechanism for similar type of project• Revalidate the test execution plan• Test environment set-up• Sturdiness of the test data and build
Testing effectiveness is the rate at which the test plan, test cases help in identifying the defects before the product or the application is released. Improved effectiveness lowers the cost, improving the bottom line and helps in improving the customer satisfaction
11
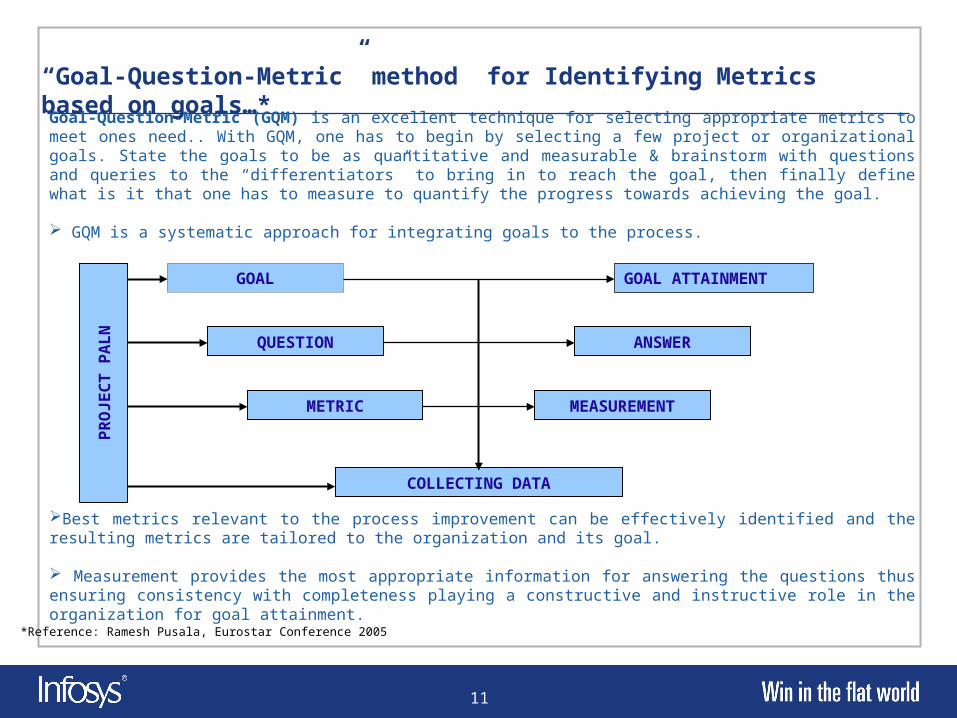
Goal-Question-Metric (GQM) is an excellent technique for selecting appropriate metrics to meet ones need.. With GQM, one has to begin by selecting a few project or organizational goals. State the goals to be as quantitative and measurable & brainstorm with questions and queries to the “differentiators” to bring in to reach the goal, then finally define what is it that one has to measure to quantify the progress towards achieving the goal.
GQM is a systematic approach for integrating goals to the process.
Best metrics relevant to the process improvement can be effectively identified and the resulting metrics are tailored to the organization and its goal.
Measurement provides the most appropriate information for answering the questions thus ensuring consistency with completeness playing a constructive and instructive role in the organization for goal attainment.
“Goal-Question-Metric” method for Identifying Metrics based on goals…*
GOAL ATTAINMENT
ANSWER
MEASUREMENT
PR
OJ
EC
T P
AL
N
GOAL
QUESTION
METRIC
COLLECTING DATA
*Reference: Ramesh Pusala, Eurostar Conference 2005
12
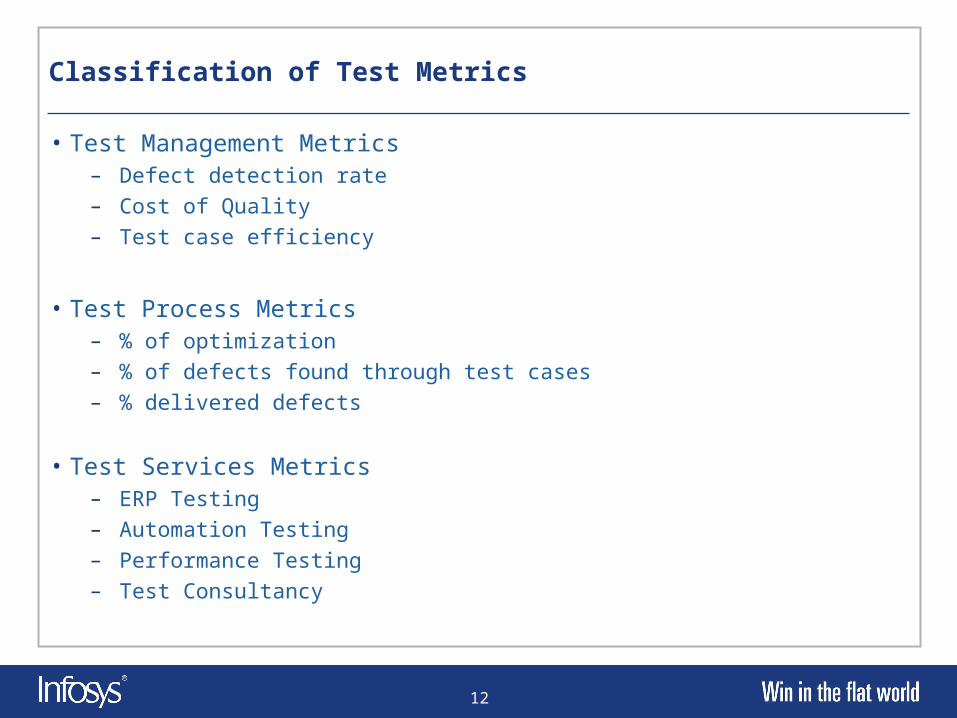
Classification of Test Metrics
• Test Management Metrics– Defect detection rate– Cost of Quality– Test case efficiency
• Test Process Metrics– % of optimization– % of defects found through test cases– % delivered defects
• Test Services Metrics– ERP Testing– Automation Testing– Performance Testing– Test Consultancy

13
QA Project Classification for metrics definition
Type (Simple, Large) Type (Complex, Large)
Type (Simple, Simple) Type (Complex, Simple)
Complexity of the Project
Siz
e o
f th
e T
ota
l Pro
ject

14
QA Project Classification for metrics definition – Redefined based on key parameters
Type (Large, Simple)
Type (Large, Medium)
Type (Large, Complex)
Type (Medium, Simple)
Type (Medium, Medium)
Type (Medium, Complex)
Type (Small, Simple)
Type (Small, Complex)
Type (Small, Complex)
Complexity of the Project
Siz
e o
f th
e t
ota
l Pro
ject
(Eff
ort
or
FP)
{Either Technically Challenged or Domain intensive}
{Both Technically Challenged & Domain intensive}
{Neither Technically Challenged or Domain intensive}
< 70 Personmonth
< 250 Personmonth
> 300 Personmonth

15
Need to classify the testing services while deciding on the Test metrics
Service Types COQ Delivered defects
Test cases productivity
Process Metrics
Analysis
of Tool
Functional Testing (Manual) Yes Yes Yes Yes Maybe
Regression Testing (Manual) Yes Yes Yes Maybe Maybe
Database Testing (Scripting) Yes Yes Yes Maybe No
Performance Testing (Scripting & Tools)
Yes Yes Yes NA Yes
Data ware housing Testing (Scripting & Tools)
Yes Yes Yes NA Yes
Automation Testing (Scripting & Tools)
Yes Yes Yes NA Yes
Test Process Yes No No Yes No
Test Consultancy Yes No No Yes No
Designing the metrics for the QA Project

16
Test Metrics – Cost of Quality
Process Area Total Cost of Quality
Test Metric Cost of Quality
Computation Formulae
(Review Effort + Rework Effort + Training effort+ DP Effort) / Total Testing Project effort
Value added Metric (USD)
Lowering COQ leads to reduction in total testing effort. If the COQ of the project is reduced by x% then this will reduce the direct cost to the client in terms of effort (rework or training). This is again a saving to the client and this effort can be utilized for more work and leading to productivity. The business benefit is volume of work is improved in the same duration meaning more productivity
Reducing rework effort. Reducing rework effort will have bigger benefit to the client especially when the client's time is involved in reviewing the artifacts. The impact of this is the # of defects reported during the peer review and the cost saving of lowering such defects before going to the client. The savings in terms of the earlier base-lining of the document can also be accounted in the total savings.
Cost Saving through reduction in Cost of Quality:1.Capture the review + rework + training + DP effort between two periods2.Compute the diff between this, say 40 person days3.Cost Savings (from Infy Perspective) – 40 person days * Billing rate per day4.Cost Savings (from Client QA perspective) = Infy Cost Savings + Any other saving perceived and calculated by the client like savings in the review and training effort from UsersOptimum Cost of Quality to achieve 100% Defect Detection Effectiveness – We should recommend based on the available metrics. Say to achieve 100% TE, the client should budget 15% cost of quality.

17
Test Metric – Defect Detection rate
Process Area Quality
Test Metric Defect detection rate
Computation Formulae
Number of valid defects/ Test execution effort
Value added Metric (USD)
Defect Detection rate determines the mean time taken by the team to find the defect.
20 defects found in 80 hours of testing: This means that the average time taken to find a defect is 4 hours. If the testing is spread over a period of 5 days, then trends of defects found on each day would provide the details of the efficiency.
Time to find the first defect and average time of defects can indicate to the QA manager on continuing the testing for the build or rejecting it.
IT cycle: The mean frequency of defects found during the 5% time frame should not be less than 45 minutes.ST cycle: The mean time to fail during the 5% time frame should not be less than 3 hours.UAT cycle: The mean defect detection rate during the 5% time frame should not be less than 16 hours
Projected defects versus Actual defect. The QA manager should be able to project the # of defects in the testing phase using the historical project metrics. This guideline can help the QA manager to plan the testing phase and the likely release dates. This will help him to adhere to schedules and keep the variance to the minimum. This will also provide valuable inputs for staffing and planning the Development team activities.

18
Challenges & Approach to implement Metrics in the organization*
Management Commitment Top down approach Need a sponsor Champion to drive this
Measuring Too Much, Too Soon, Too Little, Too Late Define the life cycle of the testing phase Map the metrics Define when, what with a clear why
Incorrect Metrics, Invalid Metrics Measure them regularly (minimum is weekly) Strong review process Trend analysis Design the metrics that are mapped to the goal
Metrics Data to Evaluate Individuals Avoid this approach Use metrics to motivate Help the team member to analyze this data Use metrics to make a tester to a better tester
*Some of the Reference: Ramesh Pusala, Eurostar Conference 2005

19
Challenges & Approach to implement Metrics in the organization*
Tools for data collection Keep the collection of metrics simple Data should be consistency Propagate the usage of tools for collection
Lack of Communication and Training Explain why Share the results Define Data Items and Procedures Obtain "buy-in

20
Transformed Test Metrics Approach….
Conventional Test Metrics Transformed Test Metrics
Metrics for testing phase of the project Metrics for measuring the quality
Metrics for the test life cycle Metrics for business requirements that can impact the client
How much to Test Impact of not testing
When to Test When is the release
Testing is the last phase of the project life cycle
Testing starts at requirements and continues till end the application/product release
Focus is on Program Metrics for Testing Focus is on Business Metrics
# of defects found during the phases of testing
Predicting the # of defects at the requirements phase
Standard metrics Metrics designed for stakeholders – Managers to CxO
21
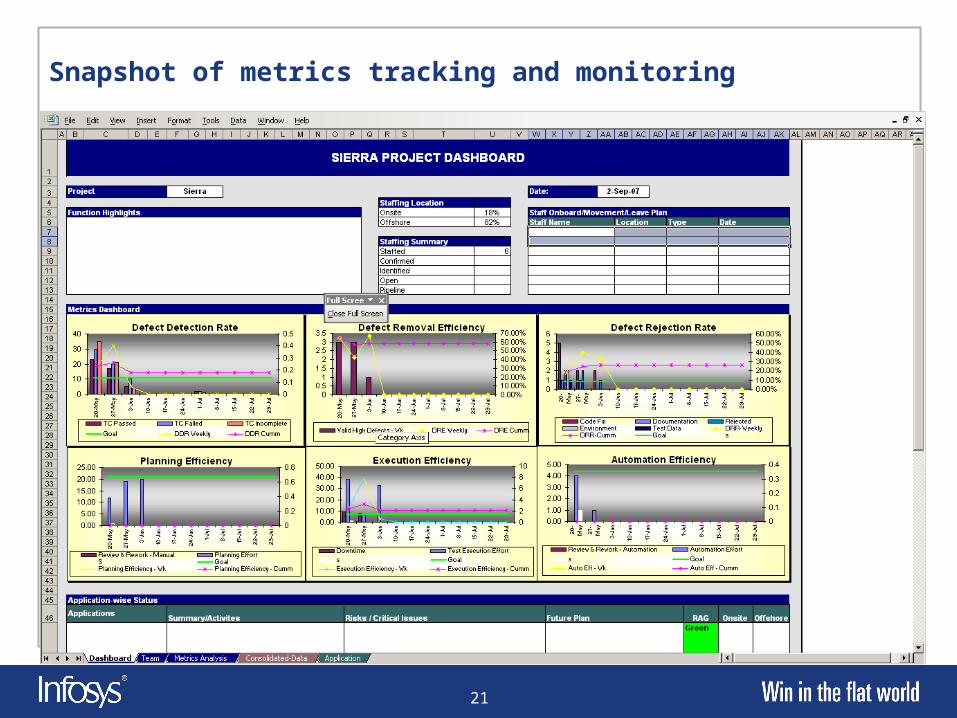
Snapshot of metrics tracking and monitoring

Thank YouKiran [email protected]
“The contents of this document are proprietary and confidential to Infosys Technologies Ltd. and may not be disclosed in whole or in part at any time, to any third party without the prior written consent of Infosys Technologies Ltd.”
“© 2006 Infosys Technologies Ltd. All rights reserved. Copyright in the whole and any part of this document belongs to Infosys Technologies Ltd. This work may not be used, sold, transferred, adapted, abridged, copied or reproduced in whole or in part, in any manner or form, or in any media, without the prior written consent of Infosys Technologies Ltd.”