measurement of static and dynamic performance ... institute of aeronautics and astronautics 1...
TRANSCRIPT
American Institute of Aeronautics and Astronautics
1
Measurement of Static and Dynamic Performance
Characteristics of Electric Propulsion Systems
Aron J. Brezina1 and Scott K. Thomas
2
Wright State University, Dayton, OH, 45435
Today’s unmanned aerial vehicles are being utilized by numerous groups around the
world for various missions. Most of the smaller vehicles that have been developed use
commercially-off-the-shelf parts, and little information about the performance
characteristics of the propulsion systems is available in the archival literature. In light of
this, the aim of the present research was to determine the performance of various small-scale
propellers in the 4.0 to 6.0 inch diameter range driven by an electric motor. An experimental
test stand was designed and constructed in which the propeller/electric motor was mounted
in a wind tunnel for both static and dynamic testing. Both static and dynamic results from
the present experiment were compared to those from previous studies. For static testing, the
coefficient of thrust, the coefficient of propeller power, and the overall efficiency, defined as
the ratio of the propeller output power to the electrical input power, were plotted versus the
propeller rotational speed. For dynamic testing, the rotational speed of the propeller was
held constant at regular intervals while the freestream airspeed was increased from zero to
the windmill state. The coefficient of thrust, the coefficient of power, the propeller efficiency
and the overall efficiency were plotted versus the advance ratio for various rotational speeds.
The thrust and torque were found to increase with rotational speed, propeller pitch and
diameter, and decrease with airspeed. Using the present data and data from the archival and
non-archival sources, it was found that the coefficient of thrust increases with propeller
diameter for square propellers where D = P. The coefficient of thrust for a family of
propellers (same manufacturer and application) was found to have a good correlation from
static conditions to the windmill state. While the propeller efficiency was well correlated for
this family of propellers, the goodness of fit parameter was improved by modifying the
propeller efficiency with D/P.
Nomenclature
= propeller disk area, m2
= wind tunnel test section area, m2
= propeller chord length at the 75% radius, m
= coefficient of propeller power
= coefficient of torque
= coefficient of thrust
= propeller diameter, m
= fixture drag, N
= height of Pitot tube from bottom of wind tunnel, m
= electrical motor current, Amperes
= advance ratio
= motor velocity constant, RPM/Volt
= propeller rotational speed, rev/s
= propeller pitch, m
= atmospheric pressure, Pa
= Pitot tube differential pressure, Pa
= electrical input power, W
= propeller output power, W
1 Graduate Student, Department of Mechanical and Materials Engineering, AIAA Member
2 Associate Professor, Department of Mechanical and Materials Engineering, AIAA Member
51st AIAA Aerospace Sciences Meeting including the New Horizons Forum and Aerospace Exposition07 - 10 January 2013, Grapevine (Dallas/Ft. Worth Region), Texas
AIAA 2013-0500
Copyright © 2013 by the American Institute of Aeronautics and Astronautics, Inc. All rights reserved.
Dow
nloa
ded
by S
cott
Tho
mas
on
Janu
ary
15, 2
013
| http
://ar
c.ai
aa.o
rg |
DO
I: 1
0.25
14/6
.201
3-50
0

American Institute of Aeronautics and Astronautics
2
= torque, N-m
= propeller 75% radius, m
= particular gas constant, J/(kg-K)
= Reynolds number at the 75% radius of the propeller
= measured thrust, N
= corrected thrust, N
= atmospheric temperature, K
= reference temperature, K
= electric motor voltage, Volts
= free-stream velocity, m/s
= corrected free-stream velocity, m/s
= propeller velocity, m/s
= total velocity, m/s
= wind tunnel test section width and height, m
= uncertainty
= propeller efficiency
= overall propulsion system efficiency
= absolute viscosity, kg/(m-s)
= reference absolute viscosity evaluated at , kg/(m-s)
= density, kg/m3
= Glauert correction variable
I. Introduction
nterest in the performance of small propellers operating at low Reynolds numbers has grown recently. The
aerospace industry has developed numerous unmanned aerial vehicles (UAVs) and has kept most of the data
about the propulsion systems proprietary. Very little information is available in the archival literature about the
performance characteristics of these motor and propeller combinations. The present research and others like it have
aimed to gather and compare information about these small propulsion systems so that proper motor and propeller
combinations can be selected for a given mission profile. Several papers were reviewed that relate directly to the
present work and provide direction for the research.
Brandt and Selig1 experimentally determined efficiency as well as coefficients of thrust and power for low
Reynolds number propellers. The parametric ranges were as follows: Propeller diameter 9 ≤ D ≤ 11 inches, propeller
rotational speed 1500 ≤ n ≤ 7500 RPM, and the incoming air velocity ranged from zero (static) to the windmill
state of each propeller, i.e., that point at which the propeller generates zero thrust. A test stand was built inside the
UIUC wind tunnel to measure thrust, torque, and propeller rotational speed. Freestream air velocity was measured
using a Pitot tube and one of two differential pressure transducers depending on the airspeed range. Velocity
corrections were applied to account for the change in upstream airspeed at the Pitot tube created by the propeller as
well as the pressure change created by the fairing and the constriction of the propeller slipstream caused by the
walls. In total, 79 propellers from four different manufacturers were tested to find the coefficient of thrust, the
coefficient of power and the propeller efficiency, all of which were plotted against advance ratio. The designs of the
propellers ranged from those for electric motors to those used for fuel-powered engines. For each test, the rotational
speed of each propeller was fixed while the freestream airspeed was varied. Four different values of propeller
rotational speed (n = 3000, 4000, 5000, and 6000 RPM) were tested for each of the propellers. The results show that
the propeller efficiency increases with the propeller speed. This is primarily due to the increase in Reynolds number
as the propeller spins faster. Overall, the propeller efficiency ranged from 28 ≤ ηP ≤ 65%. The propellers were also
tested statically, but the data is only available in the UIUC propeller database2.
Gamble3 designed an intricate LabVIEW program to automatically collect data and generate propeller
performance plots. A dynamometer was constructed using beam-type load cells to measure thrust and torque. The
development of the LabVIEW program was detailed as well as a procedure for carrying out the experiment.
Propellers were tested for repeatability by performing identical experiments over several days with two identical
propellers. The results primarily focus on the effect of the Reynolds number on thrust and power coefficients and
efficiency versus advance ratio. Thrust versus velocity was compared for propellers with constant diameter and
varying pitch. Lastly, advance ratio was modified by replacing diameter with pitch in the equation for advance ratio.
The optimal advance ratio is shown using this technique. This allows for the optimal pitch of a model propeller to be
I
Dow
nloa
ded
by S
cott
Tho
mas
on
Janu
ary
15, 2
013
| http
://ar
c.ai
aa.o
rg |
DO
I: 1
0.25
14/6
.201
3-50
0

American Institute of Aeronautics and Astronautics
3
selected to achieve maximum efficiency. The diameter can then be chosen from plots of thrust versus velocity to
produce the required thrust for the airframe.
Deters and Selig4 performed static tests on smaller propellers ranging from 2.5 ≤ D ≤ 5 inches in diameter. Static
coefficients of thrust and power as well as the figure of merit ( OM T
√ P, typically used to measure the
efficiency of helicopters) using modified coefficients of thrust and power that use disk area and tip speed were
determined experimentally using a test stand specifically designed to test this size range of propellers. It was noted
that the figure of merit should only be used for comparison when the disk loading is the same. The test stand utilized
a 0.3 kg load cell and a 25 oz-in torque transducer to measure thrust and torque, respectively. Propeller rotational
speeds ranging from 2500 ≤ n ≤ 27,000 RPM were measured using an infrared detector. The test stand is not shown
photographically, but a basic schematic is given indicating the locations of the components and a fairing surrounding
the load cell and torque transducer. Calibrations of the components were performed and data was collected using a
data acquisition board. The geometry of each propeller was found using PropellerScanner software5 to find the chord
and twist distribution. This was used to calculate the Reynolds number at the 75% chord location. Results show that
over the rotational speed range tested, the figure of merit remained fairly constant throughout the test. The results
also show that a larger diameter propeller is more efficient than a smaller one, and a propeller with a lower pitch is
more efficient than one with a higher pitch.
Ol et al.6 took a more analytical approach to studying small propellers operating at low Reynolds numbers.
Iterative methods were used to calculate the coefficient of thrust, the coefficient of torque, and the propeller
efficiency using propeller momentum theory and blade-element methods. Propellers were discretized by cutting and
tracing sections as well as digital scans. Leading and trailing edges were fitted to the UIUC propeller library so that
the resulting analysis in XFOIL would successfully converge. The iterative process for thrust was dependent on the
various Reynolds numbers across the propeller blade at a given rotational speed. Two separate experimental setups
were constructed to compare the numerical results. Propellers in the 6 ≤ D ≤ 12 inch range were tested in the
Langley Research Center Basic Aerodynamics Research Tunnel (BART) and larger propellers in the 14 ≤ D ≤ 20
inch range were tested in the AFRL Vertical Wind Tunnel (VWT). Two different efficiencies were studied: The first
was the propulsive efficiency where propeller speed was held constant and the forces and moments were shown
versus rotational speed and airspeed. Static tests were performed with the wind tunnel sides open to alleviate the
induced airflow velocity inside the wind tunnel. Blockage corrections were applied to BART tests but not to VWT
tests, since the tunnel diameter of the VWT was greater than five times the diameter of the propellers tested. Drag on
the test stand was corrected by sweeping tunnel velocity and generating curve fits that were used to adjust the actual
data. A large sensitivity to twist distribution was observed in the tests and the analysis. Ol et al. postulated that plots
of torque coefficient versus advance ratio are sometimes misleading because they do not account for Reynolds
number effects. It was also shown that when the ratio of diameter to pitch is scaled (10 × 10 to 12 × 12, for example)
the experimental data fits together well within the bounds of error. Modifications to the dimensionless terms to
factor in propeller pitch were presented, however more research was deemed necessary to apply this theory.
Corrigan and Altman7 examined different methods for wind tunnel blockage corrections. These methods
included the Glauert8 correction as well as a correction by Hackett et al.
9.These methods were described in detail and
their applications were shown. A wind tunnel experiment was designed and constructed to record the necessary
variables to calculate total system efficiency, defined as propulsive efficiency divided by electrical efficiency. This
is in contrast to other works that primarily explored propeller efficiency. The stand was constructed using a beam-
type load cell and a reaction torque sensor. Three propellers (D = 10, 12, and 14 inches) were tested using different
motors for each propeller. Static pressure taps were used on the wall of the wind tunnel test section to record the
changes in pressure forward and behind the propeller disk plane for the velocity corrections. The Glauert method did
not provide sufficient correction for large blockage conditions. The Hackett method yielded more correction at
higher airspeeds and larger propeller diameters, but the method could not be validated and therefore further work
was found to be necessary.
Merchant and Miller10
performed dynamic tests on propellers in the 6 ≤ D ≤ 22 inch range. A test stand was
constructed to record propeller performance parameters, where the thrust and torque were collected by a combined
thrust/torque cell. The load and torque cell was calibrated using dead weights in the axial (thrust) and transverse
(torque) directions. Wind tunnel velocity was measured directly using a Pitot probe and a differential pressure
transducer. Since the propellers were large compared to the test section, blockage corrections developed by Glauert8
were applied to the results. Readings were taken at wind-off-zero conditions before and after each test. These values
were then averaged and subtracted from the test data to account for zero drift and temperature effects. Data was
collected at constant propeller rotational speeds and the wind tunnel velocity was varied to sweep through values of
advance ratio. The results were compared to other works and were shown to be acceptable. The setup was also tested
for variations in flow angularity. Pitch and yaw variations between −3 and +3 arc degrees were examined and it was
Dow
nloa
ded
by S
cott
Tho
mas
on
Janu
ary
15, 2
013
| http
://ar
c.ai
aa.o
rg |
DO
I: 1
0.25
14/6
.201
3-50
0
American Institute of Aeronautics and Astronautics
4
shown that only the coefficient of thrust was affected by a change in pitch. However, it was shown that pitch
variations of −3 and +3 degrees yielded the same results, which indicated that the system was symmetric in the pitch
direction. Lastly, two identical propellers made by the same manufacturer were tested and compared, which showed
that for some propellers there may be significant differences in performance due to manufacturing. Very limited
results were presented, however, and the results shown only give a small sample of the entire test range.
The objective of the present research was to determine the performance of various commercially-available small-
scale propellers driven by an electric motor. An experimental test stand was designed and constructed in which the
electric motor was mounted in a wind tunnel at Wright State University for both static and dynamic testing. The
freestream airspeed was varied from zero to the windmill state for each propeller. The rotational speed was varied
over the operational range recommended by the propeller manufacturers, while ensuring that the electric motor did
not overheat. The primary measurement devices were calibrated, and an extensive uncertainty analysis was
performed. The results from the present experiment were compared to those from previous studies for both static
and dynamic data. For static testing, the coefficient of thrust, the coefficient of propeller power, and the overall
efficiency, defined as the propeller output compared to the electrical power input, were plotted versus the propeller
rotational speed. For dynamic testing, the rotational speed of the propeller was held constant at regular intervals
while the freestream airspeed was increased from zero to the maximum. The coefficient of thrust, the coefficient of
power, the propeller efficiency and the overall efficiency were plotted versus the advance ratio for various rotational
speeds.
II. Background
The performance characteristics to be determined by the experimental setup are as follows. The coefficients of
thrust, torque, propeller power, and the propeller efficiency are:10
T
(1)
(2)
(3)
P
T P
(4)
The three performance coefficients and the propeller efficiency defined above are typically plotted against the
advance ratio for dynamic testing:
(5)
where the corrected freestream velocity is:8
[ (
P T
)
√
] (6)
The uncorrected freestream velocity is:
√
diff
(7)
Dow
nloa
ded
by S
cott
Tho
mas
on
Janu
ary
15, 2
013
| http
://ar
c.ai
aa.o
rg |
DO
I: 1
0.25
14/6
.201
3-50
0

American Institute of Aeronautics and Astronautics
5
The Glauert correction variable is:
P (8)
The propeller disk area and wind tunnel area are, respectively:
P
T (9)
The corrected thrust is defined as the measured thrust minus the drag force due to the flow of air over the motor,
torque cell and load cell:11
(10)
The overall propulsion system efficiency is the ratio of the propeller output power to the electrical input power:
T
P e
(11)
The density of air is given by the perfect gas law:
atm atm
(12)
The Reynolds number at the 75% radius of the propeller is defined as follows for the static and dynamic tests:
Re S
P
(13)
(14)
where the propeller velocity and total velocity are given by:10
P (15)
√(
) (16)
The absolute viscosity of air is a function of absolute temperature:12
ref (
atm ref
)
(17)
III. Experimental Setup
The objective of the present experiment was to determine the performance characteristics of small electric
motor/propeller combinations from static conditions to the windmill state. Initially, a simple bench-top static test rig
was designed and constructed to properly size the load cell and torque cell used in the experiment. The design,
construction and test results from the bench-top static test rig are discussed in detail in the full thesis (Ref. 13).
Dow
nloa
ded
by S
cott
Tho
mas
on
Janu
ary
15, 2
013
| http
://ar
c.ai
aa.o
rg |
DO
I: 1
0.25
14/6
.201
3-50
0
American Institute of Aeronautics and Astronautics
6
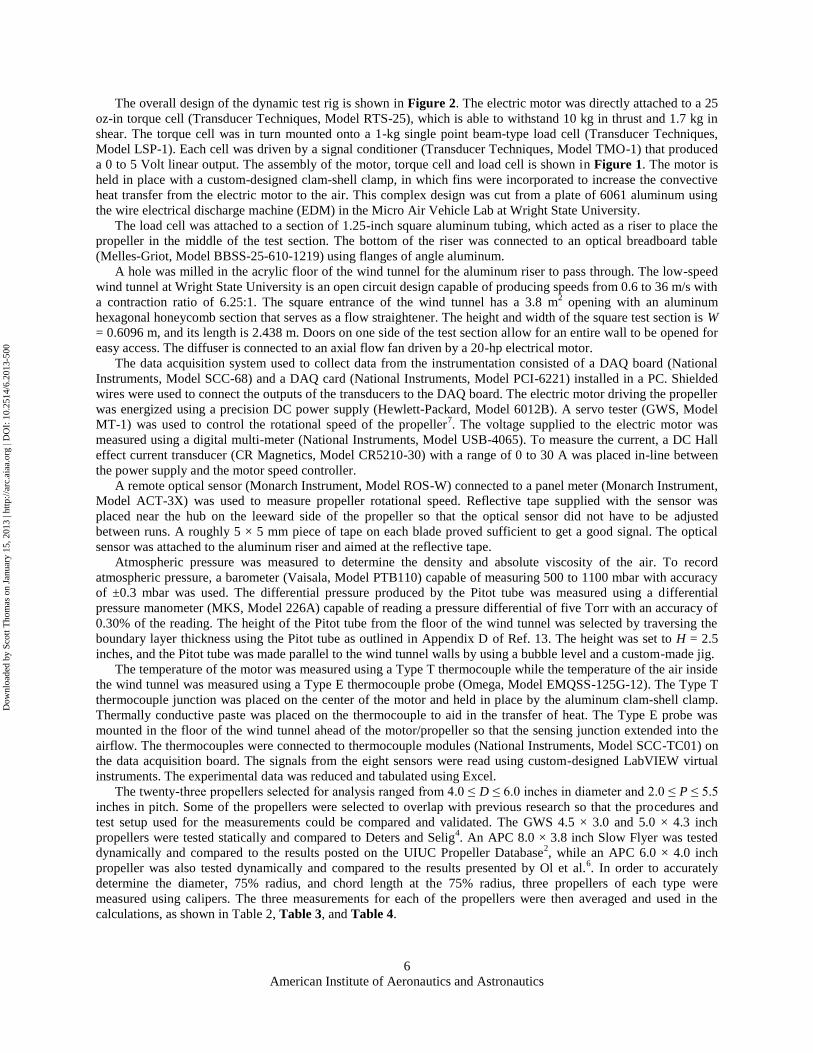
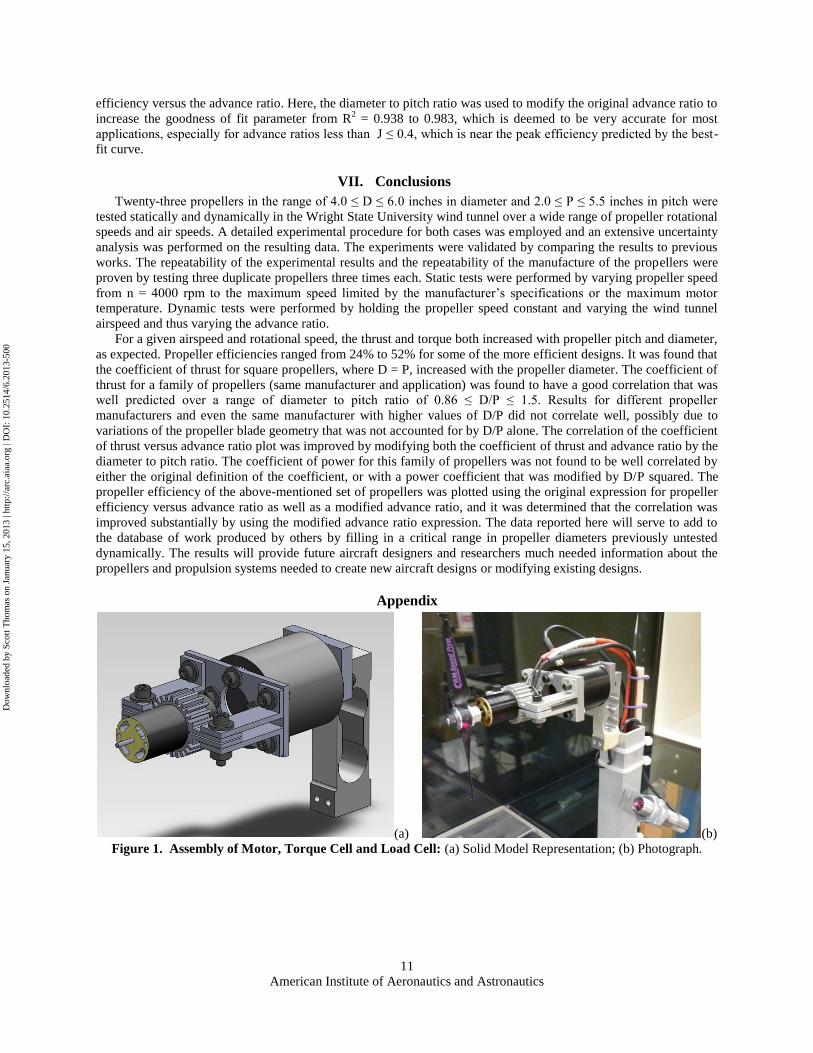
The overall design of the dynamic test rig is shown in Figure 2. The electric motor was directly attached to a 25
oz-in torque cell (Transducer Techniques, Model RTS-25), which is able to withstand 10 kg in thrust and 1.7 kg in
shear. The torque cell was in turn mounted onto a 1-kg single point beam-type load cell (Transducer Techniques,
Model LSP-1). Each cell was driven by a signal conditioner (Transducer Techniques, Model TMO-1) that produced
a 0 to 5 Volt linear output. The assembly of the motor, torque cell and load cell is shown in Figure 1. The motor is
held in place with a custom-designed clam-shell clamp, in which fins were incorporated to increase the convective
heat transfer from the electric motor to the air. This complex design was cut from a plate of 6061 aluminum using
the wire electrical discharge machine (EDM) in the Micro Air Vehicle Lab at Wright State University.
The load cell was attached to a section of 1.25-inch square aluminum tubing, which acted as a riser to place the
propeller in the middle of the test section. The bottom of the riser was connected to an optical breadboard table
(Melles-Griot, Model BBSS-25-610-1219) using flanges of angle aluminum.
A hole was milled in the acrylic floor of the wind tunnel for the aluminum riser to pass through. The low-speed
wind tunnel at Wright State University is an open circuit design capable of producing speeds from 0.6 to 36 m/s with
a contraction ratio of 6.25:1. The square entrance of the wind tunnel has a 3.8 m2 opening with an aluminum
hexagonal honeycomb section that serves as a flow straightener. The height and width of the square test section is W
= 0.6096 m, and its length is 2.438 m. Doors on one side of the test section allow for an entire wall to be opened for
easy access. The diffuser is connected to an axial flow fan driven by a 20-hp electrical motor.
The data acquisition system used to collect data from the instrumentation consisted of a DAQ board (National
Instruments, Model SCC-68) and a DAQ card (National Instruments, Model PCI-6221) installed in a PC. Shielded
wires were used to connect the outputs of the transducers to the DAQ board. The electric motor driving the propeller
was energized using a precision DC power supply (Hewlett-Packard, Model 6012B). A servo tester (GWS, Model
MT-1) was used to control the rotational speed of the propeller7. The voltage supplied to the electric motor was
measured using a digital multi-meter (National Instruments, Model USB-4065). To measure the current, a DC Hall
effect current transducer (CR Magnetics, Model CR5210-30) with a range of 0 to 30 A was placed in-line between
the power supply and the motor speed controller.
A remote optical sensor (Monarch Instrument, Model ROS-W) connected to a panel meter (Monarch Instrument,
Model ACT-3X) was used to measure propeller rotational speed. Reflective tape supplied with the sensor was
placed near the hub on the leeward side of the propeller so that the optical sensor did not have to be adjusted
between runs. A roughly 5 × 5 mm piece of tape on each blade proved sufficient to get a good signal. The optical
sensor was attached to the aluminum riser and aimed at the reflective tape.
Atmospheric pressure was measured to determine the density and absolute viscosity of the air. To record
atmospheric pressure, a barometer (Vaisala, Model PTB110) capable of measuring 500 to 1100 mbar with accuracy
of ±0.3 mbar was used. The differential pressure produced by the Pitot tube was measured using a differential
pressure manometer (MKS, Model 226A) capable of reading a pressure differential of five Torr with an accuracy of
0.30% of the reading. The height of the Pitot tube from the floor of the wind tunnel was selected by traversing the
boundary layer thickness using the Pitot tube as outlined in Appendix D of Ref. 13. The height was set to H = 2.5
inches, and the Pitot tube was made parallel to the wind tunnel walls by using a bubble level and a custom-made jig.
The temperature of the motor was measured using a Type T thermocouple while the temperature of the air inside
the wind tunnel was measured using a Type E thermocouple probe (Omega, Model EMQSS-125G-12). The Type T
thermocouple junction was placed on the center of the motor and held in place by the aluminum clam-shell clamp.
Thermally conductive paste was placed on the thermocouple to aid in the transfer of heat. The Type E probe was
mounted in the floor of the wind tunnel ahead of the motor/propeller so that the sensing junction extended into the
airflow. The thermocouples were connected to thermocouple modules (National Instruments, Model SCC-TC01) on
the data acquisition board. The signals from the eight sensors were read using custom-designed LabVIEW virtual
instruments. The experimental data was reduced and tabulated using Excel.
The twenty-three propellers selected for analysis ranged from 4.0 ≤ D ≤ 6.0 inches in diameter and 2.0 ≤ P ≤ 5.5
inches in pitch. Some of the propellers were selected to overlap with previous research so that the procedures and
test setup used for the measurements could be compared and validated. The GWS 4.5 × 3.0 and 5.0 × 4.3 inch
propellers were tested statically and compared to Deters and Selig4. An APC 8.0 × 3.8 inch Slow Flyer was tested
dynamically and compared to the results posted on the UIUC Propeller Database2, while an APC 6.0 × 4.0 inch
propeller was also tested dynamically and compared to the results presented by Ol et al.6. In order to accurately
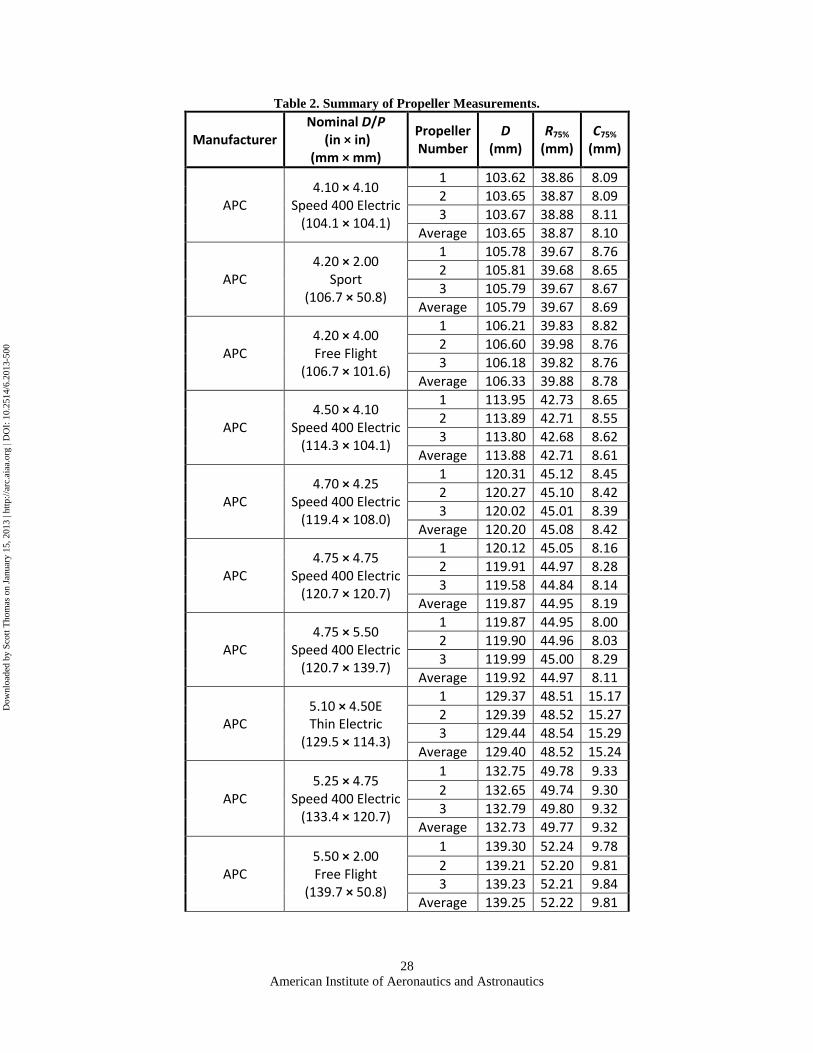
determine the diameter, 75% radius, and chord length at the 75% radius, three propellers of each type were
measured using calipers. The three measurements for each of the propellers were then averaged and used in the
calculations, as shown in Table 2, Table 3, and Table 4.
Dow
nloa
ded
by S
cott
Tho
mas
on
Janu
ary
15, 2
013
| http
://ar
c.ai
aa.o
rg |
DO
I: 1
0.25
14/6
.201
3-50
0
American Institute of Aeronautics and Astronautics
7
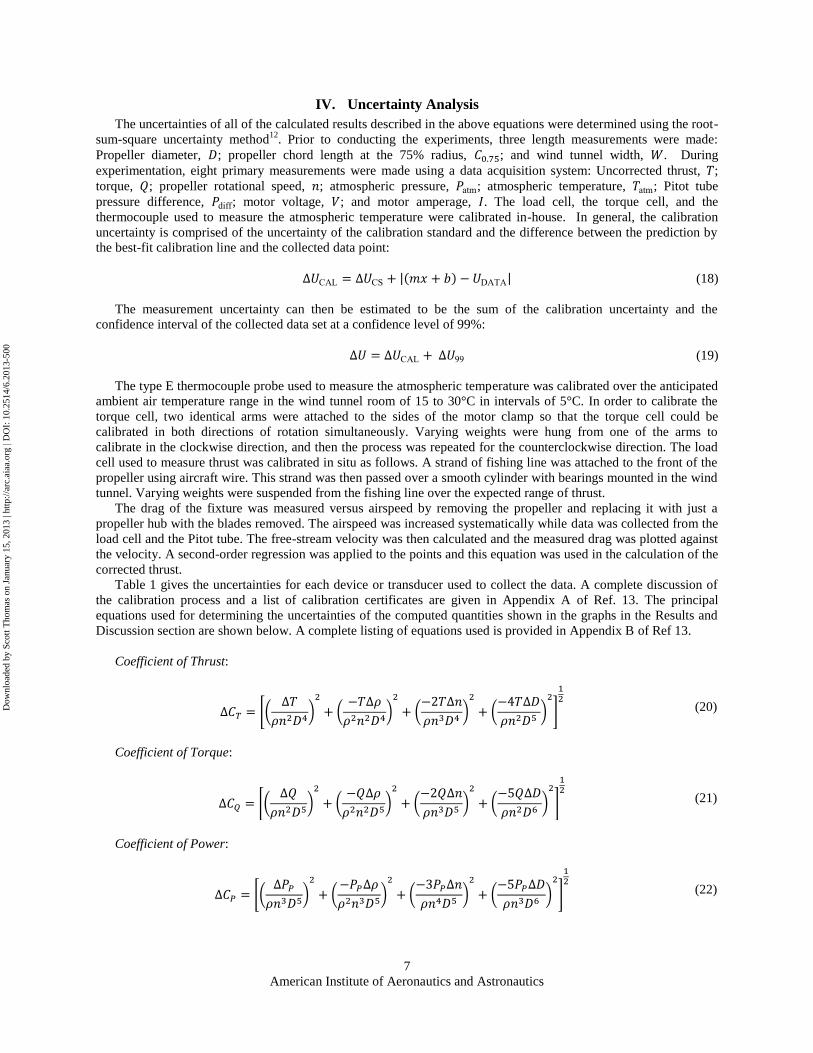
IV. Uncertainty Analysis
The uncertainties of all of the calculated results described in the above equations were determined using the root-
sum-square uncertainty method12
. Prior to conducting the experiments, three length measurements were made:
Propeller diameter, ; propeller chord length at the 75% radius, ; and wind tunnel width, . During
experimentation, eight primary measurements were made using a data acquisition system: Uncorrected thrust, ;
torque, ; propeller rotational speed, ; atmospheric pressure, atm; atmospheric temperature, atm; Pitot tube
pressure difference, diff; motor voltage, ; and motor amperage, . The load cell, the torque cell, and the
thermocouple used to measure the atmospheric temperature were calibrated in-house. In general, the calibration
uncertainty is comprised of the uncertainty of the calibration standard and the difference between the prediction by
the best-fit calibration line and the collected data point:
CAL CS |( ) ATA| (18)
The measurement uncertainty can then be estimated to be the sum of the calibration uncertainty and the
confidence interval of the collected data set at a confidence level of 99%:
CAL 99 (19)
The type E thermocouple probe used to measure the atmospheric temperature was calibrated over the anticipated
ambient air temperature range in the wind tunnel room of 15 to 30°C in intervals of 5°C. In order to calibrate the
torque cell, two identical arms were attached to the sides of the motor clamp so that the torque cell could be
calibrated in both directions of rotation simultaneously. Varying weights were hung from one of the arms to
calibrate in the clockwise direction, and then the process was repeated for the counterclockwise direction. The load
cell used to measure thrust was calibrated in situ as follows. A strand of fishing line was attached to the front of the
propeller using aircraft wire. This strand was then passed over a smooth cylinder with bearings mounted in the wind
tunnel. Varying weights were suspended from the fishing line over the expected range of thrust.
The drag of the fixture was measured versus airspeed by removing the propeller and replacing it with just a
propeller hub with the blades removed. The airspeed was increased systematically while data was collected from the
load cell and the Pitot tube. The free-stream velocity was then calculated and the measured drag was plotted against
the velocity. A second-order regression was applied to the points and this equation was used in the calculation of the
corrected thrust.
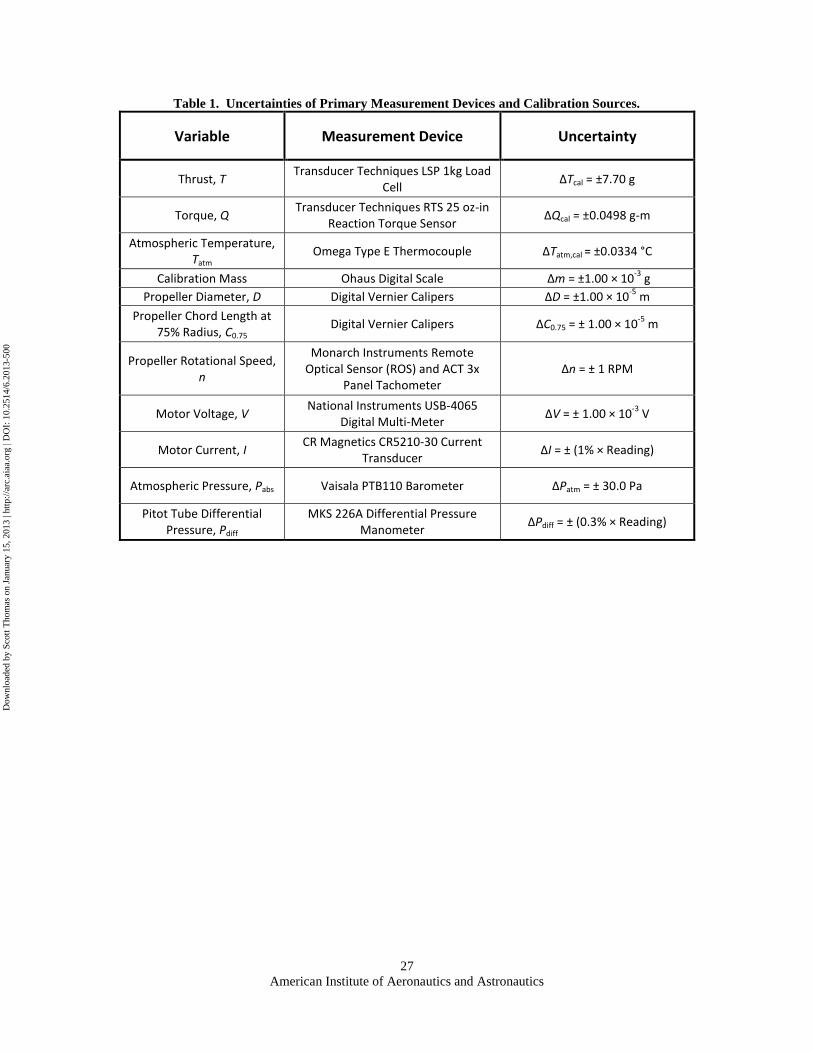
Table 1 gives the uncertainties for each device or transducer used to collect the data. A complete discussion of
the calibration process and a list of calibration certificates are given in Appendix A of Ref. 13. The principal
equations used for determining the uncertainties of the computed quantities shown in the graphs in the Results and
Discussion section are shown below. A complete listing of equations used is provided in Appendix B of Ref 13.
Coefficient of Thrust:
[(
)
(
)
(
)
(
)
]
(20)
Coefficient of Torque:
[(
)
(
)
(
)
(
)
]
(21)
Coefficient of Power:
[(
)
(
)
(
)
(
)
]
(22)
Dow
nloa
ded
by S
cott
Tho
mas
on
Janu
ary
15, 2
013
| http
://ar
c.ai
aa.o
rg |
DO
I: 1
0.25
14/6
.201
3-50
0

American Institute of Aeronautics and Astronautics
8
Propeller Efficiency:
[(
)
(
)
(
)
]
(23)
Advance Ratio:
[(
)
(
)
(
)
]
(24)
Overall Propulsion Efficiency:
[(
)
(
)
(
)
(
)
]
(25)
Reynolds Number at 75% Propeller Radius (Static Testing):
Re S [(
)
(
)
(
)
(
)
]
(26)
Reynolds Number at 75% Propeller Radius (Dynamic Testing):
Re [(
)
(
)
(
)
(
)
]
(27)
V. Test Procedures
In order to perform the experiments consistently, it was necessary to follow detailed procedures to collect data.
Two separate procedures were developed for the static and dynamic tests. For all of the tests, the power supply
driving the motor controller for the propeller motor was turned on and set to a nominal output of 11.1 Volts, which
matches the voltage output of a standard 3-cell battery. Then, the data acquisition system and the signal conditioners
driving the sensors were powered up for the warm-up periods recommended by the manufacturers. A file name and
location were chosen in the data acquisition software that identified such parameters as propeller diameter, pitch,
and propeller rotational speed. A complete description of the experimental procedures used is provided in Appendix
E of Ref. 13.
A. Static Test Procedure
After the warm-up period, the load cell and torque cell were zeroed by adjusting the balance potentiometers on
the signal conditioners so that the voltage outputs were as close as possible to zero. At this point, five hundred data
points were collected with the propeller off in order to obtain a baseline for the actual value of zero for the load cell
and torque cell. The propeller was then set to the first desired speed setting and one thousand data points were
collected. The propeller was then turned off and another set of 500 data points was acquired. The average values for
thrust and torque from the two propeller-off states were averaged and this value was used to correct the thrust and
torque measurements to account for zero drift and temperature effects10
. The process was then repeated for increased
values of rotational speed until the maximum speed was achieved.
B. Dynamic Test Procedure
After the warm-up period, the differential pressure transducer reading the Pitot tube, the load cell, and the torque
cell were zeroed. Five hundred data points were taken with the propeller motor off and the wind tunnel motor off. At
Dow
nloa
ded
by S
cott
Tho
mas
on
Janu
ary
15, 2
013
| http
://ar
c.ai
aa.o
rg |
DO
I: 1
0.25
14/6
.201
3-50
0

American Institute of Aeronautics and Astronautics
9
the end of the first five hundred points, the propeller motor was set to the desired rotational speed setting and the
wind tunnel airspeed was set to the first desired setting. After the system reached steady state, one thousand data
points were acquired. Next, the wind tunnel airspeed setting was changed and the propeller rotational speed was
adjusted to match the original setting. This process was repeated until the windmill state of the propeller was
reached. The propeller motor and the wind tunnel motor were both stopped at this point, and then five hundred data
points were collected in order to again account for drift in the sensors. Data sets were collected for approximately
ten wind tunnel airspeed settings for each of the four rotational speed settings for each propeller tested.
VI. Results and Discussion
To ensure that the collected data was repeatable and correct, tests were necessary to validate the static and
dynamic results. The first type of test checked for repeatability of the same propeller as well as the repeatability
across three identical propellers. The second type of test was to compare the results of the present experiment to
published results from researchers using the same propeller. A complete summary of all of the data for the static and
dynamic tests are provided in Appendix F and Appendix G of Ref. 13, respectively.
A. Validation of the Static Test
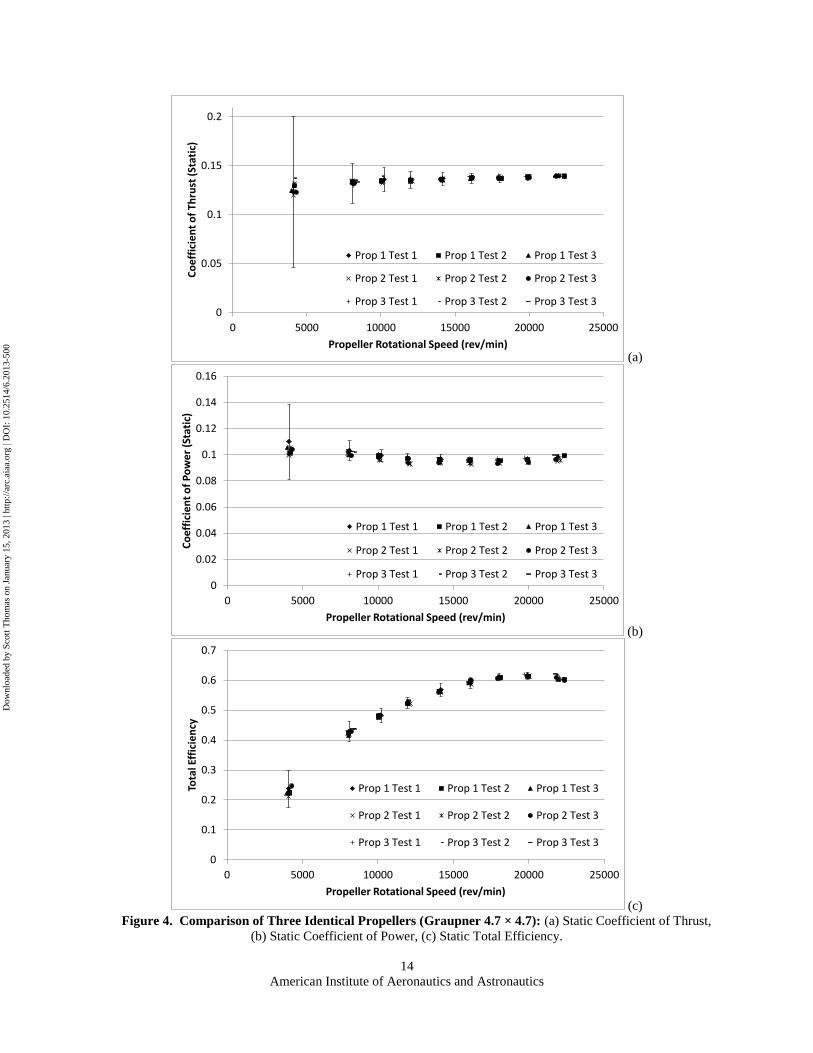
In order to check the repeatability of the experiment, three identical Graupner 4.7 × 4.7 inch propellers were
tested under static conditions three times each, thus creating a total of nine sets of data. This was done to determine
the repeatability of the experiment for multiple runs of the same propeller as well as establishing whether
manufacturing variability affected the performance of identical propellers. Figure 3 shows typical results for a static
propeller, where both the thrust and torque increase monotonically with rotational speed. Figure 4 shows that the
repeatability of the reduced data (coefficient of thrust, coefficient of power and total efficiency) was excellent. The
data from all nine tests fall within the uncertainty bounds for the first run. The duplicate propellers also fall directly
in line, meaning that, at least for this type of propeller, manufacturing differences can be neglected. The
uncertainties of the coefficients of thrust and power increased significantly at the lowest propeller rotational speed.
This was driven by the uncertainty of the load cell and the torque cell at relatively small values of thrust and torque.
Also, it was noted that at a rotational speed of n = 6000 rev/min, excessive vibrations were encountered, so that test
was halted.
Static tests were performed on two propellers (GWS 4.5 × 3.0 and GWS 5.0 × 4.3) which matched tests
performed by Deters and Selig4. The coefficient of thrust and the coefficient of power were compared to data
provided by Deters and Selig as shown in Figure 5, where the results for both propellers show good agreement.
B. Static Test Results
Having established the validity of the experimental results, data was collected for all of the propellers shown in
Table 2 - Table 4. Figure 6 shows a comparison between propellers with constant diameter and varying pitch, while
Figure 7 gives a comparison between propellers with varying diameter and constant pitch. Each figure shows the
coefficient of thrust, coefficient of power, and propeller efficiency. In Figure 6, the coefficients of thrust and power
are relatively constant while the propeller efficiency increased with propeller rotational speed. The effect of
reducing the pitch significantly decreased all three measures of performance. This same trend can be found in the
data provided by Deters and Selig4 for the coefficient of thrust and coefficient of power for the GWS 4.0 × 4.0
propeller versus that for the GWS 4.0 × 2.5 propeller. In Figure 7, the variation of the three performance parameters
with varying propeller diameter is also shown to be significant, where increasing the diameter decreased the thrust
coefficient and power coefficient but increased the propeller efficiency. This trend is also apparent in the data
reported by Deters and Selig4 for the following propellers: GWS 3.0 × 3.0, GWS 4.5 × 3.0, and GWS 5.0 × 3.0.
C. Validation of the Dynamic Test
The dynamic test procedure and experiment were validated similarly to the static experiment. Figure 8 shows
typical dynamic results for the thrust and torque generated by one propeller over the full range of airspeed and
various levels of rotational speed. Both the thrust and torque increase with rotational speed and decrease with
airspeed, as expected. The APC 8.0 × 3.8 inch Slow Flyer propeller was tested at nominal propeller rotational speeds
of n = 4000 and 7000 rpm, and the results for the coefficient of thrust, the coefficient of power, and the propeller
efficiency versus advance ratio were compared to those reported on the UIUC propeller database2, as shown in
Figure 9. In general, the coefficient of thrust and coefficient of power decrease with advance ratio, whereas the
propeller efficiency reaches a peak value, as shown in Figure 9(c). The agreement with the data from the UIUC
Dow
nloa
ded
by S
cott
Tho
mas
on
Janu
ary
15, 2
013
| http
://ar
c.ai
aa.o
rg |
DO
I: 1
0.25
14/6
.201
3-50
0

American Institute of Aeronautics and Astronautics
10
database is excellent for both rotational speeds, even where the propeller efficiency drops off steeply with advance
ratio.
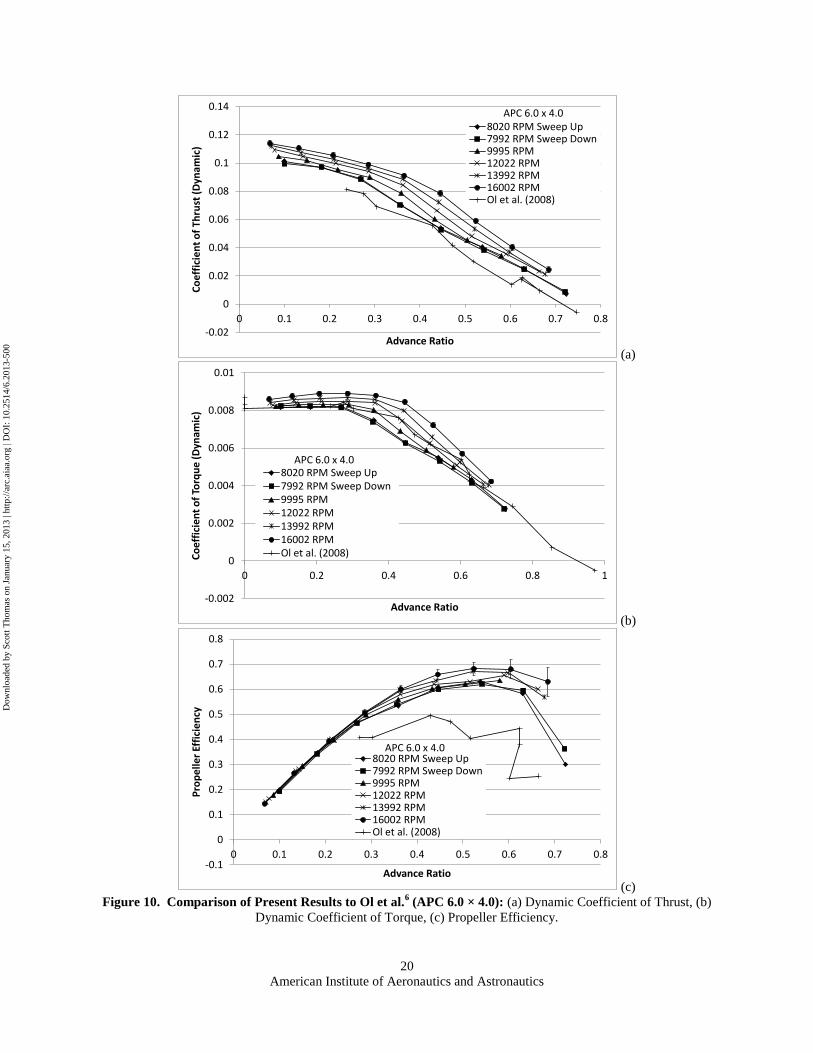
To further validate the dynamic results, an APC 6.0 × 4.0 inch propeller was tested at nominal propeller
rotational speeds of n = 8000 to 16000 rpm by intervals of 2000 rpm and compared to the results for the coefficient
of thrust, the coefficient of torque, and propeller efficiency versus advance ratio reported by Ol et al.6, as shown in
Figure 10. Again, the coefficients of thrust and torque decrease with advance ratio and the propeller efficiency
increases to a peak and then decreases. Since the exact propeller rotational speed tested by Ol et al. is unclear, it can
only be compared to the trends in the data. The present data agrees with that shown by Ol et al. and the trends are
similar. At a rotational speed of n = 8000 rpm, the propeller was tested by sweeping the advance ratio from low to
high values, and then sweeping from high to low values to examine the potential for hysteresis in the experiment. As
can be seen, there is not a noticeable difference between these two sets of data.
D. Dynamic Test Results
With the dynamic results validated, data was collected for all of the propellers. Similarly to the static tests,
comparisons were drawn between propellers with constant diameter and varying pitch in Figure 11 and between
propellers with constant pitch and varying diameter in Figure 12, both at a nominal rotational speed of n = 16000
rpm. In Figure 11, propellers with larger pitch generally had larger coefficients of thrust and power, and the
windmill state occurred at higher values of the advance ratio, which indicates that larger pitch values tend to allow
for higher airspeed. The results for the propeller efficiency given in Figure 11(c) shows that the efficiency decreases
with increasing pitch for lower values of advance ratio, and the peak efficiency occurs at higher values of advance
ratio. An increase in pitch essentially means that the angle of attack of the airfoil is higher, which should increase
both thrust and torque prior to reaching stall. In Figure 12, increasing the propeller diameter for a given pitch tends
to decrease the coefficient of thrust and the coefficient of power, and the propeller efficiency increases with
diameter for lower values of advance ratio. Increasing the diameter for a given rotational speed and airspeed actually
increases the thrust and torque due to the increased wingspan of the propeller, but this effect is negated due to the
factor of D4 in the denominator of CT and the factor of D5 in the denominator of the CP.
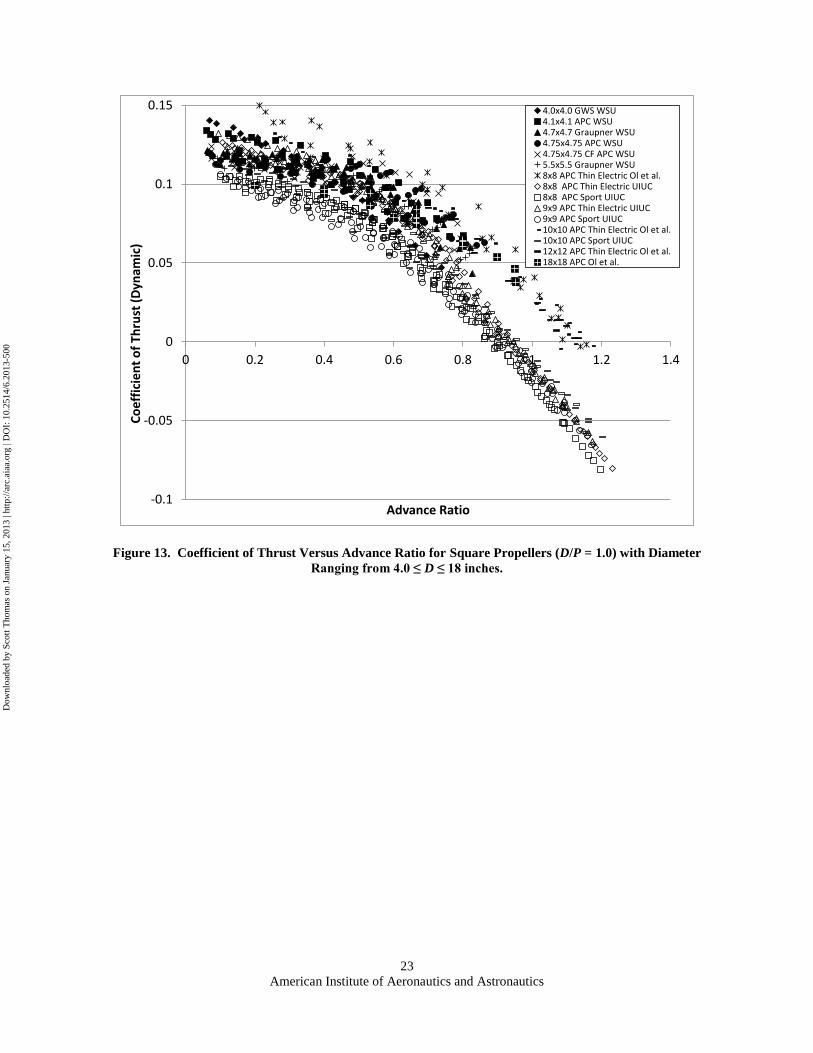
Figure 13 presents results for square propellers, where D = P, from Ol et al.6, Selig
2, and the present
experiment for a fairly wide range in propeller diameter (4.0 ≤ ≤ 18 inches). Ol et al. had conjectured that the
coefficient of thrust should collapse for square propellers. The results are grouped from small to large propeller
diameter, where the three researchers essentially covered different diameter ranges. In general, the coefficient of
thrust appears to increase with diameter, but more data would be required to make a definitive statement.
Figure 14 presents the coefficient of thrust for the same family of APC propellers (Speed 400 Electric). In
this case, the diameter to pitch ratio for this group of propellers has a relatively small range (0.86 ≤ /P ≤ 1.5).
However, it was found that the other types of propellers (Free Flight, Sport, Thin Electric, Slow Flyer) have
noticeably different blade shapes, which could induce variations in the results simply due to the geometry of the
propeller which could not be accounted for by using D/P alone. Figure 14(a) shows the coefficient of thrust versus
advance ratio for all of the collected data for the APC Speed 400 Electric propellers with an uncertainty level of ΔCT
≤ 20%. As can be seen, the results are not correlated well, as witnessed by the low goodness of fit parameter, R2 =
0.539. As the uncertainty requirement becomes more restrictive, less data points are permitted to be graphed, which
should increase the accuracy of the predictive best-fit line. However, this in itself becomes problematic, since more
data points (for the ΔCT = 20% case, for example) would provide more confidence in the resulting best-fit line. It is
entirely possible that, if the uncertainty requirement should become too restrictive, the best-fit line could become
erratic due to an insufficient number of data points. Conversely, if the uncertainty requirement becomes too lax, the
accuracy of the predictive curve would suffer due to inclusion of obviously erroneous data points. It should be noted
that many of the data points near the windmill state, where the thrust approaches zero, will not appear in these
graphs due to the fact that the values of thrust are much lower than the uncertainty. Figure 14(b) shows the
coefficient of thrust modified by D/P plotted against advance ratio. This change to coefficient of thrust improves the
goodness of fit parameter to R2 = 0.680. This gives a better correlation than (a) but this can be improved by
modifying the advance ratio by D/P as seen in Figure 14(c). This improves the goodness of fit parameter to a value
of R2 = 0.720. This is a large improvement over the original data and shows that the data fits together better when
modified by the diameter to pitch ratio.
Figure 15(a) similarly shows the coefficient of power versus advance ratio for all of the collected data with an
uncertainty level of ΔCP ≤ 20%. As can be seen, the results are not correlated well, as witnessed by the very low
goodness of fit parameter, R2 = 0.059. Figure 15(b) shows a coefficient of power that is modified by the diameter to
pitch ratio squared, which improves the goodness of fit parameter to R2 = 0.538. This is still relatively low, and
probably should not be used in most engineering analyses. Figure 16 shows a similar comparison for the propeller
Dow
nloa
ded
by S
cott
Tho
mas
on
Janu
ary
15, 2
013
| http
://ar
c.ai
aa.o
rg |
DO
I: 1
0.25
14/6
.201
3-50
0
American Institute of Aeronautics and Astronautics
11
efficiency versus the advance ratio. Here, the diameter to pitch ratio was used to modify the original advance ratio to
increase the goodness of fit parameter from R2 = 0.938 to 0.983, which is deemed to be very accurate for most
applications, especially for advance ratios less than J ≤ 0.4, which is near the peak efficiency predicted by the best-
fit curve.
VII. Conclusions
Twenty-three propellers in the range of 4.0 ≤ ≤ 6.0 inches in diameter and 2.0 ≤ P ≤ 5.5 inches in pitch were
tested statically and dynamically in the Wright State University wind tunnel over a wide range of propeller rotational
speeds and air speeds. A detailed experimental procedure for both cases was employed and an extensive uncertainty
analysis was performed on the resulting data. The experiments were validated by comparing the results to previous
works. The repeatability of the experimental results and the repeatability of the manufacture of the propellers were
proven by testing three duplicate propellers three times each. Static tests were performed by varying propeller speed
from n = 4000 rpm to the maximum speed limited by the manufacturer’s specifications or the maximum motor
temperature. Dynamic tests were performed by holding the propeller speed constant and varying the wind tunnel
airspeed and thus varying the advance ratio.
For a given airspeed and rotational speed, the thrust and torque both increased with propeller pitch and diameter,
as expected. Propeller efficiencies ranged from 24% to 52% for some of the more efficient designs. It was found that
the coefficient of thrust for square propellers, where D = P, increased with the propeller diameter. The coefficient of
thrust for a family of propellers (same manufacturer and application) was found to have a good correlation that was
well predicted over a range of diameter to pitch ratio of 0.86 ≤ /P ≤ 1.5. Results for different propeller
manufacturers and even the same manufacturer with higher values of D/P did not correlate well, possibly due to
variations of the propeller blade geometry that was not accounted for by D/P alone. The correlation of the coefficient
of thrust versus advance ratio plot was improved by modifying both the coefficient of thrust and advance ratio by the
diameter to pitch ratio. The coefficient of power for this family of propellers was not found to be well correlated by
either the original definition of the coefficient, or with a power coefficient that was modified by D/P squared. The
propeller efficiency of the above-mentioned set of propellers was plotted using the original expression for propeller
efficiency versus advance ratio as well as a modified advance ratio, and it was determined that the correlation was
improved substantially by using the modified advance ratio expression. The data reported here will serve to add to
the database of work produced by others by filling in a critical range in propeller diameters previously untested
dynamically. The results will provide future aircraft designers and researchers much needed information about the
propellers and propulsion systems needed to create new aircraft designs or modifying existing designs.
Appendix
(a) (b)
Figure 1. Assembly of Motor, Torque Cell and Load Cell: (a) Solid Model Representation; (b) Photograph.
Dow
nloa
ded
by S
cott
Tho
mas
on
Janu
ary
15, 2
013
| http
://ar
c.ai
aa.o
rg |
DO
I: 1
0.25
14/6
.201
3-50
0

American Institute of Aeronautics and Astronautics
12
Figure 2. Schematic Diagram of the Experimental Setup.
Dow
nloa
ded
by S
cott
Tho
mas
on
Janu
ary
15, 2
013
| http
://ar
c.ai
aa.o
rg |
DO
I: 1
0.25
14/6
.201
3-50
0

American Institute of Aeronautics and Astronautics
13
(a)
(b)
Figure 3. Typical Static Test Results (Graupner 4.7 × 4.7 inch Propeller): (a) Thrust and Torque Versus
Rotational Speed, (b) Coefficient of Thrust, Power and Total Efficiency Versus Rotational Speed.
0
1
2
3
4
5
6
7
0
100
200
300
400
500
600
0 5000 10000 15000 20000 25000
Torq
ue
(g-
m)
Thru
st (
g)
Propeller Rotational Speed (rev/min)
Thrust
Torque
Graupner 4.7 x 4.7
0
0.1
0.2
0.3
0.4
0.5
0.6
0.7
0
0.05
0.1
0.15
0.2
0.25
0 5000 10000 15000 20000 25000
Tota
l Eff
icie
ncy
Co
effi
cie
nt
of
Thru
st a
nd
Po
we
r (S
tati
c)
Propeller Rotational Speed (rev/min)
CT
CP
Total Efficiency
Dow
nloa
ded
by S
cott
Tho
mas
on
Janu
ary
15, 2
013
| http
://ar
c.ai
aa.o
rg |
DO
I: 1
0.25
14/6
.201
3-50
0
American Institute of Aeronautics and Astronautics
14
(a)
(b)
(c)
Figure 4. Comparison of Three Identical Propellers (Graupner 4.7 × 4.7): (a) Static Coefficient of Thrust,
(b) Static Coefficient of Power, (c) Static Total Efficiency.
0
0.05
0.1
0.15
0.2
0 5000 10000 15000 20000 25000
Co
effi
cie
nt
of
Thru
st (
Stat
ic)
Propeller Rotational Speed (rev/min)
Prop 1 Test 1 Prop 1 Test 2 Prop 1 Test 3
Prop 2 Test 1 Prop 2 Test 2 Prop 2 Test 3
Prop 3 Test 1 Prop 3 Test 2 Prop 3 Test 3
0
0.02
0.04
0.06
0.08
0.1
0.12
0.14
0.16
0 5000 10000 15000 20000 25000
Co
effi
cie
nt
of
Po
we
r (S
tati
c)
Propeller Rotational Speed (rev/min)
Prop 1 Test 1 Prop 1 Test 2 Prop 1 Test 3
Prop 2 Test 1 Prop 2 Test 2 Prop 2 Test 3
Prop 3 Test 1 Prop 3 Test 2 Prop 3 Test 3
0
0.1
0.2
0.3
0.4
0.5
0.6
0.7
0 5000 10000 15000 20000 25000
Tota
l Eff
icie
ncy
Propeller Rotational Speed (rev/min)
Prop 1 Test 1 Prop 1 Test 2 Prop 1 Test 3
Prop 2 Test 1 Prop 2 Test 2 Prop 2 Test 3
Prop 3 Test 1 Prop 3 Test 2 Prop 3 Test 3
Dow
nloa
ded
by S
cott
Tho
mas
on
Janu
ary
15, 2
013
| http
://ar
c.ai
aa.o
rg |
DO
I: 1
0.25
14/6
.201
3-50
0

American Institute of Aeronautics and Astronautics
15
(a)
(b)
Figure 5. Comparison of the Present Results to Deters and Selig4 (GWS 4.5 × 3.0 and GWS 5.0 × 4.3
Propellers): (a) Static Coefficient of Thrust, (b) Static Coefficient of Power.
0
0.05
0.1
0.15
0.2
0.25
0 2000 4000 6000 8000 10000 12000 14000 16000
Co
effi
cie
nt
of
Thru
st (
Stat
ic)
Propeller Rotational Speed (rev/min)
WSU GWS 4.5 x 3.0Deters/Selig (2008) GWS 4.5 x 3.0WSU GWS 5.0 x 4.3Deters/Selig (2008) GWS 5.0 x 4.3
0
0.02
0.04
0.06
0.08
0.1
0.12
0.14
0 2000 4000 6000 8000 10000 12000 14000 16000
Co
effi
cie
nt
of
Po
we
r (S
tati
c)
Propeller Rotational Speed (rev/min)
WSU GWS 4.5 x 3.0
Deters/Selig (2008) GWS 4.5 x 3.0
WSU GWS 5.0 x 4.3
Deters/Selig (2008) GWS 5.0 x 4.3
Dow
nloa
ded
by S
cott
Tho
mas
on
Janu
ary
15, 2
013
| http
://ar
c.ai
aa.o
rg |
DO
I: 1
0.25
14/6
.201
3-50
0

American Institute of Aeronautics and Astronautics
16
(a)
(b)
(c)
Figure 6. The Effect of Varying Propeller Pitch While Holding Diameter Constant: (a) Static Coefficient of
Thrust, (b) Static Coefficient of Power, (c) Static Total Efficiency.
0
0.02
0.04
0.06
0.08
0.1
0.12
0.14
0.16
0.18
0 5000 10000 15000 20000 25000
Co
effi
cie
nt
of
Thru
st (
Stat
ic)
Propeller Rotational Speed (rev/min)
GWS 5.0 x 3.0
GWS 5.0 x 4.3
GWS 4.0 x 2.5
GWS 4.0 x 4.0
0
0.02
0.04
0.06
0.08
0.1
0.12
0.14
0 5000 10000 15000 20000 25000
Co
effi
cie
nt
of
Po
we
r (S
tati
c)
Propeller Rotational Speed (rev/min)
GWS 5.0 x 3.0
GWS 5.0 x 4.3
GWS 4.0 x 2.5
GWS 4.0 x 4.0
0
0.1
0.2
0.3
0.4
0.5
0.6
0.7
0.8
0 5000 10000 15000 20000 25000
Tota
l Eff
icie
ncy
Propeller Rotational Speed (rev/min)
GWS 5.0 x 3.0
GWS 5.0 x 4.3
GWS 4.0 x 2.5
GWS 4.0 x 4.0
Dow
nloa
ded
by S
cott
Tho
mas
on
Janu
ary
15, 2
013
| http
://ar
c.ai
aa.o
rg |
DO
I: 1
0.25
14/6
.201
3-50
0

American Institute of Aeronautics and Astronautics
17
(a)
(b)
(c)
Figure 7. The Effect of Varying Propeller Diameter While Holding Pitch Constant: (a) Static Coefficient of
Thrust, (b) Static Coefficient of Power, (c) Static Total Efficiency.
0
0.02
0.04
0.06
0.08
0.1
0.12
0.14
0.16
0 5000 10000 15000 20000 25000 30000
Co
effi
cie
nt
of
Thru
st (
Stat
ic)
Propeller Rotational Speed (rev/min)
APC 4.2 x 2.0 SportAPC 6.0 x 2.0 SportAPC 4.75 x 4.75 S.400E.APC 5.25 x 4.75 S.400E.GWS 4.5 x 3.0GWS 5.0 x 3.0
0
0.02
0.04
0.06
0.08
0.1
0.12
0 5000 10000 15000 20000 25000 30000
Co
effi
cie
nt
of
Po
we
r (S
tati
c)
Propeller Rotational Speed (rev/min)
APC 4.2 x 2.0 SportAPC 6.0 x 2.0 SportAPC 4.75 x 4.75 S.400E.APC 5.25 x 4.75 S.400E.GWS 4.5 x 3.0GWS 5.0 x 3.0
0
0.1
0.2
0.3
0.4
0.5
0.6
0.7
0.8
0 5000 10000 15000 20000 25000 30000
Tota
l Eff
icie
ncy
Propeller Rotational Speed (rev/min)
APC 4.2 x 2.0 SportAPC 6.0 x 2.0 SportAPC 4.75 x 4.75 S.400E.APC 5.25 x 4.75 S.400E.GWS 4.5 x 3.0GWS 5.0 x 3.0
Dow
nloa
ded
by S
cott
Tho
mas
on
Janu
ary
15, 2
013
| http
://ar
c.ai
aa.o
rg |
DO
I: 1
0.25
14/6
.201
3-50
0

American Institute of Aeronautics and Astronautics
18
(a)
(b)
Figure 8. Typical Dynamic Test Results (Graupner 4.7 × 4.7 inch Propeller): (a)Thrust and Torque Versus
Airspeed for Various Rotational Speeds, (b) Coefficient of Thrust, Power and Propeller Efficiency Versus Advance
Ratio.
0
1
2
3
4
5
6
0
50
100
150
200
250
300
350
400
450
0 5 10 15 20 25 30 35
Torq
ue
(g-
m)
Thru
st (
g)
Airspeed (m/s)
10023 RPM 14006 RPM 18002 RPM 20026 RPM
10023 RPM 14006 RPM 18002 RPM 20026 RPMTorque
Thrust
Graupner 4.7 x 4.7
0
0.1
0.2
0.3
0.4
0.5
0.6
0.7
0.8
0
0.02
0.04
0.06
0.08
0.1
0.12
0.14
0 0.1 0.2 0.3 0.4 0.5 0.6 0.7 0.8
Pro
pe
ller
Effi
cie
ncy
Co
effi
cie
nt
of
Thru
st a
nd
Po
we
r (D
ynam
ic)
Advance Ratio
CT 20026 RPM
CP 20026 RPM
Prop Efficiency 20026 RPM
Graupner 4.7 x 4.7
Dow
nloa
ded
by S
cott
Tho
mas
on
Janu
ary
15, 2
013
| http
://ar
c.ai
aa.o
rg |
DO
I: 1
0.25
14/6
.201
3-50
0

American Institute of Aeronautics and Astronautics
19
(a)
(b)
(c)
Figure 9. Comparison of Present Results to Selig2 (APC 8.0 × 3.8 SF): (a) Dynamic Coefficient of Thrust,
(b) Dynamic Coefficient of Power, (c) Propeller Efficiency.
-0.08
-0.06
-0.04
-0.02
0
0.02
0.04
0.06
0.08
0.1
0.12
0.14
0 0.1 0.2 0.3 0.4 0.5 0.6 0.7 0.8 0.9
Co
effi
cie
nt
of
Thru
st (
Dyn
amic
)
Advance Ratio
WSU 6897 RPM
UIUC 7013 RPM
UIUC 7018 RPM
WSU 4033 RPM
UIUC 4007 RPM
APC 8.0 x 3.8 SF
0
0.01
0.02
0.03
0.04
0.05
0.06
0 0.1 0.2 0.3 0.4 0.5 0.6 0.7 0.8 0.9
Co
effi
cie
nt
of
Po
we
r (D
ynam
ic)
Advance Ratio
WSU 6897 RPM
UIUC 7013 RPM
UIUC 7018 RPM
WSU 4033 RPM
UIUC 4007 RPM
APC 8.0 x 3.8 SF
-0.8
-0.6
-0.4
-0.2
0
0.2
0.4
0.6
0.8
0 0.1 0.2 0.3 0.4 0.5 0.6 0.7 0.8 0.9
Pro
pe
ller
Effi
cie
ncy
Advance Ratio
WSU 6897 RPMUIUC 7013 RPMUIUC 7018 RPMWSU 4033 RPMUIUC 4007 RPM
APC 8.0 x 3.8 SF
Dow
nloa
ded
by S
cott
Tho
mas
on
Janu
ary
15, 2
013
| http
://ar
c.ai
aa.o
rg |
DO
I: 1
0.25
14/6
.201
3-50
0
American Institute of Aeronautics and Astronautics
20
(a)
(b)
(c)
Figure 10. Comparison of Present Results to Ol et al.6 (APC 6.0 × 4.0): (a) Dynamic Coefficient of Thrust, (b)
Dynamic Coefficient of Torque, (c) Propeller Efficiency.
-0.02
0
0.02
0.04
0.06
0.08
0.1
0.12
0.14
0 0.1 0.2 0.3 0.4 0.5 0.6 0.7 0.8
Co
effi
cie
nt
of
Thru
st (
Dyn
amic
)
Advance Ratio
8020 RPM Sweep Up7992 RPM Sweep Down9995 RPM12022 RPM13992 RPM16002 RPMOl et al. (2008)
APC 6.0 x 4.0
-0.002
0
0.002
0.004
0.006
0.008
0.01
0 0.2 0.4 0.6 0.8 1
Co
effi
cie
nt
of
Torq
ue
(D
ynam
ic)
Advance Ratio
8020 RPM Sweep Up7992 RPM Sweep Down9995 RPM12022 RPM13992 RPM16002 RPMOl et al. (2008)
APC 6.0 x 4.0
-0.1
0
0.1
0.2
0.3
0.4
0.5
0.6
0.7
0.8
0 0.1 0.2 0.3 0.4 0.5 0.6 0.7 0.8
Pro
pe
ller
Effi
cie
ncy
Advance Ratio
8020 RPM Sweep Up7992 RPM Sweep Down9995 RPM12022 RPM13992 RPM16002 RPMOl et al. (2008)
APC 6.0 x 4.0
Dow
nloa
ded
by S
cott
Tho
mas
on
Janu
ary
15, 2
013
| http
://ar
c.ai
aa.o
rg |
DO
I: 1
0.25
14/6
.201
3-50
0

American Institute of Aeronautics and Astronautics
21
(a)
(b)
(c)
Figure 11. The Effect of Varying Propeller Pitch While Holding Diameter Constant: (a) Dynamic Coefficient
of Thrust, (b) Dynamic Coefficient of Power, (c) Propeller Efficiency.
0
0.02
0.04
0.06
0.08
0.1
0.12
0.14
0.16
0 0.2 0.4 0.6 0.8 1
Co
effi
cie
nt
of
Thru
st (
Dyn
amic
)
Advance Ratio
GWS 5.0 x 3.0 15998 RPMGWS 5.0 x 4.3 16006 RPMAPC 4.75 x 4.75 15997 RPMAPC 4.75 x 5.5 15990 RPM
0
0.02
0.04
0.06
0.08
0.1
0.12
0.14
0.16
0 0.2 0.4 0.6 0.8 1
Co
effi
cie
nt
of
Po
we
r (D
ynam
ic)
Advance Ratio
GWS 5.0 x 3.0 15998 RPMGWS 5.0 x 4.3 16006 RPMAPC 4.75 x 4.75 15997 RPMAPC 4.75 x 5.5 15990 RPM
0
0.1
0.2
0.3
0.4
0.5
0.6
0.7
0.8
0 0.2 0.4 0.6 0.8 1
Pro
pe
ller
Effi
cie
ncy
Advance Ratio
GWS 5.0 x 3.0 15998 RPMGWS 5.0 x 4.3 16006 RPMAPC 4.75 x 4.75 15997 RPMAPC 4.75 x 5.5 15990 RPM
Dow
nloa
ded
by S
cott
Tho
mas
on
Janu
ary
15, 2
013
| http
://ar
c.ai
aa.o
rg |
DO
I: 1
0.25
14/6
.201
3-50
0

American Institute of Aeronautics and Astronautics
22
(a)
(b)
(c) Figure 12. The Effect of Varying Propeller Diameter While Holding Pitch Constant: (a) Dynamic Coefficient
of Thrust, (b) Dynamic Coefficient of Power, (c) Propeller Efficiency.
0
0.02
0.04
0.06
0.08
0.1
0.12
0.14
0 0.2 0.4 0.6 0.8 1 1.2
Co
effi
cie
nt
of
Thru
st (
Dyn
amic
)
Advance Ratio
APC 4.2 x 2.0 16023 RPMAPC 6.0 x 2.0 16009 RPMAPC 4.75 x 4.75 15997 RPMAPC 5.25 x 4.75 15988 RPMGWS 4.5 x 3.0 15996 RPMGWS 5.0 x 3.0 15998 RPM
0
0.02
0.04
0.06
0.08
0.1
0.12
0 0.2 0.4 0.6 0.8 1
Co
effi
cie
nt
of
Po
we
r (D
ynam
ic)
Advance Ratio
APC 4.2 x 2.0 16023 RPMAPC 6.0 x 2.0 16009 RPMAPC 4.75 x 4.75 15997 RPMAPC 5.25 x 4.75 15988 RPMGWS 4.5 x 3.0 15996 RPMGWS 5.0 x 3.0 15998 RPM
0
0.1
0.2
0.3
0.4
0.5
0.6
0.7
0.8
0 0.2 0.4 0.6 0.8 1
Pro
pe
ller
Effi
cie
ncy
Advance Ratio
APC 4.2 x 2.0 16023 RPMAPC 6.0 x 2.0 16009 RPMAPC 4.75 x 4.75 15997 RPMAPC 5.25 x 4.75 15988 RPMGWS 4.5 x 3.0 15996 RPM
Dow
nloa
ded
by S
cott
Tho
mas
on
Janu
ary
15, 2
013
| http
://ar
c.ai
aa.o
rg |
DO
I: 1
0.25
14/6
.201
3-50
0
American Institute of Aeronautics and Astronautics
23
Figure 13. Coefficient of Thrust Versus Advance Ratio for Square Propellers (D/P = 1.0) with Diameter
Ranging from 4.0 ≤ D ≤ 18 inches.
-0.1
-0.05
0
0.05
0.1
0.15
0 0.2 0.4 0.6 0.8 1 1.2 1.4
Co
effi
cie
nt
of
Thru
st (
Dyn
amic
)
Advance Ratio
4.0x4.0 GWS WSU4.1x4.1 APC WSU4.7x4.7 Graupner WSU4.75x4.75 APC WSU4.75x4.75 CF APC WSU5.5x5.5 Graupner WSU8x8 APC Thin Electric Ol et al.8x8 APC Thin Electric UIUC8x8 APC Sport UIUC9x9 APC Thin Electric UIUC9x9 APC Sport UIUC10x10 APC Thin Electric Ol et al.10x10 APC Sport UIUC12x12 APC Thin Electric Ol et al.18x18 APC Ol et al.
Dow
nloa
ded
by S
cott
Tho
mas
on
Janu
ary
15, 2
013
| http
://ar
c.ai
aa.o
rg |
DO
I: 1
0.25
14/6
.201
3-50
0

American Institute of Aeronautics and Astronautics
24
(a)
(b)
(c)
Figure 14. Coefficient of Thrust Versus Advance Ratio for the APC Sport 400 Electric Propellers (ΔCT ≤
20%): (a) Original Representation of CT; (b) CT Modified by the Diameter to Pitch Ratio, (c) CT and J Modified by
the Diameter to Pitch Ratio
y = -0.035664x2 - 0.044141x + 0.121732R² = 0.528753
0
0.02
0.04
0.06
0.08
0.1
0.12
0.14
0.16
0.18
0 0.2 0.4 0.6 0.8 1 1.2
Co
effi
cie
nt
of
Thru
st
Advance Ratio
y = -0.062973x2 - 0.041761x + 0.136400R² = 0.679633
0
0.02
0.04
0.06
0.08
0.1
0.12
0.14
0.16
0.18
0 0.2 0.4 0.6 0.8 1 1.2
Co
effi
cie
nt
of
Thru
st *
(D/P
)
Advance Ratio
y = -0.123768x2 + 0.031706x + 0.124147R² = 0.720267
0
0.02
0.04
0.06
0.08
0.1
0.12
0.14
0.16
0.18
0 0.2 0.4 0.6 0.8 1 1.2
Co
effi
cie
nt
of
Thru
st *
(D/P
)
Advance Ratio * (D/P)
Dow
nloa
ded
by S
cott
Tho
mas
on
Janu
ary
15, 2
013
| http
://ar
c.ai
aa.o
rg |
DO
I: 1
0.25
14/6
.201
3-50
0

American Institute of Aeronautics and Astronautics
25
(a)
(b)
Figure 15. Coefficient of Power Versus Advance Ratio for the APC Sport 400 Electric Propellers (ΔCP ≤
20%): (a) Original Representation of CP; (b) CP Modified by the Diameter to Pitch Ratio.
y = 0.007516x2 - 0.029530x + 0.090244R² = 0.058844
0
0.02
0.04
0.06
0.08
0.1
0.12
0.14
0 0.2 0.4 0.6 0.8 1
Co
effi
cie
nt
of
Po
we
r
Advance Ratio
y = -0.058168x2 + 0.004500x + 0.105709R² = 0.537663
0
0.02
0.04
0.06
0.08
0.1
0.12
0.14
0 0.2 0.4 0.6 0.8 1
Co
effi
cie
nt
of
Po
we
r *
(D/P
)^2
Advance Ratio
Dow
nloa
ded
by S
cott
Tho
mas
on
Janu
ary
15, 2
013
| http
://ar
c.ai
aa.o
rg |
DO
I: 1
0.25
14/6
.201
3-50
0

American Institute of Aeronautics and Astronautics
26
(a)
(b)
Figure 16. Propeller Efficiency Versus Advance Ratio for the APC Sport 400 Electric Propellers (ΔηP ≤
20%): (a) Original Representation of ηP; (b) Advance Ratio Modified by the Diameter to Pitch Ratio.
y = -1.069536x2 + 1.757518x - 0.024676R² = 0.937662
0
0.1
0.2
0.3
0.4
0.5
0.6
0.7
0.8
0 0.2 0.4 0.6 0.8 1 1.2
Pro
pe
ller
Effi
cie
ncy
Advance Ratio
y = -1.005349x2 + 1.723020x - 0.051306R² = 0.983048
0
0.1
0.2
0.3
0.4
0.5
0.6
0.7
0.8
0 0.2 0.4 0.6 0.8 1 1.2
Pro
pe
ller
Effi
cie
ncy
Advance Ratio *(D/P)
Dow
nloa
ded
by S
cott
Tho
mas
on
Janu
ary
15, 2
013
| http
://ar
c.ai
aa.o
rg |
DO
I: 1
0.25
14/6
.201
3-50
0
American Institute of Aeronautics and Astronautics
27
Table 1. Uncertainties of Primary Measurement Devices and Calibration Sources.
Variable Measurement Device Uncertainty
Thrust, T Transducer Techniques LSP 1kg Load
Cell ΔTcal = ±7.70 g
Torque, Q Transducer Techniques RTS 25 oz-in
Reaction Torque Sensor ΔQcal = ±0.0498 g-m
Atmospheric Temperature, Tatm
Omega Type E Thermocouple ΔTatm,cal = ±0.0334 °C
Calibration Mass Ohaus Digital Scale Δm = ±1.00 × 10⁻³
g
Propeller Diameter, D Digital Vernier Calipers ΔD = ±1.00 × 10⁻⁵
m
Propeller Chord Length at 75% Radius, C0.75
Digital Vernier Calipers ΔC0.75 = ± 1.00 × 10⁻⁵
m
Propeller Rotational Speed, n
Monarch Instruments Remote Optical Sensor (ROS) and ACT 3x
Panel Tachometer Δn = ± 1 RPM
Motor Voltage, V National Instruments USB-4065
Digital Multi-Meter ΔV = ± 1.00 × 10
-3 V
Motor Current, I CR Magnetics CR5210-30 Current
Transducer ΔI = ± (1% × Reading)
Atmospheric Pressure, Pabs Vaisala PTB110 Barometer ΔPatm = ± 30.0 Pa
Pitot Tube Differential Pressure, Pdiff
MKS 226A Differential Pressure Manometer
ΔPdiff = ± (0.3% × Reading)
Dow
nloa
ded
by S
cott
Tho
mas
on
Janu
ary
15, 2
013
| http
://ar
c.ai
aa.o
rg |
DO
I: 1
0.25
14/6
.201
3-50
0
American Institute of Aeronautics and Astronautics
28
Table 2. Summary of Propeller Measurements.
Manufacturer Nominal D/P
(in × in) (mm × mm)
Propeller Number
D (mm)
R75% (mm)
C75% (mm)
APC 4.10 × 4.10
Speed 400 Electric (104.1 × 104.1)
1 103.62 38.86 8.09
2 103.65 38.87 8.09
3 103.67 38.88 8.11
Average 103.65 38.87 8.10
APC 4.20 × 2.00
Sport (106.7 × 50.8)
1 105.78 39.67 8.76
2 105.81 39.68 8.65
3 105.79 39.67 8.67
Average 105.79 39.67 8.69
APC 4.20 × 4.00 Free Flight
(106.7 × 101.6)
1 106.21 39.83 8.82
2 106.60 39.98 8.76
3 106.18 39.82 8.76
Average 106.33 39.88 8.78
APC 4.50 × 4.10
Speed 400 Electric (114.3 × 104.1)
1 113.95 42.73 8.65
2 113.89 42.71 8.55
3 113.80 42.68 8.62
Average 113.88 42.71 8.61
APC 4.70 × 4.25
Speed 400 Electric (119.4 × 108.0)
1 120.31 45.12 8.45
2 120.27 45.10 8.42
3 120.02 45.01 8.39
Average 120.20 45.08 8.42
APC 4.75 × 4.75
Speed 400 Electric (120.7 × 120.7)
1 120.12 45.05 8.16
2 119.91 44.97 8.28
3 119.58 44.84 8.14
Average 119.87 44.95 8.19
APC 4.75 × 5.50
Speed 400 Electric (120.7 × 139.7)
1 119.87 44.95 8.00
2 119.90 44.96 8.03
3 119.99 45.00 8.29
Average 119.92 44.97 8.11
APC 5.10 × 4.50E Thin Electric
(129.5 × 114.3)
1 129.37 48.51 15.17
2 129.39 48.52 15.27
3 129.44 48.54 15.29
Average 129.40 48.52 15.24
APC 5.25 × 4.75
Speed 400 Electric (133.4 × 120.7)
1 132.75 49.78 9.33
2 132.65 49.74 9.30
3 132.79 49.80 9.32
Average 132.73 49.77 9.32
APC 5.50 × 2.00 Free Flight
(139.7 × 50.8)
1 139.30 52.24 9.78
2 139.21 52.20 9.81
3 139.23 52.21 9.84
Average 139.25 52.22 9.81
Dow
nloa
ded
by S
cott
Tho
mas
on
Janu
ary
15, 2
013
| http
://ar
c.ai
aa.o
rg |
DO
I: 1
0.25
14/6
.201
3-50
0

American Institute of Aeronautics and Astronautics
29
Table 3. Summary of Propeller Measurements, cont.
Manufacturer Nominal D/P
(in × in) (mm × mm)
Propeller Number
D (mm)
R75% (mm)
C75% (mm)
APC 5.50 × 4.50
Speed 400 Electric (139.7 × 114.3)
1 139.30 52.24 9.60
2 139.46 52.30 9.53
3 139.47 52.30 9.55
Average 139.41 52.28 9.56
APC 6.00 × 2.00
Sport (152.4 × 50.8)
1 152.25 57.09 8.69
2 152.19 57.07 9.06
3 152.14 57.05 8.87
Average 152.19 57.07 8.87
APC 6.00 × 4.00 E
Speed 400 Electric (152.4 × 101.6)
1 152.09 57.03 10.35
2 151.74 56.90 10.26
3 151.83 56.94 10.51
Average 151.89 56.96 10.37
APC 8.00 × 3.8 Slow Flyer
(203.2 × 96.5) 1 203.65 76.37 20.79
Graupner 4.00 × 3.00 Cam Speed
(101.6 × 76.2)
1 99.77 37.41 9.60
2 100.06 37.52 9.40
3 99.94 37.48 9.38
Average 99.92 37.47 9.46
Graupner 4.70 × 4.00 Cam Speed
(119.4 × 101.6)
1 119.16 44.69 9.47
2 119.16 44.69 9.49
3 118.96 44.61 9.39
Average 119.09 44.66 9.45
Graupner 4.70 × 4.70 Cam Speed
(119.4 × 119.4)
1 120.22 45.08 8.96
2 120.22 45.08 8.95
3 120.49 45.18 9.01
Average 120.31 45.11 8.97
Graupner 5.50 × 4.30 Cam Speed
(139.7 × 109.2)
1 141.11 52.92 10.58
2 141.08 52.91 10.42
3 141.13 52.92 10.52
Average 141.11 52.92 10.51
Graupner 5.50 × 5.50 Cam Speed
(139.7 × 139.7)
1 139.60 52.35 9.82
2 140.37 52.64 9.97
3 140.17 52.56 9.91
Average 140.05 52.52 9.90
GWS 4.00 × 2.50
(101.6 × 63.5)
1 101.57 38.09 12.39
2 101.57 38.09 12.34
3 101.53 38.07 12.40
Average 101.56 38.08 12.38
Dow
nloa
ded
by S
cott
Tho
mas
on
Janu
ary
15, 2
013
| http
://ar
c.ai
aa.o
rg |
DO
I: 1
0.25
14/6
.201
3-50
0

American Institute of Aeronautics and Astronautics
30
Table 4. Summary of Propeller Measurements, cont.
Manufacturer Nominal D/P
(in × in) (mm × mm)
Propeller Number
D (mm)
R75% (mm)
C75% (mm)
GWS 4.00 × 4.00
(101.6 × 101.6)
1 101.98 38.24 10.38
2 102.00 38.25 10.44
3 101.99 38.25 10.48
Average 101.99 38.25 10.43
GWS 4.50 × 3.00
(114.3 × 76.2)
1 114.32 42.87 11.09
2 114.26 42.85 10.71
3 114.28 42.86 10.77
Average 114.29 42.86 10.86
GWS 5.00 × 3.00
(127.0 × 76.2)
1 127.23 47.71 12.43
2 127.16 47.69 12.36
3 127.16 47.69 12.39
Average 127.18 47.70 12.40
GWS 5.00 × 4.30
(127.0 × 109.2)
1 126.89 47.58 12.69
2 126.83 47.56 12.53
3 127.03 47.64 12.51
Average 126.92 47.59 12.58
Acknowledgments
The authors would like to acknowledge the support of the Air Force Research Laboratory through the Joint
WSU/AFRL Center for Advanced Power and Energy Conversion Research (CAPEC). In particular, the guidance of
Mr. Michael Rottmayer and Dr. Ryan Miller is appreciated.
References 1Brandt, J.B. and Selig, M.S. "Propeller Performance Data at Low Reynolds Number." 49th AIAA Aerospace Sciences
Meeting. 2011. AIAA 2011-1255. 2Selig, M. UIUC Propeller Database. 2012. http://www.ae.illinois.edu/m-selig/props/propDB.html. 3Gamble, D.E. "Automated Dynamic Propeller Testing at Low Reynolds Numbers." M.S. Thesis. Oklahoma State University,
Stillwater, OK, 2009. 4Deters, R.W. and Selig, M.S. "Static Testing of Micro Propellers." 26th AIAA Applied Aerodynamics Conference. 2008.
AIAA 2008-6246. 5Hepperle, M. PropellerScanner Software. 2003. http://www.mh-aerotools.de/. 6Ol, M., Zeune, C., and Logan, M. "Analytical – Experimental Comparison for Small Electric Unmanned Air Vehicle
Propellers." 26th AIAA Applied Aerodynamics Conference. 2008. AIAA 2008-7345. 7Corrigan, E.K. and Altman, A. "Survey of Small Unmanned Aerial Vehicle Electric Propulsion Systems." 46th AIAA
Aerospace Sciences Meeting. 2008. AIAA 2008-179. 8Glauert, H.. The Elements of Aerofoil and Airscrew Theory. Cambridge: Cambridge University Press, 1926. 9Hackett, J.E., Lilley, D.E., and Wilsden, D.J. Estimation of Tunnel Blockage from Wall Pressure Signatures: A Review and
Data Correlation . NASA CR15-2241, 1979. 10Merchant, M.P. and Miller, L.S. "Propeller Performance Measurement for Low Reynolds Number UAV Applications."
44th AIAA Aerospace Sciences Meeting. 2006. AIAA 2006-1127. 11Selig, M., and Ananda, G. Low Reynolds Number Propeller Performance Data: Wind Tunnel Corrections for Motor
Fixture Drag. 2011. http://www.ae.illinois.edu/m-selig/props/uiuc-props-wind-tunnel-correction.pdf. 12NACA. Equations, Tables, and Charts for Compressible Flow, NACA Report 1135. Washington, D.C.: U.S. Government
Printing Office, 1953. 13Brezina, A. "Measurement of Static and Dynamic Performance Characteristics of Electric Propulsion Systems" M.S. Thesis.
Department of Mechanical and Materials Engineering, Wright State University, Dayton, OH, 2012.
Dow
nloa
ded
by S
cott
Tho
mas
on
Janu
ary
15, 2
013
| http
://ar
c.ai
aa.o
rg |
DO
I: 1
0.25
14/6
.201
3-50
0