measurement of soil nutrients under green feed …
TRANSCRIPT
Ferguson, I. J., 2019. Measurement of soil nutrients under green feed crops in an intensive dairy support operation. In: Nutrient loss
mitigations for compliance in agriculture. (Eds L.D. Currie and C.L. Christensen). http://flrc.massey.ac.nz/publications.html. Occasional
Report No. 32, Fertilizer and Lime Research Centre, Massey University, Palmerston North, New Zealand. 11 pages.
1
MEASUREMENT OF SOIL NUTRIENTS UNDER GREEN FEED
CROPS IN AN INTENSIVE DAIRY SUPPORT OPERATION
Ian Ferguson
Viable Agriculture Limited, 208 Havelock Street, PO Box 29,
Ashburton 7740, New Zealand
Abstract
Basic understanding of fundamental nutrient dynamics in crops and soils is prudent in
mitigating risk of nutrient losses. Some of the free draining gravelly soils in Canterbury have
been referred to as “leaky Lismores” in terms of their supposedly poor nutrient holding ability.
Hence there is now a real need for strategic nutrient management in order to optimise crop
yield and mitigate any risk of nutrient losses. This is also closely allied to various perceptions
of the mandatory obligations on growers to conform to the received environmental standards.
Growers are also mindful of the economic imperative to maintain a financially viable farming
business, whilst simultaneously improving yield and showing environmental compliance.
Because the ultimate measure of Nutrient Use Efficiency (NUE) and Water Use Efficiency
(WUE) is yield (as kg/ha of Dry Matter produced per mm of water and kg of nutrient applied)
then to show increased NUE and WUE, yield must go up. As yield approaches the economic
threshold, WUE and NUE will also be approaching optimum, i.e. yield will be nearing full
potential at the point where NUE and WUE is also at, or very near to, the agronomic and
economic optimum.
The perception that increased yield leads to increased nutrient loss and hence reduced water
quality is not a safe assumption. The information gained in this investigation clearly
demonstrates that it is possible to mitigate nutrient losses with good management of irrigation
and fertiliser inputs.
Soil tests from the site investigated show that soil nutrients remaining after the second green
feed crop (kale following beet); as well as the additional barn effluent applied; are retained
within the root zone of the crop after successive drainage events. These nutrients are then
available to be utilised by current and subsequent crops. Actual real time measurement with
capacitance probes and accurate soil testing is able to affirm that appropriate nutrient
management strategies can be successfully employed. This approach also has the added
advantage of giving growers confidence to continue to improve NUE and WUE along with the
yield of the crops they grow, knowing that there is robust technology available to demonstrate
that they can measure NUE and WUE and also provide objective proof of good practice and
environmental stewardship.
2
Introduction
Lismore soil is typified by 60 % stones in the top 300 mm cultivated layer, another 300mm B
horizon of gravels in a silty matrix, and free running sandy shingle below. From S-Maps, plant
available water capacity (PAWC) is 75mm. These soil types have occasionally been referred
to as “leaky” by various industry commentators. Therefore, a good understanding of nutrient
dynamics in a stony Lismore sandy silt loam is prudent in order to objectively mitigate any
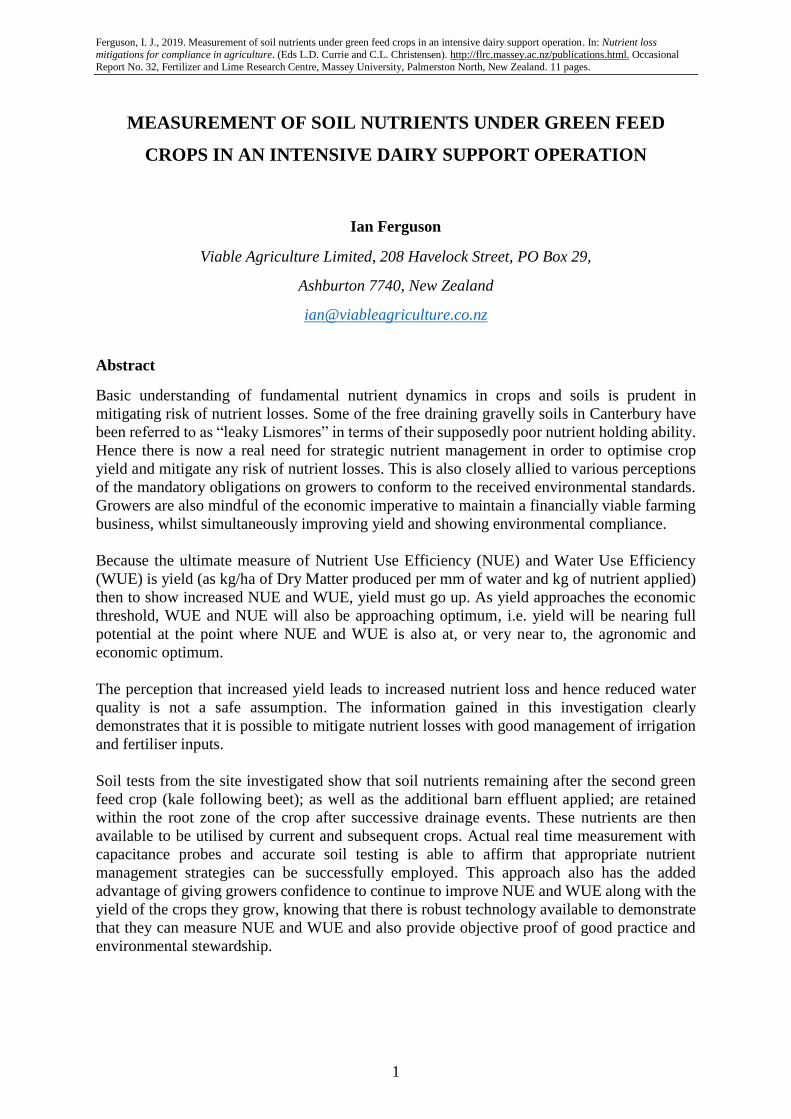
perceived risk of nutrient losses to ground water. Soil texture
is clearly shown in the jar test opposite (Figure 1) with the
sieved and flocculated soil sample typical of the site,
showing approx. 10 % clay (thin pale layer on top)); 45% silt
and 45% sand.
Clay approx. 10%
Silt approx. 45%
Sand approx. 45%
Figure 1: Soil texture jar test.
The need for improved refinement and greater understanding of strategic nutrient management
is also closely allied to various perceptions of the mandatory obligations on growers to conform
to the received environmental standards, and the economic imperative to maintain a financially
viable (and thus sustainable) farming business simultaneously.
With the advent of frequency domain reflectometry soil probes capable of providing real time
data on soil moisture content and nutrient movement, along with the observed presence of
significant root mass at depths well below the cultivated layer, this investigation has been able
to obtain hard data on what is actually visibly happening under the crops and soils in question.
This provides verification of the information generated by the Sentek probe by using soil
testing at different depths down the profile within the soil column that is being measured.
Materials and Methods
Following preliminary investigations of hand dug pits down to 600 mm in the spring of
cropping season 2013-14; a series of deep soil inspection pits was excavated with a hydraulic
digger to enable accurate appraisal of rooting depth of a fodder beet crop at Stonehaven,
property of DW & R Keeley, 1070 Maronan Ealing Road, near Mayfield in Mid Canterbury.
This information was required to inform irrigation and nutrient management decisions for
future crops of winter green feed kale, and also other crops in the rotation, such as ryegrass,
cereals and maize.

3
The fodder beet crop which preceded the kale in this
investigation had well developed visible active, healthy
root mass, down to 700 mm depth at the time of inspection.
This beet crop was also seen to be utilising soil moisture
at this depth as shown by the concurrent readings from the
nearby Sentek probe. This probe remotely measures soil
moisture content and nutrient concentration in the soil
solution and sends this information directly to a smart
phone or other internet connected device. This technology
enables real time remote management of water applied
with irrigation and enables accurate deployment of “deficit
irrigation” techniques to optimise WUE.
Figure 2. Fodder beet rooting depth.
In the following season, the fodder beet site shown above (Figure 2.) was sown to green feed
kale (see Figure 3. below).
Figure 3. Green feed kale.
4
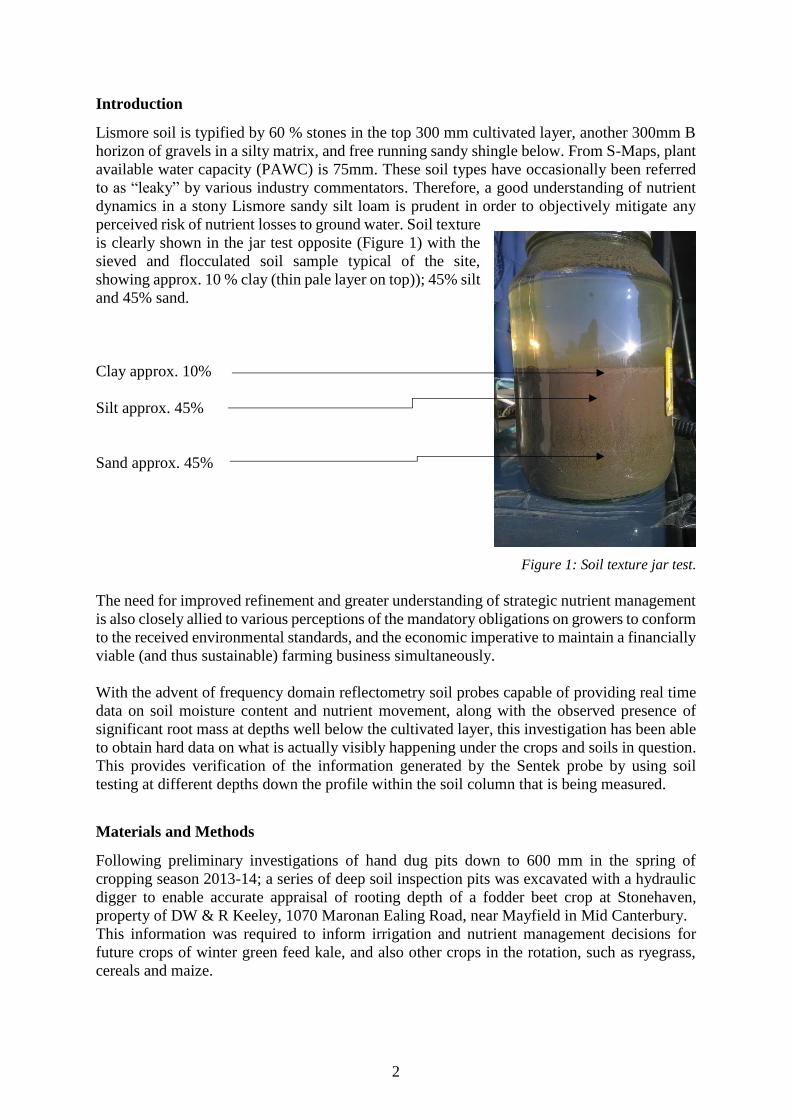
At the completion of the grazing of the kale (Fig 3) in
the spring of 2015, an earth bund of approximately 1
m2 in area was constructed to encompass the probe.
Barn liquor was then loaded into the bunded area
around the probe at the rate of 60 litres/day for 8 days.
The concurrent spikes in VIC and soil moisture
drainage through the profile are clearly visible on the
graphs from the probe at that time. (see Figs. 6,7& 8).
Nitrogen applied as effluent at this time was
equivalent to 2544 kg/ha. No evidence of nutrient
percolation below the root zone was observed from the
probe read out (Figure 7.) or the subsequent soil
testing. Figure 4.Effluent applied to probe 2nd – 10th October 2015
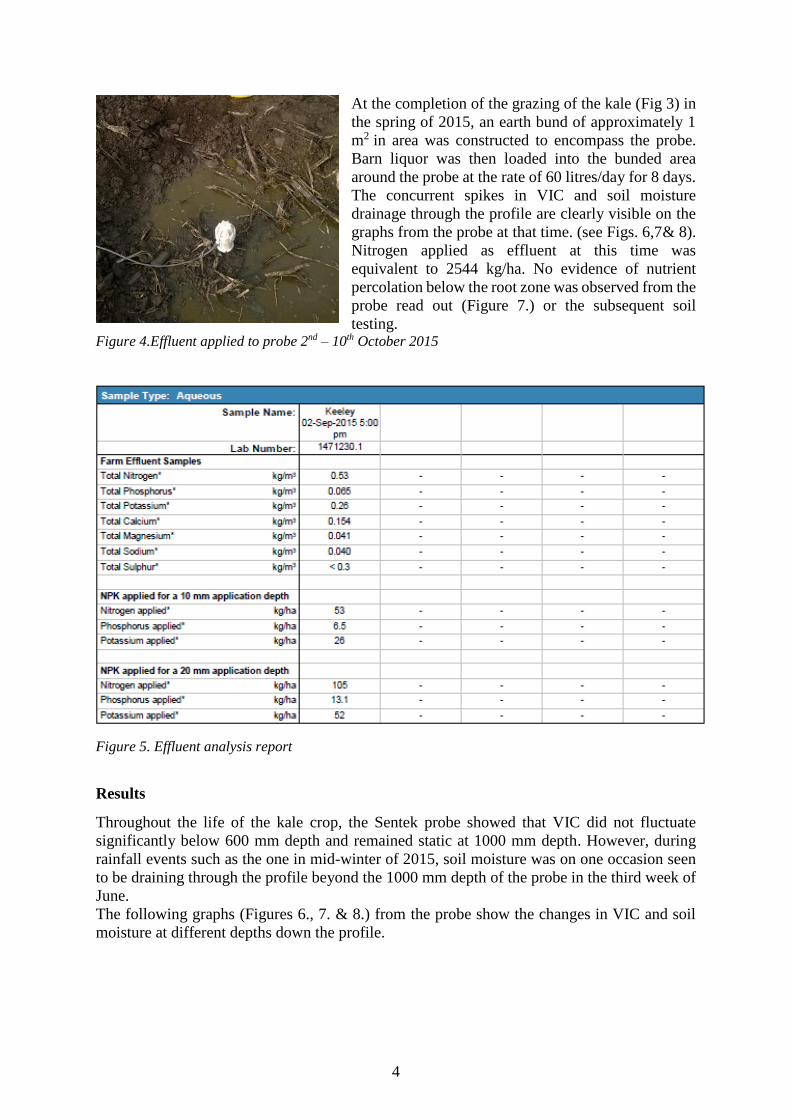
Figure 5. Effluent analysis report
Results
Throughout the life of the kale crop, the Sentek probe showed that VIC did not fluctuate
significantly below 600 mm depth and remained static at 1000 mm depth. However, during
rainfall events such as the one in mid-winter of 2015, soil moisture was on one occasion seen
to be draining through the profile beyond the 1000 mm depth of the probe in the third week of
June.
The following graphs (Figures 6., 7. & 8.) from the probe show the changes in VIC and soil
moisture at different depths down the profile.

5
Figure 6. March to November VIC & SMC combined totals with AWC in green band.
Figure 7. VIC at 3 depths & SMC at 5 depths with daily effluent applications.
Figure 8. VIC depths with SMC at 5 depths March to November 2015.
Soils tests 29/10/15 Drainage

6
Inspection of another deep pit (Figure 9.), again
showed that the Kale crop had roots visible down
to 1700 mm depth in February (canopy climax).
The probe had again recorded very small and
infrequent soil moisture drainage events. Again,
no evidence of nutrient movement below 1000 mm
was recorded by the probe. Concurrent analysis of
soil samples at the 1500 – 1800 mm depth gave
very low levels of all plant nutrients under the
actively growing crop prior to winter grazing.
(Results shown in Figure 10. below).
An additional series of deep inspection pits were
also excavated throughout the wider Mid-
Canterbury area in February of 2015 to enable
comparisons across a range of soil types and sites
under various crops. This included process
potatoes, process carrots, forage maize, grazed
ryegrass aftermath at Stonehaven, and also the
green feed Kale discussed in this report.
Figure 9. Gravelly sandy subsoil showing deeper root
systems of kale.
Figure 10. Deep pit soil test results from this kale paddock in February 2015.

7
Figures 10. and 11. were both tested under the same weather conditions at the same time. This
demonstrates that nutrients at depth are also low under different crops and management.
Figure 11. (below) was from ryegrass located immediately adjacent to the green feed kale.
Soil analysis from the lower levels immediately below the root zones of this crop also gave
very low levels of plant nutrients on the Lismore soils as shown below in Figures 11. and 12.
Figure 11. Deep pit soil test results from a ryegrass paddock in February 2015.

8
Figure 12. Deep pit soil test results from a maize crop on Wakanui silt loam in February 2015
In contrast to Figures 10. & 11. (Lismores), the Wakanui soil (Figure 12.) shows higher nutrient
levels. This soil is very deep and highly compacted silt. There was no visible root activity in
the zone that this sample was collected from. This soil is formed from windblown silt that was
deposited during an inter-glacial period, and so may have given rise to naturally higher nutrient
levels derived from limestone parent materials and/or estuarine sediments.
Given that the above soil testing information was indicating that there
is likely to be large differences in deep soil nutrients between sites and
soils, verification of the probe information was required as a means of
“ground truthing” Hence the probe at this site. was excavated and
removed from the kale in late October prior to spring cultivation
operations some 4 weeks after the effluent drainage had ceased to
register.
At this time another set of soil samples were then taken from three
separate horizons down the profile (Figure 15a, 15b, & 15c.) within
the column of soil visible to the probe, along with a normal
representative whole paddock test across the entire paddock where the
grazing of the kale had been completed. (Figure 14.)
Figure 13. View of sampling site during removal of the probe.

9
Figure 14. Soil test results from the whole paddock sample after grazing was completed.
Figure 15a. Soil test results cultivated layer within bund under effluent after cessation of drainage.

10
Figure 15b. Soil test results mid probe after effluent drainage.
Figure 15c. Soil test results below probe after cessation of effluent drainage.
11
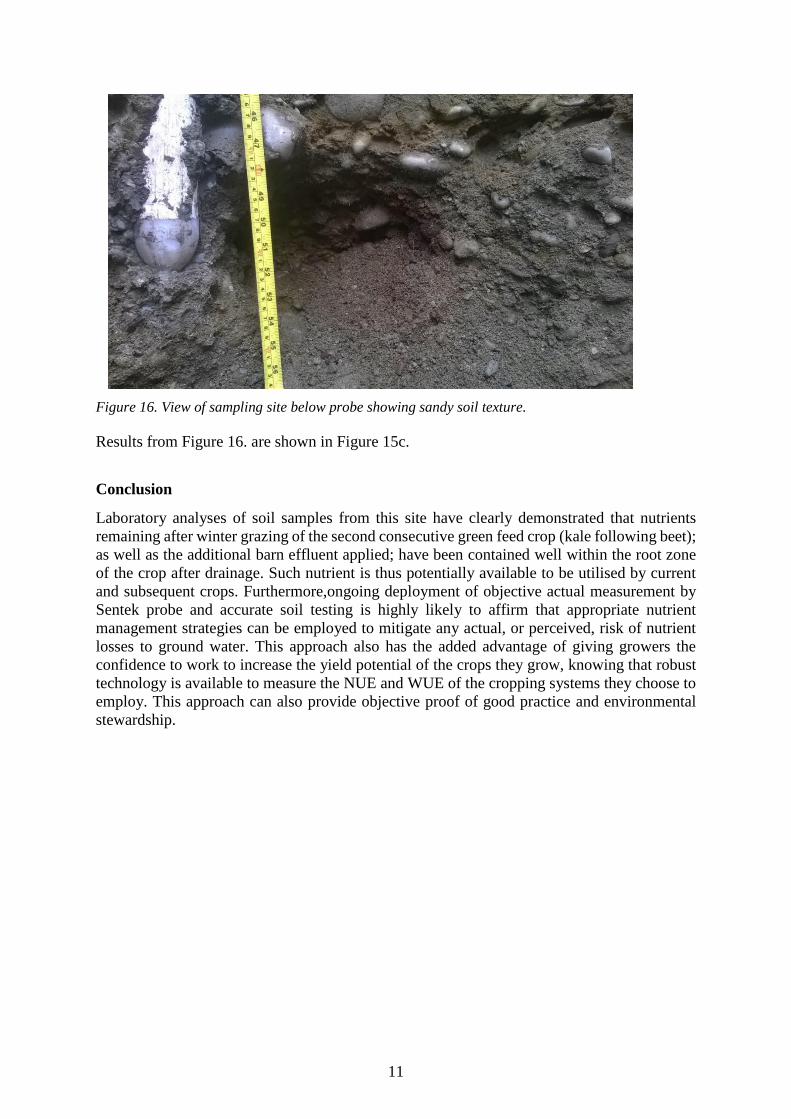
Figure 16. View of sampling site below probe showing sandy soil texture.
Results from Figure 16. are shown in Figure 15c.
Conclusion
Laboratory analyses of soil samples from this site have clearly demonstrated that nutrients
remaining after winter grazing of the second consecutive green feed crop (kale following beet);
as well as the additional barn effluent applied; have been contained well within the root zone
of the crop after drainage. Such nutrient is thus potentially available to be utilised by current
and subsequent crops. Furthermore,ongoing deployment of objective actual measurement by
Sentek probe and accurate soil testing is highly likely to affirm that appropriate nutrient
management strategies can be employed to mitigate any actual, or perceived, risk of nutrient
losses to ground water. This approach also has the added advantage of giving growers the
confidence to work to increase the yield potential of the crops they grow, knowing that robust
technology is available to measure the NUE and WUE of the cropping systems they choose to
employ. This approach can also provide objective proof of good practice and environmental
stewardship.