measurement of rubber elasticity at low · pdf filetaken to evaluate a new idea for the...
TRANSCRIPT

M
o c c s
£} ^
TECHNICAL REPORT 66-4-CM
MEASUREMENT OF RUBBER ELASTICITY
AT LOW TEMPERATURES
USING A TWIST RECOVERY APPARATUS
CLEARINGHOUSE FOR FEDiCUAL SCIENTIFIC AND
TECHNICAL INFORMATION _ Hardcopy I Kicrofiehej
$ 2.0& s Ö'-STÜ H-0»>OJ_
I W.//E ®$B>i üui'o::'uJv.'li Uv>ü
C^C^I
UNITED SIAUS ARMY N A TICK LABORATORIES
Natick Massachusetts 01760
by Angus Wilson
January 1966
i A N M y
I Clothing and Organic
Materials Division aOM-14
T '
DISTRIBUTION OF THIS DOCUMENT IS UNLIMITED.
The findings in this report are not to be construed as an official Department of the Army position unless so desig- nated by other authorized documents.
Citation of trade names in this report does not constitute an official indorsement or approval of the use of such items.
Destroy this report when no longer needed. Do not return it to the originator.

Distribution of this document is unlimited
AD
TECHNICAL REPORT 66-4-CM
MEASUREMENT OF RUBBER ELASTICITY AT LOW TEMPERATURES USING A TWIST
RECOVERY APPARATUS
by
Angus Wilson Rubber, Plastics and Leather Engineering Branch
Project Reference: Independent Research Project 24 Series: C&OM-14
January 19bo
Clothing and Organic Materials Division U.S. ARMY NATICK LABORATORIES Natick, Massachusetts 01760

I,
FOREWORD
\ I This is a report of work done under U. S. Army Natick Laboratories
In-House Laboratory Independent Project No. 24 for FY 1965. It was under- jL taken to evaluate a new idea for the low-temperature testing of rubber. I The report describes the development of equipment and procedures for measuring the elastic regain of elastomers under low deformation when warmed after freezing.
It is believed that the techniques described in this report will prove useful in the continuing Army program of evaluating new rubbery materials and will add to the fund of information on their low-temperature performance. In addition, the procedures can be successfully adapted for specification tests to be used in the procurement of rubber items and components.
The effort to date has been concerned with basic methods and equip- ment. The extent of the information obtainable, and its possible relation- ship to stress-strain data obtained by other means, has not been fully evaluated and may form the basis of future investigations. Work on this project ceased on attainment of the original objective at the end of FY 1965.
S. J. KENNEDY Director Clothing & Organic Materials Division
APPROVED:
DALE H# SIELING, PhD Scientific Director
W. W. VAUGHAN Brigadier General, USA Commanding
in

CONTENTS
List of Tables
List of Figures
Abstract
I. Introduction
II. Limitations of Current Low-Temperature Tests
III. Approach to the Development of a New Test
IV. Test Equipment
A. Air Bath B. Visual Twist Recovery Apparatus C. Automated Twist Recovery Apparatus
V. Materials
VI. Test Procedures
Visual Method
A. For measuring twist recovery versus temperature B. For measuring twist recovery and twist set versus time
Automated Method
A. For measuring twist recovery versus temperature B. For measuring twist recovery and twist set versus time
VII. Discussion of Results
VIII. Application of the Twist Recovery Test to a Specific Problem
IX. Conclusions
X. Recommendations
XI. Acknowledgment
XII. References
Appendixes
A. References Pertaining to Rubber and Xinetic Elasticity B. Compounding Recipes of Rubbers Other Than Ethylene/
Propylene/Diene Rubbers C. Compounding Recipes of Bthylene/Propylene/Diene Rubbers D. Physical Properties of Test Compounds
v
v
vi
1
2
5
6
6 9 10
11
11
11
11 12
13
13 14
14
22
24
24
24
25
30 31 32
iv

* !1
i
LIST OF TABLES Page
I« Temperatures for Various Relative Torsional Moduli (Torsional Stiffness Test)
II. Temperatures for Various Percentages of Retraction (TemperaLure Retraction Test)
III. Temperatures at Various Degrees of Recovery from 360° Twist (Twist Recovery Test)
IV. Comparison Between Results Obtained with the Visual and Automated Twist Recovery Apparatus
V. Comparison of Twist Set at Room Temperature with the Temperature Difference in °C Between T5 and R67.5
17
18
23
LIST OF FIGURES
1. Visual Apparatus, Model 2
2. Visual Apparatus, Model 3, Disassembled
3. Visual Apparatus, M^del 3, Assembled
&. Air Bath and Cover
5. Automated Tracking Assembly
6. Automated Tracking Device, Air Bath and Recorder
7. Angular Recovery versus Temperature
8. Comparison of Trace from Machine with Plot of Visual Data
9. Angular Recovery versus Time at Various Temperatures, Using Automated Equipment
10. Plots of Twist Recovery R67.5 Temperatures versus Retraction TR50 and Torsional Stiffness T5 Temperatures
7
7
7
8
8
8
15
16
20
21

m
ABSTRACT ^
Kinetic elasticity is an important and definitive property of rubber, t
yet it is difficult to measure at room temperature and even more difficult * to measure at lower-than-room temperatures. Many current low-temperature test methods provide useful information about various properties of rubber but give little information about its elastic behavior or else measure elasticity under deformations greater than those likely to be found in service.
The apparatus and methods described in this report provide a new means of observing and measuring the low-temperature behavior of rubber. Since, in actual use, rubber is very often deformed only slightly, the new method subjects the test specimen to a twist deformation of 360°, resulting in an elongation of approximately 5 percent along its side. The •• apparatus permits twist recovery and percentage of set to be measured at specific constant temperatures and also to be correlated with rising ^K temperatures.
The results show that, with the exception of a series of ethylene/ propylene/diene (EPD) rubber compounds, both the elasticity and the flexibility of rubbers are regained within the same range of low tempera- j tures. The stress-strain behavior of EPD rubbers, which differs from that j of other types of rubber, is briefly discussed.
These techniques can be used not only to examine the basic behavior of rubbery materials, but also in the routine inspection of rubber items and components. u
k
vi

MEASUREMENT OF RUBBER ELASTICITY AT LOW TEMPERATURES USING A TWIST RECOVERY APPARATUS
I. Introduction
Rubber is regarded as a special type of material because it possesses a unique type of elasticity. This particular kind of elasticity, variously referred to as rubber, as Mackian, or more commonly as kinetic elasticity, is rubber's most distinguishing characteristic and a main reason for its multiplicity of uses*.
Many evaluations of rubber, in spite of their plethora of data, provide little real information about the nature of the material. Much of this lack, fortunately for the investigators, can be blamed on the complex structure of rubber. The mechanisms by which sulfur vulcanizes or carbon black reinforces rubber, for instance, are still not understood. The picture of exactly what happens when a piece of rubber breaks is clouded and perhaps will not clear until someone discovers a way of actually observing the rubber network in action as it fails. Rubber's distinguish- ing property, kinetic elasticity, can be extremely elusive when one attempts to characterize it. Kinetic elasticity extends over a wide range of values. It is time- and temperature-dependent and is affected by crystallization factors. It is influenced by the previous history of the rubber and the variables in its preparation. Nevertheless, in most cases, a rubber compound's kinetic elasticity is the key to its usefulness. Though we may skirt the i^sue, and in the process gain additional informa- tion by obtaining data on such properties as hardness and tensile strength, we must, in the end, deal with kinetic elasticity.
The differences between types of elasticity are definitive and there- fore important. The measurement of kinetic elasticity is likewise important. Since rubber is used over a wide temperature range, test methods must adequately evaluate its elasticity over such a range. At the lower end of the temperature scale, the elasticity of rubber gradually diminishes until, when the temperature is low enough, it disappears alto- gether. The temperatures at which losses occur and the extent of loss depends mainly on the type of rubber and, to a lesser degree, on its compounding.
Difficult as meaningful measurements may be at room temperature, they are even more of a problem at low temperatures. In some rubbers, the changes in elastic behavior, caused by a decrease in molecular motion as temperatures fall, are complicated by crystallization. The extent and rate of the formation of crystallite structures depend not only on the temperature and the length of exposure but also on the extent of deformation imposed on the rubber. Neoprene and natural rubber crystallize when stretched at room temperature and also when held at low temperatures over a
* A more detailed discussion of kinetic elasticity is given in Appendix A.
f

period of time without stretching. If a vulcanizate of either of these lubbers is stretched a large amount--to half of its ultimate elongation, for example-- and then cooled, rapid crystallization occurs. As the temperature is raised, the tendency of the rubber to retract will be restrained by the crystalline structure. The sample must continue to be warmed until the crystals "melt11 before recovery will take place. The Torsional Stiffness Test^1** and the Temperature Retraction Test*2) show this difference in behavior for the natural rubber compound, 10N1. From the first test, the rubber, after having been frozen in an unstretched »täte, is found to have a relative torsional modulus of 5 (T5) or, roughly, can be said to regain flexibility at -50.5°C. On the other hand, the second test shows that this rubber, after having been frozen under 250 percent elongation, must be warmed to -2.5°C before 50 percent retracMcn (TR50) will take place (Tables I and II). This example is extreme perhaps, but it illustrates the differences that can occur during testing and also the point that each of these tests gives a unique type of information.
The purpose of this work was to develop a new low-temperature test *:hat would be simple and easy to carry out and yet be accurate and reproducible, and to design the necessary equipment for the test. It cid not propose to replace current test methods, which in many cases provide useful information; rather it proposed to supplement them by providing information on rubbery behavior under different test condi- tions. In short, it has attempted to provide a new means of looking at a highly complex class of materials.
This report describes the development of equipment and techniques that will meet this objective, and describes the type of data that may thus be obtained.
II. Limitations of Current Low-Temperature Tests
Test methods exist, of course, for the evaluation of rubber at low temperatures. These tests may be used solely to study the properties of material* insofar as they behave as rubbers, or they may be used to determine the usefulness of rubber in a particular application. They provide needed information but have limits to their usefulness, as do all test methods, and perhaps it would be advisable here to consider the limitations of some of these tests. Some measure properties other than elasticity; for example, hardness, flexibility, or brittleness. Others give values related to a specific temperature but do not show values over a varying range of temperatures. Some methods subject the test specimen to deformations greater than are likely to be encountered in use, (While rubber is capable of withstanding large deformations, in
* References indicated by parenthetical numbers are located on page 25,

#
• I
TABLE I
Temperatures for Various Relative Torsional Moduli (Torsional Stiffness Test)
Com- pound Type of Rubber T* 100
Temperature, °C T10 T5
10NB1 Nitrile/butadiene -16
10NB2 H ti
10NB3 " "
10IIB4 " "
10N1 Natural
10SB1 Styrene/butadiene
10SB2 " "
10II1 Butyl
10C1 Chloroprene
10T1 Polysulfide
10FPM1 Fluorocarbon
lOSil Dimethyl siloxane
1CU2 Methyl-vinyl siloxane
10Si3 Methyl-phenyl siloxane
244WM Elhylene/propylene/diene -54.5
244CM " " '■
245WM '• n " "
245CM " »' ,!
EPT92 *• •■ "
11 -10 -6.5
-31 -25 -23.5 -17.5
-31 -31.5 -29.5 -24
-42 -32 -29.5 -24
-59 -53.5 -50.5 -38.5
-47.5 -42 -37.5 -17.5
-61.5 -55 -47.5 -23
-59 -41.5 -36 -20
-36 -30.5 -26.5 -11.5
-52 -44.5 -39 -20.5
-23 -16.5 -14.5 -10
-47 -42.5 -41.5 -40
-60 -44 -42.5 -40.5
Below -70 Below -70 Below -70 Below -
-54.5 -49.5 -47 -32
-53.5 -48 -41.5 -15
-53.5 -49.5 -45.5 -27
-55 -47 -37 -9.5
-55.5 -49 -46.5 -32
*"Tn, with its subscript, indicates the temperature at which the compound had a relative torsional modulus of the amount shown by the subscript. For example, a T^QO of -16°C means that at -16°C the compound's torsional modulus was 100 times that at room temperature.

TABI£ II
Temperatures for Various Percentages of Retraction (Temperature Retraction Test)
Com- pound
Type of Rubber
Initial Elong. TR*10
Temperatures, °C TR 30 TR 50 TR 70
10NB1 Nitrile/butadiene 250 -14 -11 -8.5 -6.5
10NB2 it it 250 -29.5 -25 -22 -19
10NB3 ii ii 250 -33.5 -29 -26 -23.5
10NB4 n ii 250 -39 -33.5 -29.5 -25.5
10N1 Natural 250 -52.5 -14 -2.5 +0.5
10SB1 S tyrene/bu tad iene 250 -43.5 -40 -36 -29.5
10SB2 ii II 250 -59.5 -54.5 -49.5 -42
10II1 Butyl 250 -54.5 -43 -35 -27
10C1 Chloroprene 200 -30.5 -19.5 -6 +3.5
10T1 Polysulfide 200 -48.5 -37.5 -29 -22.5
10FPM1 F luorcrcarbon 125 -20.5 -16 -13 -8.5
lOSil Dimethy1-s iloxane 200 -46.5 -36 -31.5 -28
10Si2
lOSi3
Methyl-vinyl siloxane
Methyl-phenyl siloxane
100
100
-50 -42.5
T» _ 1
-40.5
-70°
-38.5
De low
244WM Ethylene/propylene/diene 250 -46 -40.5 -37 -31.5
244CM II ti it 250 -45.5 -39 -33.5 -26
245WM n ii ti 250 -45 -36 -28.5 -19
245CM M it it 250 -44.5 -35 -26.5 -16.5
EPT92 M 11 II 250 -46.5 -41 -36.5 -31.5
*"TRn indicates the temperature at which the percentage of retraction denoted by the numbers occurred. Thus under the TR 10 column are given the tempera- tures for 10% retraction.
actual service it is deformed only sligntly -- often less than 50%). Limitations of four low-temperature tests commonly used in the study of rubber are given below.
The Torsional Stiffn ss Test^*>^ does not measure elasticity; it measures either flexibil .j or stiffness, depending on one's point of view, and it may be use fo ; non-elastic materials. The procedure requires considerable h manipulation and is subject to possible errors from binding of the "samf lamps.
The Temperatur^ Retraction Test*2>3) is fine if the intended use for the rubber involves static conditions of large deformation at low temperature. However, under other conditions such as the 5 or 10 per- cent of strain (and certainly less than 50%) that is usually encountered in actual service, the results can be misleading. In addition, this test has the disadvantage of not deforming all the samples to the same extent; the extension depends in part upon the ultimate elongation of the rutJber compound.
Compression Set Measurements^) are limited because they are made at one specific temperature. They can provide information over a tempera- ture range only by the cumbersome procedure of repeating the test over a progression of temperatures.
The Brictleness Test^\ which has been used for a number of years, gives no information about elastic behavior, not even an indication of it. The test does give a temperature point near the second order or glass transition point (glass being an accurate term because the rubber in this state is vitreous and highly inelastic).
Ill, Approach to the Development of a New Test
The limitations of the current methods prompted the development at the U. S. Army Hatick Laboratories of a test that would be dependent on elastic recovery and would require only slight deformations (5 to 10%). Deforming the rubber by elongating or stretching it small linear amounts (10% for example) was rejected because it required large specimens in order to easily measure small changes or degrees of recovery. Bending a specimen in a U»shape and measuring small angles of recovery was also rejected because of the difficulties in making accurate angular measure- ments due to curvature factors. With these two possibilities excluded, twisting the specimen was considered. This approach was found to have definite advantages.
A 180-degree twist (used in the Torsional Stiffness Test*1*) imposes only slight deformation on the specimen. In addition, the test specimen used is small with a total length of 1-1/2 inches, and it can be cut from a 0.075-inch thick tensile test sheet with a die. One revolution, or 360° of twist, of this type of specimen results in a small strain. The side edge, for example, would be elongated approximately 5 percent.

*3i
Even though this is only a small strain, it would permit small amounts of recovery to be easily discerned. Readings taken during the first 180 degrees of recovery from such a twist would yield information on an approximately 2.5 percent decrease in elongation.
To check the feasibility of this approach, a metal rack was made in which a specimen that had been twisted 360° was held by a stationary clamp at the bottom and by a retractable clamp at the top. The rack was placed in a methanol dry-ice bath at -70°C for 10 minutes and the upper clamp retracted. The temperature of the bath was raised 1°C per minute by means of an electric immersion heater. As the bath warmed, the specimen began to untwist and the temperatures at which its free end rotated 90° and 180° were noted. Measurements of angular recovery were made with a small protractor suspended from the upper clamp and a pointer clipped to the upper end of the specimen.
The device, though crude, functioned well enough to prove the feasi- bility of the idea. Recovery, once started, was smooth and continuous and the results obtained were reproducible. A second version was then made (Figure 1 — Visual Apparatus, Model 2) on which a detachable pro- tractor, marked at four different points of recovery, 45, 67.5, 90 and 180 degrees, was placed below the upper clamp. A third and final version (Figures 2 and 3 — Visual Apparatus, Model 3) was subsequently made. It differed from the second model essentially in its protractor, which was larger and marked at 10-degree intervals over a 180-degree range, with sub-markings at 5 degrees. The clip-on pointer was replaced with an inserted pointer made from a common pin. The methanol dry-ice bath was replaced with an air bath (Figure 4), which used liquid nitrogen for cooling and dry room-temperature air for warming. The results listed in Table III (see page 17) were all obtained with the third version of the apparatus and with the air bath.
While these models were being made in-house, an automated model (Figures 5 and 6) designed to fit the same air bath used for the visual apparatus was constructed under contract by the Pias-Tech Equipment Corporation, Natick, Mass. This piece of equipment was capable of auto- matically tracking the movement of the warming rubber sample and making a continuous plot of recovery-versus-temperature on an X-Y recorder.
The air bath and both pieces of equipment are described in the next section.
IV. Test Equipment
A. Air Bath - An air bath (Figure 4) with a circular chamber 5-3/4 inches in diameter and 5-1/2 inches deep cools the test specimens and controls their temperatures during the test. At the center of the 1/8- inch thick phenolic bottom of the chamber is a 7/16-inch I.D. tube through which passes the shaft of a 3-1/2-inch air-mixing fan. The tube protrudes 3/8-inch into the chamber and serves as a center guide for a 1/8-inch
6

II
Figure 1. Visual Apparatus, Model 2
Figure 2. Visual Apparatus, Model 3, Disassembled
Figure 3. Visual Apparatus, Model 3, Assembled
i
x
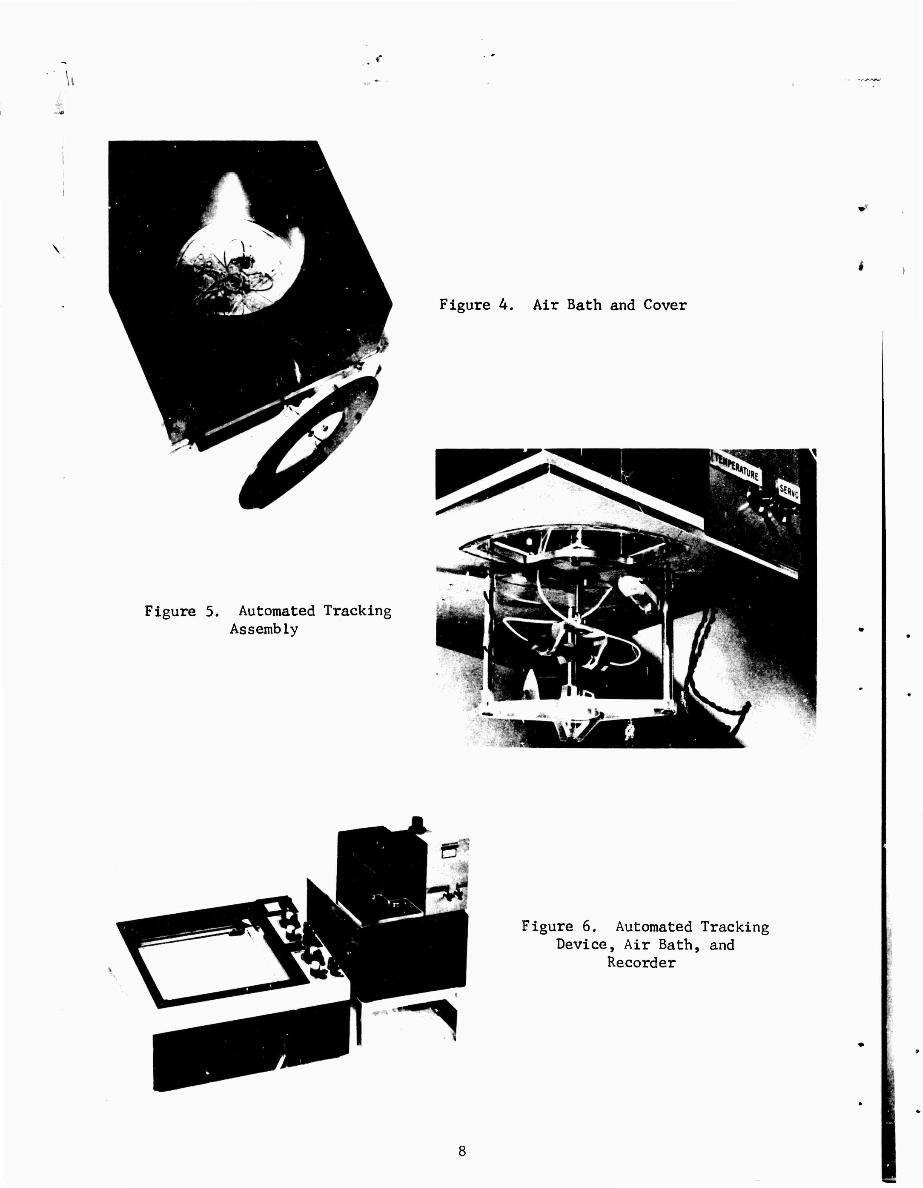
Figure 5. Automated Tracking Assembly
Figure 4. Air Bath and Cover
Figure 6. Automated Tracking Device, Air Bath, and
Recorder
-
thick, 5-1/4-inch diameter plexiglass baffle plate, which prevents the liquid nitrogen and room-temperature air (introduced through tubes in the bottom) from blowing directly into the chamber and on the specimen. Supports on the underside of the baffle plate provide a 1/4-inch space between the chamber bottom and the plate.
The 3/16-inch I.D. nitrogen and air inlet tubes are spaced 1 inch from the chamber center and are flush with the chamber bottom. The nitro- gen inlet tube is positioned in the lower left quadrant of the chamber bottom, as the operator faces it, and the air inlet tube is in the opposite (upper right) quadrant. The mixing fan is operated by means of either an electric or an air motor located beneath the chamber proper. To cool the sample, small amounts of liquid nitrogen are blown into the test chamber from a Dewar flask reservoir equipped with a sealed cork top. In this flask are a tube tc an air line, an outlet tube to the test chamber, and a removable stopper for filling. The specimen is warmed by introducing room temperature air which has been dried by passing it through anhydrous calcium sulfate.
B. Visual Twist Recovery Apparatus - This device (Figures 2 and 3) was made at NLABS from plexiglass. The vertical main back member is 2-3/16 inches high, 1/4-inch thick, and 7/8-inch wide. Attached to the back member at the bottom is a transverse stationary clamp, slotted to receive and hold the lower tab of the test specimen, the inner edge of the slot extending to within 5/16-inch of the back member.
Above the clamp is a detachable 180° protractor, mounted so that when in place its center hole surrounds the specimen. The radius of the protractor is 21/32-inch and its top surface is 15/16-inch above the top surface of the bottom clamp. The protractor is marked in 10-degree segments and also in smaller divisions at 5-degree intervals. The segments are of different colors, since space limitations prevent the placement of easily read numbers.
A movable upper clamp holder fits into a 3/8 inch wide slot cut into the top of the vertical back member above the protractor. The upper clamp itself is a 1/4 inch diameter rod that is slotted to fit loosely over the upper tab of the specimen. The clamp is friction-fitted into the holder and is equipped with a flat flange to permit a turning adjust- ment. The top of the clamp holder contains a metal eye that can be engaged with a hook in the cover of the air bath. Either a 1-inch or 7/16-inch pointer (made from a common pin) is inserted through the upper tab of the specimen.
An air bath cover (Figure 4) is used with this piece of apparatus. It is made from a ring of 1/8-inch phenolic, 8 inches in outside diameter and 4 inches in inside diameter, fastened by machine screws and counter- sunk nuts to a 1/4 inch thick and 5-5/8 inch diameter plexiglass disk. To this disk, a ring of plexiglass of the same thickness and 5-5/8 inches

in outside diameter and 4-1/8 inches in inside diameter is cemented. To this another 1/4-inch plexiglass disk 5-5/8 inches in diameter is in turn cemented, This construction gives a cover with a 4-inch diameter trans- parent section and a 1/4-inch thick area of insulating dead air. Spaced evenly around the center and at a 2-7/16-inch radius are six 1/8-inch holes for the escape of nitrogen and air.
Two turnable arms that are cut to fit and hold the projecting wings at the top of the vertical back member of the visual apparatus are suspended from the cover. A stainless steel hook is positionsJ between the arms. This hook engages with the metal eye on the upper cUrap holder. A 5/32-inch hole, drilled through the cover 3/4 inch behind the hook shaft, accommodates a glass tube extending 1 inch into the chamber. A copper-constantan thermocouple lead passes through this tube. Its juncture and approximately 3/4 inch of the lead extending beyond the end of the glass tube are loosely enclosed in a rubber jacket shield 1/8 inch in diameter fastened to the glass tube. Holes in the jacket permit air circulation. The thermocouple connects to an indicating potentiometer that reads in centigrade degrees.
A slotted overlay on a data sheet aids in recording movement of the pointer across the face of the protractor (measuring the elastic regain of the rubber). The edges of the slots are divided into colored segments corresponding to those on the protractor. As the test proceeds, the results are entered opposite the appropriate colors.
■
C. Automated Twist Recovery Apparatus - This device (Figure 5) was built under contract by the Plas-Tech Equipment Corporation, Natick, Massachusetts. It substitutes electronic for visual tracking. Specimen size is the same as for the visual method. However an aluminum wand, fastened to the upper tab of the specimen with pressure-sensitive adhesive tape, replaces the pointer of the visual method. The wand is 0.004 inch thick and weighs approximately 0.07 gram. When the specimen is mounted in its clamps, the wand protrudes through the space between two sensing heads (made by the Bently Nevada Corporation) connected to a servo system and a variable potentiometer. These heads, positioned approximately 1/8- inch apart, pick up the movement of the wand toward either one», of the heads and, by means of the servo, turn the bracket holding them so that they remain centered on the wand. At the same time a signal indicating their position and thus the position of the wand and uppf;r tab of the specimen is sent by means of the potentiometer to the vertical axis of an X-Y-recorder. The potentiometer has a dead area of approximately 45 angular degrees. Thus, the bracket of the sensing heads must be positioned properly on its shaft prior to test to insure continuous tracking in the angular segment desired.
The clamp for holding the upper tab of the specimen is fastened to a rod extending through the top of the apparatus.. By raising the rod and turning it, the upper clamp can be removed from the upper tab and turned to the side of the chamber so as not to interfere with the movement of the sensing heads.
10
i I

The lower specimen clamp and support that were furnished with the equipment were replaced by ones designed and made in-house. The NLABS support, made of 1/4 inch thick plexiglass, is Y-shaped and fastened to three rods extending down from the apparatus. In the center of the support is a 1/2-inch hole. The clamp consists of an axle that friction- fits the 1/2-inch hole, a disk (1-1/4-inch in diameter and 1/8-inch thick) cemented to the top of the axle, and the clamp proper cemented to the center of the disk. Clamping is essentially the same as on the visual apparatus except that loading is from the top rather than the side. Two marks placed on the disk 180° apart, and one mark placed on the clamp support, enable the operator to rotate the specimen clamp in known increments of 180°.
The electronic circuitry, servo mechanism, and components are housed above, and cover most of, the main platform. A window, covered with plexiglass, placed in the open part of the platform gives the operator a view of the inside of the air bath during testing.
Temperature is measured with a resistance temperature detector and is recorded on the horizontal axis of the X-Y recorder (Houston Instrument Corporation Model HR-96). The vertical axis is calibrated for 0.001, 0.01, 0.1, 1, and 10 volts per inch; the horizontal axis has the same settings and can also be used for cime sweeps of 0.05, 0.1, 0.2, 0.5, 1, and 2 inches per second. Both vertical and horizontal selectors are equipped with verniers to provide ranges within the given settings- The recorder is equipped to provide two-minute-interval time pips on the recorded plot.
Figure 6 shows the air bath, automated equipment, and recorder assembled.
V. Materials
After the development of the visual apparatus and air bath, fourteen stocks of ten different types of rubber were prepared. The recipes used are given in Appendixes B and C and the physical properties obtained on the compounds are given in Appendix D.
Test specimens for the new Twist Recovery Test, the Torsional Stiff- ness Test^1', and the Temperature Retraction Test^2' were die-cut from 6 x 6 x 0.075 (+ 0.005) inch sheets of the various rubbers. The test specimens used for twist recovery procedures were the same in length and width dimensions as those used in the Torsional Stiffness Test.
VI. Test Procedures
Visual Method
A. For measuring twist recovery versus temperature:
11
!i

. <•
1. Insert pointer through upper tab of specimen.
2. Fasten specimen into lower clamp of the Visual Twist Recovery apparatus with the pointer parallel with the ri^ht base line of the protractor (as the operator faces the apparatus).
3. Twist specimen 360 degrees counterclockwise and fasten into upper clamp.
4. Put protractor in place.
5. Adjust pointer, by turning upper clamp, until zeroed above base line.
Positioning in air bath
6. Fasten apparatus to air bath cover, wings held against bottom of cover by its movable plexiglass arms, and engage hook in cover with metal eye in apparatus.
7. Place cover on air bath.
Test procedure
8. Scart air stirrer and introduce liquid nitrogen through tube at bottom of bath until temperature reaches -70°C.
9. Maintain temperature at -70°C for 10 minutes.
10. Retract the upper clamp by pulling up the hook in the cover.
11. Raise the temperature 1°C per minute by introducing dry room- temperature air (and liquid nitrogen) as needed.
12. As the specimen warms and begins to untwist, observe the temperatures at which the pointer reaches the various markings on the pro- tractor through its full 180 degrees.
13. Using the slotted colored overlay record the results on a data sheet.
14. Plot the degrees of angular recovery against temperature and from the plot determine the temperature at which the various angles of recovery desired occurred.
B. For measuring twist recovery and twist set versus time;
In order to determine percentage of twist recovery and twist set versus time, the procedure is changed by 1) using either a 1- or 7/16- inch pointer aligned to the right base line of the protractor for
12

recoveries between 0 and 180 degrees, or using a 7/16-inch pointer aligned to the left base line of the protractor for recoveries of between 180 and 360 degrees: 2) conditioning the specimen at a specific constant tempera- ture for a desired period of time and 3) as the specimen untwists, observing the degree of angular recovery and recording it after selected time intervals. The percentages of recovery and set are calculated according to the formulas:
percent recovery = P_ angular recovery x 100 Q) 360
percent set = 360-Q angular recovery x loo (2) 360
Automated Method
A. For measuring twist recovery versus temperature:
Preparatory steps
1. Attach the smaller end of the aluminum wand to the upper tab of the specimen by means of pressure-sensitive adhesive.
2. Fasten specimen into lower ci<mip of the Automated Twist Recovery Apparatus, aligning the marks on the leuap disk and clamp support.
3. Turn on the sensing heads, servo system, temperature detecter, and recorder. Zero the recorder pen on the upper horizontal axis of the graph paper. (To calibrate, slowly turn the lower clamp 180 degrees and note the downward displacement of the pen as it follows the movement of the rotating wand, then return to original position.)
4. Fasten specimen into upper clamp.
5. Rotate the bottom clamp 360 degrees clockwise.
Positioning in air bath
6. Place apparatus on top of the air bath.
Test procedure
7. Start air stirrer, introduce liquid nitrogen until tempera- ture reaches -70°C.
8. Maintain temperature at -70°C for 10 minutes.
9. Retract the upper clamp and turn it to the side of the air bath.
13

tl
10. Raise the temperature 1°C per minute by introducing dry room- •' [4 temperature air (and liquid nitrogen) as needed.
11. When specimen has untwisted 180 degrees» stop test. v*
12. Read from plotted graph the temperatures at which various angles of recovery occurred.
B. For measuring, twist recovery and twist set versus time;
The same instrument may be used for determining the percentage of twist recovery and twist set versus time. The procedures are modified as follows: 1) before attaching the specimen, position the bracket of the sensing head on its shaft to provide continuous tracking in the angular segment (to 180° or 180-360°) desired, 2) condition the sample at a selected constant temperature for a desired period of time, if the temperature chosen is below ambient, use the air bath to reach the proper temperature; and 3) after conditioning, when the upper clamp is retracted and turned aside, start the time sweep of the recorder at the inch-per-minute rate desired, and calculate percentages by means of formulas (1) and (2).
VII. Discussion of Results
The twist-recovery-versus-temperature curves obtained by means of the visual apparatus (Figure 7) are all of the same type, differing only in slope. The curves for the silicone and nitrile rubbers show a rapid elastic regain once recovery begins. The butyl rubber compound curve is flatter, indicating a much slower regain rate. The other rubbers tested fall between these extremes. From the curves, a breakaway (5-degree recovery) temperature and the temperature required for any specific degree of recovery can be determined. Temperature values for 5, 45, 67.5, 90, and 180 degrees of angular recovery are tabulated in Table III.
Reproducibility of the results of the Twist Recovery Test were good, showing a maximum difference of 1.5 degrees between two runs on any of the rubber compounds. Very good agreement was also obtained between the two pieces of apparatus, as is shown in Table IV. The curves obtained from the X-Y recorder of the automated apparatus were essentially the same as those plotted from the data obtained with the visual apparatus. (Examples are shown in Figure 8, where both sets of data are plotted on one graph.)
Tlv .utomated equipment provides a convenient method for making continue s twist-recovery-versus-time curves, since its X-Y recorder is equipped with a variable time sweep. Recovery-versus-time can be plotted for a specimen that has been conditioned at a specific temperature and #
then released and allowed to recover with the temperature held constant.
14

1
8 ? § i?
* t: S >: rrm O '
" V it * m
§ 3 § |" ! I i § "5—3T /"-/<?/ico*y jG>/nßuyo
?<o
8
S
o
U 0)
JQ 3 U
4J 3
CQ
o
u
s 0) c
'S .O ^» Q)
4J
C et) *"* 3 2 o *H
w 9
4J CD 6
0) H 3 u t I 0) H
CO
3 «9 M
t o o 0)
OS
«ö .-I 3 60
0) M 3 Ö0 •H tu
cd
15

«H
TT"TT"T~TTTTTTTTTTTT1
!
!
s o
0) c
.—I
a s a a) § •-I
3 «3
M-l O
4J O -4
5
a) c
•H
>> ** "8 * "8 *S *S 'S t *§ *? *: st t 1 •« «o »o
a)
s
C
I s I (Ö
fa
:
£ O
c o CO
S3 a
o
00
00 •H fa
16

i*
TABLE III
Temperatures at Various Degrees of Recovery from 360° Twist (Twist Recovery Test)
Com- pound
Type of Rubber R5*
Temperature, R45 R67.5
(°C) at
R90 R180
10NB1 Nitrile/butadiene -14.5 -10 -9.5 -8.5 -5.5
10NB2 it it -33 -26 -25 -23.5 -17
10NB3 II II -39.5 -33.5 -32.5 -31.5 -25.5
10NB4 it n -39 -33 -31 -29.5 -21
10N1 Natural -64 -56.5 -53.5 -49.5 -34
10SB1 Styrene/butadiene -49 -40, > -36 -32 -16
10SB2 ii II -60.5 -50 -45.5 -41 -23.5
10III Butyl -61 -43.5 -37.5 -32.5 -15
10C1 Chloroprene -37 -29.5 -27 -24.5 -13.5
10TI Polysulfide -52 -43.5 -39.5 -36 -24
10FPMI Fluorocarbon -22.5 -16.5 -15.5 -14.5 -9
lOSil Dimethy1-siloxane -39.5 -38 -38 -37.5 -37
lOSi2 Methyl-vinyl siloxane -52 -39.5 -39 -39 -38
10Si3 Methyl-phenyl siloxane -70 of below
-70 or below
-70 or below
-70 or below
-69
244WM Ethylene/propylene/diene -54.5 -45.5 -41.5 -38.5 -26.5
244CM II II II -52 -32.5 -27 -22.5 -11
245WM II it II -54 -41 -37 -32 -18
245CM ti II II -53 -32.5 -27 -23 -11
EPT92 it II II -55.5 -45.5 -42.5 -37.5 -25
*"R" signifies "recovery of" the number of angular degrees noted. Thus under the *5 column are given the temperatures at which angular recoveries of 5° occurred.
17

i -
\
TABLE IV
Comparison Between Results Obtained with the Visual and Automated Twist Recovery Apparatus
Compound R5* Temperature, (°C) at
R45 R67.5 R90 R180
Styrene/butadiene 10SB1
Visual -49 -40 -36 -32 -16
Automated -50 -40 -36 -33 -21
Ethylene/propylene/diene 244WM
Visual -54.5 -45.5 -41.5 -38.5 -26.5
Automated -57 -45 -41 -37 -26
244CM Visual -52 -32.5 -27 -22.5 -11
Automated -56 -33 -27 -23 -13
245WM Visual -54 -41 -37 -32 -18
Automated -58 -42 -35.5 -31 -20
245CM Visual -53 -32.5 -27 -23 -11
Automated -55 -32 -26 -22 -12
* "R" signifies "recovery of" the number of angular degrees noted. Thus under the R5 column are given the temperatures at which angular recoveries of 5° occurred.
18

Figure 9 shows the curves for an ABR compound (10SB1) tested at three temperatures. These curves were governed somewhat by the tracking speed of the machine. During the initial or steep straight portion of the
* curves at -40° and -30°~, the specimen movement overrode the machine; that is, the specimen recovered faster than the machine could track it and the movement of the aluminum wand and hence the specimen was re- strained by the sensing heads. However, at the speed used for the time sweep (0.26 inch per minute), this had little effect on the shape of the curve. As the recovery of the specimen slowed (after approximately 12 seconds), the aluminum wand broke free of the sensing heads and remained free for the remainder of the test.
To provide a frame of reference for evaluating the significance of the data obtained by the twist recovery method, they were compared with those obtained by means of two low-temperature procedures currently used at U. S. Army Natick Laboratories: the Torsional Stiffness Test* and the Temperature Retraction Test (Tables I and II). Of the two, one might expect better correlation with the Temperature Retraction Test since both it and the twist recovery procedure measure recovery from deformation.
| Figure 10 shows the temperature at which various rubbers retracted 50 percent (TR50) plotted against the temperatures at which they recovered 67.5 degrees from twist (R67.5). Some of the rubbers show very good correlation; others, notably natural rubber and neoprene, show none. The behavior of these two rubbers is attributable to their crystalli- zation under the extreme elongation of the Temperature Retraction Test, while no effective crystallization was induced by the low deformation of the twist recovery procedures.
Figure 10 also shows the temperatures at which the relative torsional moduli of the various rubbers was 5 (T5) plotted against the temperatures at which the rubbers recovered 67.5 degrees from twist (R67.5). The correlation is excellent for all the rubbers except a series of ethylene/propylene/diene (EPD) rubbers (marked with squares). These show a significant difference between the temperatures required for the twist recovery R67.5 and the torsional T5, as can also be seen by comparing the R67.5 and T5 data in Tables I and III, where the EPD compounds show differences of from 4°C (for EPT 92) to 14.5QC (for 244CM) while the other rubbers agree within 3.5°C. These results indi- cate that, at low temperatures, EPD rubbers regain their elasticity more slowly than they do their flexibility.
It seems likely that the differences between the torsional stiff- ness and twist recovery of the EPD rubbers are stress-strain dependent
1 I • * *The Torsional Stiffness Test was conducted as described in Ref. 1 with
the exception that dry-ice cooled air was used instead of a liquid cool- ant. The Temperature Retraction Test was conducted as described in Ref. 2,
19

- t
\
u a) &
g C a) •H
'S
i
I GO c
•H (0
13
00
9 2 § 3
g
a> 3 O •H u
<d
CO
CO M
?!
I U cO
I <
•H
fa*A0 39y JejfiButf
20

* '■
-
m H a 3 09 u t
vO
O
CO U
NO pd
CO
CO J-l CO
tl 3
CO u
22
ß| §•, _ »n 0) H H . m co
r^ c VD<H Pi «M
§1 8S 35
co u u CO o
3H H-g M-i (d
°o co m
•H
O Ü
-8 3 tf 00 •H fa
\
CO CO
0) .0 ^ .O .O
22 O M 04 0) w us
4J •P O c 4) 4J CO C m Q) 14 CO a a) Sä «s s. 35 6" o
OT H
21

*-'\l
i
\
and thus could be correlated with room-temperature stress-strain test results. This will be discussed below.
The results obtained to date show that the Twist Recovery 1 jst described here is a valid» simple and reproducible means of evaluating the low-temperature elastic behavior of rubber. It gives the tempera- tures at which rubbers under low deformation begin to regain their elasticity and the temperatures at which specified amounts of elastic recovery occur. The test permits the measurement of recovery as it relates to constantly increasing temperatures. It can also be used at a constant temperature (room temperature or lower) to determine rates of recovery and to obtain twist-set values. Since the effects of crystallization are markedly less than in the Temperature Retraction Test, the twist recovery results more realistically reflect the low- temperature behavior of many items in actual service.
The visual device can be used, with either an air or a liquid bath3 to provide a low cost apparatus suitable for specification testing. The specification requirement can be stated simply as the temperature at which there must be a specified degree of recovery, for example, "the temperature for recovery to 67.5 degrees must be -40°C or below." Multiple units of 6, 8, or 10 visual devices could be mounted in a bath to increase the capacity for this type of routine testing.
VIII. Application of the Twist Recovery Test to a Specific Problem
EPD stocks, which were originally made for another study^, were compounded in several different ways (ses App. C). Those numbered 244 were sulfur-cured; those numbered 245 were peroxide-cured. Those marked with the letters WM or CM were hot- and cold-milled, respectively. The EPT 92 compound differed from the 244 WM only in that hydrated silica was the filler used for the former while carbon black was used for the latter.
The anomaly in the low-temperature behavior of the EPD rubbers provided a reason for using the twist recovery apparatus to study a specific problem. Therefore, a twist-set procedure was developed using the apparatus to evaluate the room-temperature elastic behavior of the EPD rubbers and to correlate it to low-temperature activity. The pro- cedure was essentially as described in Section VI of this report, i.e., twisting specimen 360 degrees at room temperature, holding at this temperature for 10 minutes, then releasing and measuring the residual twist (or percentage of set) 1, 5, and 10 minutes later, using Equation (2) on page 13. The results, shown in Table V, show that, in general, those EPD compounds that have the greatest difference between their T5 and R67.5 temperatures also have the highest percentage of twist set and, conversely, the poorest recovery at room temperature. Stress- strain properties, then, do account in some measure at least for the
"
22

variations among the EPD rubbers. However, they do not account for the differences between the EPD and other test rubbers.
While a butyl rubber compound (10X11) shows very high twist-set values, its T5 versus R67.5 agreement is within the generally accepted limits of reproducibility of the Torsional Stiffness Test (Table V).
TAB1E V
Comparison of Twist Set at Room Temperature with the Temperature Difference in °C Between T5 and R67.5
Temperature Difference % Twist Set at Room Temperature for (°C) Between
Compound 1 min 5 min 10 min T5* and R67.5**
EPD rubbers 244WM 5 3
244CM 15 12
245WM in 6
245CM 14 10
EPT92 9 6
Butvl rubber 10III1 22 19
Styrene/butadiene rubber 10SB1, cured
7/310 at
50 38
10/310 44 28
15/310 31 20
20/310 25 16
30/310 20 13
3
10
6
9
6
18
31
23
17
14
11
5.5
14.5
8.5
10
4
1.5
8
11
8.5
8.5
2.5
* T5 is temperature, oc, at which material has a torsional modulus five times greater than it had at room temperature, obtained from the Torsional Stiffness Test.
** R67.5 is temperature, °C, at a recovery of 67.5 angular degrees from 360° twist, obtained from the Twist Recovery Test.
23
!-
■
Another type of rubber, styrene/butadiene (10SB1), also showed a different behavior from the EPD rubbers. This rubber was cured at times which gave a compound ranging from very-much-undercured to cured, with resulting differences in physical properties (App. D). The T5-R67.5 differences were larger for the specimens that were undercured (high set) than for those that were cured for longer times. However, on a comparative basis, none of these differences were as great as the differences between the EPD rubbers, which certainly had less variation in their cures.
All that can be said at this point is that EPD rubbers regain their elasticity in a somewhat different fashion than the other rubbers tested. The relationship of stress-strain properties and low-temperature elasti- city of rubber, especially EPD, is an area requiring further investigation and should form the basis of a complete study in itself.
IX. Conclusions
1. This new test, developed for evaluating the low temperature elastic behavior of rubbers under low deformation, represents a valid and reproducible means for determining the rate of elastic regain of rubbers at low temperatures and for measuring the extent of recovery at specific temperatures.
2. The test is suitable for studies of rubbery properties. The visual technique is especially suited for routine testing for specifi- cation purposes.
X. Recommendations
Further work should be initiated to study:
1. The rate of elastic recovery with temperature change at various rates.
2. Elastic behavior of rubbers at low temperatures and its relationship to stress-strain values at room temperature.
3. The relationship of the low-temperature stress-strain data obtained by various other means, and possibly under compression, to the data obtained by the use of the twist recovery apparatus.
XI. Acknowledgment
The author thanks Mr. L. Lulka for the compounding work and for preparing test slabs of the rubbers tested.
•
24
XII. References
1. Measuring Low-temperature stiffening of rubber and rubber-like materials by means of a torsional wire apparatus. ASTM Designation D1053-61, Part 28, 1965 Book of ASTM Standards, American Society for sting and Materials, Philadelphia, Pa.
2. Evalv .ng low-temperature characteristics of rubber and rubber- like materials by a temperature-retraction procedure (TR test). ASTM Designation D1329-60, Part 28, 1965 Book of ASTM Standards, American Society for Testing and Materials, Philadelphia, Pa.
3. Retraction test for serviceability of elastomers at low tempera- tures, O.H.Smith, W.A.Hermonat, H.H.Haxo, and A.W.Meyer. Anal. Chem., 23 322-27 (1951)
4. Low temperature characteristics of elastomers, S.T Gehman, D.E.Woodford, and C.S.Wilkinson, Jr. Ind. and Eng. Chem., 39 1108-15 (1947)
5. Low-temperature compression set of vulcanized elastomers. ASTM Designation D1229-62, Part 28, 1965 Book of ASTM Standards, American Society for Testing and Materials, Philadelphia, ?a.
6. Brittleness temperature of plastics and elastomers by impact. ASTM Designation D746-64T, Part 28, 1965 Book of ASTM Standards, American Society for Testing and Materials, Philadelphia, Pa.
7. Private communication from Peter Dunn and Vincent Javier to Angus Wilson, NLABS, Natick, Mass., 10 February 1965.
25

AEH5NDIX A - References Pertaining to Rubber and Kinetic Elasticity
Rubber is the generic name for a class of materials whose individual members differ widely in chemical make-up. Thus rubber is defined to a large extent by its properties and behavior. Its distinguishing property is an ability to withstand large deformation under force and to return rapidly, upon release of the force, to almost its original dimensions. The lack of complete recovery may be negligible and practically immeasur- able or it may be relatively large, depending on the extent and duration of the deformation, time elapsed after release of the force, test tempera- ture, and state of cure or vulcanization of the rubber.
This singular behavior is attributable to the olecular structure of rubber and its resulting kinetic elasticity - a type of elasticity which, aside from its magnitude, differs from the true elasticity found in steel and other solids in that stress is not directly proportional to strain nor is it truly reversible or immediately reproducible. If a stress-strain curve is drawn for rubber as force is applied, and again as force is released, it will be found that the extension and retraction curves do not coincide, as they do if the procedure i» carried out on a solid possessing true elasticity. Further, if a force it» applied to steel below its yield point, for example, a definite amount of deformation results. If the force is released and then reapplied, the steel again attains the same definite amount of deformation. Rubber, on the other hand, because of its kinetic elasticity, attains a different deformation upon the second appli- cation of force.
The following quotations from various sources concerning the meaning of rubber and kinetic elasticity may assist in further amplifying these terms.
Terms relating to rubber and rubber-like materials. ASTM Designation D1566-62T, Part 28, 1965 Book of ASTM Standards, American Society for Testing and Materials, Philadelphia, Pa.
Rubber - A material that is capable of recovering from large deformations quickly and forcibly, and can be, or already is, modified to a state in which it is essentially insoluble (but can swell) in boiling solvent, such as benzene, methyl ethyl ketone, and ethanol-toluene azeotrope.
A rubber in its modified state, free of diluents, retracts within 1 minute to less than 1.5 times its original length after being stretched at room temperature (20 to 27 C) to twice its length and held for 1 minute before release.
27
The Physics of Rubber Elasticity, L.R.G.Treloar. 2nd Edition. Clarendon Press, Oxford, 1958, p.2-3.
The most obvious, and also the most important, character- j istic of the rubber-like state is, of course, a high degree of elastic deformability under the action of comparatively small stresses the maximum extensibility normally falls within the range 500 to 1,000 per cent, while the value of Young's modulus (in the region of small extensions) is of the order of 10 kg./cm.2, or 107 dynes/cm,2 By way of contrast it may be mentioned that Young's modulus for typical hard solids is in the region of 1012 dynes/cm.2, while their maximum elastic (i.e. reversible) extensibility seldom exceeds 1 per cent. There is thus an enormous difference between rubbers on the one hand and ordinary hard solids (e.g. of a crystalline or glassy nature) on the other.
History and Summary of Rubber Technology« B.S.Garvey, Jr., Chapter 1 of Introduction to Rubber Technology, M.Morton, Ed., Reinhold Publishing Corporation, N.Y., 1959, p.10-11.
A consideration of the many uses of rubber show that it is used principally as a structural material and that its use depends on certain mechanical or physical properties. What are these properties which make rubber so useful?
First and foremost is elasticity. A rubber band can be stretched to 9 or 10 times its original length. As soon as the load is released, it retracts almost immediately to its original length. Similarly, a block of rubber can be compressed, and as soon as the load is released the block will assume its original shape and dimensions. In the extent to which it can be distorted, in the rapidity of recovery, and in the degree to which it re- covers its original shape and dimensions, rubber is unique. Hence, these are the prime requirements of "rubberiness".
Rubber, however, is not perfectly elastic. The initial rapid recovery is not complete. Part of the residual distortion is recovered more slowly, and part is permanently retained. The extent of this permanent distortion, or "permanent set11, depends on the rate with which the distorting force la applied and the length of time it is maintained. The quicker the force and the shorter the time, the less is the permanent set. Even after long periods of time, however, the permanent set is not complete, so that there is some pressure to resume the original shape...
•
28

t»
I
I J I
Principles of high-polymer theory and practice, A.X.Schmidt and C,A.Marlies. McGraw-Hill Book Company, N.Y., 1948, p.298-299
Ionic crystals, metals, and other low-molecular-weight crystalline solids can be strained only to elongation of 0.1 to 1 per cent before the elastic limit is reached. These small elastic deformations represent mainly the distortion of normal bond lengths or bond angles.
By contrast, chain polymeric solids can undergo elastic extensions several orders of magnitude greater.... Chain molecules are capable of extensive coiling or folding. Short small molecules are not. If a particular folded position represents the condition of minimum free energy, the applica- tion of external tension can cause temporary straightening and elongation, followed by a return to the original dimension upon subsequent release of stress, this return being facilitated by thermal agitation and long-range molecular entanglement and anchorage as described in Sec. 516. This radically different kind of elasticity is called kinetic or Mackian elasticity. Plastics and fibers exhibit elastic deformation to the order of 1 to 10 per cent. In rubbers, the phenomenon attains its peak; reversible elongations of as much as 1,000 per cent are encountered.
29

•
I c
t 0
a
« c
—* z u W
4J
M
I O
2 I *:
o CO
8. •H o a)
00 e
§ 8.

m
o CO
o CO *H —« O m
o Csl en
in m m
m CM o -*
o CM en
o CM
m
CM
m M • o o r* en CO •<* m
o> en i i i i i
o CM en
o CM
u 0
4-1 n CO CO 0) H •H cu a •° •H •° O 3 cu a* t*
Q) w c c <D •H *H
-o P c "sj 3 a) 0 c a CD e i-ii 0 H u °4
o| 1 M
P4 CJ >s.l
a)| X c M a) o •-41
«E H K £1
5! M
m
O o in CO >fr <f CM
en m
s en
I O I I I o\ en
CM
m
o oc
o en m
m N
m m r^ r- m
% • * o o i-i
•A 3 CM
m
o CO
o en m
O CM en
in CM
m m r^ r^ m » % • o o fi
k
o CM en
O CM
O CM en
o CM
O CM en
o CM
a) •a •H M4 •H 3 CO <d u en
a) u cu 8
•H ■u 5 *
«■Hi
3 CO i CD
—4 0 ^ •H 3 0 CO TJ •H N a) (D ,c cd •o JJ P 4J •ri •H
e 3 c M 0) 4J 8 *
•rJ CO •H 3 C 0 u >» .■• « U 6 i,H CD M o w 6 0 •H ,Q r-t K CM a o »H -u f~M «» 4J 0 C 4.)
c <■ -a •H ', < co r-4 r\ /I 1—1 •H '' <r X o Ü a c 0 J" \i o . i W r—
o <!■ X a d •H 'j ,h ü 4J J- o •H 1—« a) 0 c *U t-4 •H 4J E (X 3 c* ;"*
c r. 31 o u a .-4 Ü Q cd u •~* a 0 ^-4 c •H 4-> •H CJ u 4J U •H o
CD i—< *-i n •H ^4 cj a 3 cd C u Q ui TJ 03 cd Ä c3 ^4 CJ m M a o c-1 a u ^ a &y 0 \J 4J c -^ 4J u 0-- B-9 S-i
0 0 ^ ^ i 4J >* 0 •H 3 a •H 1 O oi 3 *-^ tf ► * 2 a </) u- N (75 H o CM <f to CJ
•H o
g 4J
a cd c
IW 0 U
a o o
00 c
31

11 «•
APPENDIX D - Physical Properties of Test Compounds
Hardness Tensile, psi Ult. Elong. % 300% Mod. Dsi Shore A
L0IPU1 2500 410 1750 68
10NB2 2450 540 1100 63
10NB3 2050 520 1000 57
10NB4 1900 730 750 50
ION I 3850 700 950 56
10SB1 3250 750 550 60
10S^2 2100 500 900 63
10II1 2200 450 1300 72
10C1 3500 340 3000 79
10T1 850 310 850 68
10FPM1 1650 170 - 78
lOSil 400 240 - 49
10S12 650 140 - 66
10S13 250 130 - 56
244WM* 2900 370 2300 60
244CM* 2500 460 1400 70
245WM* 2100 400 1250 58
245CM* 2050 480 1050 62
EPT92* 3400 580 1200 60
10SB1, 7/310 c.lO 800 c.10 46
10/310 100 1070 c.20 52
15/310 1000 1130 100 56
i 20/310 2100 1030 150 58
30/310 3050 820 400 60
•"See Reference 3.

Unclassified Security Classification
DOCUMENT CONTROL DATA - R&D (Security clarification ol title, body ol mbatract and indexing annotation muat be entered when Ute overmll report ia claaailied)
1 ORIGINATING ACTIVITY (Corporate author)
U. S. Army Natick Laboratories Natick Massachusetts 01760
Za REPORT SECURITY C L ASSIFIC A TlON
Unclassified 2b GROUP
3. REPORT TITLE
MEASUREMENT OF RUBBER ELASTICITY AT LOW TEMPERATURES USING A TWIST RECOVERY APPARATUS
4- DESCRIPTIVE NOTES (Type ol report and tncluaive date»)
July 1964 through June 1965 5 AUTHORfS; (Lmat name, tint name, initial)
Wilson, Angus
6- REPORT DATE
January 1966
7a- TOTAL NO. OF PACES
_22_ 7b. NO. OF REFS
11 8a. CONTRACT OR GRANT NO.
b. PROJECT NO.
Independent Research Project 24 c.
d.
9a. ORIGINATOR'S REPORT NUMBERfSj
66-4-CM
9b. OTHER REPORT NOfSj (Any other numbere that may be aaaignad thie report)
C&0M-14 10. AVAILABILITY/LIMITATION NOTICES
Distribution of this document is unlimited. Release"to CFSTI is authorized.
11. SUPPLEMENTARY NOTES 12. SPONSORING MILITARY ACTIVITY
Rubber, Plastics & Leather Engr Branch Clothing & Organic Materials Division US Armv Natick Laboratories« Natick, Mass,
13. ABSTRACT
Kinetic elasticity is an important and definitive property of rubber, yet it is difficult to measure at room temperature and even more difficult to measure at lower-than-room temperatures. Many current low-temperature test methods provide useful information about various properties of rubber but give little information about its elastic behavior or else measure elasticity under deformations greater than those likely to be found in service.
The apparatus and methods described in this report provide a new means of observing and measuring the low-temperature behavior of rubber. Since, in actual use, rubber is * / often deformed only slightly, the new method subjects the test specimen to a t deformation of 360°, resulting in an elongation of approxi- mately 5 pero along its side. The apparatus permits twist recovery and percentage of set to be measured at specific constant temperatures and also to be correlated with rising temperatures.
The results show that, with the exception of a series of ethylene/propylene/ diene (EPD) rubber compounds, both the elasticity and the flexibility of rubbers are regained within the same range of low temperatures. The stress-strain behavior] of EPD rubbers, which differs from that of other types of rubber, is briefly discussed.
These techniques CJI be used not only to examine the basic behavior of rubbery materials, but also in the routine inspection of rubber items and
components.
DD FORM 1 JAN 64 1473 Unclassified
Security Classification

Unclassified Security Classification
TT KEY WORDS
LINK A
ROLE WT
LINK 8
ROLE
LINK C
ROLE
\
Measurement Jest Methods Kinetic elasticity Rubber Elastomers Low-temperature research Twisting Evaluation
8 8 9 9,4 9
10 10 4
INSTRUCTIONS
1. ORIGINATING ACTIVITY: Enter the name and address of the contractor, subcontractor, grantee, Department of De- fense activity or other organization (corporate author) issuing the report.
2a. REPORT SECURITY CLASSIFICATION: Enter the over- all security classification of the report. Indicate whether "Restricted Data" is included. Marking is to be in accord- ance with appropriate security regulations.
26. GROUP: Automatic downgrading is specified in DoD Di- rective 5200.10 and Armed Forces Industrial Manual. Enter the group number. Also, when applicable, show that optional markings have been used for Group 3 and Group 4 as author- ized.
3. REPORT TITLE: Enter the complete report title in all capital letters. Titles in all cases should be unclassified, if a meaningful title cannot be selected without classifica- tion, show title classification in all capitals in parenthesis immediately following the title.
4.* DESCRIPTIVE NOTES: If appropriate, enter the type of report, eg., interim, progress, summary, annual, or final. Give the inclusive dates when a specific reporting period is covered.
5. AUTHOR(S): Enter the name(s) of authoKs) as shown on or in the report. Enter last name, first name, middle initial. If military, show rank and branch of service. The name of the principal author is an absolute minimum requirement
6. REPORT DATE: Enter the date of the report äs day, month, year, or month, year. If more than one date appears on the report, use date of publication..
7a. TOTAL NUMBER OF PAGES: The total page count should follow normal pagination procedures, i.e., enter the number of pages containing information.
76. NUMBER OF REFERENCES: Enter the total number of references cited in the report.
8a. CONTRACT OR GRANT NUMBER: If appropriate, enter the applicable number of the contract or grant under which the report was written.
86, 8c, & 8d. PROJECT NUMBER: Enter the appropriate military department identification, such as project number, subproject number, system numbers, task number, etc
9a. ORIGINATOR'S REPORT NUMBER(S): Enter the offi- cial report number by which the document will be identified and controlled by the originating activity. This number must be unique to this report. 96. OTHER REPORT NUMBER(S): If the report has been assigned any other report numbers (either by the originator or by the sponsor), also enter this number(s).
10. AVAILABILITY/LIMITATION NOTICES: Enter any lim- itations on further dissemination of the report, other than those imposed by security classification, using standard statements such as:
(1) "Qualified requesters may obtain copies of this report from DDC"
(2) "Foreign announcement and dissemination of this report by DDC is not authorized."
(3) "U. S. Government agencies may obtain copies of this report directly from DDC, Other qualified DDC users shall request through
(4) "U. S. military agencies may obtain copies of this report directly from DDC Other qualified users shall request through
M
(5) "All distribution of this report is controlled. Qual- ified DDC users shall request through
If the report has been furnished to the Office of Technical Services, Department of Commerce, for sale to the public, indi- cate this fact and enter the price, if known. 11. SUPPLEMENTARY NOTES: Use for additional explana- tory notes. ,12, SPONSORING MILITARY ACTIVITY: Enter the name of the departmental project office or laboratory sponsoring (pay- ing for) the research and development. Include address. 13. ABSTRACT: Enter an abstract giving a brief and factual summary of the document indicative of the report, even though it may also appear elsewhere in the body of the technical re- pert. If additional space is required, a continuation sheet shall be attached.
It is highly desirable that the ahstract of classified re- ports be unclassified. Each paragraph of the abstract shall end with an indication of the military security classification of the information in the paragraph, represented as (TS), (S), (C), or (V).
There is no limitation on the length of the abstract. How- ever, the suggested length is from 150 to 225 words.
14. KEY WORDS: Key words are technically meaningful terms or short phrases that characterize a report and may be used as index entries for cataloging the report. Key words must be selected so that no security classification is required. Iden- fiers, such as equipment model designation, trade name, mili- tary project code name, geographic location, may be used as key words but will be followed by an indication of technical context. The assignment of links, rules, and weights is optional.
Unclassified Security Classifi ecurity Classification