measurement of particle size distribution in mammalian cells in vitro by use of polarized light...
TRANSCRIPT

Mip
M
1
Tsctdmdi
ovmttaivoi
wspS
2
1
easurement of particle size distributionn mammalian cells in vitro by use ofolarized light spectroscopy
atthew Bartlett, George Huang, Lyndon Larcom, and Huabei Jiang
We demonstrate the feasibility of measuring the particle size distribution �PSD� of internal cell structuresin vitro. We use polarized light spectroscopy to probe the internal morphology of mammalian breastcancer �MCF7� and cervical cancer �Siha� cells. We find that graphing the least-squared error versus thescatterer size provides insight into cell scattering. A nonlinear optimization scheme is used to determinethe PSD iteratively. The results suggest that 2-�m particles �possibly the mitochondria� contributemost to the scattering. Other subcellular structures, such as the nucleoli and the nucleus, may alsocontribute significantly. We reconstruct the PSD of the mitochondria, as verified by optical microscopy.We also demonstrate the angle dependence of the PSD. © 2004 Optical Society of America
OCIS codes: 170.6510, 290.1350, 290.4020.
suab
dcnctsascvdfisd
rsltpnfwjl
. Introduction
here has been recent interest in the use of polarizedcattered light to monitor the dysplastic cellularhanges that lead to cancer. Most cancers begin inhe epidermal layer of an organ before invadingeeper tissue.1 Because improved cancer treat-ents depend on early detection and removal of the
iseased tissue, diagnosis of the cancer while it is stilln the epidermal layer is highly desirable.
Current detection methods involve taking a biopsyf the suspect area, followed by staining and obser-ation under a microscope. These time-consumingethods are often painful for the patient and require
he expertise of highly trained and experienced pa-hologists. The use of polarized light scattering asn epidermal tissue probe has raised interest becauset is a comparatively quick, cost-effective, and nonin-asive procedure. Polarized light tends to probenly the top 100–200 �m of tissue, and the scatteredntensity spectrum can be related to the size of the
M. Bartlett, L. Larcom, and H. Jiang �[email protected]� areith the Department of Physics and Astronomy, Clemson Univer-
ity, Clemson, South Carolina 29634. G. Huang is with the De-artment of Biological Science, Clemson University, Clemson,outh Carolina 29634.Received 30 May 2003; revised manuscript received 7 October
003; accepted 8 October 2003.0003-6935�04�061296-12$15.00�0© 2004 Optical Society of America
296 APPLIED OPTICS � Vol. 43, No. 6 � 20 February 2004
catterers in the tissue. Dysplastic tissue typicallyndergoes measurable changes in morphology, suchs changes in size and standard deviation, which maye detected in vivo.Because of the cell’s complex structure, significant
ebate has arisen over the primary scatterer in theell. Possible scatterers include the cell membrane,ucleus, nucleoli, and structures such as the mito-hondria. Mourant et al.2,3 have shown evidencehat small structures, such as the mitochondria andubnuclear structures, produce the primary large-ngle scattering from the cells. They used diffusecattering to measure the reduced scattering coeffi-ient �s� and the anisotropy factor g. By comparingalues with similar data from latex spheres, theyetermined the primary scatterers from mammalianbroblast cells to be between 0.4 and 2.0 �m. Thisize was considerably smaller than the nucleus or celliameter.Backman et al.,4,5 on the other hand, were able to
econstruct the nuclear size distributions from mea-urements of the light’s intensity versus its wave-ength. Incident polarized light was scattered off ahin layer of cultured colon cells. The reconstructedarticle size, based on Mie theory, gave a calculateduclear diameter of 5 �m for normal cells and 10 �mor tumor cells, with the assumption that the nucleusas the primary scatterer. In a further study, Gur-
ar et al.6 reconstructed the nuclear size image of aarge area of excised colon tissue. The optically
mc
sntschewlsRfcis
tlsshdsopttab
mmpbvirofts
o�swtlistgTrfTtm
2
EcswlTwtgloswewgtvvww
tllTttrTlPtUwmtil
A
Tdlrpsetttcn
B
TspTs
easured nuclear sizes matched well with the clini-al data.
The apparent contradictory results between lightcattered from the nucleus versus that from sub-uclear particles may have the simple explanationhat the scattered light contains elements of bothignals. Drezek et al.7 examined the effects that nu-lear size, refractive index, and chromatin contentave on scattering intensity. In that study visualxaminations were performed on cervical biopsiesith different stages of dysplasia. Numerical simu-
ations were used to study the predicted effect of ob-erved nuclear atypia on scattering intensities.esults indicated that light-scattering properties
rom cells can be significantly affected by subnuclearhromatin distributions, variations of the refractivendex in the DNA, and the overall nuclear size andtructure.In this paper we study the possible scatterers in a
hin layer of cultured cells and tissue phantoms. Po-arization is used to discriminate between the weaklycattered light from the top sample and the multiplycattered light from deeper layers. This techniqueas been used extensively to discriminate betweenifferent depths of light penetration.2–6 We mea-ured the light intensity versus wavelength at vari-us scattering angles to determine if the measuredarticle size would be affected by ��, the angle be-ween the incident light and the collector. A Mieheory model was used to fit the intensity spectrumnd to iteratively reconstruct the particle size distri-ution �PSD�.We begin by providing an overview of the experi-ental setup and theory used. We then validate ourodel by using latex sphere data. Latex spheres
rovide a cost-effective method for verifying modelsased on Mie theory.4,8,9 The particle shape pro-ides an excellent match with Mie theory, and thendex of refraction is well known.10 We obtained theeconstructed PSD of two monodisperse distributionsf latex spheres. We also mixed spheres of two dif-erent diameters to demonstrate the combined scat-ering from a sample containing spheres of differentizes.Measurements were next performed on two types
f in vitro mammalian cell, a breast cancer lineMCF7� and a cervical cancer line �Siha�. Using theame type of Mie theory fit used for the latex spheres,e reconstructed the PSD of the primary scatterers of
he cell. We demonstrate that, as with any iterativeeast square optimization technique, the initial guesss crucial for determining a converged value within apecific range of sizes. Several optimized PSDs fithe data reasonably well, but the fit that provides thelobal minimum error should be the most accurate.o illustrate the importance of finding the global,ather than a local, minimum, we present the spectraor the least squared error versus the particle size.his type of plot illustrates the possible problems due
o local minima and gives direction for choosing theost feasible initial guess.
. Experiments
xperiments were conducted with a CCD-basedontinuous-wave system, shown in Fig. 1. In thisystem, light from a 100-W tungsten-halogen lampas focused onto a 200-�m fiber-optic cable. The
ight was directed through a 14-mm focal-length lens.he light then passed through a linear polarizer andas focused to a 2-mm-diameter dot on the surface of
he sample. The scattered light was collected at aiven angle through an analyzer and a 14-mm focal-ength collection lens. This lens refocused the lightnto a second 200-�m fiber for delivery to the CCDpectrometer. The incident and collection anglesere adjustable in the scattering plane. The small-st �� between the incident and the collection beamas limited to 40° �scattering angle of 140°� by theeometry of the system. An ISA 3200 CCD spec-rometer that was interfaced with a computer con-erted the scattered light signal into an intensity-ersus-wavelength spectrum. We measuredavelengths in the range from 550 to 800 nm, whichas determined by the range of the polarizers.The incident polarizer was kept stationary
hroughout all the experiments; however, the ana-yzer was connected to a rotational device. We col-ected four sets of data for each angle measurement.he first measurement was made on the sample with
he polarizer and analyzer perpendicular to the scat-ering plane I����, and the second with the analyzerotated 90° �i.e., parallel to the scattering plane I����.he wavelength dependence on the light source,
enses, and polarizers was removed by normalization.erpendicular and parallel measurements wereaken on a standard reflectance diffuser �LabsphereSRS99010�. The parallel diffuser measurementas used to normalize I����, and the perpendiculareasurement was used to normalize I����. Sub-
racting the two spectra I�Norm��� I�
Norm��� resultsn the intensity-versus-wavelength spectrum of theight scattered from the top layer of the sample.
. Solid Phantoms
o simulate the multilayered structure of tissue, weeveloped a thick layer of solid phantom on which ouratex spheres �Polysciences, Incorporated, War-ington, Pennsylvania� and cultured cells werelaced. This lower layer consisted of an Intralipidolid phantom made from 10% Intralipid, agar �stiff-ning agent Sigma A-7049�, and India ink. The op-ical properties of this phantom were adjusted suchhat �s� � 2.0 �m1 and �a � 0.03 �m1, which arehe approximate reduced scattering and absorptionoefficients of the dermal layer of the skin at 650m.11,12
. Polystyrene Samples
wo samples containing polystyrene spheres weretudied. The samples consisted of thin layers ofure latex spheres placed on top of the solid phantom.he spheres had diameters of 2.065 and 9.1 �m andtandard deviations �SDs� of 0.025 and 0.7 �m, re-
20 February 2004 � Vol. 43, No. 6 � APPLIED OPTICS 1297
siptTtftsatwt
C
Tiic3sws
l
vctswassTo
D
Wmtcatn1m
3
Op
F2omt
1
pectively. Approximately 60 �l of the latex spheresn distilled water were dripped on top of the solidhantom. This mixture was allowed to spread overhe top of the solid phantom and the spheres to settle.hese latex measurements were used to verify our
heory and setup. A measurement was also per-ormed on a mixture of 2.065 and 9.1 �m spheres withhe same volume fraction. To simulate a nucleusurrounded by a large number of mitochondria, wedded one hundred 2-�m particles for each 9-�m par-icle. The goal was to determine which particleould dominate the scattering intensity and whether
he intensity spectrum would be angle dependent.
. Cultured Cells
wo types of cultured cell were studied: Siha, anmmortalized cervical cancer cell line, and MCF7, anmmortalized breast cancer cell line. Each of theseell types was grown in vitro until there were at least� 106 cells. The cells were then centrifuged into a
mall pellet of 1–2 mm3 in size. The excess mediumas decanted, and the concentrated cells were
cooped onto the surface of the solid phantom.For each of the above tissue phantoms, scattered
ight was measured at a particular �� and then con-
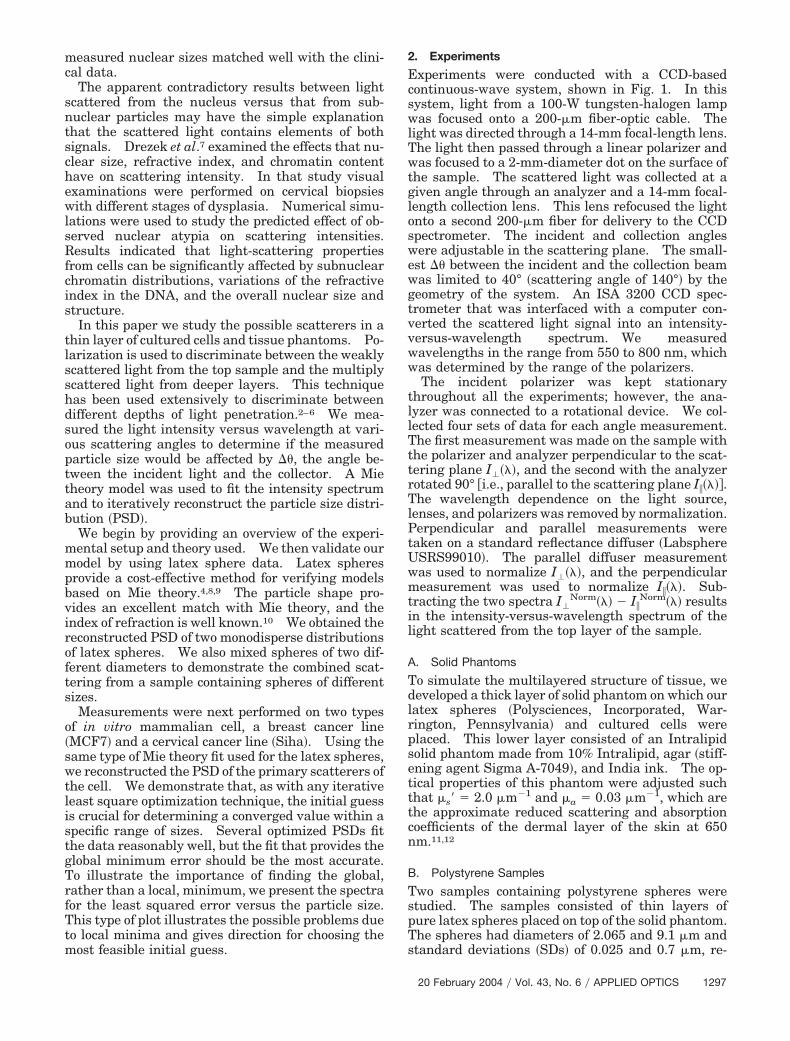
ig. 1. �a� Schematic of the experimental setup. Following the00-�m fiber-optic cable, 14-mm focal-length lens, linear polarizerptic fiber, CCD and spectrometer, and computer interface. �b� Soaintains its incident polarization. Dotted arrows represent mult
hrough scattering.
298 APPLIED OPTICS � Vol. 43, No. 6 � 20 February 2004
erted to an intensity-versus-wavelength curve. In-ident and collection polarizers were used to removehe multiply scattered light while preserving single-cattered light from the top layer. Measurementsere not taken within 10° of the specular reflectionngle to avoid surface reflectance. The exportedpectrum was then fitted by use of an iterative recon-truction algorithm based on Mie scattering theory.he reconstruction allowed us to determine the PSDf each sample.
. Optical Microscope
e used a Nikon Diaphot 300 inverted fluorescenceicroscope, which was connected to a spectrometer
hat was interfaced to a computer, to observe theells. The cells were magnified 60� and 100� tollow the measurement of the mean diameter of eachype of cell. Acridine Orange was used to stain theucleus to obtain its mean diameter, and Rhodamine23 was used to stain the cell’s mitochondria and toeasure its mean size.
. Theory
ur primary goal was to reconstruct the PSD of theredominate scatterer of the cell. Because we are
of light, the system consists of a 100-W tungsten-halogen light,tilayered sample, linear analyzer, 14-mm collection lens, 200-�mrows represent the light single scattered from the top layer, whichcattered light, which penetrates deeper and looses its polarization
path, mullid ariply s

ivtbdHbTgl
tfehtsutoisiptBppfrfItIsff
ibItttdi
wtpMdcpd
ti
wtsgN�
was
bsirbdtHptopisi
dto
ws
eppircsrtae
nterested in early diagnoses of diseased tissue inivo, we used a light probe that would examine onlyhe top 100–200 �m of tissue. Polarized light haseen shown to scatter several times in an opticallyense medium before losing its polarization.13,14
owever, light that penetrates deep into the tissueecomes unpolarized owing to multiple scattering.hus polarization can be used as a tool for distin-uishing between light scattered from the top thinayer of tissue versus that scattered from deep tissue.
Much attention has been paid to light backscat-ered directly from the sample. More light scattersrom the top layer in this direction,15 and the geom-try is conducive to probing internal organs.3,16 Weave found that a measurable signal can also be de-ected at a �� from 40° to 100°, depending on theample. The incident light was polarized perpendic-lar to the scattering plane, defined so that it con-ains both the incident and collection fibers. Thisrientation means that the incident light was polar-zed parallel to the surface of the sample. Two mea-urements were taken on each sample tondependently determine the perpendicular I�
m andarallel I�
m components of the scattered light, wherehe superscript m represents the measured intensity.ecause single-scattered light maintains the incidentolarization—an approximation for nonsphericalarticles—the I�
m contains the single-scattered lightrom the top layer. I�
m also contains 50% of theandomly polarized light that is multiply scatteredrom the deeper layers. Thus I�
m � I� topm
� bottomm. I�
m, however, represents 50% of the lighthat is multiply scattered from the lower layers; thus�m � I� bottom
m. By subtracting these two measuredpectra, we were able to cancel the intensity scatteredrom the lower layers, leaving only the light scatteredrom the top layer:
I�m � I�
m � �I� topm � I� bottom
m� � I� bottomm � I� top
m.(1)
It should be noted that we are measuring lightntensity versus wavelength � at particular angles �etween incident and collector fibers; thus I�
m��, ��.n this study we made the assumption that the scat-erers can be approximated as spheres.3,4,17 Mieheory provides a mechanism for calculating the in-ensity spectrum scattered from a group of indepen-ent particles. The theoretical formula for scatteredrradiance per unit of incident irradiance is given by
I� topc��, �� �
�S1��, ���2
�kr�2 , (2)
here the superscript c represents the calculated in-ensity, S1 is the perpendicular element of the am-litude scattering matrix and can be calculated fromie theory,18 k is the wave number, and r is the
istance between the detector and the sample. Be-ause the detected signal contains light from multiplearticles, Eq. �2� must be integrated over a givenistribution. The intensity I c��, �� must also be in-
�egrated over the solid angle. The total collectedntensity can be calculated by
I�c��, �, x� � N �
xi
xf
��i
�f
�S1��, �, x��2f
� � x, a, b, c�sin �d�dx, (3)
here f�x, a, b, c� is an a priori size distribution, inhis case Gaussian; xf and xi represent the range ofcattering particle sizes; �f and �i represent the an-ular distribution of light in the scattering plane; and
is the normalization including �kr�2. TypicallyS1�2 is normalized such that
Csca ��
k2 �0
�
��S1����2 � �S2����2sin �d�, (4)
here Csca is the total elastic scattering cross sectionnd �S1�2 and �S2�2 are the perpendicular and parallelcattering amplitudes, respectively.17
We used a least-square-error-type iteration schemeased on a Newton–Marquardt method to recon-truct the PSD, f �x�. Because we assumed a Gauss-an distribution, we had three parameters toeconstruct. These parameters are referred to as a,, and c, where a controls the amplitude, b the stan-ard deviation, and c the particle size. We were ableo obtain good fits of both the latex and cell data.owever, the converged distribution was highly de-endent on the initial guess. This was particularlyrue for the cell data, which does not have the strongscillatory wavelength dependence of the monodis-erse latex spheres. Given the uncertainty inherentn any initial guess for a new sample, we developed aimple program to provide a rough estimate of thenitial guess.
We hypothesized that the parameters that pro-uced the global minimum error should have beenhe most accurate. The error was calculated by usef the standard least-squared-error definition
� � ��1
nw
�Im��� � Ic���2
nw � 1�
1�2
, (5)
here � equals the least square error and nw repre-ents the number of wavelength increments.Given the complex structure of the cell, an accurate
stimate of the scatterer size was not well known ariori. To improve the initial guess, we incrementedarameter c in 2,000 steps from 0 to 16 �m, optimiz-ng parameters a and b for each increment of c. Weecorded the least squared error for each increment of. By plotting the error versus the average particleize, we revealed all the local minima over the givenange of particles. Although this method can beime consuming, it reveals most of the local minimand gives an indication of which initial guess param-ters will optimize to the global minimum.
20 February 2004 � Vol. 43, No. 6 � APPLIED OPTICS 1299

A
TiAiimdri
w�dmiidittttaAbthtut
lt
B
WFthttcsttct
4
Posatsrf0tslfis
Fitmp
1
. Optimization of the Refractive Index
he intensity spectrum also depends on the refractivendices of the medium, nm, and of the particle, np.lthough nm and np are well known for latex spheres
n water �np � 1.59�, slight variations in these indicesmproved our fits of the data. We wanted to opti-
ize np and nm, which requires finding the partialerivative of S1��, �, x, nm, np� with respect to theefractive indices. Because the differentiation of S1s not trivial, we have used the limit
lim�nm,p30
�S1�nm,p�
�nm,p, (6)
here �nm,p is the change in the refractive index andS1�nm,p� is the change in the scattering amplitudeue to the change in the refractive index. Thisethod requires that S1 be calculated twice for each
teration. Although Mie theory is less time consum-ng than a Monte Carlo approach, S1 involves hun-reds of thousands of calculations owing to thentegration in Eq. �3�. We have reduced the runime by calculating S1 only when the Gaussian dis-ribution is large enough to affect the intensity spec-rum, PSD � 1.5% � PSDMax; by calculating S1 overhe solid angle, �10° from the central angle; and bybandoning the normalization mentioned in Eq. �4�.ll of our data indicated that this normalization coulde absorbed into the arbitrary normalization N. Op-imizing nm and np can improve the data fit and iselpful when nm and np are not known. Disadvan-ages include increased time for optimization, partic-larly for PSDs with a large SD. The increase fromhree to five parameters also increases the number of
ig. 2. Intensity-versus-wavelength curves for �a� the 2.065-�mntensity is the solid curve, and the fitted data is the dotted curvehe PSDs for 2- and 9-�m particles, respectively. The solid curvicroscope. The dotted curves represent the reconstructed PSDs.
article sizes.
300 APPLIED OPTICS � Vol. 43, No. 6 � 20 February 2004
ocal minima. This increase in minima underscoreshe importance of an accurate initial guess.
. Snell’s Law
e measured all the samples at multiple angles.or small scattering angles, the converged parame-ers were often far from the expected values. Weypothesized that the light was refracting as it en-ered the tissue phantom. This refraction wouldend to reduce the ��, particularly at large incidence–ollection separations. The sample was modeled asubcellular particles surrounded by a medium of cy-oplasm. We have tried a simple Snell’s law correc-ion as the light passed from air �nair � 1.0� toytoplasm �nmedium � 1.355� and vice versa to offsethis observed angle dependence.
. Results
olystyrene spheres provided a known PSD to verifyur method because the size, refractive index, andpherical shape are accurately known. Figures 2�a�nd 2�b� show the fit between the measured and op-imized intensity spectra for 2- and 9-�m-diameterpheres. Figures 2�c� and �d� show the PSD of theeconstructed data and the PSD given by the manu-acturer. The given SD for the 9-�m particles was.7 �m. As reported in an earlier study,12 the elec-ron microscope images revealed that the majority ofcatterers have a diameter very near the mean. Thearge SD is due to a few very large particles that arear from the mean. We used electron microscopemages to determine the SD of 0.08 �m for the 9-�mpheres by excluding the few large spheres. The
�b� the 9.10-�m-diameter polystyrene spheres. The measuredth spectra were measured at a �� of 40°. Plots �c� and �d� showpresent the PSDs provided by the factory or measured under ah measured peak sizes are within 3% of the factory and microscope
- and. Boes reBot
mofatmmsw
pttt�dudt
t51flmcuwv
Tlnafd
FcdpT
Fcdbbv
ost accurate data fits occurred when we iterativelyptimized the refractive indices. The index of re-raction for latex �nL � 1.59� and water �nw � 1.33�re well known, allowing the program to slightly shifthese indices and to improve the overall fit of theeasured data �the optimized indices varied by noore than 4% from the given values�. The PSD
hifted by �1% when the actual refractive indicesere used.Based on studies of the literature,2,4,7 we antici-
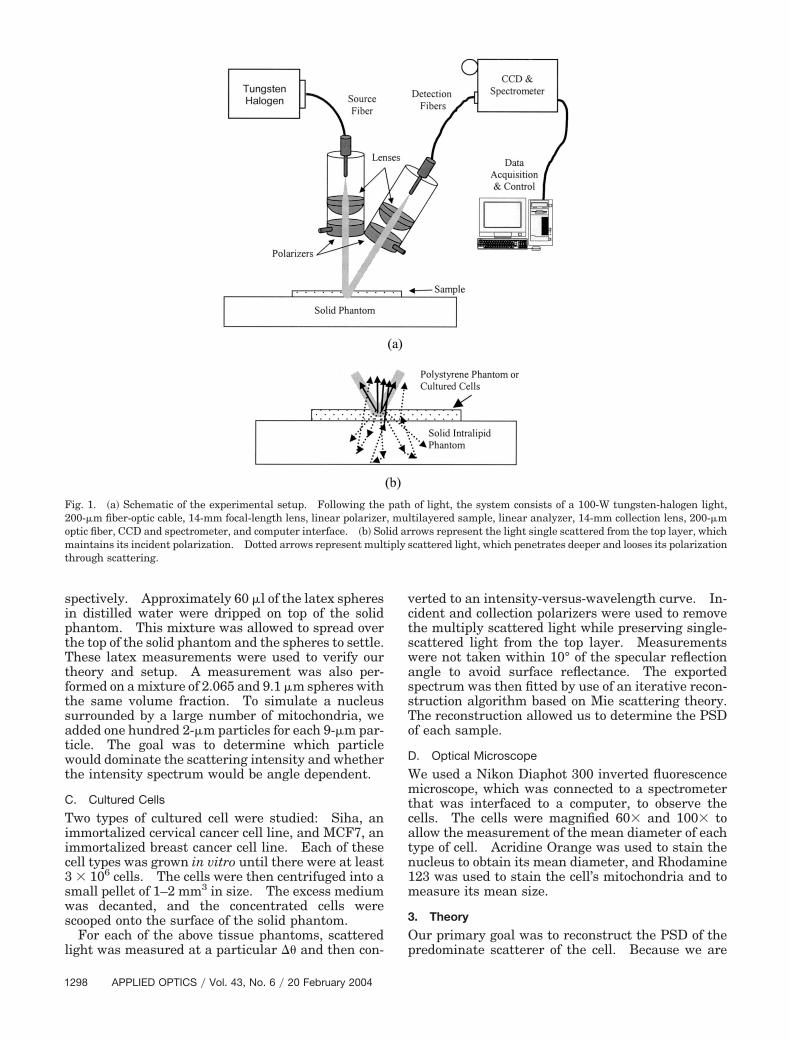
ated that the primary scatterers in the cell would behe mitochondria or the nucleus. Although the mi-ochondria and nuclei vary in size and shape from cello cell, the mitochondria are oblong and average 1–3m in size. The nucleus can be 10 �m or larger iniameter. The MCF7 and Siha cells were observednder an optical microscope to have an outer celliameter of approximately 15 �m. Figure 3 showshe cells dyed with Acridine Orange, which causes
ig. 3. Optical microscope image of �a� Siha cells and �b� MCF7ells at 60� magnification. The cells have been dyed with Acri-ine Orange to make the nucleus fluoresce. The solid arrowsoint at the nucleus, which appears lighter than the background.he dotted arrows point to the dark spots believed to be nucleoli.
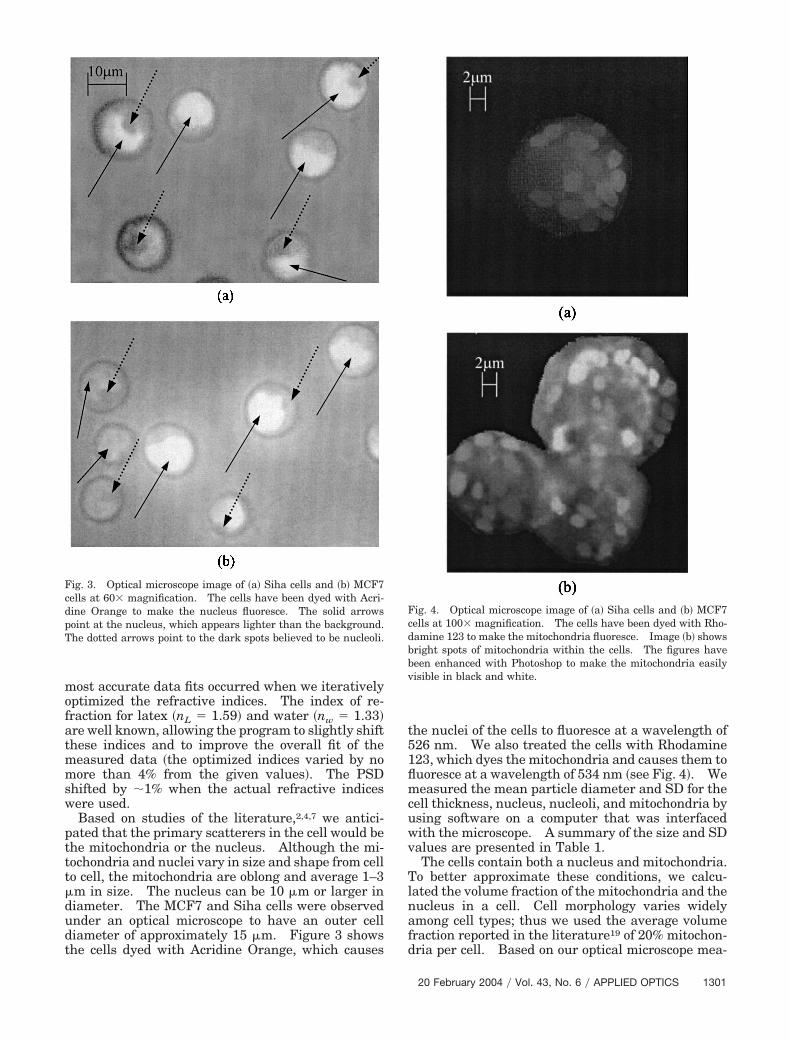
he nuclei of the cells to fluoresce at a wavelength of26 nm. We also treated the cells with Rhodamine23, which dyes the mitochondria and causes them touoresce at a wavelength of 534 nm �see Fig. 4�. Weeasured the mean particle diameter and SD for the
ell thickness, nucleus, nucleoli, and mitochondria bysing software on a computer that was interfacedith the microscope. A summary of the size and SDalues are presented in Table 1.The cells contain both a nucleus and mitochondria.
o better approximate these conditions, we calcu-ated the volume fraction of the mitochondria and theucleus in a cell. Cell morphology varies widelymong cell types; thus we used the average volumeraction reported in the literature19 of 20% mitochon-ria per cell. Based on our optical microscope mea-
ig. 4. Optical microscope image of �a� Siha cells and �b� MCF7ells at 100� magnification. The cells have been dyed with Rho-amine 123 to make the mitochondria fluoresce. Image �b� showsright spots of mitochondria within the cells. The figures haveeen enhanced with Photoshop to make the mitochondria easilyisible in black and white.
20 February 2004 � Vol. 43, No. 6 � APPLIED OPTICS 1301
shttamsposPF2fiv9ss
twaeaasit
Sabisvomd
Foir
�
1
urements, the diameter of the nucleus was roughlyalf the size of the cell’s diameter. If we assumehat the nuclei are approximately spherical, theyake up 20% to 25% of the cell volume. We mixed 2-nd 9-�m spheres to have a 1:1 volume fraction perilliliter of water. This produced the ratio of 100
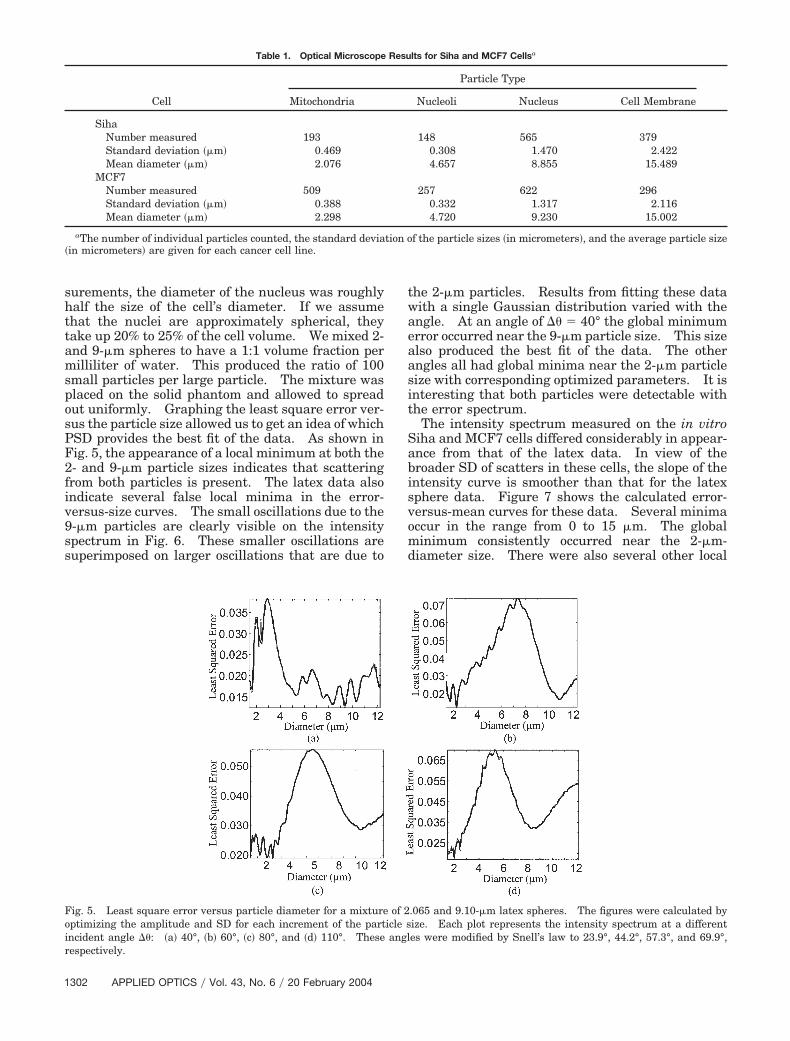
mall particles per large particle. The mixture waslaced on the solid phantom and allowed to spreadut uniformly. Graphing the least square error ver-us the particle size allowed us to get an idea of whichSD provides the best fit of the data. As shown inig. 5, the appearance of a local minimum at both the- and 9-�m particle sizes indicates that scatteringrom both particles is present. The latex data alsondicate several false local minima in the error-ersus-size curves. The small oscillations due to the-�m particles are clearly visible on the intensitypectrum in Fig. 6. These smaller oscillations areuperimposed on larger oscillations that are due to
ig. 5. Least square error versus particle diameter for a mixtureptimizing the amplitude and SD for each increment of the partncident angle ��: �a� 40°, �b� 60°, �c� 80°, and �d� 110°. Theseespectively.
Table 1. Optical Microscope
Cell Mitochondria
SihaNumber measured 193Standard deviation ��m� 0.469Mean diameter ��m� 2.076
MCF7Number measured 509Standard deviation ��m� 0.388Mean diameter ��m� 2.298
aThe number of individual particles counted, the standard deviain micrometers� are given for each cancer cell line.
302 APPLIED OPTICS � Vol. 43, No. 6 � 20 February 2004
he 2-�m particles. Results from fitting these dataith a single Gaussian distribution varied with thengle. At an angle of �� � 40° the global minimumrror occurred near the 9-�m particle size. This sizelso produced the best fit of the data. The otherngles all had global minima near the 2-�m particleize with corresponding optimized parameters. It isnteresting that both particles were detectable withhe error spectrum.
The intensity spectrum measured on the in vitroiha and MCF7 cells differed considerably in appear-nce from that of the latex data. In view of theroader SD of scatters in these cells, the slope of thentensity curve is smoother than that for the latexphere data. Figure 7 shows the calculated error-ersus-mean curves for these data. Several minimaccur in the range from 0 to 15 �m. The globalinimum consistently occurred near the 2-�m-
iameter size. There were also several other local
.065 and 9.10-�m latex spheres. The figures were calculated byize. Each plot represents the intensity spectrum at a differentes were modified by Snell’s law to 23.9°, 44.2°, 57.3°, and 69.9°,
lts for Siha and MCF7 Cellsa
Particle Type
Nucleoli Nucleus Cell Membrane
148 565 3790.308 1.470 2.4224.657 8.855 15.489
257 622 2960.332 1.317 2.1164.720 9.230 15.002
f the particle sizes �in micrometers�, and the average particle size
of 2icle sangl
Resu
tion o

mTsmmdmamdscTWutasif
aT
tOt�1�Pmht
taPtdr
FttT nd 69
FSa
inima at or near 0.6 �m, 4–6 �m, and 8–10 �m.hese minima may or may not correspond to actualcattering particles. It is interesting that the globalinimum is consistently near the observed size of theitochondria. Figures 8�a� and 8�b� show the good
ata fit obtained with an initial guess near the globalinimum. The optimized PSDs shown in Figs. 8�c�
nd 8�d� also match our optical microscope measure-ents. The presence of other local minima may in-
icate that the intensity spectrum containsuperimposed data from mitochondria and other sub-ellular particles, such as the nucleoli and nucleus.he predominate minima were near 2, 4, and 9 �m.e obtained the best and most consistent data fits by
sing the 2-�m initial guess. We are uncertain ifhe minimum near the 4-�m particle size represents
particle in the cell. We did observe small darkpots �shown in Fig. 3� on the nuclear fluorescentmages with a 4-�m particle size. The optimized fitsor this size were highly angle dependent and gener-
ig. 6. Intensity-versus-wavelength curves for the 2.065- and 9.1-he dashed curves represent the fit with initial guess near the 2-�mhe 9-�m size. Each figure represents the intensity spectrum athese angles were modified by Snell’s law to 23.9°, 44.2°, 57.3°, a
ig. 7. Cell data representing the least square error versus the pnell’s law to 29.1; �b� measured from MCF7 cells at a �� of 45°, mot 2, 4, and 9 �m. We believe that these may be due to the mito
lly had higher least square errors �see Table 2�.hese particles appear to be the nucleoli.20
The presence of local minimum in the range from 6o 10 �m may be due to scattering from the nucleus.ptical microscope images of dyed cell nuclei revealed
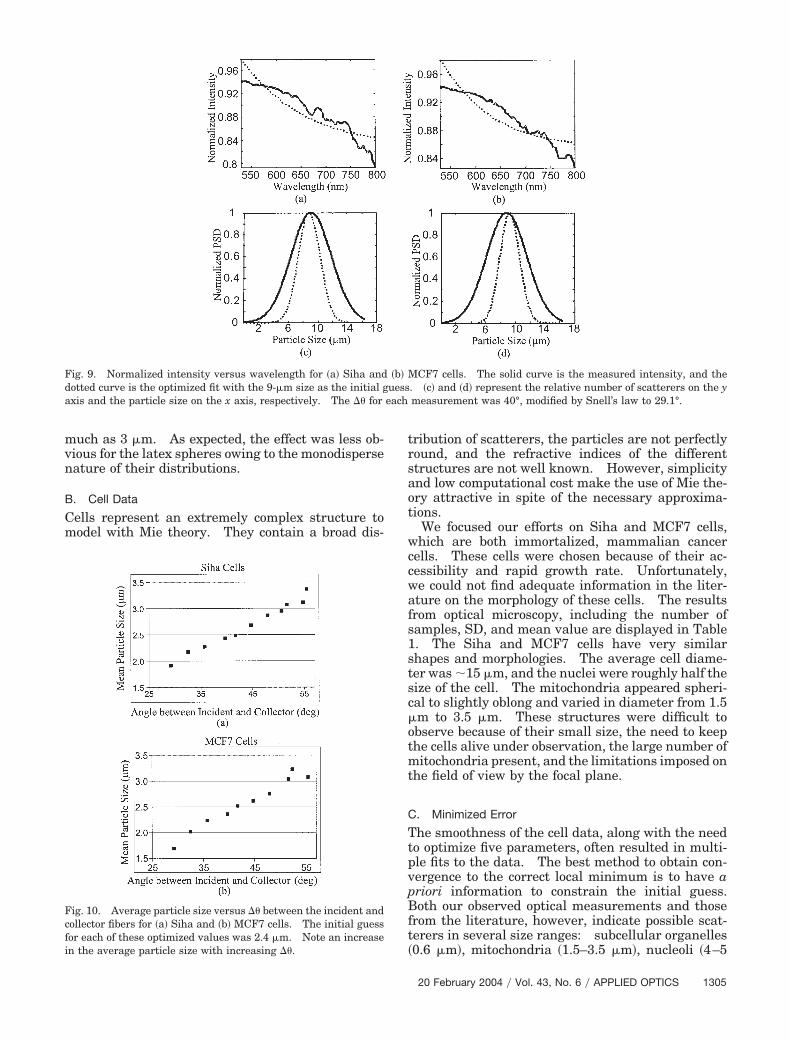
he nuclear size for these cells to be between 7 and 9m or roughly half the diameter of the cell �see Table�. Using an initial guess near the mean value of 9m with a SD of 1.4 �m, we were able to reconstruct aSD, shown in Fig. 9, very near the size distributioneasured by the optical microscope. These fits hadigher least-square-error values than did the fits fromhe 2-�m initial guesses �see Table 2�.
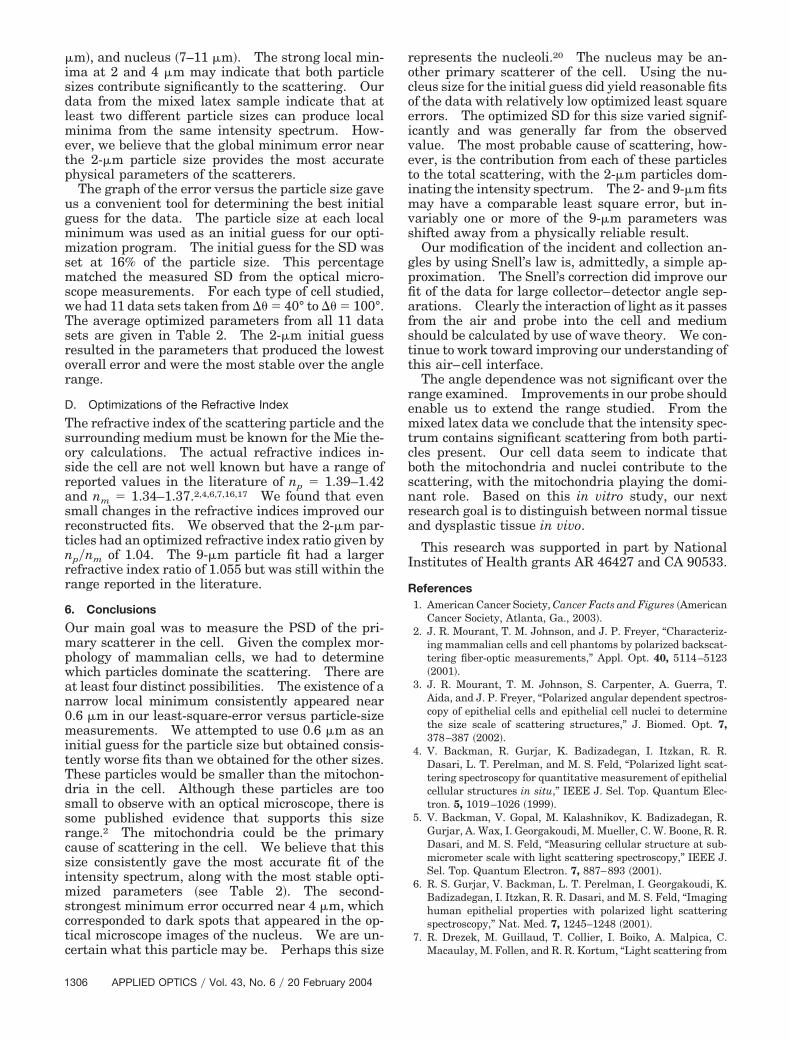
One of the primary goals of this study was to de-ermine the relationship between scattering anglend scattering particle size. We anticipated that theSD would shift to a higher size as �� increased �i.e.,he scattering angle would decrease�. Figure 10emonstrates, however, that the global minimum er-or and the optimized PSD for the mitochondria
iameter particles. The solid curves represent the measured data,, and the dotted curves represent the fit with an initial guess nearfferent incident angle ��: �a� 40°, �b� 60°, �c� 80°, and �d� 110°..9°, respectively.
le size: �a� measured from Siha cells at a �� of 40°, modified byby Snell’s law to 32.4°. Notice that there are three local minima
dria, nucleoli, and nucleus, respectively.
�m-dsizea di
articdifiedchon
20 February 2004 � Vol. 43, No. 6 � APPLIED OPTICS 1303

sgw
5
A
Tpudeomt1ccas
sonossFac2cntmts
tcG
Fda each
1
1
hifted to a higher particle size as the scattering an-le decreased and the scattering became more for-ard directed.
. Discussion
. Experimental Setup
he experimental setup continues to be a work inrogress. Many studies reported in the literaturesed polarized light scattered 180° from the incidentirection. This setup has the advantage of beingasily adapted to in vivo measurements of internalrgans, such as colon, cervix, and esophagus, thatust be examined by fiber-optic probes. We wanted
o study the angle-dependent scattering over the 40°–00° range. This geometry is suitable for skin, oururrent area of interest. We expected larger parti-les to dominate the light scattered into the forwardngles and smaller particles to dominate the back-cattered light. We did not, however, observe a
ig. 8. Normalized intensity versus wavelength for �a� Siha andotted curve is the optimized fit with the 2-�m size as the initial gxis and the particle size on the x axis, respectively. The �� for
Table 2. Average Results for the Least-Squared Error a
Cell Units ��m� Angle Error
Siha 0.6 29.2–54.7 0.031 � 0.022.0 29.2–55.4 0.012 � 0.004.0 29.2–55.4 0.053 � 0.119.0 29.2–55.4 0.014 � 0.00
MCF 0.6 29.2–55.4 0.0138 � 0.002.0 29.2–55.4 0.0061 � 0.004.0 29.2–55.4 0.0256 � 0.019.0 29.2–55.4 0.0098 � 0.00
aFor each cell type we used the four different initial guesses tha1 angle measurements were averaged. The error was lowest for
304 APPLIED OPTICS � Vol. 43, No. 6 � 20 February 2004
trong angle-dependent change in scattering for latexr cell samples. Admittedly, the angle range wasot ideal, and the expected trend may become morebvious at angles of 0°–35° and 105°–180°. Themallest �� was limited to 40° because of the physicalhape of the incident and collector probes shown inig. 1. Increasing �� above 100° was also problem-tic owing to the physical size of the illumination andollection areas. Although these areas appeared as-mm-diameter dots when directed from above, theircular dots became elliptical as the angle from theormal increased. Beyond a �� of 100°, the signal-o-noise ratio decreased enough to make accurateeasurements impractical. Increasing the focus of
he beam and the intensity power should make mea-urements beyond 100° feasible.We did observe a small angle-dependent shift in
he PSD of the 2-�m particle size. As the �� in-reased from 40° to 100°, the mean diameter of theaussian distribution increased from nearly 2 to as
CF7 cells. The solid curve is the measured intensity, and the. �c� and �d� represent the relative number of scatterers on the ymeasurement was 40°, modified by Snell’s law to 29.1°.
e Five Optimized Parameters for Siha and MCF7 Cellsa
SD ��m�Particle Size
��m� np�nm
0.109 � 0.014 0.623 � 0.100 1.066 � 0.0270.348 � 0.186 2.669 � 0.451 1.045 � 0.0040.822 � 0.681 5.305 � 1.169 1.051 � 0.0121.822 � 0.645 8.928 � 0.877 1.053 � 0.0080.119 � 0.012 0.633 � 0.097 1.063 � 1.0630.515 � 0.228 2.540 � 0.470 1.042 � 1.0420.396 � 0.642 5.598 � 1.018 1.041 � 1.0411.700 � 0.629 8.960 � 0.722 1.050 � 1.050
espond to the local minima in Fig. 7. The results for each of the2–3-�m PSD.
�b� Muess
nd th
6266029373194537
t corrthe
mvn
B
Cm
trsaot
Fdaxis and the particle size on the x axis, respectively. The �� for each measurement was 40°, modified by Snell’s law to 29.1°.
Fcfi
uch as 3 �m. As expected, the effect was less ob-ious for the latex spheres owing to the monodisperseature of their distributions.
. Cell Data
ells represent an extremely complex structure toodel with Mie theory. They contain a broad dis-
wccwafs1stsc�otmt
C
TtpvpBft�
ribution of scatterers, the particles are not perfectlyound, and the refractive indices of the differenttructures are not well known. However, simplicitynd low computational cost make the use of Mie the-ry attractive in spite of the necessary approxima-ions.
We focused our efforts on Siha and MCF7 cells,hich are both immortalized, mammalian cancer
ells. These cells were chosen because of their ac-essibility and rapid growth rate. Unfortunately,e could not find adequate information in the liter-ture on the morphology of these cells. The resultsrom optical microscopy, including the number ofamples, SD, and mean value are displayed in Table. The Siha and MCF7 cells have very similarhapes and morphologies. The average cell diame-er was �15 �m, and the nuclei were roughly half theize of the cell. The mitochondria appeared spheri-al to slightly oblong and varied in diameter from 1.5m to 3.5 �m. These structures were difficult tobserve because of their small size, the need to keephe cells alive under observation, the large number ofitochondria present, and the limitations imposed on
he field of view by the focal plane.
. Minimized Error
he smoothness of the cell data, along with the needo optimize five parameters, often resulted in multi-le fits to the data. The best method to obtain con-ergence to the correct local minimum is to have ariori information to constrain the initial guess.oth our observed optical measurements and those
rom the literature, however, indicate possible scat-erers in several size ranges: subcellular organelles0.6 �m�, mitochondria �1.5–3.5 �m�, nucleoli �4–5
ig. 9. Normalized intensity versus wavelength for �a� Siha and �b� MCF7 cells. The solid curve is the measured intensity, and theotted curve is the optimized fit with the 9-�m size as the initial guess. �c� and �d� represent the relative number of scatterers on the y
ig. 10. Average particle size versus �� between the incident andollector fibers for �a� Siha and �b� MCF7 cells. The initial guessor each of these optimized values was 2.4 �m. Note an increasen the average particle size with increasing ��.
20 February 2004 � Vol. 43, No. 6 � APPLIED OPTICS 1305
�isdlmetp
ugmmsmswTsror
D
Tsosrasrtnrr
6
Ompwan0mitTdssrcsimsctc
rocoeivetimvs
gpfiafstt
remtcbsnra
I
R
1
m�, and nucleus �7–11 �m�. The strong local min-ma at 2 and 4 �m may indicate that both particleizes contribute significantly to the scattering. Ourata from the mixed latex sample indicate that ateast two different particle sizes can produce local
inima from the same intensity spectrum. How-ver, we believe that the global minimum error nearhe 2-�m particle size provides the most accuratehysical parameters of the scatterers.The graph of the error versus the particle size gave
s a convenient tool for determining the best initialuess for the data. The particle size at each localinimum was used as an initial guess for our opti-ization program. The initial guess for the SD was
et at 16% of the particle size. This percentageatched the measured SD from the optical micro-
cope measurements. For each type of cell studied,e had 11 data sets taken from �� � 40° to �� � 100°.he average optimized parameters from all 11 dataets are given in Table 2. The 2-�m initial guessesulted in the parameters that produced the lowestverall error and were the most stable over the angleange.
. Optimizations of the Refractive Index
he refractive index of the scattering particle and theurrounding medium must be known for the Mie the-ry calculations. The actual refractive indices in-ide the cell are not well known but have a range ofeported values in the literature of np � 1.39–1.42nd nm � 1.34–1.37.2,4,6,7,16,17 We found that evenmall changes in the refractive indices improved oureconstructed fits. We observed that the 2-�m par-icles had an optimized refractive index ratio given byp�nm of 1.04. The 9-�m particle fit had a largerefractive index ratio of 1.055 but was still within theange reported in the literature.
. Conclusions
ur main goal was to measure the PSD of the pri-ary scatterer in the cell. Given the complex mor-
hology of mammalian cells, we had to determinehich particles dominate the scattering. There aret least four distinct possibilities. The existence of aarrow local minimum consistently appeared near.6 �m in our least-square-error versus particle-sizeeasurements. We attempted to use 0.6 �m as an
nitial guess for the particle size but obtained consis-ently worse fits than we obtained for the other sizes.hese particles would be smaller than the mitochon-ria in the cell. Although these particles are toomall to observe with an optical microscope, there isome published evidence that supports this sizeange.2 The mitochondria could be the primaryause of scattering in the cell. We believe that thisize consistently gave the most accurate fit of thentensity spectrum, along with the most stable opti-
ized parameters �see Table 2�. The second-trongest minimum error occurred near 4 �m, whichorresponded to dark spots that appeared in the op-ical microscope images of the nucleus. We are un-ertain what this particle may be. Perhaps this size
306 APPLIED OPTICS � Vol. 43, No. 6 � 20 February 2004
epresents the nucleoli.20 The nucleus may be an-ther primary scatterer of the cell. Using the nu-leus size for the initial guess did yield reasonable fitsf the data with relatively low optimized least squarerrors. The optimized SD for this size varied signif-cantly and was generally far from the observedalue. The most probable cause of scattering, how-ver, is the contribution from each of these particleso the total scattering, with the 2-�m particles dom-nating the intensity spectrum. The 2- and 9-�m fits
ay have a comparable least square error, but in-ariably one or more of the 9-�m parameters washifted away from a physically reliable result.Our modification of the incident and collection an-
les by using Snell’s law is, admittedly, a simple ap-roximation. The Snell’s correction did improve ourt of the data for large collector–detector angle sep-rations. Clearly the interaction of light as it passesrom the air and probe into the cell and mediumhould be calculated by use of wave theory. We con-inue to work toward improving our understanding ofhis air–cell interface.
The angle dependence was not significant over theange examined. Improvements in our probe shouldnable us to extend the range studied. From theixed latex data we conclude that the intensity spec-
rum contains significant scattering from both parti-les present. Our cell data seem to indicate thatoth the mitochondria and nuclei contribute to thecattering, with the mitochondria playing the domi-ant role. Based on this in vitro study, our nextesearch goal is to distinguish between normal tissuend dysplastic tissue in vivo.
This research was supported in part by Nationalnstitutes of Health grants AR 46427 and CA 90533.
eferences1. American Cancer Society, Cancer Facts and Figures �American
Cancer Society, Atlanta, Ga., 2003�.2. J. R. Mourant, T. M. Johnson, and J. P. Freyer, “Characteriz-
ing mammalian cells and cell phantoms by polarized backscat-tering fiber-optic measurements,” Appl. Opt. 40, 5114–5123�2001�.
3. J. R. Mourant, T. M. Johnson, S. Carpenter, A. Guerra, T.Aida, and J. P. Freyer, “Polarized angular dependent spectros-copy of epithelial cells and epithelial cell nuclei to determinethe size scale of scattering structures,” J. Biomed. Opt. 7,378–387 �2002�.
4. V. Backman, R. Gurjar, K. Badizadegan, I. Itzkan, R. R.Dasari, L. T. Perelman, and M. S. Feld, “Polarized light scat-tering spectroscopy for quantitative measurement of epithelialcellular structures in situ,” IEEE J. Sel. Top. Quantum Elec-tron. 5, 1019–1026 �1999�.
5. V. Backman, V. Gopal, M. Kalashnikov, K. Badizadegan, R.Gurjar, A. Wax, I. Georgakoudi, M. Mueller, C. W. Boone, R. R.Dasari, and M. S. Feld, “Measuring cellular structure at sub-micrometer scale with light scattering spectroscopy,” IEEE J.Sel. Top. Quantum Electron. 7, 887–893 �2001�.
6. R. S. Gurjar, V. Backman, L. T. Perelman, I. Georgakoudi, K.Badizadegan, I. Itzkan, R. R. Dasari, and M. S. Feld, “Imaginghuman epithelial properties with polarized light scatteringspectroscopy,” Nat. Med. 7, 1245–1248 �2001�.
7. R. Drezek, M. Guillaud, T. Collier, I. Boiko, A. Malpica, C.Macaulay, M. Follen, and R. R. Kortum, “Light scattering from
1
1
1
1
1
1
1
1
1
1
2
cervical cells throughout neoplastic progression: influence ofnuclear morphology, DNA content, and chromatin texture,”J. Biomed. Opt. 8, 7–16 �2003�.
8. T. M. Johnson and J. R. Mourant, “Polarized wavelength-dependent measurements of turbid media,” Opt. Express 4,200–216 �1999�.
9. V. Sankaran, K. Schonenberger, J. T. Walsh, Jr., and D. J.Maitland, “Polarization discrimination of coherently propagat-ing light in turbid media,” Appl. Opt. 38, 4252–4261 �1999�.
0. D. R. Lide, CRC Handbook of Chemistry and Physics, 83rd ed.�CRC Press LLC, New York, 2002�.
1. M. J. C. Van Gemert, S. L. Jacques, H. J. Sterenborg, andW. M. Star, “Skin optics,” IEEE Trans. Biomed. Eng. 36, 1146–1154 �1989�.
2. M. Bartlett and H. Jiang, “Measurement of particle size dis-tribution in multilayered skin phantoms using polarized lightspectroscopy,” Phys. Rev. E 65, 031906-1–031908 �2002�.
3. V. Sankaran, J. T. Walsh, Jr., and D. J. Maitland, “Polarizedlight propagation through tissue phantoms containing denselypacked scatterers,” Opt. Lett. 25, 239–241 �2000�.
4. K. M. Yoo and R. R. Alfano, “Time resolved depolarization of
multiple backscattered light from random media,” Phys. Lett.A 142, 531–536 �1989�.
5. R. C. N. Studinski and I. A. Vitkin, “Methodology for examin-ing polarized light interactions with tissues and tissue likemedia in the exact back scattering direction,” J. Biomed. Opt.5, 330–337 �2000�.
6. A. Myakov, L. Nieman, L. Wicky, U. Utzinger, R. R. Kortum,and K. Sokolov, “Fiber optic probe for polarized reflectancespectroscopy in vivo: design and performance,” J. Biomed.Opt. 7, 388–397 �2002�.
7. R. Drezek, A. Dunn, and R. R. Kortum, “Light scattering fromcells: finite-difference time-domain simulations and gonio-metric measurements,” Appl. Opt. 38, 3651–3661 �1999�.
8. C. F. Bohren and D. R. Huffman, Absorption and Scattering ofLight by Small Particles �Wiley, New York, 1983�.
9. J. Darnell, H. Lodish, and D. Baltimore, Molecular Cell Biol-ogy, 2nd ed. �Scientific American Books, New York, 1990�,Chap. 4, P. 144.
0. E. Kashuba, K. Mattsson, G. Klein, and L. Szekely, “pI4ARFinduces the relocation of HDM2 and p53 to extranucleolar sitesthat are targeted by PML bodies and proteasomes,” Mol. Can-cer 2�18�, 1–9 �2003�.
20 February 2004 � Vol. 43, No. 6 � APPLIED OPTICS 1307