measurement of particle-size distribution and concentration in heterogeneous turbid media with...
TRANSCRIPT

Measurement of particle-size distribution andconcentration in heterogeneous turbid media withmultispectral diffuse optical tomography
Changqing Li and Huabei Jiang
We present a method that is capable of extracting particle-size distribution (PSD) and concentration inheterogeneous turbid media by use of multispectral diffuse optical tomography (MSDOT). After thespectroscopic scattering images of the heterogeneous turbid media are obtained with MSDOT, themorphologic information of particles in the heterogeneities is recovered with an iterative regularizedreconstruction algorithm based on Mie scattering theory when a particular form of PSD is assumed(Gaussian distribution is used in this study). The method described is tested and evaluated with bothsimulated and experimental data. The simulations are intended to test the sensitivity of the overallapproach to noise effect. A series of phantom experiments are conducted with our newly developedten-wavelength MSDOT system. Polystyrene microsphere suspensions contain particles of varying sizefrom 2 to 6 �m as targets are embedded in a scattering background medium in these experiments. Toachieve optimized results from experimental data, we developed a data preprocessing method for MSDOTas well as a scheme for calibrating scattering spectra. The results from both simulations and experimentsshow that the particle mean size and concentration can be reconstructed with acceptable accuracy,whereas the recovery of the standard deviation is sensitive to noise effect and can be as large as 86% fromthe experimental data. © 2005 Optical Society of America
OCIS codes: 290.5850, 290.0290, 290.4020.
1. Introduction
Interest in diffuse optical tomography (DOT) forbreast cancer detection continues to grow rapidly ow-ing to DOT’s relatively high contrast in both tissueabsorption and scattering and to tissue functionalinformation available from MSDOT. After almost adecade-long study of this near-infrared imaging tech-nique in the laboratories, it appears that the era of itsclinical evaluation has begun.1–5 Based on tissue ab-sorption and scattering contrasts at a single wave-length, pilot clinical studies from our own group andothers have demonstrated that DOT has high sensi-tivity for breast cancer detection.1,2,4,5 In particular,we have shown that a benign fibroadenoma may bedifferentiated from malignant tumors on the basis ofthe scattering images.5 In a recent study, we pre-
sented clear evidence that cysts can be distinguishedfrom solid tumors from both absorption and scatter-ing images at a single wavelength.4 Parallel to thesingle-wavelength DOT studies, MSDOT has beenexplored for tissue functional imaging that is largelylimited to the reconstruction of hemoglobin concen-tration and water content with absorption spectra.3,6
A recent study has shown that hemoglobin concen-tration of breast cancer is consistently higher thanthat of fibroadenoma,7 whereas previous studies didnot suggest such consistency.3 Nonetheless, a full un-derstanding of the values of absorption spectra inbreast cancer detection has yet to be reached.
Scattering spectra in MSDOT have been relativelyless explored. Exploration was hampered largely bythe strong crosstalk between absorption and scatter-ing contrasts that occurred in earlier DOT recon-structions; this crosstalk was reduced or eliminatedonly recently by various image enhancementschemes.8,9 In pure optical spectroscopy studies, ithas been shown that scattering spectra are correlatedwith tissue morphology.10–13 These experimentalstudies have suggested that both nuclei and mito-chondria contribute to tissue scattering significantly.On the other hand, it is well known in pathology that
The authors are with the Department of Physics and Astronomy,Clemson University, 118 Kinard Lab, Clemson, South Carolina29634. H. Jiang’s e-mail address is [email protected].
Received 2 July 2004; revised manuscript received 27 January2005; accepted 5 December 2004.
0003-6935/05/101838-07$15.00/0© 2005 Optical Society of America
1838 APPLIED OPTICS � Vol. 44, No. 10 � 1 April 2005
tumor cells and nuclei are considerably enlarged rel-ative to normal ones.14 Thus significant clinical valuewould result from the exploration of scattering spec-tra in MSDOT. Thus far, scattering spectra in MS-DOT has been studied with a simple power law6,15
that was originated from spectroscopy studies withhomogeneous media.16–19 The advantages of thepower law are its simplicity and reasonable accuracyunder certain conditions. The disadvantage is thatthe constants in the power law have no clear physicalmeanings and that particle-size distribution (PSD)and concentration cannot be directly obtained fromthis empirical relation.
We attempt to establish a method directly based onmore rigorous Mie scattering theory for the recon-struction of PSD and concentration without the lim-itations existing in the use of the power law. We useboth simulations and phantom experiments to vali-date our method. We also describe a new, to the bestof our knowledge, scheme for optimizing the initialparameters needed for reconstructions in MSDOTand a method for calibrating the scattering spectraobtained from phantom experiments.
2. Materials and Methods
A. Inverse Algorithms
Two inverse algorithms are needed to obtain PSDand concentration with MSDOT. The first is a DOTalgorithm for the recovery of spectroscopic scatteringimages in heterogeneous turbid media. Our DOT al-gorithm, described in detail elsewhere,9,20,21 uses aregularized Newton’s method to update an initial op-tical property distribution iteratively so as to mini-mize an object function composed of a weighted sumof the squared difference between computed andmeasured optical data at the medium surface. Thecomputed optical data (i.e., photon intensity) is ob-tained by solution of the photon diffusion equationwith the finite-element method. The second algo-rithm is one that extracts the particle morphologicalinformation by use of the scattering spectra obtainedfrom the first algorithm. It casts the reconstruction asan optimization problem in which the optimizationparameters are coefficients in a probability functionsuch as a Gaussian distribution function in which apriori assumptions are used. This inverse algorithmis based on a least-squares optimization, in which thedifference between measured and computed scatter-ing spectra is iteratively minimized by adjustment ofthe optimization parameters under Mie scatteringtheory.22–25
It is known that an optimized initial optical prop-erty distribution is critical for quality image recon-struction with a DOT algorithm.9,21,26 We previouslyreported an effective preprocessing scheme for suchpurpose21; however, it requires time-consuming com-putational procedures to obtain the initial parame-ters needed for image reconstruction at a singlewavelength. Clearly, this would not be efficient forimage reconstruction at multiple wavelengths in MS-DOT. Thus we implemented an algorithm for opti-
mizing initial optical properties based on thefollowing core relation
(JTJ � �I)�� � JT(�º � �c), (1)
where
J �
�1
D�1
�a
�2
D�2
�a
······
�N
D�N
�a
, ��
� (�D, ��a), �º ���1
o
�2o
···�N
o�, �c ��
�1c
�2c
···�N
c�
�º and � c are the observed and the calculated photondensity; D and �a are the diffusion and the absorptioncoefficients, respectively; �� is the update of opticalproperties; N is the number of nodes used in thefinite-element mesh; � is a regularization parameter;and I is an identical matrix. In this algorithm, opti-mized initial optical properties are obtained by iter-ative solution of Eq. (1). Since only two variablesexist, convergence is reached quickly.
Once D�� is recovered by use of a DOT algorithm,the reduced scattering spectra can be obtained by theturbid media relation
(1 � g)�s() �1
3D(), (2)
where �1 � g��s is the reduced scattering coefficientand g is the average cosine of scattering angles. Asreported by Jiang et al.,22,24 the scattering spectra arecorrelated with PSD and concentration through therelation under Mie Theory
(1 � g)�s() � �s�()
��0
�3Qscat(x, n, )[1 � g(x, n, )]
2x
� f(x)dx, (3)
where Qscat is the scattering efficiency; x is the parti-cle size; n is the refractive index of particles; � is theparticle concentration or volume fraction; f�x� is thePSD. Both Qscat and g can be computed with MieTheory.27 In Eq. (3) we have assumed that particlesact as independent scatterers without particle–particle interaction. To solve for f�x� and � from mea-sured scattering spectra, it is necessary to obtain an
1 April 2005 � Vol. 44, No. 10 � APPLIED OPTICS 1839
inversion of Eq. (3). Our numerical inversion is basedon a Newton-type iterative scheme through least-squares minimization of the objective functional
�2 � �j�1
10
[(�s�)jo � (�s�)j
c]2, (4)
where ��s��jo and ��s��j
c are the observed and the com-puted reduced scattering coefficients at ten wave-lengths, j � 1, 2, . . ., 10 (more wavelengths can beused, depending on the number of wavelength avail-able from the experimental system). In this study forreconstruction, we have assumed a Gaussian PSD (apriori knowledge about the mode and distributionform of the particle size are usually available in apractical situation),
f(x) �1
2�b2exp �
(x � a)2
2b2 ,
where a is the average size of particles and b is thestandard deviation. Substituting above f�x� into Eq.(3), we obtain
(1 � g)�s() � �s�()
��0
�3Qscat(x, n, )[1 � g(x, n, )]
2x
� 1
(2�b2)1�2 exp �(x � a)2
2b2 dx. (5)
Now the particle-sizing task becomes to recover threeparameters a, b, and �. As described in detail in Refs.
22 and 23, we have used a combined Marquardt–Tikhonov regularization scheme to stabilize the re-construction procedure.
B. Simulations and Experiments
Simulations are used to test the sensitivity ofparticle-sizing algorithm to noise effect with reducedscattering coefficients at ten wavelengths (the num-ber of wavelength available from our imaging sys-tem). Simulated scattering spectra were generatedwith Eq. (5) when the PSD and concentration weregiven. PSD and concentration were reconstructedwith the particle-sizing algorithm when 0%, 1%, 5%,10%, and 20% noise was added to the measured scat-tering spectra.
Phantom experiments were conducted with ourten-wavelength DOT system (638, 673, 690, 733, 775,808, 840, 915, 922, and 960 nm). This newly devel-oped imaging system and its calibration have beendescribed in detail elsewhere.28,29 Briefly, light fromone of the ten laser modules is transmitted to anoptical switch, which sequentially passes it to 16 pre-selected points at the surface of the phantom for two-dimensional imaging experiments. The 16 � 16measured data are then input into our DOT recon-struction algorithm to generate a two-dimensionalcross-sectional image of the phantom. Three sets ofphantom experiments were conducted to validate theoverall approach for extracting PSD and concentra-tion by use of MSDOT. The background phantommaterials used consisted of Intralipid as the scattererand India ink as the absorber. Agar powder (1%–2%)was used to solidify the Intralipid and India ink so-lutions. The cylindrical background phantom had aradius of 25 mm, an absorption coefficient of0.005�mm, and a reduced scattering coefficient of
Table 1. Reconstructed Parameters from Simulated Data at Different Noise Levels for Simulation 1
Parameters ExactReconstructed
Results and Errors
Noise Levels
0% 1% 5% 10% 20%
� 1.02% Reconstructed 1.02% 1.05% 1.13% 1.16% 1.36%Error 0.0% 2.9% 10.8% 13.7% 33.3%
a (�m) 2.855 Reconstructed 2.85 2.94 3.27 3.36 4.14Error 0.03% 3.0% 14.6% 17.6% 44.9%
b (�m) 0.145 Reconstructed 0.14 0.17 0.29 0.01 0.01Error 0.7% 17.9% 100% 93.1% 93.1%
Table 2. Reconstructed Parameters from Simulated Data at Different Noise Levels for Simulation 2
Parameters ExactReconstructed
Results and Errors
Noise Levels
0% 1% 5% 10% 20%
� 5.0% Reconstructed 5.0% 5.02% 4.89% 5.37% 26.4%Error 0.0% 0.40% 2.20% 7.40% 21.8%
a (�m) 10.0 Reconstructed 10.0 10.05 10.07 10.74 7.98Error 0.0% 0.50% 0.70% 7.40% 20.2%
b (�m) 0.3 Reconstructed 0.30 0.44 0.59 0.043 0.023Error 0.0% 46.7% 96.6% 85.7% 92.3%
1840 APPLIED OPTICS � Vol. 44, No. 10 � 1 April 2005
1.0�mm. A thin glass tube (9 mm in inner diameter,0.4 mm in thickness) containing polystyrene suspen-sions (Polysciences, Warrington, Philadelphia) wasembedded off-center in the background solid phan-tom. Three different types of polystyrene sphereswere used in the three experiments: 2.06 �m in di-ameter, 0.02 �m in standard deviation, and 0.52% inconcentration for Case 1; 2.85 �m in diameter,0.14 �m in standard deviation, and 1.02% in concen-tration for Case 2; 5.66 �min diameter, 0.30 �m instandard deviation, and 2.62% in concentration forCase 3. The refractive index of the spheres and theirsurrounding aqueous medium are 1.59 and 1.33, re-spectively.
3. Results
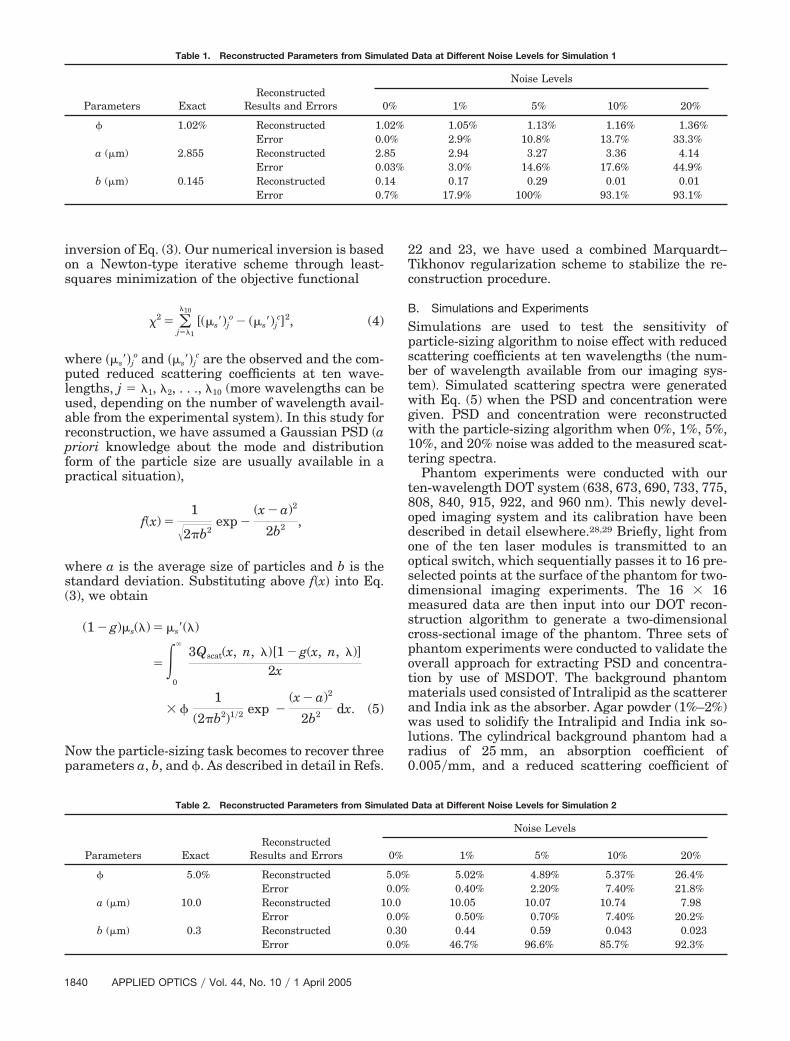
Results from two simulations are displayed in Tables1 and 2. From simulation 1 for a particle diameter of2.855 �m, we see that both the mean size and theconcentration of particles can be recovered accuratelywith up to 20% noise; the relative errors of recon-struction of these two parameters were calculated tobe within 3.044.9% and 2.933.3%, given the noiselevels used. We also note that the recovery of thestandard deviation is quite sensitive to noise effect:the relative error is as large as 100%. From simula-tion 2 for a particle diameter of 10.0 �m, the relativeerrors of reconstructed parameters a and � arewithin 0.520.2% and 0.421.8%, respectively,given the noise levels used. Similarly we see that thestandard deviation recovery is sensitive to the noiselevels and that the relative errors are as much as96.6%. Overall, the extraction of particle concentra-tion is least sensitive to noise effect. Using these re-constructed parameters at different noise levels, wecalculated the scattering spectra using Eq. (5) forsimulation 1 and present them in Fig. 1.
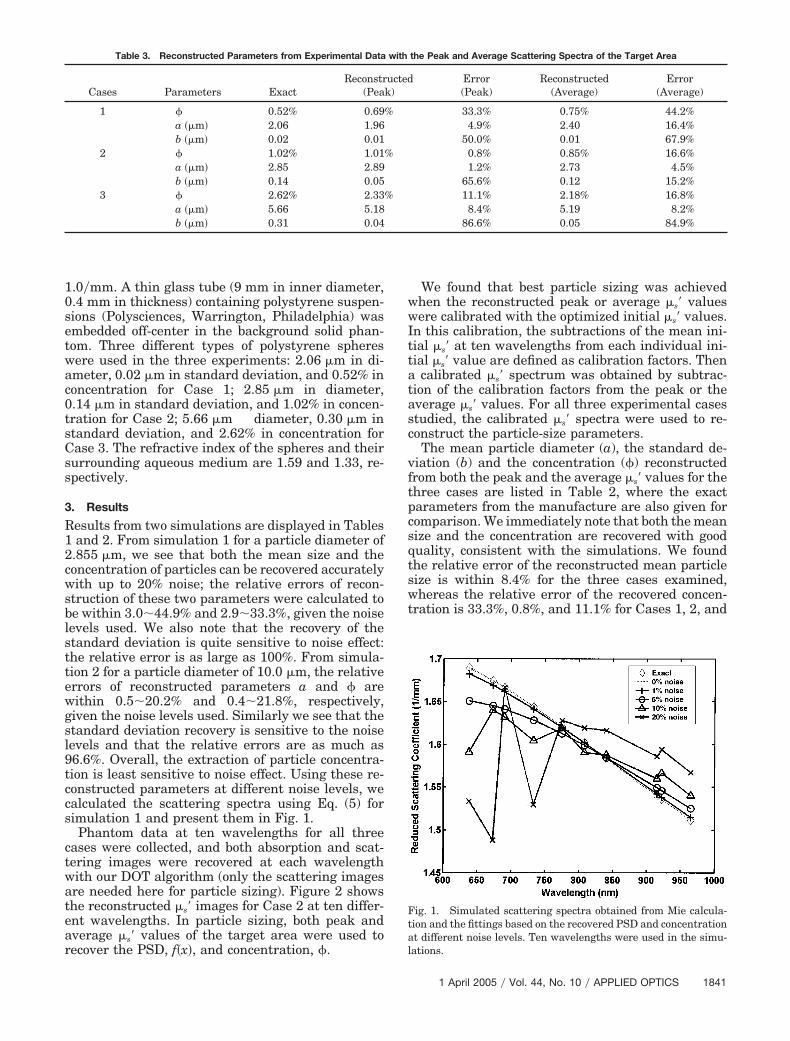
Phantom data at ten wavelengths for all threecases were collected, and both absorption and scat-tering images were recovered at each wavelengthwith our DOT algorithm (only the scattering imagesare needed here for particle sizing). Figure 2 showsthe reconstructed �s� images for Case 2 at ten differ-ent wavelengths. In particle sizing, both peak andaverage �s� values of the target area were used torecover the PSD, f�x�, and concentration, �.
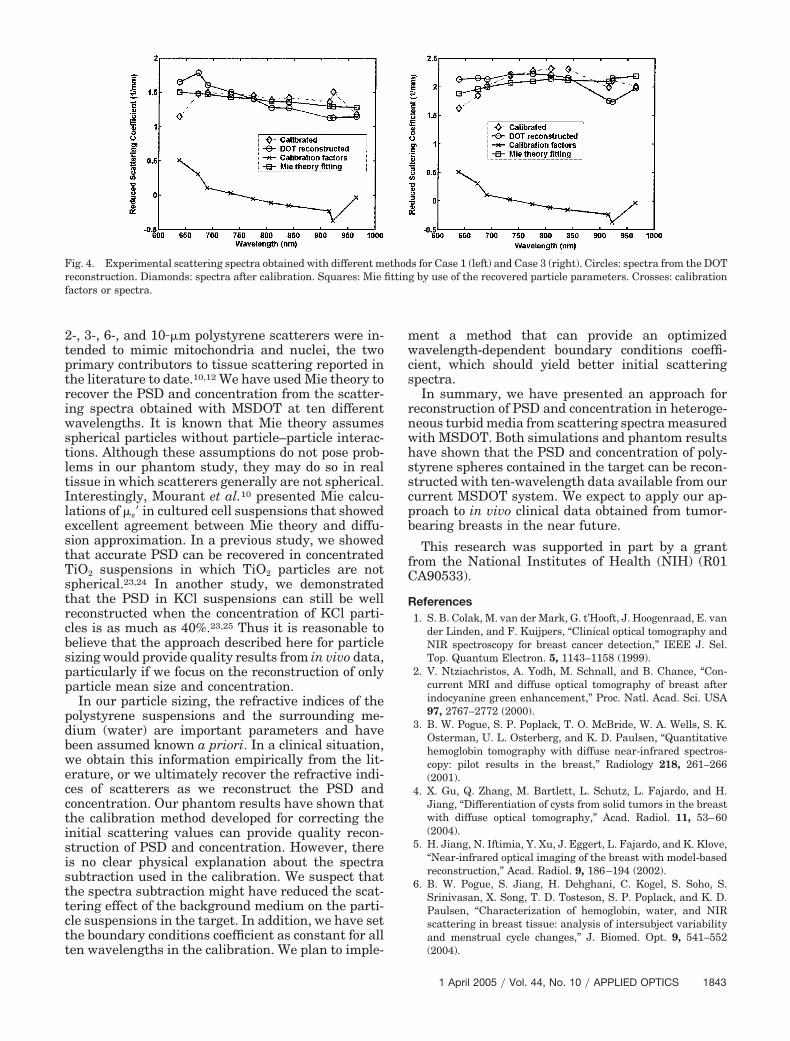
We found that best particle sizing was achievedwhen the reconstructed peak or average �s� valueswere calibrated with the optimized initial �s� values.In this calibration, the subtractions of the mean ini-tial �s� at ten wavelengths from each individual ini-tial �s� value are defined as calibration factors. Thena calibrated �s� spectrum was obtained by subtrac-tion of the calibration factors from the peak or theaverage �s� values. For all three experimental casesstudied, the calibrated �s� spectra were used to re-construct the particle-size parameters.
The mean particle diameter (a), the standard de-viation (b) and the concentration (�) reconstructedfrom both the peak and the average �s� values for thethree cases are listed in Table 2, where the exactparameters from the manufacture are also given forcomparison. We immediately note that both the meansize and the concentration are recovered with goodquality, consistent with the simulations. We foundthe relative error of the reconstructed mean particlesize is within 8.4% for the three cases examined,whereas the relative error of the recovered concen-tration is 33.3%, 0.8%, and 11.1% for Cases 1, 2, and
Table 3. Reconstructed Parameters from Experimental Data with the Peak and Average Scattering Spectra of the Target Area
Cases Parameters ExactReconstructed
(Peak)Error(Peak)
Reconstructed(Average)
Error(Average)
1 � 0.52% 0.69% 33.3% 0.75% 44.2%a ��m� 2.06 1.96 4.9% 2.40 16.4%b ��m� 0.02 0.01 50.0% 0.01 67.9%
2 � 1.02% 1.01% 0.8% 0.85% 16.6%a ��m� 2.85 2.89 1.2% 2.73 4.5%b ��m� 0.14 0.05 65.6% 0.12 15.2%
3 � 2.62% 2.33% 11.1% 2.18% 16.8%a ��m� 5.66 5.18 8.4% 5.19 8.2%b ��m� 0.31 0.04 86.6% 0.05 84.9%
Fig. 1. Simulated scattering spectra obtained from Mie calcula-tion and the fittings based on the recovered PSD and concentrationat different noise levels. Ten wavelengths were used in the simu-lations.
1 April 2005 � Vol. 44, No. 10 � APPLIED OPTICS 1841
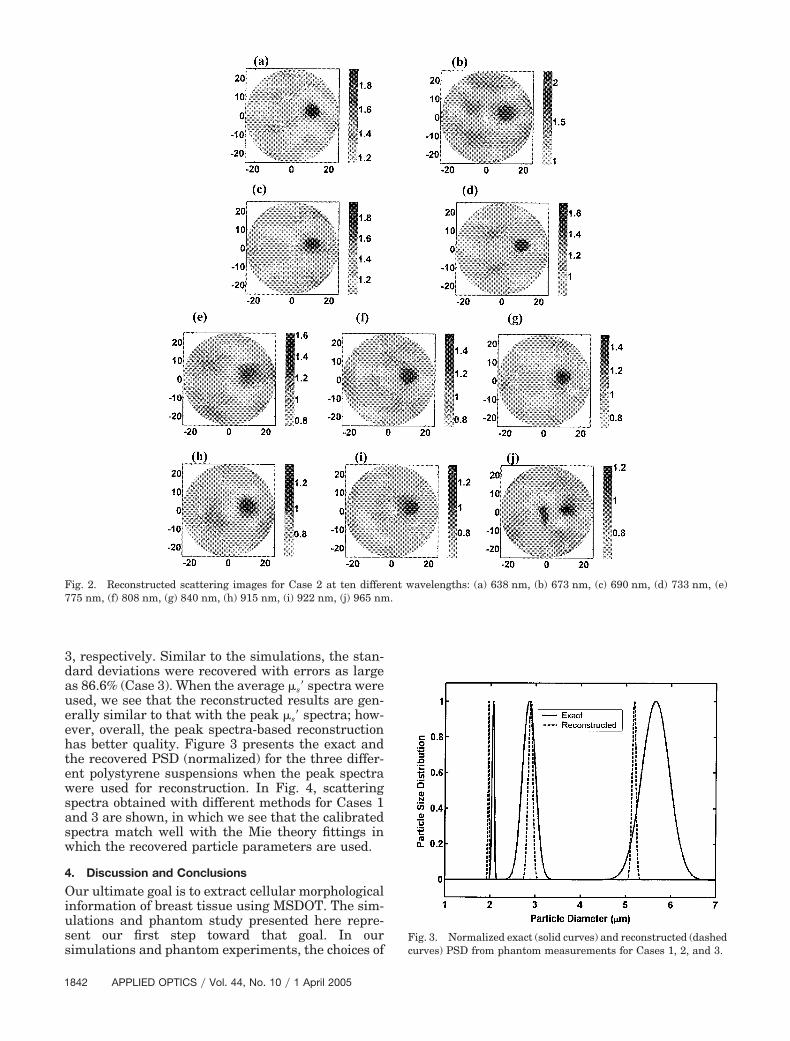
3, respectively. Similar to the simulations, the stan-dard deviations were recovered with errors as largeas 86.6% (Case 3). When the average �s� spectra wereused, we see that the reconstructed results are gen-erally similar to that with the peak �s� spectra; how-ever, overall, the peak spectra-based reconstructionhas better quality. Figure 3 presents the exact andthe recovered PSD (normalized) for the three differ-ent polystyrene suspensions when the peak spectrawere used for reconstruction. In Fig. 4, scatteringspectra obtained with different methods for Cases 1and 3 are shown, in which we see that the calibratedspectra match well with the Mie theory fittings inwhich the recovered particle parameters are used.
4. Discussion and Conclusions
Our ultimate goal is to extract cellular morphologicalinformation of breast tissue using MSDOT. The sim-ulations and phantom study presented here repre-sent our first step toward that goal. In oursimulations and phantom experiments, the choices of
Fig. 2. Reconstructed scattering images for Case 2 at ten different wavelengths: (a) 638 nm, (b) 673 nm, (c) 690 nm, (d) 733 nm, (e)775 nm, (f) 808 nm, (g) 840 nm, (h) 915 nm, (i) 922 nm, (j) 965 nm.
Fig. 3. Normalized exact (solid curves) and reconstructed (dashedcurves) PSD from phantom measurements for Cases 1, 2, and 3.
1842 APPLIED OPTICS � Vol. 44, No. 10 � 1 April 2005
2-, 3-, 6-, and 10��m polystyrene scatterers were in-tended to mimic mitochondria and nuclei, the twoprimary contributors to tissue scattering reported inthe literature to date.10,12 We have used Mie theory torecover the PSD and concentration from the scatter-ing spectra obtained with MSDOT at ten differentwavelengths. It is known that Mie theory assumesspherical particles without particle–particle interac-tions. Although these assumptions do not pose prob-lems in our phantom study, they may do so in realtissue in which scatterers generally are not spherical.Interestingly, Mourant et al.10 presented Mie calcu-lations of �s� in cultured cell suspensions that showedexcellent agreement between Mie theory and diffu-sion approximation. In a previous study, we showedthat accurate PSD can be recovered in concentratedTiO2 suspensions in which TiO2 particles are notspherical.23,24 In another study, we demonstratedthat the PSD in KCl suspensions can still be wellreconstructed when the concentration of KCl parti-cles is as much as 40%.23,25 Thus it is reasonable tobelieve that the approach described here for particlesizing would provide quality results from in vivo data,particularly if we focus on the reconstruction of onlyparticle mean size and concentration.
In our particle sizing, the refractive indices of thepolystyrene suspensions and the surrounding me-dium (water) are important parameters and havebeen assumed known a priori. In a clinical situation,we obtain this information empirically from the lit-erature, or we ultimately recover the refractive indi-ces of scatterers as we reconstruct the PSD andconcentration. Our phantom results have shown thatthe calibration method developed for correcting theinitial scattering values can provide quality recon-struction of PSD and concentration. However, thereis no clear physical explanation about the spectrasubtraction used in the calibration. We suspect thatthe spectra subtraction might have reduced the scat-tering effect of the background medium on the parti-cle suspensions in the target. In addition, we have setthe boundary conditions coefficient as constant for allten wavelengths in the calibration. We plan to imple-
ment a method that can provide an optimizedwavelength-dependent boundary conditions coeffi-cient, which should yield better initial scatteringspectra.
In summary, we have presented an approach forreconstruction of PSD and concentration in heteroge-neous turbid media from scattering spectra measuredwith MSDOT. Both simulations and phantom resultshave shown that the PSD and concentration of poly-styrene spheres contained in the target can be recon-structed with ten-wavelength data available from ourcurrent MSDOT system. We expect to apply our ap-proach to in vivo clinical data obtained from tumor-bearing breasts in the near future.
This research was supported in part by a grantfrom the National Institutes of Health (NIH) (R01CA90533).
References1. S. B. Colak, M. van der Mark, G. t’Hooft, J. Hoogenraad, E. van
der Linden, and F. Kuijpers, “Clinical optical tomography andNIR spectroscopy for breast cancer detection,” IEEE J. Sel.Top. Quantum Electron. 5, 1143–1158 (1999).
2. V. Ntziachristos, A. Yodh, M. Schnall, and B. Chance, “Con-current MRI and diffuse optical tomography of breast afterindocyanine green enhancement,” Proc. Natl. Acad. Sci. USA97, 2767–2772 (2000).
3. B. W. Pogue, S. P. Poplack, T. O. McBride, W. A. Wells, S. K.Osterman, U. L. Osterberg, and K. D. Paulsen, “Quantitativehemoglobin tomography with diffuse near-infrared spectros-copy: pilot results in the breast,” Radiology 218, 261–266(2001).
4. X. Gu, Q. Zhang, M. Bartlett, L. Schutz, L. Fajardo, and H.Jiang, “Differentiation of cysts from solid tumors in the breastwith diffuse optical tomography,” Acad. Radiol. 11, 53–60(2004).
5. H. Jiang, N. Iftimia, Y. Xu, J. Eggert, L. Fajardo, and K. Klove,“Near-infrared optical imaging of the breast with model-basedreconstruction,” Acad. Radiol. 9, 186–194 (2002).
6. B. W. Pogue, S. Jiang, H. Dehghani, C. Kogel, S. Soho, S.Srinivasan, X. Song, T. D. Tosteson, S. P. Poplack, and K. D.Paulsen, “Characterization of hemoglobin, water, and NIRscattering in breast tissue: analysis of intersubject variabilityand menstrual cycle changes,” J. Biomed. Opt. 9, 541–552(2004).
Fig. 4. Experimental scattering spectra obtained with different methods for Case 1 (left) and Case 3 (right). Circles: spectra from the DOTreconstruction. Diamonds: spectra after calibration. Squares: Mie fitting by use of the recovered particle parameters. Crosses: calibrationfactors or spectra.
1 April 2005 � Vol. 44, No. 10 � APPLIED OPTICS 1843
7. Q. Zhu, E. Cronin, S. Hurtzman, N. Chen, M. Huang, and C.Xu, “Benign versus malignant breast masses: optical differen-tiation with US localization,” in Biomedical Topical Meeting onCD-ROM (Optical Society of America, Washington, DC, 2004),paper WA6.
8. T. O. McBride, B. W. Pogue, S. Jiang, U. L. Sterberg, K. D.Paulsen, and S. P. Poplack, “Initial studies of in vivo absorbingand scattering heterogeneity in near-infrared tomographicbreast imaging,” Opt. Lett. 26, 822–824 (2001).
9. Y. Xu, X. Gu, T. Khan, and H. Jiang, “Absorption and scatter-ing images of heterogeneous scattering media can be simulta-neously reconstructed by use of dc data,” Appl. Opt. 41, 5427–5437 (2002).
10. J. R. Mourant, A. H. Hielscher, A. A. Eick, T. M. Johnson, andJ. P. Freyer, “Evidence of intrinsic differences in the lightscattering properties of tumorigenic and nontumorigeniccells,” Cancer Cytopathol. 84, 366–374 (1998).
11. B. Beauvoit, H. Liu, K. Kang, P. D. Kaplan, M. Miwa, and B.Chance, “Characterization of absorption and scattering prop-erties of various yeast strains by time-resolved spectroscopy,”Cell Biophys. 23, 91–109 (1993).
12. L. T. Perelman, V. Backman, M. Wallace, G. Zonios, R. Mano-haran, A. Nusrat, S. Shields, M. Seiler, C. Lima, T. Hamano, I.Itzkan, J. Van Dam, J. M. Crawford, and M. S. Feld, “Obser-vation of periodic fine structure in reflectance from biologicaltissue: a new technique for measuring nuclear size distribu-tion,” Phys. Rev. Lett. 80, 627–630 (1998).
13. A. E. Cerussi, D. Jakubowski, N. Shah, F. Bevilacqua, R. Lan-ning, A. J. Berger, D. Hsiang, J. Butler, R. F. Holcombe, and B.J. Tromberg, “Spectroscopy enhances the information contentof optical mammography,” J. Biomed. Opt. 7, 60–71 (2002).
14. R. S. Cotran, S. Robbins, and V. Kumar, Robbins PathologicalBasis of Disease (W. B. Saunders, Philadelphia, 1994).
15. A. Corlu, T. Durduran, R. Choe, M. Schweiger, E. M. C. Hill-man, S. R. Arridge, and A. G. Yodh, “Uniqueness and wave-length optimization in continuous-wave multispectral diffuseoptical tomography,” Opt. Lett. 28, 2339–2341 (2003).
16. R. Graaff, J. G. Aarnoudse, J. R. Zijp, P. M. A. Sloot, F. F. M.de Mul, J. Greve, and M. H. Koelink, “Reduced light-scatteringproperties for mixtures of spherical particles: a simple approx-imation derived from Mie calculations,” Appl. Opt. 31, 1370–1376 (1992).
17. J. R. Mourant, T. Fuselier, J. Boyer, T. M. Johnson, and I. J.Bigio, “Predictions and measurements of scattering and ab-sorption over broad wavelength ranges in tissue phantoms,”Appl. Opt. 36, 949–957 (1997).
18. A. M. K. Nilsson, C. Sturesson, D. L. Liu, and S. Andersson-Engels, “Changes in spectral shape of tissue optical propertiesin conjunction with laser-induced thermotherapy,” Appl. Opt.37, 1256–1267 (1998).
19. M. Johns and H. Liu, “Limited possibility for quantifying meanparticle size by logarithmic light-scattering spectroscopy,”Appl. Opt. 42, 2968–2671 (2003).
20. K. D. Paulsen and H. Jiang, “Spatially varying optical propertyreconstruction using a finite element diffusion equation ap-proximation,” Med. Phys. 22, 691–701 (1995).
21. N. Iftimia and H. Jiang, “Quantitative optical image recon-struction of turbid media by use of direct-current measure-ments,” Appl. Opt. 39, 5256–5261 (2000).
22. H. Jiang, J. Pierce, J. Kao, and E. Sevick-Muraca, “Measure-ment of particle-size distribution and volume fraction in con-centrated suspensions with photon migration techniques,”Appl. Opt. 36, 3310–3318 (1997).
23. H. Jiang, “Enhanced photon migration methods for particlesizing in concentrated suspensions,” AIChE J. 44, 1740–1744(1998).
24. H. Jiang, G. Marquez, and L. Wang, “Particle sizing in con-centrated suspensions using steady-state, continuous-wavephoton migration techniques,” Opt. Lett. 23, 394–396 (1998).
25. M. Bartlett and H. Jiang, “Measurement of particle size dis-tribution in concentrated, rapidly flowing potassium chloride(KCl) suspensions using continuous-wave photon migrationtechniques,” AIChE J. 47, 60–65 (2001).
26. X. Gu, Y. Xu, and H. Jiang, “Mesh-based enhancementschemes in diffuse optical tomography,” Med. Phys. 30, 861–869 (2003).
27. G. F. Bohren and D. R. Hoffman, Absorption and Scattering ofLight by Small Particles (Wiley, New York, 1983).
28. C. Li and H. Jiang, “A calibration method in diffuse opticaltomography,” J. Opt. A: Pure Appl. Opt. 6, 844–852 (2004).
29. C. Li, H. Zhao, and H. Jiang, “A multispectral three-dimensional diffuse optical mammography system,” in Bio-medical Topical Meeting on CD-ROM (Optical Society ofAmerica, Washington, DC, 2004), paper WF19.
1844 APPLIED OPTICS � Vol. 44, No. 10 � 1 April 2005