measurement of high- frequency noise emitted by …€¦ · 4.6 calibration of measurement system 3...
TRANSCRIPT
ECMA-108 4th Edition / December 2008
Measurement of High-frequency Noise emitted by Information Technology and Telecommunications Equipment

COPYRIGHT PROTECTED DOCUMENT
© Ecma International 2008
Ecma International Rue du Rhône 114 CH-1204 Geneva T/F: +41 22 849 6000/01 www.ecma-international.org
PC ECMA-108.doc 12.11.2008 10:20:00
Measurement of High-frequency Noise emitted by Information Technology and Telecommunications Equipment
Standard ECMA-108 4th Edition / December 2008

.

Introduction
In September 1981 Ecma issued Standard ECMA-74 for the Measurement of Airborne Noise Emitted by Computer and Business Equipment. This Standard was contributed to ISO/TC 43; it formed the basis for International Standard ISO 7779. ECMA-74 and ISO 7779 are newly revised and have expanded scope to cover all information technology and telecommunications equipment.
This Standard ECMA-108 specifies methods for the determination of the sound power levels in the frequency range covered by the octave band centred at 16 kHz.
Some information and telecommunications equipment emits high-frequency noise which may be broad-band noise (e.g. paper noise of high-speed printing) or narrow-band noise and discrete tones (e.g. noise of switching power supplies and video display units). The measured levels are not frequency-weighted. The principal objective of this Standard is to prescribe methods for measuring the levels and frequencies of tones which are contained within the 16 kHz octave band.
The first edition of this Ecma Standard was published in December 1986. It has been adopted by ISO under the fast-track procedure as International Standard ISO 9295. The text of the second edition of Standard ECMA-108 has been adapted to the final wording of ISO 9295:1988. The text of the third edition of this Standard has been adapted to eliminate ambiguity in the determination of the A-weighted sound power levels of sounds that contain contributions in the octave band centred at 16 kHz, and to align with the fourth edition of ECMA-74 (1996). Like ECMA-74, the scope of ECMA-108 now covers all information technology and telecommunications equipment.
The fourth edition of this Ecma Standard was published in December 2008. The primary change is to incorporate changes in the tenth edition of ECMA-74, which limits the frequency range of interest for determining A-weighted sound power levels to one-third-octave bands with center frequencies from 100 Hz to 10 000 Hz. With the fourth edition of ECMA-108, noise in the 16 kHz octave band is no longer used to determine overall A-weighted sound power level of the unit under test; only contributions in the 100 Hz – 10 000 Hz one-third-octave bands determined according to the tenth edition of ECMA-74 are used to determine A-weighted sound power level.
This Ecma Standard has been adopted by the General Assembly of December 2008.


Table of contents
1 Scope 1
2 Conformance 1
3 References 1
4 Requirements for measurements in a reverberation test room 1
4.1 General 1
4.2 Meteorological condi t ions 1
4.3 Instrumentat ion 2
4.4 Instal lat ion and or ientat ion of microphone 2
4.5 Instal lat ion and or ientat ion of equipment 2
4.6 Cal ibrat ion of measurement system 3
4.7 Measurement of sound pressure level 3
5 Method using measured reverberation t ime 4
5.1 General 4
5.2 Measurement of reverberat ion t ime 4
5.3 Calculat ion of room absorpt ion 4
5.4 Instal lat ion of microphone and equipment 5
5.5 Measurement of sound pressure level 5
5.6 Calculat ion of sound power level 5
6 Method using calculated air absorption 5
6.1 General 5
6.2 Calculat ion of room constant 6
6.3 Instal lat ion of microphone and equipment 6
6.4 Measurement of sound pressure level 6
6.5 Calculat ion of sound power level 7
7 Method using a reference sound source 7
7.1 Reference sound source 7
7.2 Instal lat ion of microphone and equipment 7
7.3 Instal lat ion of reference sound source 7
7.4 Measurement of sound pressure level 7
7.5 Calculat ion of sound power level 7 7.5.1 Equipment emit t ing broad-band noise 7
- i -
- ii -
7.5.2 Equipment emit t ing discrete f requency tone(s) 8
8 Method using a free f ield over a ref lecting plane 8
8.1 General 8
8.2 Meteorological condi t ions 8
8.3 Instrumentat ion 9
8.4 Instal lat ion and or ientat ion of microphone 9
8.5 Instal lat ion of equipment 9
8.6 Cal ibrat ion of measurement system 9
8.7 Measurement of sound pressure level 10
8.8 Calculat ion of surface sound pressure level and sound power level 10
9 Information to be recorded 10
9.1 Equipment under test 10
9.2 Acoust ic environment 10
9.3 Instrumentat ion 11
9.4 Acoust ical data 11
10 Information to be reported 11
Annex A (normative) Coaxial circular paths in paral lel planes for microphone traverses in a free f ield over a ref lecting plane 13
Annex B (normative) Calculation of air absorption coeff icient 15
1 Scope This Standard ECMA-108 specifies four methods for the determination of the sound power levels of high-frequency noise emitted by information technology and telecommunications equipment in the frequency range covered by the octave band centred at 16 kHz, which includes frequencies between 11,2 kHz and 22,4 kHz. They are complementary to the methods described in Standard ECMA-74. The first three methods are based on the reverberation test room technique. The fourth method makes use of a free field over a reflecting plane.
The test conditions which prescribe the installation and operation of the equipment are those specified in ECMA-74.
While the four methods described in this Standard are particularly suitable for information technology and telecommunications equipment, they may also be applied to other types of equipment. NOTE The sound power level in the 16 kHz octave band determined according to this Standard typically is subject to a standard deviation of approximately 3 dB.
2 Conformance A method for the measurement of high-frequency noise is in conformance with this Standard if it satisfies all the mandatory requirements of one of the four methods described herein and if the information recorded and reported is that specified in clauses 10 and 11, respectively.
3 References ECMA-74 Measurement of Airborne Noise Emitted by Information Technology and
Telecommunications Equipment (2008)
ISO 6926:1999 Acoustics -- Requirements for the performance and calibration of reference sound sources used for the determination of sound power levels
4 Requirements for measurements in a reverberation test room
4.1 General Three methods are described using the reverberation test room technique of Standard ECMA-74. The first and the second method are usually called "direct methods” because they use directly measured or calculated reverberation times. The third method is a so-called “comparison method”. A calibrated reference sound source is used from which the sound power levels of the equipment are determined by comparison.
All three methods require a determination of the average sound pressure level in the reverberant field.
As instrumentation and basic measurement techniques are the same for all three methods, they are summarized in 4.3 to 4.7 below. Additional requirements specific to each method are given separately. For additional information on instrumentation, see ECMA-74.
4.2 Meteorological conditions The air absorption in the reverberation test room varies with temperature and humidity, particularly at frequencies above 1 000 Hz. The temperature θ in °C and the relative humidity hr, expressed as a percentage, shall be controlled during the sound pressure level measurements.
The product hr × (θ + 5) shall not vary by more than ± 10 % during the measurements.
For equipment whose noise emissions vary with ambient temperature in a deliberate manner (e.g., by varying the speeds of air moving devices), the room temperature during the test measurement
- 1 -

shall be 23 °C ± 2 °C or, if the room temperature is outside these limits, then the fan shall be adjusted to the speed for an ambient temperature of 23 °C ± 2 °C.
The following conditions are recommended:
− Barometric pressure : 86 kPa to 106 kPa − Temperature : 15 °C to 30 °C − Relative humidity : 40 % to 70 %
4.3 Instrumentation The microphone shall have a flat frequency response for randomly incident sound in the 16 kHz octave band. The tolerances shall be within ± 2,0 dB in the frequency range 11,2 kHz to 22,4 kHz. NOTE To meet this requirement a microphone with a diameter of 13 mm or less is usually required.
When the noise of the equipment under test is broad-band in character, an analyser with a bandwidth of one-third-octave or less shall be used. When the noise of the equipment under test contains discrete frequencies, a narrow-band analyser which provides bandwidths of less than one-third-octave in width shall be used to determine the frequency of the tone(s) and to enhance the signal-to-noise ratio. NOTE For narrow-band analysis, an analyser with a bandwidth equal to, or less than, one twelfth octave is appropriate. Digital analysers using fast Fourier transform (FFT) or equivalent techniques may be useful, particularly when the analyser combines narrow-band analysis and averaging.
4.4 Installation and orientation of microphone The microphone shall be mounted at the end of a rotating boom traversing a circle with a diameter of at least 2 m. In order to reduce the influence of the direct field on the measured sound pressure level, the microphone shall be mounted pointing in such a way that the normal to its diaphragm is parallel to the axis of rotation and the microphone faces away from the equipment under test. The period of rotation shall be at least 30 s.
Longer paths and traversing periods than the minimum values may be used to reduce the background noise of the drive mechanism, and to minimize modulation of any discrete tone(s) due to the moving microphone.
Care shall be taken to ensure that there is no electrical pick-up by the measurement instrumentation which would interfere with the sound pressure level measurement. NOTE A test with a dummy microphone, and with the equipment under test in operation, is recommended to determine the electrical background level.
4.5 Installation and orientation of equipment Place the equipment on the floor of the reverberation test room, at least 1 m from any wall, and at least 1,8 m from the point of closest approach of the microphone.
Four orientations of the equipment shall be used as follows:
− Operator side facing the centre of the microphone path;
− Equipment turned clockwise by 90° from its initial position about a vertical axis through its centre;
− Equipment turned clockwise by 180°;
− Equipment turned clockwise by 270°.
Alternatively, place the equipment on a turntable and revolve it during the measurements. The motion of the turntable shall not be synchronous with the rotation of the microphone boom.
- 2 -
4.6 Calibration of measurement system Before the measurement of the equipment noise, the measurement set-up shall be calibrated in accordance with 6.4.6 of ECMA-74. Calibration at a single frequency is sufficient if the frequency response of the entire system, including the frequency range of the 16 kHz octave band is checked at intervals of not more than two years.
If an FFT analyser is calibrated with a single-frequency calibrator, care shall be taken to have all major sideband levels included in the calibration level.
4.7 Measurement of sound pressure level The sound pressure level is measured in one-third-octave bands or, if discrete tones are present, in narrow bands which include the discrete tones. Measurements of the sound pressure level along the circular microphone path shall be carried out for each frequency band within the frequency range of interest. The following data shall be obtained:
a) the band sound pressure level with the equipment in operation;
b) the band sound pressure levels of the background noise (including noise produced by ancillary equipment, if any);
c) the band sound pressure levels of the reference sound source (if required: see 7).
True integration-averaging during a full sweep of the microphone is the preferred method. When using a narrow-band analyser that performs the analysis in consecutive time periods, each time period shall correspond to one revolution. The influence of measurement duration and corrections for background noise shall be taken into account in accordance with 6.7.2 and 6.7.3 of ECMA-74, respectively.
When FFT analysers are used, the analysis time is typically greater than the individual time window. For this reason, the total measurement time shall be increased, or individual measurements shall be repeated for three revolutions of the boom, each for a different starting point.
The average value Lp of N measurements of the sound pressure level shall be calculated using equation
⎥⎥⎦
⎤
⎢⎢⎣
⎡= ∑
=
N
i
Lp
i
NL
1
1,0101lg10 (1)
where Li is the band sound pressure level, in decibels (reference 20 μPa) for the i-th measurement.
For the four orientations of the equipment under test, the average value of is obtained with
N = 4. For the three revolutions of the boom, is obtained using N = 3. pL
pL
When a discrete tone is analysed, the moving microphone distributes the energy of the tone into sidebands of the tone frequency. In order to obtain the total tone level, the analyser bandwidth shall not be less than
cvff 2=Δ (2)
where
Δf is the minimum value of the analyser bandwidth, in hertz;
f is the centre frequency of the tone, in hertz;
c is the speed of sound, in metres per second;
v is the speed of the traversing microphone, in metres per second.
When using FFT or equivalent techniques for the analysis of the discrete tone(s), the bandwidth may be significantly narrower than given above. In this case, the levels in the sidebands adjacent
- 3 -

to the tone centre frequency which contribute to the tone level shall be added on an energy basis to obtain the total tone level using equation
∑=
=N
i
LiL1
1,0tot 10lg10 (3)
where
Ltot is the total sound pressure level of the tone, in decibels (reference: 20 μPa);
Li is the sound pressure level in an individual band, in decibels (reference: 20 μPa);
N is the number of sideband levels to be combined.
5 Method using measured reverberation time
5.1 General A basic assumption of this method is that the reverberant component dominates the sound field at the microphone positions. Experiments show that in the 16 kHz octave band, the direct field may still be present. However, the microphone orientation specified in 4.4 significantly reduces the direct field contribution, and, therefore, the measured sound pressure level is determined by the reverberant field. From the measured reverberation time which is determined by the absorption in air and by the room surfaces, the total room absorption is calculated. Although air absorption is the major part of the two, wall absorption may contribute to the total room absorption. At frequencies above 10 kHz, the absorption coefficient of the room, α , cannot be considered small compared to unity. Therefore, the Eyring equation (see equation (4)) shall be used for the calculation of the room absorption instead of the simpler Sabine equation.
5.2 Measurement of reverberation time The reverberation time, T, in seconds, of the reverberation test room with the equipment under test present shall be determined in those one-third-octave bands with centre frequencies between 12,5 kHz and 20 kHz which are of interest for the measurement of the equipment noise. When the equipment under test emits discrete tones, the reverberation time shall be measured at those frequencies in narrower bands, e.g. in one-twelfth octave bands. For each frequency band of interest, the average value of the reverberation times measured at three or more locations, equally spaced on the microphone path, shall be determined. The response time of the measuring instrument (e.g. a level recorder) shall be such that reverberation times shorter than 0,7 s can be measured.
5.3 Calculation of room absorption The room constant R for each band is calculated from the measured reverberation time as follows:
αα
-1= ⋅SR (4)
)TSV ⋅⋅−−= ( /0,16e1α (5)
where
S is the total surface area of the room, in square metres;
V is the volume of the room, in cubic metres;
T is the measured average reverberation time, in seconds;
α is the absorption coefficient of the room.
- 4 -
5.4 Installation of microphone and equipment The microphone and the equipment under test shall be installed as described in 4.4 and 4.5, respectively.
5.5 Measurement of sound pressure level Before the measurement of the equipment noise, the measurement set-up shall be calibrated as described in 4.6. The average sound pressure level, , shall be measured as described in 4.7. When the noise of the equipment under test is broad-band in character, a one-third-octave band analyser shall be used. When the noise of the equipment under test contains discrete frequencies, a narrow-band analyser providing analysis bandwidths of less than one-third-octave in width shall be used if the frequency of the tone is to be determined and/or when multiple tones are present.
pL
5.6 Calculation of sound power level The sound power level of the equipment shall be calculated in each band of interest from equation
RLL pW
4lg10−= (6)
where
WL is the band sound power level of the equipment in decibels (reference: 1 pW);
pL is the average band sound pressure level for the four orientations of the equipment under
test, in decibels(reference: 20 μPa), measured in accordance with 5.5;
R is the room constant in accordance with 5.3.
6 Method using calculated air absorption
6.1 General The basic assumption of this method is that the reverberant component dominates the sound field at the microphone positions. Experiments show that in the 16 kHz octave band the direct field may still be present. However, the microphone orientation specified in 4.4 significantly reduces the direct field contribution and, therefore, the measured sound pressure level is determined by the reverberant field. Furthermore, it is assumed that the total room absorption is due only to the absorption in air. Therefore, this method is a simplification of the method described in 5.3 and avoids the measurement of the reverberation time. The room absorption is directly calculated from the air absorption coefficient given in Table 1. The equations for calculating the air absorption coefficient are given in Annex B.
- 5 -
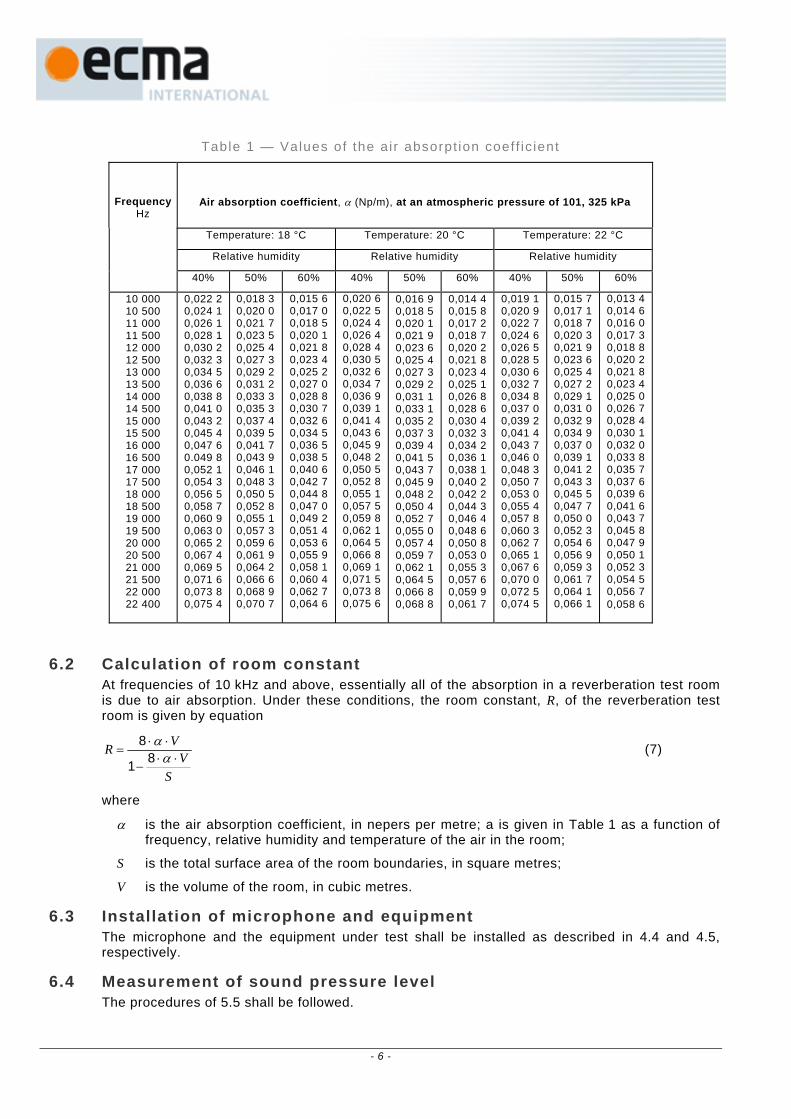
Table 1 — Values of the air absorpt ion coeff ic ient
Frequency Hz
Air absorption coefficient, α (Np/m), at an atmospheric pressure of 101, 325 kPa
Temperature: 18 °C Temperature: 20 °C Temperature: 22 °C
Relative humidity Relative humidity Relative humidity
40% 50% 60% 40% 50% 60% 40% 50% 60%
10 000 10 500 11 000 11 500 12 000 12 500 13 000 13 500 14 000 14 500 15 000 15 500 16 000 16 500 17 000 17 500 18 000 18 500 19 000 19 500 20 000 20 500 21 000 21 500 22 000 22 400
0,022 2 0,024 1 0,026 1 0,028 1 0,030 2 0,032 3 0,034 5 0,036 6 0,038 8 0,041 0 0,043 2 0,045 4 0,047 6 0.049 8 0,052 1 0,054 3 0,056 5 0,058 7 0,060 9 0,063 0 0,065 2 0,067 4 0,069 5 0,071 6 0,073 8 0,075 4
0,018 3 0,020 0 0,021 7 0,023 5 0,025 4 0,027 3 0,029 2 0,031 2 0,033 3 0,035 3 0,037 4 0,039 5 0,041 7 0,043 9 0,046 1 0,048 3 0,050 5 0,052 8 0,055 1 0,057 3 0,059 6 0,061 9 0,064 2 0,066 6 0,068 9 0,070 7
0,015 6 0,017 0 0,018 5 0,020 1 0,021 8 0,023 4 0,025 2 0,027 0 0,028 8 0,030 7 0,032 6 0,034 5 0,036 5 0,038 5 0,040 6 0,042 7 0,044 8 0,047 0 0,049 2 0,051 4 0,053 6 0,055 9 0,058 1 0,060 4 0,062 7 0,064 6
0,020 6 0,022 5 0,024 4 0,026 4 0,028 4 0,030 5 0,032 6 0,034 7 0,036 9 0,039 1 0,041 4 0,043 6 0,045 9 0,048 2 0,050 5 0,052 8 0,055 1 0,057 5 0,059 8 0,062 1 0,064 5 0,066 8 0,069 1 0,071 5 0,073 8 0,075 6
0,016 9 0,018 5 0,020 1 0,021 9 0,023 6 0,025 4 0,027 3 0,029 2 0,031 1 0,033 1 0,035 2 0,037 3 0,039 4 0,041 5 0,043 7 0,045 9 0,048 2 0,050 4 0,052 7 0,055 0 0,057 4 0,059 7 0,062 1 0,064 5 0,066 8 0,068 8
0,014 4 0,015 8 0,017 2 0,018 7 0,020 2 0,021 8 0,023 4 0,025 1 0,026 8 0,028 6 0,030 4 0,032 3 0,034 2 0,036 1 0,038 1 0,040 2 0,042 2 0,044 3 0,046 4 0,048 6 0,050 8 0,053 0 0,055 3 0,057 6 0,059 9 0,061 7
0,019 1 0,020 9 0,022 7 0,024 6 0,026 5 0,028 5 0,030 6 0,032 7 0,034 8 0,037 0 0,039 2 0,041 4 0,043 7 0,046 0 0,048 3 0,050 7 0,053 0 0,055 4 0,057 8 0,060 3 0,062 7 0,065 1 0,067 6 0,070 0 0,072 5 0,074 5
0,015 7 0,017 1 0,018 7 0,020 3 0,021 9 0,023 6 0,025 4 0,027 2 0,029 1 0,031 0 0,032 9 0,034 9 0,037 0 0,039 1 0,041 2 0,043 3 0,045 5 0,047 7 0,050 0 0,052 3 0,054 6 0,056 9 0,059 3 0,061 7 0,064 1 0,066 1
0,013 4 0,014 6 0,016 0 0,017 3 0,018 8 0,020 2 0,021 8 0,023 4 0,025 0 0,026 7 0,028 4 0,030 1 0,032 0 0,033 8 0,035 7 0,037 6 0,039 6 0,041 6 0,043 7 0,045 8 0,047 9 0,050 1 0,052 3 0,054 5 0,056 7 0,058 6
6.2 Calculation of room constant
At frequencies of 10 kHz and above, essentially all of the absorption in a reverberation test room is due to air absorption. Under these conditions, the room constant, R, of the reverberation test room is given by equation
SV
VR⋅⋅
−
⋅⋅=
αα
81
8 (7)
where
α is the air absorption coefficient, in nepers per metre; a is given in Table 1 as a function of frequency, relative humidity and temperature of the air in the room;
S is the total surface area of the room boundaries, in square metres;
V is the volume of the room, in cubic metres.
6.3 Installation of microphone and equipment The microphone and the equipment under test shall be installed as described in 4.4 and 4.5, respectively.
6.4 Measurement of sound pressure level The procedures of 5.5 shall be followed.
- 6 -
6.5 Calculation of sound power level The procedures of 5.6 shall be followed.
7 Method using a reference sound source
7.1 Reference sound source A reference sound source (RSS) shall be used which emits sufficient acoustical energy in the 16 kHz octave band to obtain an average band pressure level in the reverberation test room that is at least 10 dB above the background noise level. The sound power levels of the reference sound source shall be known and shall be determined in accordance with ISO 6926.
For the measurement of broad-band noise, the calibration shall be performed in one-third-octave bands.
For the measurement of discrete tones, the calibration or the reference sound source shall be performed in narrow bands (e.g. 100 Hz constant band-width or one-twelfth octave) and the sound power levels shall be reported per unit band-width (power spectral density).
7.2 Installation of microphone and equipment The microphone and the equipment under test shall be installed as described in 4.4 and 4.5, respectively.
7.3 Installation of reference sound source The location of the reference sound source in the reverberation test room shall be the same as for the equipment under test.
One single location and one orientation for the RSS are sufficient.
7.4 Measurement of sound pressure level Before measuring the noise of the equipment under test and the noise of the reference sound source, the measurement set-up shall be calibrated as described in 4.6. The average sound pressure level, , shall be measured sequentially for the equipment under test and the reference sound source, as described in 4.7. When the noise of the equipment under test is broad-band in character, a one-third-octave band analyser shall be used. When the noise of the equipment under test contains discrete frequencies, a narrow-band analyser providing analysis bandwidths of less than one-third-octave in width shall be used. The same bandwidth shall be used for the measurements of the sound pressure level of the equipment under test and of the reference sound source. The band-width and filter characteristics of the analyser shall be reported.
pL
7.5 Calculation of sound power level 7.5.1 Equipment emitt ing broad-band noise
The sound power level of each one-third-octave band of interest shall be calculated from equation
ppWW LLLL +−= (RSS)(RSS) (8)
where
WL is the band sound power level of the equipment under test, in decibels (reference: 1 pW);
(RSS)WL is the sound power level of the calibrated reference sound source, in the one-third-octave bands, in decibels (reference: 1 pW) as determined in accordance with 7.1;
(RSS)pL is the average sound pressure level of the calibrated reference sound source, in
decibels (reference: 20 μPa), measured in accordance with 4.7, in one-third-octave bands;
- 7 -

pL is the average sound pressure level for the four orientations of the equipment under
test, in decibels (reference: 20 μPa), measured in accordance with 4.7, in one-third-octave bands.
7.5.2 Equipment emitt ing discrete frequency tone(s) The sound power level shall be calculated for each frequency of interest from equation
FLLLL ppWW Δ++−= lg10(RSS)(RSS) (9)
where
WL is the band sound power level of the equipment under test, in decibels (reference: 1 pW);
(RSS)WL is the sound power level per unit band-width of the calibrated reference sound source, for the frequency of interest, in decibels (reference: 1 pW) as determined in accordance with 7.1;
(RSS)pL is the average sound pressure level of the calibrated reference sound source, in
decibels (reference: 20 μPa), measured in accordance with 4.7, in narrow bands;
pL is the average sound pressure level for the four orientations of the equipment under
test, in decibels (reference: 20 μPa), measured in accordance with 4.7 in narrow bands;
FΔ is the bandwidth of the analyser used for the sound pressure level measurements; it is the noise bandwidth of the filter, not the bandwidth between half-power points.
NOTE The noise bandwidth is the bandwidth of the ideal (rectangular) filter that would pass the same signal power as the real filter when each is driven by a stationary random-noise signal having a constant power spectral density.
8 Method using a free field over a reflecting plane
8.1 General One method is described which uses a free field over a reflecting plane. This technique is described in clause 7 of ECMA-74. A semi-anechoic room shall be used for the measurements described hereafter. NOTE 1 A small error may be introduced by this procedure due to interference caused by the reflecting plane but this can be ignored.
NOTE 2 Although air absorption plays an important role in the high-frequency range, its effect is relatively small for a measurement radius of less than 2 m in a free field over a reflecting plane.
8.2 Meteorological conditions The requirements of ISO 3744 as applicable shall be followed.
The following conditions are recommended:
− Barometric pressure: 86 kPa to 106 kPa;
− Temperature: within the range defined by the manufacturer for the equipment, if a range is defined. If no range is so defined by the manufacturer, the recommended range is 15 °C to 30 °C;
− Relative humidity: within the range defined by the manufacturer for the equipment, if a range is defined. For processing of paper and card media only, if no range is so defined by the manufacturer, the recommended range is 40% to 70%.
- 8 -
For equipment whose noise emissions vary with ambient temperature in a deliberate manner (e.g., by varying the speeds of air moving devices), the room temperature during the measurement shall be 23 °C ± 2 °C.
8.3 Instrumentation The microphone shall have a flat free-field frequency response for normally incident sound in the 16 kHz octave band. The tolerances shall be within ± 2,0 dB in the frequency range 11,2 kHz to 22,4 kHz. NOTE To meet this requirement a microphone with a diameter of 13 mm or less is usually required.
When the noise of the equipment under test is broad-band in character, an analyser with a bandwidth of one-third-octave or less shall be used. When the noise of the equipment under test contains discrete frequencies, a narrow-band analyser which provides bandwidths of less than one-third-octave in width shall be used to determine the frequency of the tone(s) and to enhance the signal-to-noise ratio. NOTE For narrow-band analysis, an analyser with a bandwidth equal to, or less than, one-twelfth octave band is appropriate. Digital analysers using fast Fourier transform (FFT) or equivalent techniques may be useful, particularly when the analyser combines narrow-band analysis and averaging.
8.4 Installation and orientation of microphone The microphone(s) shall be installed on an imaginary hemisphere which has its origin in the reflecting plane. The normal to the diaphragm of the microphone(s) shall pass through the origin of the measurement hemisphere. One of the following three microphone arrangements shall be used.
a) A rotating boom that moves the microphone(s) along five coaxial circular paths on the imaginary hemisphere. This microphone arrangement is shown in Annex A. The traversing period should be at least 30 s. Longer periods may be suitable to reduce background noise of the drive mechanism.
b) A fixed microphone array as shown in Annex A with the equipment under test mounted on a rotating turntable.
c) A fixed microphone array in accordance with B.1 of ECMA-74 with a fixed position for the equipment under test.
NOTE 1 If preliminary investigation reveals that the source radiates noise in a highly directional manner, accuracy may be improved by changing the orientation of the source, relative to the microphone path, repeating the measurement and averaging the results using equation (1).
Care shall be taken to ensure that there is no electrical pick-up by the measurement instrumentation which may interfere with the sound pressure level measurement. NOTE 2 A test with a dummy microphone, and with the equipment under test in operation, is recommended to determine the electrical background level.
8.5 Installation of equipment The equipment under test shall be placed on the reflecting floor. The projection of the geometric centre of the equipment on the floor shall be the origin of the measurement hemisphere with radius r (see 8.3).
8.6 Calibration of measurement system Before measuring the noise of the equipment under test, the measurement set-up shall be calibrated in accordance with 7.4.6 of ECMA-74. Calibration at a single frequency is sufficient if the frequency response of the entire system, including the frequency range of the 16 kHz octave band, is checked at intervals of not more than two years.
- 9 -

If an FFT analyser is calibrated with a single-frequency calibrator, care shall be taken to have all major sideband levels included in the calibration level.
8.7 Measurement of sound pressure level The sound pressure level shall be measured in one-third-octave bands or in narrow bands which contain any discrete tones. Measurements of the sound pressure level in accordance with 8.3 shall be carried out for each frequency band within the frequency range of interest. The following data shall be obtained:
a) the band sound pressure levels with the equipment in operation;
b) the band sound pressure levels of the background noise (including noise produced by ancillary equipment, if any).
True integration-averaging during a full sweep of the microphone or during a full revolution of the source is the preferred method. If the source is rotated, the average sound pressure level shall be determined for one revolution of the source. The influence of measurement duration and corrections for background noise shall be taken into account in accordance with 7.7.2 and 7.7.3 of ECMA-74, respectively.
If microphone arrangements in accordance with 8.4 a) or b) are used, the minimum integration time shall be 30 s. If fixed microphone locations in accordance with 8.4 c) are used, the minimum integration time shall be 8 s at each location or a total integration time of at least 30 s if the measurements are made simultaneously at each microphone.
When FFT analysers are used, the analysis time is typically greater than the individual time window. For this reason, the total measurement time shall be increased, or individual measurements shall be repeated as specified in 4.7 for microphone arrangements in accordance with 8.4 a) or b). For microphone arrangements in accordance with 8.4 c), the minimum integration time shall be increased to 30 s.
Furthermore, when using FFT or equivalent techniques for the analysis of discrete tone(s), the levels in the sidebands shall be considered as described in 4.7, equation (3).
The bandwidth and filter characteristics of the analyser shall be reported.
8.8 Calculation of surface sound pressure level and sound power level The procedures of 7.8 and 7.9 of ECMA-74 shall be used.
9 Information to be recorded The following information shall be recorded, when applicable, for all measurements made in accordance with this Standard.
9.1 Equipment under test a) Description of the equipment under test (including principal dimensions);
b) Operating conditions with reference to ECMA-74; if the equipment has multiple operating modes, description of each individual mode for which measurements have been performed;
c) Installation conditions;
d) Location(s) of equipment in the test environment.
9.2 Acoustic environment e) Description of the acoustic environment, dimensions, shape and acoustical characteristics
(absorption and/or reverberation time in frequency bands) of the room;
f) Description of the microphone arrangement;
g) Air temperature in degrees Celsius, relative humidity in percent, and barometric pressure in pascals.
- 10 -

9.3 Instrumentation h) Equipment used for the measurement, including name, type, serial number and manufacturer;
i) Type and bandwidth of the frequency analyser;
j) Frequency response of the instrumentation system;
k) Method used for checking the calibration of the microphone(s) and other system components; date and place of calibration;
l) Type and calibration of reference sound source; date and place of calibration;
m) Method used for determining the average sound pressure level.
9.4 Acoustical data n) Method used for determining sound power level;
o) Type of noise according to Table 2;
p) Sound power level(s) in decibels (reference: 1 pW), in one-third-octave bands and/or narrow bands together with the frequency of the tone(s);
q) Date, time and place where the measurements were performed, and the name of the person performing the measurements.
10 Information to be reported The report shall contain the statement that the sound power levels have been obtained in full conformance with one or more of the methods described in this Standard. This report shall contain, as a minimum, the following information:
a) Name(s) and model number(s) of the equipment under test;
b) Type of noise in accordance with Table 2;
c) Sound power level(s) in decibels (reference: 1 pW), in one-third-octave bands and/or narrow bands together with the frequency of any tones having levels within 10 dB of the greatest tone level;
d) Detailed description of operating conditions of the equipment under test with reference to Annex C of ECMA-74, if applicable.
- 11 -

Table 2 — Type of noise and determinat ion of sound power levels
Type of noise in the frequency range of the octave bands centred at Sound power level to be determined
125 Hz to 8 kHz 16 kHz
Broad-band or narrow-band noise (see NOTE 1)
No significant noise A-weighted level (125 Hz to 8 kHz octave bands) according to ECMA-74.
Broad-band noise A-weighted level (125 Hz to 8 kHz octave bandsaccording to ECMA-74, and one-third-octave-band sound power level in 16 kHz octave bandaccording to the procedure of this Standard.
Broad-band or narrow-band noise (see NOTE 1)
Discrete tone A-weighted level (125 Hz to 8 kHz octave bands) according to ECMA-74 and the level and frequency of the discrete tone according to this Standard.
Multiple tones A-weighted level (125 Hz to 8 kHz octave bands) according to ECMA-74 and the levels and frequencies of all tones in the 16 kHz octave band that are within 10 dB of the highest tone level in the band according to this Standard.
No significant noise (see NOTE 2)
Discrete tone Level and frequency of the discrete tone in the 16 kHz octave band according to this Standard.
Multiple tones Levels and frequencies of all tones in the 16 kHz octave band that are within 10 dB of the highest tone level in the band according to this Standard.
NOTE 1 For noise in 125 Hz to 8 kHz octave bands, sound power level in one-third-octave bands and in octave bands may also be reported in accordance with ECMA-74.
NOTE 2 When there is no significant noise contribution from 125 Hz to 8 000 Hz octave bands, only this Standard is applicable.
- 12 -

Annex A (normative)
Coaxial circular paths in parallel planes for microphone traverses
in a free field over a reflecting plane
Figure A.1 — Circular paths for microphone traverses
In this arrangement either the microphones or the equipment may be rotated.
Each path is associated with a zone of the hemisphere. These zones have the same height 0,2 r and thus the same spherical surface area . 24,0 rπ
- 13 -

- 14 -
Annex B (normative)
Calculation of air absorption coefficient
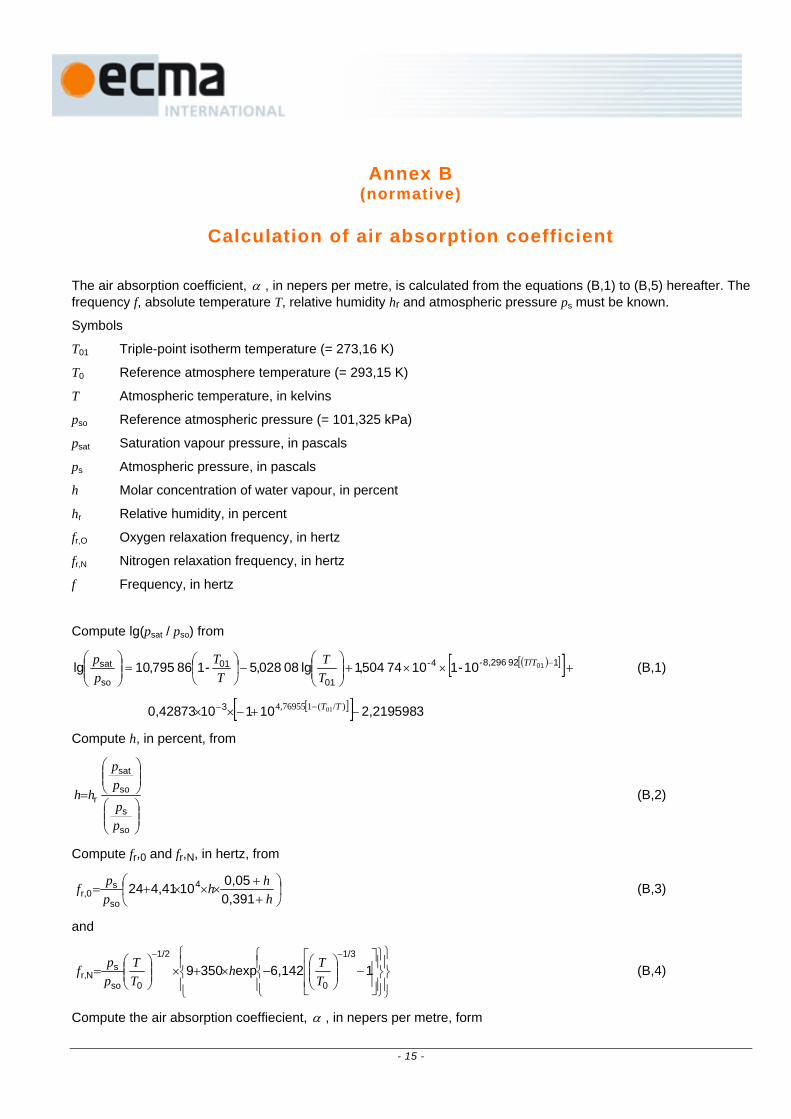
The air absorption coefficient, α , in nepers per metre, is calculated from the equations (B,1) to (B,5) hereafter. The frequency f, absolute temperature T, relative humidity hr and atmospheric pressure ps must be known.
Symbols
T01 Triple-point isotherm temperature (= 273,16 K)
T0 Reference atmosphere temperature (= 293,15 K)
T Atmospheric temperature, in kelvins
pso Reference atmospheric pressure (= 101,325 kPa)
psat Saturation vapour pressure, in pascals
ps Atmospheric pressure, in pascals
h Molar concentration of water vapour, in percent
hr Relative humidity, in percent
fr,O Oxygen relaxation frequency, in hertz
fr,N Nitrogen relaxation frequency, in hertz
f Frequency, in hertz
Compute lg(psat / pso) from
( )[ ][ ]+××+⎟⎟⎠
⎞⎜⎜⎝
⎛−⎟
⎠
⎞⎜⎝
⎛=⎟⎟⎠
⎞⎜⎜⎝
⎛ −1/92 8,296-4-
01
01
so
sat 0110-11074 504,1lg 08 028,5-186 795,10lg TT
TT
TT
pp (B,1)
[ ][ ] 35982,21910110730,428 3 −+−×× −− )/(1554,769 01 TT
Compute h, in percent, from
⎟⎟⎠
⎞⎜⎜⎝
⎛
⎟⎟⎠
⎞⎜⎜⎝
⎛
=
so
s
so
sat
r
pp
pp
hh (B,2)
Compute fr,0 and fr,N, in hertz, from
⎟⎠
⎞⎜⎝
⎛++
×××+=hhh
ppf
0,3910,05104,4124 4
so
sr,0 (B,3)
and
⎪⎭
⎪⎬⎫
⎪⎩
⎪⎨⎧
⎪⎭
⎪⎬⎫
⎪⎩
⎪⎨⎧
⎥⎥
⎦
⎤
⎢⎢
⎣
⎡−⎟⎟
⎠
⎞⎜⎜⎝
⎛−×+×⎟⎟
⎠
⎞⎜⎜⎝
⎛=
−−
16,142exp35091/3
0
1/2
0so
sNr, T
ThTT
ppf (B,4)
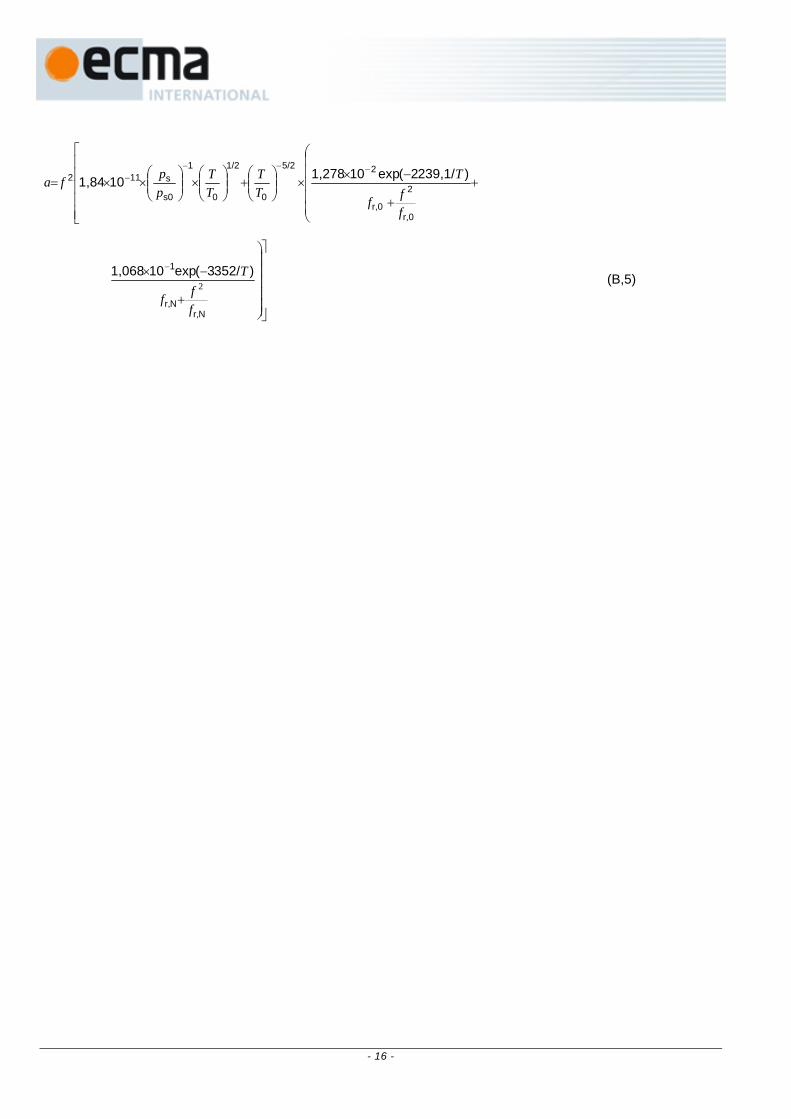
Compute the air absorption coeffiecient, α , in nepers per metre, form
- 15 -
- 16 -
+
⎢⎢⎢⎢⎢
⎣
⎡
⎜⎜⎜⎜⎜
⎝
⎛
+
−××⎟⎟
⎠
⎞⎜⎜⎝
⎛+⎟⎟
⎠
⎞⎜⎜⎝
⎛×⎟⎟
⎠
⎞⎜⎜⎝
⎛××=
−−−−
r,0
2
r,0
25/2
0
1/2
0
1
s0
s112 )239,1/2(exp101,278101,84
fff
TTT
TT
ppfa
⎥⎥⎥⎥⎥
⎦
⎤
⎟⎟⎟⎟⎟
⎠
⎞
+
−× −
Nr,Nr,
1 )352/3(exp101,068
fff
T2 (B,5)
