measurement of gas evolution from punb bonded sand as a function
TRANSCRIPT
23International Journal of Metalcasting/Spring 2012
MeasureMent of Gas evolution froM PunB Bonded sand as a function of teMPerature
G. Samuels and C. BeckermannDept. of Mechanical and Industrial Engineering, University of Iowa, Iowa City, IA, USA
Copyright © 2012 American Foundry Society
abstract
Gas evolved from the thermal decomposition of the binder can greatly deteriorate the quality of sand castings. Binder gas models used in casting simulations require knowledge of the binder gas mass and molecular weight evolution, but available data are limited. In the present study, the mass and molecular weight of gas evolved from phenolic urethane no-bake (PUNB) bonded sand are measured as a function of temperature. Thermogravimetric analysis is used to deter-mine the changes in the binder mass with temperature. The binder is found to be fully pyrolyzed at temperatures above 710C (1310F), with its mass reduced by 82%. Up to 100°C/min (180°F/min), the binder decomposition does not appear to be a strong function of the heating rate. The evolved vol-ume of the binder gas during heating and cooling is mea-
sured using a specially designed quartz manometer with a liquid metal as the working fluid. During heating at 2°C/min (3.6°F/min), the binder gas molecular weight is found to de-crease in a complex manner from 375 g/mol at 115C (239F) to 33.3 g/mol at 898C (1648F). When the binder pyrolysis is complete above 710C (1310F), the binder gas is incondens-able, but continues to decompose to lower molecular weight compounds until at least 1350C (2462F). If the binder is heated to a temperature not exceeding 510C (950F), the binder gas partially condenses during subsequent cooling; this condensation occurs below 165C (329F).
Keywords: sand casting, phenolic urethane no-bake binder, PUNB, binder gas, molecular weight, binder mass evolution
introduction
Resin binders used to make sand molds and cores thermally decompose when subjected to the high temperature condi-tions in metalcasting, and a significant amount of gas is pro-duced when the binders degrade.1 It is well understood that the evolved binder gas can profoundly influence the quality of castings.2-4 Defects associated with binder gas generation from bonded sand molds and cores, with blowholes and pin-holes being the most common,5-9 result in large amounts of scrap and are of great concern to the casting industry.
In response to these issues, binder gas models have been in-corporated into metalcasting simulation software in order to better predict the occurrence of gas defects.10-12 Crucial ele-ments required in binder gas evolution models are the mass and molecular weight of the evolved gas as a function of temperature. Unfortunately, temperature resolved binder gas mass evolution and molecular weight data corresponding to the conditions experienced during sand casting processes are very limited. The objective of the present study is to measure the mass and molecular weight of the gas evolved during de-composition of phenolic urethane no-bake (PUNB) bonded sand as a function of temperature at conditions similar to those experienced during sand casting. The experimental re-sults will provide improved input data for binder gas evolu-tion models used in casting simulations.
Knowledge of the evolved binder gas composition facili-tates the determination of the molecular weight of the gas. Early studies by Bates and Scott,13,14 Bates and Monroe,15 and Scott et al.16 involved pouring aluminum, gray iron, and steel into molds made using different binder systems and periodically sampling the gas generated at the mold-metal interface. The gas samples were collected inside evacuated glass tubes and subsequently analyzed by gas chromatography (GC) to determine the volume concentra-tions (% V/V) of hydrogen, oxygen, nitrogen, carbon mon-oxide, carbon dioxide, and total hydrocarbons (measured as equivalent concentration of methane) in the binder gas. The measured average composition and mixture molecu-lar weight of the gas evolved within two minutes after pouring metal into phenolic urethane cold-box (PUCB) and PUNB bonded sand molds are shown in Table 1. The reported volume concentrations are converted to mass fractions for the present analysis. The molecular weights calculated from the average gas compositions within the first two minutes after pour should approximately corre-spond to the pouring temperatures of the metal.19 While the specific chemical formulations employed in PUCB and PUNB binder systems are different, these binder systems are based on the same urethane bonding chemis-try.17,18 This allows the composition and molecular weight of the gas evolved from PUCB and PUNB bonded sand to be reasonably compared.

24 International Journal of Metalcasting/Spring 2012
The results in Table 1 show that the binder gas generated during pouring of the gray iron and steel castings was most-ly comprised of carbon monoxide and carbon dioxide, had varying amounts of nitrogen and hydrocarbons, and low amounts of hydrogen and oxygen. The binder gas from the aluminum castings, poured at significantly lower tempera-tures than the gray iron and steel castings, was comprised almost entirely of oxygen and nitrogen. This indicates that the evolution of binder gas within the first two minutes after pouring the aluminum castings was insufficient to replace the air atmosphere originally in the molds. The hydrogen, carbon monoxide, carbon dioxide, and hydrocarbons evolve primarily at higher temperatures. It is also possible that the binder gas experienced some condensation before it escaped the mold and was collected, making the measured composi-tion not entirely reflective of the actual binder gas composi-tion. In addition, the binder gas samples had the opportunity to cool inside the collection tubes prior to injection of the samples into the gas chromatograph, which can also cause some binder gas to condense before analysis. Regardless of these issues, the molecular weight data calculated from the data (in References 13-16) are useful for comparison against the present molecular weight measurements.
More recently, McKinley et al.20 (with detailed information and analysis available in the work of Lytle21) performed flash pyrolysis of 1.5% PUCB bonded sand and used gas chromatography-mass spectroscopy (GC-MS) to analyze the evolved binder gas. Small samples of PUCB bonded sand were rapidly heated to 500C (932F), 700C (1292F), and 900C (1652F) under a helium atmosphere and held at these temperatures for various periods of time. The pyroly-sis products were swept directly into the gas chromatograph, and gas species ranging from 10 g/mol to 425 g/mol were
detected by the mass spectrometer. The mass fractions of the primary components emitted from the PUCB bonded sand during twenty seconds of pyrolysis at 700C (1292F) and 900C (1652F) and the mixture molecular weights calculated from the composition data are shown in Table 2.
The components in Table 2 comprise more than 99% of the measured gas species at each temperature, with the remain-ing gases being high molecular weight compounds. None of the components listed in Table 2 were detected during pyrolysis at 500C (932F), however the molecular weight of the gas mixture evolved at 500C (932F) was calculated to be 137 g/mol. It can be seen from Table 2 that, besides carbon monoxide, the major species evolved are hydrocarbons. In addition, the binder gas composition experiences significant changes between 700C (1292F) and 900C (1652F). Refer-ence 21 did not detect any oxygen or nitrogen in the binder gas. This further supports the conclusion that the nitrogen and oxygen measured in References 13-16 during all cast-ing experiments were from the residual air in the mold. The significant hydrocarbon content at 700C (1292F) reported by Reference 21 also contradicts the results of References 13-16 for aluminum poured at 750C (1382F). Regardless of such measurement discrepancies, the detailed composi-tion data from References 20 and 21 currently provide the only means to directly obtain reliable binder gas molecular weight data at a few selected temperatures.
Even though coupling GC with any one of the many types of gas detectors provides the means to analytically determine the binder gas composition and molecular weight, this tech-nique is not well suited to generate the magnitude of temper-ature resolved molecular weight data required in binder gas models. The gas components evolved from bonded sand will
Table 1. Time-averaged Mass Fraction and Mixture Molecular Weight of Gas Components Evolved from PUCB and PUNB Bonded Sand within
Two Minutes after Pouring during the Experiments of Bates et al.13-15 and Scott et al.16

25International Journal of Metalcasting/Spring 2012
freely mix together throughout the casting process, and Ref-erence 20 acknowledges that the evolved binder gas com-ponents will interact with one another and may combine to form new compounds. This means that the gas species sepa-ration and thermal programming required for thorough GC analysis deviates from the conditions experienced during actual casting processes. Furthermore, binder gas condensa-tion during the measurements must be prevented. In addition to these experimental problems, the gas composition analy-sis procedure is quite complex and the associated equipment costs are high. Therefore, determination of the binder gas molecular weight as a function of temperature from addi-tional binder gas composition measurements is impractical.
An alternative method for determining the binder gas mix-ture molecular weight is to use the ideal gas law in conjunc-tion with measurements of the evolved binder gas mass, volume, and pressure as a function of temperature. In this respect, it is important that the bonded sand sample and the gas are at a uniform temperature and that the heating rates are consistent among the various measurements. Thermo-gravimetric analysis (TGA) of bonded sand facilitates deter-mination of the binder gas mass evolution as a function of temperature during controlled heating. Unfortunately, previ-ous experimental techniques15,22-25 for measuring the volume and pressure of gas evolved from bonded sand are unsuitable for determination of the binder gas molecular weight as a function of temperature. Previous techniques do not ensure a sufficiently uniform temperature, do not fully prevent con-densation of the binder gas, do not allow measurements of the gas volume, pressure and temperature to be performed on the same volume of evolved gas, and provide no means for controlling the heating rates of the bonded sand and binder gas during the experiments. Therefore, it is necessary to develop new tech-niques for measuring the volume, pressure, and temperature of gas evolved from bonded sand in order to determine the binder gas molecular weight as a function of temperature.
In the present study, the mass and molecular weight of the binder gas evolved during de-composition of PUNB bonded sand is mea-sured. TGA is employed to measure the binder gas mass as a function of temperature at vari-ous heating rates. A specially designed quartz manometer, with liquid metal as the working fluid, is used to measure the binder gas volume, pressure, and temperature during heating and cooling. These gas evolution measurements are combined with the ideal gas law to determine the binder gas mixture molecular weight as a function of temperature. The bonded sand is initially immersed in an inert atmosphere in or-der to ensure that the binder is pyrolyzed, rather than combusted. Unlike in previous studies, the evolved binder gas is contained within the gas
volume measurement apparatus and stays in contact with the bonded sand sample. This is intended to more closely simu-late the conditions inside of a mold during casting. If the evolved gases were continually swept away from the sam-ple, as in GC for example, the binder decomposition behav-ior could be different and the chemical reactions within the evolved gas could not be studied. Furthermore, the present gas evolution device prevents undesired binder gas conden-sation, allows for the measurement of the molecular weight evolution of the evolved gases even after the binder is fully pyrolyzed, and eliminates issues related to non-localized measurement of the gas volume, pressure, and temperature. The present experimental techniques allow for continuous measurement of the binder gas molecular weight variations with temperature.
experimental Methods
The following sub-sections describe the preparation of bonded sand specimens, the TGA experimental procedures, the design of the gas measurement apparatus, and the gas measurement procedures. Additional experimental details may be found elsewhere.27
PunB Bonded sand Preparation
The PUNB bonded sand specimen composition and prepara-tion procedure follow those employed by Thole and Becker-mann.26 Specimens of bonded sand were prepared from IC55 silica lake sand, black iron oxide (BIO), and a PUNB binder system. The values for the binder content (1.25% of total mass), binder ratio (60:40 ratio of Part 1 to Part 2), catalyst
Table 2. Primary Chemical Components Identified by McKinley et al.20 and Lytle21 through GC-MS Analysis during
Flash Pyrolysis of 1.5% PUCB Bonded Sand
*Note: Additional Reference to Data in: Starobin, A., Goettsch, D., Walker, M., Burch, D., “Gas Pressure in Aluminum Block Water Jacket Cores, Int. J. Metalcasting, vol. 5, no. 3, pp. 57-64 (Summer 2011)

26 International Journal of Metalcasting/Spring 2012
percentage (8% of binder mass), and additives (BIO, 3% of total mass) were selected based on feedback from seven steel foundries.
The sand and BIO components were measured using an Ohaus model PA4101 precision balance, and the binder com-ponents were measured using a Denver Instruments model S-403 precision balance. The specimens were prepared by first mixing the BIO into the sand with a KitchenAid® stand mixer to ensure uniform particulate distribution. Then, the binder was added according to a procedure recommended by the binder manufacturer. Part 1 (Pep Set® X1000) and Part 3 (Pep Set® 3500) were combined in a paper cup and sub-sequently added to the particulate mixture. The batch was mixed for 45 seconds, and then vigorously tossed to bring the coated mixture from the bottom of the mixing bowl to the top. The batch was mixed for another 45 seconds and tossed again. After the second toss, Part 2 (Pep Set® X2000) was added to the batch and mixed for another 45 seconds, which was followed by a third and final toss. The batch was mixed for a final 45 seconds before dumping it into a box with rectangular patterns. The sand-binder mixture was rammed by hand into each pattern, while making sure the specimens were of uniform density, and allowed to set in the box before stripping. The specimens were stripped when the compacted mixture withstood 20 psi of compressive stress without visible deformation.17 The pattern box was capable of making six bonded sand blocks, each with a 2.54 cm (1 in) square cross-section and a 22.88 cm (9 in) length. The specimens were immediately sealed in plastic bags to mini-mize evaporation of the solvents, and the specimens were allowed to cure for at least 24 hours before testing.
thermogravimetric analysis
TGA was performed on the PUNB bonded sand using a PerkinElmer model Pyris 1 thermogravimetric analyzer. The PUNB bonded sand blocks were cut down into smaller piec-es, which were then shaped into small cylinders using a razor blade. The PUNB bonded sand samples for TGA had a mass of approximately 55 mg, and the samples were about 0.45 cm (0.177 in) in diameter and 0.25 cm (0.0984 in) in height. The system was purged with argon gas at a flow rate of 25 cm3/min (1.526 in3/min), with flow rates of 15 cm3/min (0.915 in3/min) and 10 cm3/min (0.610 in3/min) to the balance and furnace sheath, respectively. The total flow rate was selected in order to minimize non-isothermality in the samples during testing. Argon gas was used in the TGA in order to ensure binder py-rolysis, rather than combustion. The argon gas flow sweeps away the gases evolved from the binder, which can affect the subsequent decomposition of the binder. The magnitude of this effect is not known and requires further investigation where TGA is performed under atmospheres closer in compo-sition to the evolved binder gas.
The samples were heated from room temperature to 1000C (1832F) at rates of 2°C/min (3.6°F/min), 10°C/min (18°F/
min), and 100°C/min (180°F/min). The heating rates for TGA were selected to reflect those experienced in molds and cores during casting processes. The high TGA heating rate of 100°C/min (180°F/min) simulated mold heating rates at a close distance [i.e., about 1.3 cm (0.5 in) for steel casting] from the mold-metal interface, and the 10°C/min (18°F/min) and 2°C/min (3.6°F/min) TGA heating rates simulated mold heating rates at distances further away from the mold-metal interface. Multiple tests were performed at each heating rate to verify repeatability of the experiments. The TGA machine was allowed to self-clean periodically between tests, and the sample pans were cleaned according to the recommenda-tions of the manufacturer.
The fraction of original binder mass remaining, f, in a PUNB bonded sand sample as a function of temperature during heating is calculated from
Eqn. 1
Where: ms is the sample mass measured by the TGA ma-chine at both the initial temperature T0 and varying temper-ature T, is the initial sample mass measured separately with an analytical balance, and χ is the binder content of the bonded sand sample based on total weight percentage. The fraction of original binder mass remaining in bonded sand during heating was interpolated at intervals of 0.1°C (0.18°F) from the corresponding fractions obtained from the TGA measurements. This allowed the measurements of the binder gas mass evolution to be matched with the binder gas volume and pressure measurements (obtained from later gas evolution experiments) at discrete temperature points.
Gas Measurement apparatus
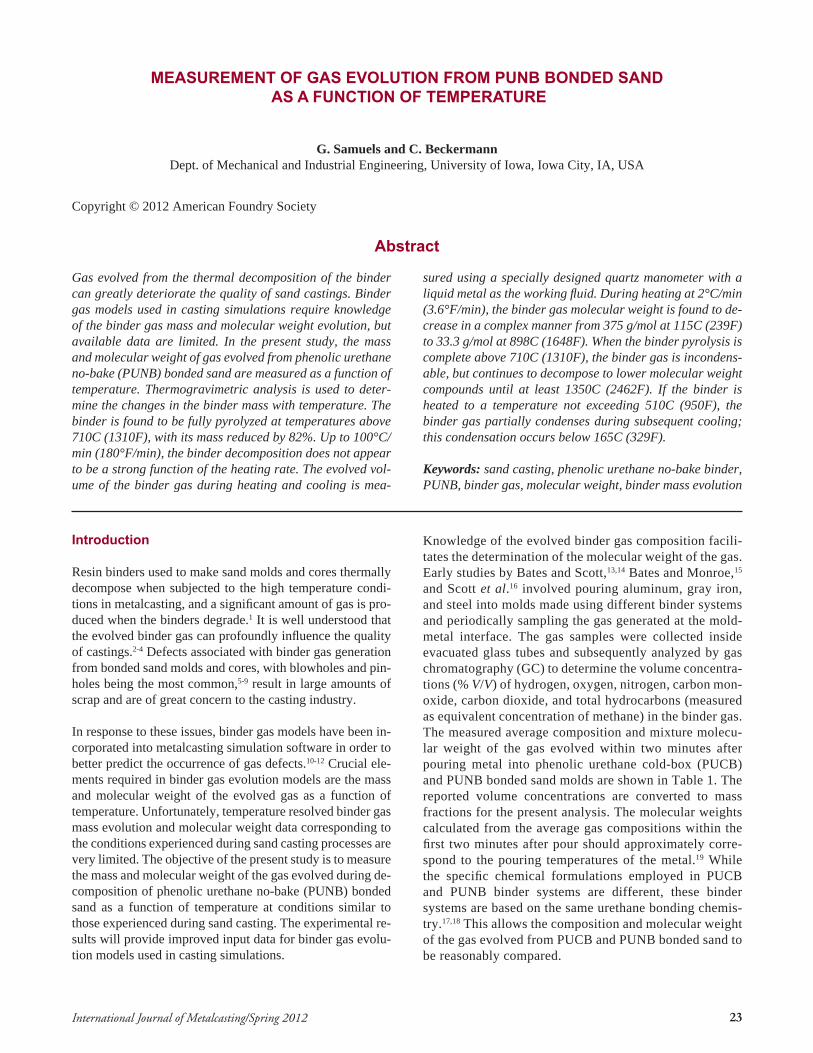
A schematic of the gas measurement apparatus is shown in Figure 1. The primary component is the gas evolution device (GED), made by fusing quartz cylinders and discs together. Cylinder 1 was sealed at the top and bottom and had two quartz thermocouple wells attached to the top surface. One thermocouple well extended up from the top of cylinder 1, while the other extended 2 cm (0.787 in) from the top sur-face down into the interior of cylinder 1. Cylinder 1 had an internal diameter of 4 cm (1.575 in) and a height of 3 cm (1.181 in). Cylinder 2 was sealed at the bottom and had an internal diameter of 1.3 cm (0.512 in) and a height of 22 cm (8.661 in). Cylinders 1 and 2 were joined by a third quartz tube, creating a container with a “J-shaped” cavity that acted as a manometer.
A sample of interest was loaded into cylinder 1 of the GED, and the GED was filled with a near-eutectic alloy of gallium (75% by mass) and indium (25% by mass) to a specified ini-tial height in cylinder 2. Specific filling procedures will be described later. The metal alloy is liquid at room temperature and has low vapor pressures at high temperatures. A dis-
27International Journal of Metalcasting/Spring 2012
placement boat, which was a quartz tube with the bottom end sealed, was inserted into cylinder 2 such that the boat rested on top of the liquid metal. The displacement boat diameter was 1.15 cm (0.453 in), which allowed for smooth vertical translation of the boat in cylinder 2. The boat’s bottom surface was flat on the exterior and spherical on the interior.
The filled GED was placed on top of a square quartz plate, with 10 cm (3.937 in) sides and 0.3 cm (0.118 in) thickness, inside a Neytech model 85P radiative furnace capable of reaching 1100C (2012F). Three specially made ceramic-in-sulated Type K thermocouples were used to measure the fur-nace temperature (the bead touched the interior of a protec-tive quartz sheath), the glass temperature at the top surface of cylinder 1 (the bead touched the bottom of the glass well), and the interior temperature of the liquid metal in cylinder 1 (the bead touched the bottom of the metal well). A displace-ment probe was threaded through a small hole in a stabilizer plate (attached to the furnace) and then lowered down to rest on the interior spherical surface of the displacement boat. The displacement probe was a thin quartz rod attached to a thin 2.5 cm (0.984 in) square quartz plate that was covered with black spray paint on the top surface. Argon was supplied to cylinder 2 at a rate of 200 cm3/min (12.205 in3/min) in order to prevent the liquid metal from oxidizing during the experiments.
A Micro-Epsilon model optoNCDT 1400 laser optical displacement sensor was mounted to a support rig above the furnace, powered by a Top-ward model 3306D DC power supply, and care-fully calibrated to measure the vertical position of the displacement probe’s square plate. A square steel tube was placed around the probe to reduce displacement measurement noise caused by dis-turbances from the surroundings. A fan forced air over the furnace to keep the laser sensor cool dur-ing tests, and the temperature near the laser sensor was monitored with a fourth Type K thermocouple.
The experimental data was collected using an IO-tech model 3005 Personal DAQ system connected to a laptop via USB. DASYLab® software28 was used to control the data acquisition system. Sam-pling was performed at a frequency of 10 Hz for all measurements, and this raw data was averaged and recorded at a frequency of 2 Hz.
In a typical experiment, the initial height of the probe was measured by the laser sensor for five minutes prior to the start of the test. The furnace was heated at a constant rate and the contents of the GED expanded. This caused the metal height in cylinder 2 to rise. The metal displacement moved the position of the displacement probe, and the probe’s vertical translation was detected by the laser sensor. Thus, the total expansion of the
GED’s contents was measured as a function of temperature. Tests were monitored to ensure that the liquid metal did not overflow in cylinder 2. Cooling data were collected for some tests, and cooling was performed by turning the furnace off and allowing the GED to naturally cool to room tempera-ture. After testing, the GED was removed from the furnace and the GED’s contents were emptied. The liquid metal and GED were cleaned using a solution of low molarity hydro-chloric acid, and any remaining particulate matter was re-moved from the liquid metal. The GED was then washed with acetone, dried, and heated in the furnace to volatize any residual organic matter.
Metal-only expansion tests
It was necessary to determine the expansion behavior of the liquid metal as a function of temperature. The GED was first purged with argon at a rate of 400 cm3/min (24.410 in3/min) for ten minutes prior to filling. The argon flowed into cylin-der 1 of the GED through a flexible plastic tube. The argon tube was then positioned in cylinder 2, and argon flowed into cylinder 2 throughout the remainder of the filling process.
Figure 1. Schematic of gas measurement apparatus and important geometric quantities.

28 International Journal of Metalcasting/Spring 2012
Cylinder 1 was entirely filled with liquid metal by evacuat-ing cylinder 1 while simultaneously injecting the metal into the GED through a second plastic tube. Cylinder 2 was filled
to the initial metal height 02h of 3.5 cm (1.378 in). This height
was selected to ensure that the metal level in cylinder 2 was initially higher than the metal level in cylinder 1 (creating a slightly positive pressure in cylinder 1). The mass of the empty and filled GED was measured for all experiments us-ing an Ohaus model EP613C precision balance. The metal mass was found by simply subtracting the metal-filled GED mass from the empty GED mass. The displacement boat was then lowered onto the metal surface in cylinder 2, and the filled GED was placed in the furnace. The thermocouples were set in their locations and the initial height of the dis-placement probe was measured by the laser sensor. The fur-nace was heated at various constant rates ranging from 2°C/min (3.6°F/min) to 15°C/min (27°F/min) while temperature and expansion measurements were obtained. Multiple tests were performed at each heating rate to ensure that the ex-periments were repeatable. The density of the liquid metal at room temperature (i.e., the initial temperature) was ob-tained by measuring the mass of metal that filled a calibrated volumetric flask. The metal density at room temperature was measured prior to filling the GED for all experiments.
The effective volumetric expansion coefficient of the liquid
metal in the GED,
effmβ , as a function of temperature was cal-
culated from
Eqn. 2
where D2 is the diameter of cylinder 2, ∆h2 is the measured
height change in cylinder 2, Tm is the measured metal tem-
perature,
0mT is the measured initial metal temperature,
is
the density of the liquid metal at room temperature, and mn is the mass of liquid metal in the GED.
Additional experiments were carried out to determine the true volumetric expansion coefficient of the liquid metal. A spherical borosilicate bulb was fused to a long and nar-row borosilicate tube. The bulb was filled with liquid metal, placed in the furnace, and subjected to a step-heating pro-gram that simulated an “infinitely slow” heating rate. The true volumetric expansion coefficient was calculated using the measurements from the metal-only expansion in the bulb and Equation 2 (with D
2 replaced by the bulb tube’s diam-
eter and ∆h2 replaced by the metal-only height change mea-sured in the bulb tube).
Pure Gas expansion tests
Various volumes of argon and hydrogen gases were heat-ed in the GED in order to observe the nature of the gas expansion in the GED and to determine the accuracy to
which the molecular weight of a known gas could be mea-sured. Aside from the insertion of a pure gas sample into the GED, the filling and setup procedure followed that of the metal-only tests. Once the GED was filled with metal, a specified volume of argon or hydrogen gas was injected into cylinder 1 of the apparatus through a flexible plastic tube. Liquid metal was simultaneously extracted from cyl-inder 2 to maintain the 3.5 cm (1.378 in) initial height in cylinder 2. Argon gas flowed into cylinder 2 at a rate of 400 cm3/min (24.410 in3/min) during the injection of the gas sample. Once the GED was filled, the remainder of the setup was carried out as previously described. The furnace was heated at low rates of 2°C/min (3.6°F/min) and 3°C/min (5.4°F/min) while temperature and expansion mea-surements were obtained. These heating rates were chosen based on the results from the metal-only expansion tests and to ensure reasonable isothermality of the gas and the GED. Multiple tests were performed to confirm the repeat-ability of the experiments.
The gas temperature T and initial gas temperature 0T were not directly measured. Rather, these temperatures were as-sumed to be the same as the measured metal temperature and measured initial metal temperature, respectively. The reasoning behind this will be discussed later. The measured metal height change in cylinder 2 during heating of the gas samples was used to interpolate the corresponding height change at intervals of 0.1°C (0.18°F) over the measured tem-perature range. This was done to properly match the pure gas measurements with the metal expansion data, as well as to standardize the pure gas expansion measurements and sub-sequent calculations as a function of temperature.
The total gas volume, Vg, as a function of temperature was
calculated from
Eqn. 3
Where: 0fillV is the volume contained by the filled GED (up
to 02h ) at the initial temperature and ∆Vm is the change in
volume of the liquid metal. The first term on the right hand side of Equation 3 corresponds to the initial gas volume,
0gV (which was verified against the supposed volume of gas
injected into the GED), and the second term in Equation 3 corresponds to the change in gas volume, ∆Vg, as a function of temperature. The volume change of the liquid metal in the GED corresponding to a given temperature change was determined using29
Eqn. 4
As previously stated, the GED acted as a manometer, and the total gas pressure, Pg , as a function of temperature was calculated from30

29International Journal of Metalcasting/Spring 2012
Eqn. 5
where pmis the density of the liquid metal at a given tem-perature, g is gravitational acceleration (9.81 m/s2 or 32.2 ft/s2), ∆H is the height difference between the metal surfaces in cylinders 1 and 2, Patm is atmospheric pressure (101325 Pa), and Pprobe is the pressure from the weight of the displacement probe and boat. The density of the liquid metal at a given temperature is given by
Eqn. 6
The height difference between the metal surfaces in cylinder 1 and 2 was straightforwardly calculated from
Eqn. 7
Where 01h is the initial metal height in cylinder 1, and ∆h
1is
the metal height change in cylinder 1. The metal height change in cylinder 1 of the GED was calculated from
Eqn. 8
Where D1,eff is the effective internal diameter of cylinder 1.
The molecular weight of an ideal gas, Mg, being a single gas or a gas mixture, can be derived from the ideal gas law, i.e.,31
Eqn. 9
Where mg is the total gas mass and R is the universal gas con-stant (8.314 J/mol/K). Manipulation of Equation 9 gives the ratio of the measured to known molecular weight (or simply the dimensionless molecular weight), ϕ, of a gas i as
Eqn. 10
Where Mi is the known molecular weight of the measured
gas i, 0gP is the measured initial gas pressure found by in-
putting the initial measurement conditions into Equation 5. The accuracy to which the apparatus could measure the mo-lecular weight of a known gas was evaluated through these dimensionless molecular weight measurements.
Binder Gas evolution tests
PUNB bonded sand samples for gas expansion measure-ment were prepared using the same methods as those used for TGA. The bonded sand samples for gas expansion mea-surement were shaped into small cylinders measuring about 0.8 cm (0.315 in) in diameter and 0.5 cm (0.197 in) in height,
and the mass of the samples was approximately 0.2 g. The sample mass was measured with the same device used to measure the empty and filled GED. The small sample size helped minimize non-isothermality in the samples during testing, and multiple samples were used in each experiment to achieve the desired total initial sample mass. The bonded sand samples had a porosity of about 33%.26 Therefore, the bonded sand samples were placed in a plastic bag that was continuously flushed with argon gas and stored in the argon-filled bag for at least 24 hours prior to testing. This ensured that only argon gas occupied the empty space inside the bonded sand samples and that pyrolysis of the bonded sand could occur during the tests.
After purging the GED with argon as previously described, a small amount of metal was injected into cylinder 1 in or-der to create a flat surface of liquid metal at the bottom of cylinder 1. The argon injection tube was withdrawn from the GED, and samples were placed inside the GED such that the samples floated on top of the liquid metal. The argon and metal injection tubes were reinserted into cylinder 2, and the remaining filling and setup were carried out as described for the metal-only tests. The furnace was heated at a rate of 2°C/min (3.6°F/min) while temperature and expansion measure-ments were obtained. The heating rate was selected based on the results from the pure gas expansion tests (see below). Multiple experiments were performed to obtain the binder gas molecular weight for all temperatures of interest. The total initial sample mass ranged from about 0.4 to 9 g. In ad-dition, measurements were collected as the furnace cooled during some of the tests.
A mixture of argon (from inside the bonded sand samples) and binder gas was present during heating of the PUNB bonded sand samples. The temperatures of the bonded sand samples, argon gas in the bonded sand samples, and evolved binder gas in the GED were not directly measured. These temperatures were assumed to be equivalent to the measured metal temperature. The validity of this assumption will be addressed later in the discussion.
By conservation of mass, the binder mass lost during thermal decomposition is equivalent to the binder gas mass evolved. The mass of gas evolved from the bonded sand samples, mb, as a function of temperature is then given by
Eqn. 11
Where 0sm is the total initial PUNB bonded sand sample mass.
The measured total height change in cylinder 2 was interpo-lated such that the total gas volume and pressure could be determined at intervals of 0.1°C (0.18°F) over the measured temperature range. The total gas volume and pressure were found using the same methods as described for the pure gas volume and pressure calculations. Summation of the partial

30 International Journal of Metalcasting/Spring 2012
pressures of the argon and binder gases and manipulation of Equation 9 yields the binder gas molecular weight, Mb, as
Eqn. 12
The interpolation of the binder gas mass evolution, volume, and pressure measurements at intervals of 0.1°C (0.18°F) allowed the data sets to be matched together when the ex-periments employed the same heating rate. This allowed Equation 11 to be directly inserted into Equation 12, and the binder gas molecular weight as a function of temperature was straightforwardly calculated.
results and discussion
thermogravimetric analysis
Preliminary TGA experiments were performed to compare the decomposition behavior of PUNB bonded sand (55 mg) and pure IC55 silica sand (55 mg) for a heating rate of 100°C/min (180°F/min) with 25 cm3/min (1.526 in3/min) of argon gas flow. TGA of the pure sand was of interest to determine whether sand decomposition significantly contributes to gas evolution. Figure 2 shows the measured mass percentage re-maining in the bonded sand and pure sand samples as a func-tion of temperature. It can be seen that, as expected, the PUNB bonded sand loses far more mass than the pure sand during heating. The relatively minor mass loss in the pure sand is likely due to trace impurities being volatized. In addition, Fig-ure 2 shows that the bonded sand and pure sand curves show a small mass increase between about 20C (68F) and 115C (239F). This unexpected increase in the sample mass at such low temperatures necessitated additional investigation.
TGA was performed on 61 mg of broken quartz rods for a heating rate of 100°C/min (180°F/min) with 25 cm3/min (1.526 in3/min) of argon gas flow. The quartz rods were not expected to experience any mass change during heating, and the quartz rod sample mass was made to be similar to the mass of the bonded sand and pure sand samples. The measured mass percentage characteristic of the quartz rod samples dur-ing heating is superimposed on the bonded sand and pure sand curves in Figure 2. The increase in the measured quartz rod mass from 20C (68F) to 115C (239F) directly coincides with the increase in the measured bonded sand and pure sand sam-ple masses. The quartz rod mass readings continued to show some variation up to a temperature of 1000C (1832F), and additional quartz rod tests at 100°C/min (180°F/min) showed that the variations were reproducible. Abnormal temperature dependent variations in quartz rod mass readings were also obtained at heating rates of 2°C/min (3.6°F/min) and 10°C/min (18°F/min). Subsequently, the quartz rod TGA measure-ments were used to account for the temperature dependent bias in the TGA machine’s mass measurements and to correct the TGA mass measurements for PUNB bonded sand. Ad-
ditional information regarding the TGA correction with the quartz rod measurements is presented elsewhere.27
Other preliminary TGA experiments revealed that increas-ing the PUNB bonded sand sample mass from 55 mg to 80 mg or 100 mg does not affect the results. Lowering the bonded sand sample mass below 55 mg was not desirable. This is because samples below 55 mg were more likely to have non-homogeneous distribution of the binder within the sand. Additional results for pure PUNB binder (without sand) decomposition and the effects of purge gas flow rate on the TGA measurements are documented elsewhere.27
The measured fractions of original binder mass remaining in 55 mg PUNB bonded sand samples heated at rates of 2°C/min (3.6°F/min), 10°C/min (18°F/min), and 100°C/min (180°F/min) with 25 cm3/min (1.526 in3/min) of argon gas flow are plotted as a function of temperature in Figure 3. Because of the TGA mass measurement correction, the fractions re-main very close to unity until binder decomposition begins at approximately 50C (122F). With increasing temperature, the fraction of original binder mass remaining decreases in a complex manner. The curves in Figure 3 are almost horizontal when the decomposition reaction is finished, indicating nearly complete removal of the bias in the TGA machine’s mass measurements. The decomposition ceases at a temperature of about 710C (1310F) for a heating rate of 2°C/min (3.6°F/min) and at somewhat higher temperatures, approaching 800C (1472F), for heating rates of 10°C/min (18°F/min) and 100°C/min (180°F/min). It should be noted that applying the correc-tion changes the fraction of original binder mass remaining by as much as 10% at the maximum decomposition temperature.
Figure 2. Measured percentage of mass remaining as a function of temperature typical of PUNB bonded sand samples, pure IC55 silica sand samples, and quartz rods heated at a rate of 100°C/min (180°F/min) with a total argon gas flow of 25 cm3/min.

31International Journal of Metalcasting/Spring 2012
It can be seen from Figure 3 that good repeatability in the bonded sand decomposition is achieved at each heating rate. There are increasing delays (in terms of temperature) in the decomposition with increasing heating rate. The binder de-composition reactions can be expected to be time dependent in nature, and an increase in the sample heating rate may then shift the decomposition to higher temperatures. More likely, the delays are simply caused by greater non-isother-mality of the bonded sand samples for higher heating rates. For high heating rates, the center of the bonded sand sam-ples can be expected to be somewhat cooler than the surface. This implies that the lower heating rate results better reflect the “true” decomposition behavior at a given temperature. Overall, however, the decomposition behavior is fairly simi-lar between heating rates and, to a first approximation, may be assumed to be the independent of the heating rate within the range studied. It was later found that the heating rate of the GED needed to be low in order to ensure reasonable uniformity in temper-ature during the binder gas molecular weight measurements (see below). In light of this, only the 2°C/min (3.6°F/min) measurements of the fraction of original binder mass remaining were fit to a set of piecewise polynomials for use in the binder gas molecular weight calculations. Additional modifications were made such that the fitted fraction of original binder mass was set to be
Table 3. Piecewise Polynomial Fitted to the Fraction of Original Binder Mass Remaining Measured during TGA Pyrolysis of PUNB Bonded Sand Samples
Heated at a Rate of 2°C/min with a Total Argon Gas Flow of 25 cm3/min.
Figure 3. Measured fraction of original binder mass remaining as a function of temperature during heating of PUNB bonded sand samples at rates of 2°C/min (3.6°F/min), 10°C/min (18°F/min), and 100°C/min (180°F/min) with a total argon gas flow of 25cm3/min. The piecewise polynomial fitted to the measurements corresponding to the 2°C/min (3.6°F/min) heating rate is also shown.
Figure 4. Comparison of measured and predicted metal-only height change as a function of temperature during heating. A constant volumetric expansion coefficient (obtained from separate experiments) was used to predict the metal expansion.
exactly equal to unity at or below 50C (122F) and to 0.1807 (the average binder mass fraction remaining at the conclu-sion of the decomposition) above 710C (1310F). The poly-nomial fit of the fraction of original binder mass remaining is superimposed on the corresponding measurements in Figure 3, and the equations of the polynomials are listed in Table 3.
Metal-only expansion tests
Figure 4 shows the measured metal-only expansion in the GED during heating at constant rates ranging from 2°C/min (3.6°F/min) to 15°C/min (27°F/min). The heating rate was always constant to within ±0.4°C/min (0.7°F/min). There is excellent repeatability in the height change measurements regardless of heating rate. It can be seen that the expansion
32 International Journal of Metalcasting/Spring 2012
behavior of the liquid metal is somewhat non-linear up until about 200C (392F). The non-linearity can be attributed to non-isothermality of the GED, as measured by the various thermocouples. The height measurement data in Figure 4 was used in Equation 2 to calculate an effective volumetric expansion coefficient of the liquid metal as a function of temperature. This parameter describes the metal expansion behavior specific to the present setup.
The liquid metal volumetric expansion coefficient obtained from the separate metal-only expansion tests employing the borosilicate bulb was found to be constant with respect to temperature. This constant volumetric expansion coefficient of the liquid metal, , is equal to 1.12x10⁻⁴ 1/°C (6.22x10-
5 1/°F). Using this value of , the predicted metal height change in the GED is plotted alongside the measured metal height change in Figure 4. It can be seen that the measured and predicted height change curves are parallel above 200C (392F), implying that is indeed the true metal expansion coefficient. However, the actual expansion behavior of the liquid metal, inclusive of any effects due to non-isothermality below 200C (392F), is directly described by . Subsequent-ly, was interpolated at intervals of 0.1°C from the GED measurements for use in the pure gas expansion and binder gas evolution calculations. The average density of the liquid metal at room temperature was found to be 6.297 g/cm3.
Pure Gas expansion tests
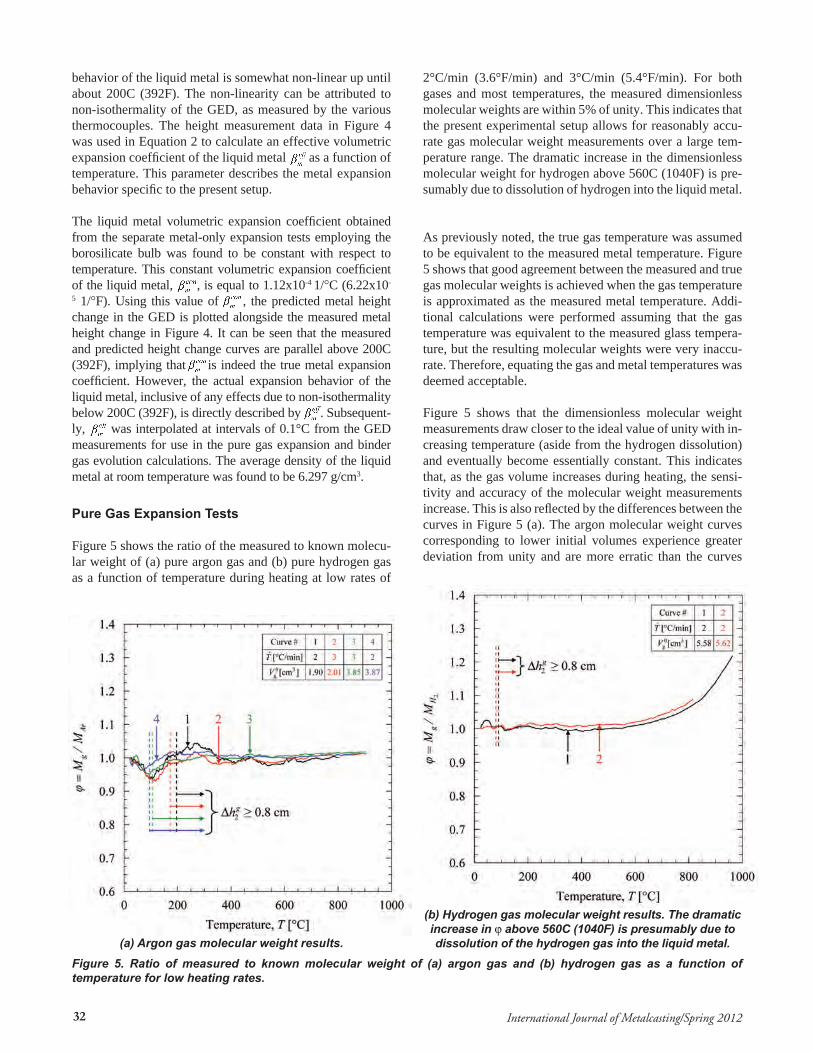
Figure 5 shows the ratio of the measured to known molecu-lar weight of (a) pure argon gas and (b) pure hydrogen gas as a function of temperature during heating at low rates of
2°C/min (3.6°F/min) and 3°C/min (5.4°F/min). For both gases and most temperatures, the measured dimensionless molecular weights are within 5% of unity. This indicates that the present experimental setup allows for reasonably accu-rate gas molecular weight measurements over a large tem-perature range. The dramatic increase in the dimensionless molecular weight for hydrogen above 560C (1040F) is pre-sumably due to dissolution of hydrogen into the liquid metal.
As previously noted, the true gas temperature was assumed to be equivalent to the measured metal temperature. Figure 5 shows that good agreement between the measured and true gas molecular weights is achieved when the gas temperature is approximated as the measured metal temperature. Addi-tional calculations were performed assuming that the gas temperature was equivalent to the measured glass tempera-ture, but the resulting molecular weights were very inaccu-rate. Therefore, equating the gas and metal temperatures was deemed acceptable. Figure 5 shows that the dimensionless molecular weight measurements draw closer to the ideal value of unity with in-creasing temperature (aside from the hydrogen dissolution) and eventually become essentially constant. This indicates that, as the gas volume increases during heating, the sensi-tivity and accuracy of the molecular weight measurements increase. This is also reflected by the differences between the curves in Figure 5 (a). The argon molecular weight curves corresponding to lower initial volumes experience greater deviation from unity and are more erratic than the curves
Figure 5. Ratio of measured to known molecular weight of (a) argon gas and (b) hydrogen gas as a function of temperature for low heating rates.
(a) Argon gas molecular weight results.
(b) Hydrogen gas molecular weight results. The dramatic increase in ϕ above 560C (1040F) is presumably due to dissolution of the hydrogen gas into the liquid metal.

33International Journal of Metalcasting/Spring 2012
corresponding to higher initial volumes for all temperatures. Hence, there is low accuracy in the molecular weight mea-surements when the change in gas volume is low, and this is especially true at lower temperatures. Therefore, a gas measurement cut-off criterion is imposed. The gas molecu-lar weight measurements are considered reliable when the portion of height change in cylinder 2 from gas expansion
gh2∆ is greater than or equal to 0.8 cm (0.315 in). The gas cut-offs for the pure gas expansion tests are shown in Figure 5 on each of the dimensionless molecular weight curves. It can be seen that the molecular weight measurements to the right of the gas cut-off are to within better than 5% of the true gas molecular weight. These “trusted” dimensionless molecular weight measurements also have good repeatability.
Figure 5 (a-b) indicates that the greatest deviation of the di-mensionless molecular weight from unity for either pure gas occurs between about 50C (122F) and 150C (302F). The GED was found to be the least isothermal within this tempera-ture range. Non-isothermality in the GED increases the error from equating the gas temperature with the metal tempera-ture, which subsequently increases the error in the molecular weight measurements. Figure 5 (a) shows that the error in the molecular weight measurements decreases with decreasing heating rate. The liquid metal acts as a large thermal mass, and lowering the heating rate reduces the temperature lag of the liquid metal compared to the other contents of the GED. It was concluded from these results that the binder gas tests were best performed at a low heating rate of 2°C/min (3.6°F/min), which would maximize the isothermality of the GED and minimize the error in the molecular weight measure-ments. Figure 5 (a-b) also shows that dimensionless molecu-lar weight measurements for temperatures lower than 200C (392F) are closer to unity for the hydrogen tests compared to those for the argon tests. The initial volumes of hydrogen were somewhat greater than those for argon, which improved the accuracy of the hydrogen molecular weight measure-ments. In addition, the thermal conductivity of hydrogen is ten times greater than that of argon.32 This caused the hydrogen to be more isothermal than the argon and further improved the accuracy in the hydrogen molecular weight measurements compared to argon. These findings further support the deci-sions to impose a gas measurement cut-off criterion and use a low heating rate of 2°C/min (3.6°F/min) for the binder gas evolution tests. Additional analysis of the GED isothermality and other experimental results for the expansion of pure gas in the GED may be found elsewhere.27
Binder Gas evolution tests
The measured height change as a function of temperature for all PUNB bonded sand tests performed using the GED are plotted in Figure 6. The heating rate was 2°C/min (3.6°F/min), and measurements during cooling (dashed lines) are shown when available. The different curves correspond to different initial bonded sand sample masses. Care must be taken when comparing them, since different initial sample masses result
in different volumes of evolved gas. Figure 6 also shows the average metal-only height change for comparison. As ex-pected, decomposition of the PUNB bonded sand generates a significant amount of binder gas and dramatically increases the measured height change. In general, the height change increases monotonically with temperature. At approximately 585C (1085F), however, the height change rapidly increases and then suddenly decreases with increasing temperature. This substantial peak in the binder gas volume is reproducible and will be discussed in greater detail later in the discussion. After the height change rapidly decreases, it levels out and then continues to increase monotonically with increasing tem-perature. The maximum achievable temperature was limited by the maximum allowable height change and the maximum temperature of the furnace. Larger initial sample masses were used to achieve greater height changes and, hence, more ac-curate molecular weight measurements at low temperatures. Good repeatability in the height change measurements for similar sample masses can be observed. It can be seen that the height change during cooling decreases linearly for only the 0.637 g and 0.690 g tests. This indicates that the binder gas did not condense during the cooling portions of these tests. The binder gas behavior during cooling will be addressed in greater detail later.
Figure 7 shows the measured binder gas molecular weights for all PUNB bonded sand tests as a function of temperature. The testing conditions and curve coloring correspond to those of Figure 6, and only gas measurements meeting the gas cut-off criterion ( gh2∆ ≥ 0.8 cm [0.315 in]) are included. It can be seen that during heating, the binder gas molecular weight rap-idly decreases from 375 g/mol at 115C (239F) to 99.8 g/mol
Figure 6. Measured height change as a function of temperature during heating and cooling of different PUNB bonded sand sample masses. Solid lines indicate heating at a rate of 2°C/min (3.6°F/min), and dashed lines indicate cooling after the furnace was turned off.

34 International Journal of Metalcasting/Spring 2012
at 200C (392F). Then, the molecular weight is approximately constant until 270C (518F), after which it decreases at a de-creasing rate to 51.6 g/mol at 500C (932F). After decreasing slightly further above 500C (932F), the binder gas molecular weight steeply decreases from 47.7 g/mol at 550C (1022F) to 30.3 g/mol at 585C (1085F) and then steeply increases to 47.2 g/mol at 630C (1166F). This steep decrease and increase in the binder gas molecular weight measurements corresponds to the peak in the height change measurements mentioned in connection with Fig. 6. The molecular weight remains essen-tially constant from 630C (1166F) to 750C (1382F). Recall that no additional binder gas mass is generated at tempera-tures above 710C (1310F). Beyond 750C (1382F), the mea-sured binder gas molecular weight gradually decreases to 33.3 g/mol at 898C (1648F), indicating that the binder gas compo-nents continue to react with each other after the solid binder decomposition is complete.
It can be seen from Figure 7 that the molecular weight measurements have excellent repeatability across the en-tire temperature range. It is also noteworthy how the mo-lecular weight curves from different experiments agree at 300C (572F). The volume of gas evolved from the larger sample masses of bonded sand is large by 300C (572F), which ensures that the corresponding binder gas molecular weight measurements at this temperature are accurate. Figure 7 shows that the gas measurement cut-off (i.e., the point where the molecular weight measurements become reliable) when smaller amounts of bonded sand are employed corresponds to temperatures near 300C (572F). The good agreement between the binder gas mo-lecular weight measurements at 300C (572F) for different amounts of bonded sand proves that the imposed gas mea-surement cut-off provides an effective means to differen-tiate between reliable and unreliable binder gas molecular weight measurements.
When the binder gas molecular weight was determined dur-ing the cooling portion of the tests, the binder gas mass was assumed to be constant and equal to the value at the test’s maximum temperature. This assumption is valid only if the binder gas does not condense during cooling. The binder gas molecular weight cannot be calculated if condensation occurs, since the mass of the gas then decreases in an unknown man-ner. Figure 7 shows binder gas molecular weight measurements during cooling for those tests that clearly exhibited no binder gas condensation (dashed lines). It can be seen that the binder gas is composed of fixed gases for all tests where the GED was heated to temperatures above about 710C (1310F). Interestingly, this temperature corresponds to the one where the decomposition of the bonded sand samples ceases based on the TGA measurements.
The estimated error in the measurement of the binder gas molecular weight during heating was determined through a detailed root-sum-squares error analysis. The primary sources of error in the binder gas molecular weight mea-
surements are shown in Table 4, with average values re-ported for parameters that are temperature-dependent (f and
effmβ ). The significance of each primary error source on the
molecular weight measurements is related to the total ini-tial PUNB bonded sand sample mass and the measurement temperature. For example, when the bonded sand sample mass is large, more binder gas mass is evolved and the er-ror in the fraction of original binder mass remaining has a greater impact on the molecular weight measurements. The average error in the present binder gas molecular weight measurements between 115C (239F) and 898C (1648F) is estimated to be 6%.
Figure 7. Binder gas molecular weight measurements as a function of temperature during heating and cooling of different PUNB bonded sand sample masses. The color scheme of the curves follows that of Figure 6. The heating rate was 2°C/min (3.6°F/min), and measurements during cooling are shown for tests that clearly exhibited no binder gas condensation.
Table 4. Primary Sources of Error in the Binder Gas Molecular Weight Measurements

35International Journal of Metalcasting/Spring 2012
It was hypothesized that the dramatic inverse peak in the molecular weight measurements at 585C (1085F) was due to the effects of hydrogen dissolution into the liquid metal. Figure 5 (b) clearly shows that hydrogen dissolution does not cause any peak in the measured molecular weight. In addition, the composition data shown in Table 1 indicate that hydrogen evolution is insignificant at temperatures around 750C (1382F). This further supports the conclu-sion that the peak in the measured binder gas molecular weight is not due to hydrogen dissolution. Regardless of these facts, the possible issue of hydrogen dissolution and its potential effects on the measured binder gas molecular weight were investigated further. The rate of hydrogen dissolution into the liquid metal was determined from the pure hydrogen molecular weight measurements. As a worst case approximation, it was assumed that binder gas hydrogen dissolves into the liquid metal at the same rate as pure hydrogen. The volume of hydrogen corresponding to the mass of binder gas hydrogen that “hypothetically” dissolved during heating was added back into the binder gas molecular weight calculations. On a worst case basis, hydrogen dissolution changes the binder gas molecular weight measurements above 560C (1040F) by a maxi-mum of only 4 g/mol. Since hydrogen is not expected to evolve within the temperature range of the present mea-surements, the above described hydrogen dissolution cor-rection of the measured binder gas molecular weight was discarded. The details of correction for hydrogen dissolu-tion are described elsewhere.27
It was also hypothesized that the inverse peak in the binder gas molecular weight measurements at 585C (1085F) was related to a volume change in the silica sand, caused by the increase in thermal expansion accompanying the sand’s α–β phase transformation at 573C (1063F).33 An additional ex-periment was performed to evaluate this hypothesis. The ex-pansion of 1.018 g of pure silica sand, 3.8 cm3 (0.232 in3) of argon, and the liquid metal in the GED was measured during heating at a rate of 2°C/min (3.6°F/min). The results show that no peak in the molecular weight measurements occurs when argon and sand are heated in the GED. Additional de-tails are given elsewhere.27
It is also possible that the inverse peak in the measured binder gas molecular weight at 585C (1085F) is caused by a reaction between the binder gas and the sand. However, it is more likely that the peak simply reflects the actual binder gas evolution behavior. It can be seen from Figure 3 that the fraction of original binder mass remaining does not experi-ence any unusual behavior at 585C (1085F). This implies that the inverse peak in the measured binder gas molecu-lar weight may simply be due to a rapid formation of low molecular weight gaseous compounds followed by the for-mation of higher molecular weight compounds. Recall that the bonded sand samples in the GED were immersed in the evolved binder gas and that the binder gas was not purged during the tests. Therefore, it is possible that the simultane-
ous presence of binder gas and bonded sand influences the manner in which additional gas is evolved from the bonded sand or the manner in which the previously evolved binder gas components react with one another during heating at temperatures near 585C (1085F).
The measured binder gas behavior during all tests, including both the heating and cooling portions, can also be compared in terms of the moles of binder gas per original binder mass, nb. This quantity was calculated from
Eqn. 13
The second equality in Equation (13) indicates that nb does not depend on the mass of the binder gas, mb, but can be directly calculated from the measured gas volumes, pres-sures, and temperatures. The moles of binder gas per origi-nal binder mass for all binder gas evolution tests are plotted as a function of temperature in Figure 8. Again, the testing conditions and curve coloring correspond to those of Fig-ure 6, and only gas measurements meeting the gas cut-off criterion ( gh2∆ ≥ 0.8 cm [0.315 in]) are included. It can be seen that, as expected, all heating curves nicely coincide. A significant decrease in the evolved binder gas moles per original binder mass during cooling indicates condensa-tion of the binder gas. As shown in Figure 8, the binder
Figure 8. Measured binder gas moles generated per original binder mass as a function of temperature during heating and cooling of different PUNB bonded sand sample masses. The color scheme of the curves follows that of Figure 6. The heating rate was 2°C/min (3.6°F/min), and a significant decrease in nb during cooling indicates condensation of the binder gas.

36 International Journal of Metalcasting/Spring 2012
gas does not condense when heated to temperatures above about 710C (1310F). However, heating the PUNB bonded sand samples to temperatures not exceeding about 510C (950F) results in partial condensation of the binder gas dur-ing subsequent cooling. This condensation starts to occur at approximately 165C (329F) in all tests.
The present binder gas molecular weight measurements were fit to a set of piecewise polynomials. They were also extrapolated to higher temperatures based on the average molecular weights calculated using the binder gas com-position data from References 13-16, and a final polyno-mial was fit to this extrapolation. The molecular weight polynomial curves and the binder gas molecular weights calculated from the data of References 13-16, 20, and 21 are plotted as a function of temperature in Figure 9. The equations for the binder gas molecular weight polynomials are listed in Table 5. Figure 9 shows that the decreasing be-havior of the present molecular weight measurements be-tween 710C (1310F) and 898C (1648F) is continued by the high temperature molecular weight data calculated from References 13-16. Following the extrapolated curve, it is expected that the binder gas molecular weight continues to decrease with increasing temperature from 898C (1648F) to 1350C (2462F). The molecular weight can be expected to remain approximately constant at 17.4 g/mol for tem-peratures above 1350C (2462F). In addition, the present measurements are consistent with the molecular weight data calculated from References 20 and 21, aside from the high molecular weight of 137 g/mol at 500C (932F) that appears to be an outlier. Any differences with the data in References 20 and 21 could also be due to the fact that those data are for PUCB rather than PUNB.
The measured variation in the binder gas molecular weight with temperature reflects the binder’s thermal degradation mechanisms during heating. Giese et al.34 used differential scanning calo-rimetry (DSC) to measure the energy released from pure PUNB binder sam-ples (60:40 ratio of Part 1 to Part 2) during heating at a rate of 10°C/min (18°F/min). The various peaks in the DSC curve were associated with spe-cific physical or chemical changes in the binder. Figure 9 shows a portion of the solid binder’s thermal degrada-tion mechanisms superimposed on the fit of the binder gas molecular weight measurements. The high molecular weights measured at temperatures be-low 200C (392F) are likely from va-porized solvents. The breaking of the binder’s urethane bonds corresponds to the plateau in the gas molecular weight between 200C (392F) and 280C (536F). The breakdown of the binder to poly-
mer aromatics coincides with the decrease in the binder gas molecular weight between 280C (536F) and 400C (752F). The binder’s thermal degradation mechanisms above 400C (752F) are undetermined.
Table 5. Piecewise Polynomial Fitted to the Binder Gas Molecular Weight Measurements Obtained During Heating of
PUNB Bonded Sand Samples at a Rate of 2°C/min (3.6°F/min).
Figure 9. Piecewise polynomial fit of the binder gas molecular weight measurements as a function of temperature during heating at a rate of 2°C/min. The data fit is extrapolated based on the average molecular weights calculated from the data of Bates et al13-15 and Scott et al16 within two minutes after pouring. The fitted results are also compared with the binder gas molecular weights calculated from the data of McKinley et al20 and Lytle.21 The partial thermal degradation mechanism for a 60:40 ratio pure PUNB binder sample heated at a rate of 10°C/min (18°F/min) from Giese et al.34 is superimposed on the data fit.

37International Journal of Metalcasting/Spring 2012
conclusions
The present measurements reveal the complex nature of the gas evolution from PUNB bonded sand during heating and cooling. The TGA experiments provide the detailed variation of the binder mass with increasing temperature. The binder is found to be fully pyrolyzed at temperatures above 710C (1310F). At that temperature, 82% (by mass) of the original binder has become gaseous. Up to 100°C/min (180°F/min), the measured binder mass decrease does not appear to be a strong function of the heating rate. The observed differences in the TGA measurements among the different heating rates are likely due to sample non-isother-mality, and not due to chemical kinetics. The present GED measurements for a heating rate of 2°C/min (3.6°F/min) show that the molecular weight of the gas evolved from PUNB bonded sand decreases in a complex manner from 375 g/mol at 115C (239F) to 33.3 g/mol at 898C (1648F). When the binder is fully pyrolyzed, continued chemical reactions within the gas cause its molecular weight to de-crease from 48 g/mol at 710C (1310F) to values as low as 17.4 g/mol at 1350C (2462F) and beyond. In this tempera-ture range, the binder gas does not condense during subse-quent cooling to room temperature. When the bonded sand is not heated to temperatures above about 510C (950F), the binder gas partially condenses during subsequent cooling. This condensation starts to occur at approximately 165C (329F). For easy use in casting simulations that include calculation of gas evolution in the mold and cores, the pres-ent data are fit to polynomials that describe the binder gas mass and molecular weight variations with temperature.
Since the present TGA measurements reveal that the binder gas mass evolution is not a strong function of the heating rate up to 100°C/min (180°F/min), it may be concluded that the present data can be used to describe the gas evolu-tion behavior at any distance from the mold-metal inter-face. Such a conclusion may be erroneous and additional measurements at very high heating rates, corresponding to locations very near the mold-metal interface26, are needed to investigate the rate dependency. Additional TGA mea-surements are also needed to investigate the dependence of the binder decomposition on the composition of the at-mosphere. The present gas evolution measurements extend only up to about 900C (1652F), with the extrapolation to higher temperatures based purely on previous data. This extrapolation should be verified by additional measure-ments. From a fundamental point of view, it would be de-sirable to further investigate the exact cause of the inverse peak in the measured binder gas molecular weight near 585C (1085F). The nature of the binder gas condensation observed at low temperatures is also an item that requires additional research attention, since such condensation can affect the flow of gases in outer portions of the mold. While the present study focused on PUNB bonded sand, the mea-surement of gas evolution for different binder and sand systems would be highly valuable.
acknowledgements
This work was supported by the U.S. Department of Energy under grant number DE-FG36-06GO86029 through a sub-contract with the University of Northern Iowa. The authors would also like to express their gratitude to Professor Scott Giese of the University of Northern Iowa Department of In-dustrial Technology for his experimental support, Mr. Jerry Thiel and the staff of the University of Northern Iowa Metal Casting Center for their help with making the bonded sand specimens, Mr. Peter Hatch of the University of Iowa De-partment of Chemistry for his expertise in constructing the GED and all other quartz components, and Professors Allan Guymon and Gary Aurand of the University of Iowa Depart-ment of Chemical and Biochemical Engineering for the use of their TGA equipment.
references
1. Campbell, J., Castings, 2nd ed., pp. 99-116, Butterworth-Heinemann, Oxford, United Kingdom (2003).
2. Rahmoeller, K.M., “Mold Binder Decomposition: Prime Source of Cast Iron Defects Part 4 of 4,” Modern Casting, vol. 83, no. 10, pp. 36-39 (1993).
3. Bates, C.E., and Burch, R., “Core and Mold Gas Evo-lution: Porosity in Castings,” Foundry Management & Technology, vol. 135, no. 5, pp. 17-18 (2007).
4. Gibbs, S., “Illuminating Core Gas,” Modern Casting, vol. 98, no. 10, pp. 34-37 (2008).
5. Worman, R.A., Nieman, J.R., “A Mathematical System for Exercising Preventive Control over Core Gas Defects in Gray Iron Castings,” AFS Transactions, vol. 81, pp. 170-179 (1973).
6. Levelink, H.G., Julien, F.P.M.A., De Man, H.C.J., “Gas Evolution in Molds and Cores as the Cause of Casting Defects,” AFS International Cast Metals Journal, vol. 6, pp. 56-63 (March 1981).
7. Naro, R.L., Pelfrey, R.L., “Gas Evolution of Synthetic Core Binders: Relationship to Casting Blowhole Defects,” AFS Transactions, vol. 91, pp. 365-376 (1983).
8. Naro, R.L., “Porosity Defects in Iron Castings from Mold-Metal Interface Reactions,” AFS Transactions, vol. 107, pp. 839-851 (1999).
9. Monroe,R.,“PorosityinCastings,”AFS Transactions,vol.113,pp.519-546(2005).
10. Rogers, C., “Numerical Mold and Core Sand Simulation,” in Modeling of Casting, Welding, and Advanced Solidification Processes-X, eds. D.M. Stefanescu, J.A. Warren, M.R. Jolly, and M.J.M. Krane, TMS, Warrendale, PA, 2003, pp. 625-632.
11. Kimatsuka, A., Ohnaka, I., Zhu, J.D., Sugiyama, A., and Kuroki, Y., “Mold Filling Simulation for Predicting Gas Porosity,” in Modeling of Casting, Welding and Advanced Solidification Processes-XI, eds. C.A. Gandin and M. Bellet, TMS, Warrendale, PA, 2006, pp. 603-610.

38 International Journal of Metalcasting/Spring 2012
12. Starobin, A., Hirt, C.W., and Goettsch, D., “A Model for Binder Gas Generation and Transport in Sand Cores and Molds,” in Modeling of Casting, Welding and Advanced Solidification Processes-XII, eds. S.L. Cockcroft and D.M. Maijer, TMS, Warrendale, PA, pp. 345-352 (2009).
13. Bates, C.E. and Scott, W.D., “The Decomposition of Resin Binders and the Relationship Between Gases Formed and the Casting Surface Quality Part 2 – Gray Iron,” AFS Transactions, vol. 84, pp. 793-804 (1976).
14. Bates, C.E. and Scott, W.D., “Decomposition of Resin Binders and the Relationship Between the Gases Formed and the Casting Surface Quality – Part 3,” AFS Transactions, vol. 85, pp. 209-226 (1977).
15. Bates, C.E. and Monroe, R.W., “Mold Binder Decomposition and Its Relation to Gas Defects in Castings,” AFS Transactions, vol. 89, pp. 671-686 (1981).
16. Scott, W.D., Goodman, P.A., and Monroe, R.W., “Gas Generation at the Mold-Metal Interface,” AFS Transactions, vol. 86, pp. 599-610 (1978).
17. Naro, R.L. and Hart, J.F., “Phenolic Urethane No-Bake Binders: Ten Years of Progress,” AFS Transactions, vol. 88, pp. 57-66 (1980).
18. Trinowski, D.M., “Foundry,” in Phenolic Resins: A Century of Progress, ed. L. Pilato, pp. 451-502, Springer, New York, NY (2010).
19. Monroe,R.W.,SteelFounder’sSocietyofAmerica,CrystalLake,IL,privatecommunication(2011).
20. McKinley, M.D., Lytle, C.A., and Bertsch, W., “Pyrolysis of Core Resins Used in Metalcasting,” AFS Transactions, vol. 107, pp. 407-412 (1999).
21. Lytle, C.A., “Analysis of Volatiles from Foundry Resin Binder Systems,” Master’s Thesis, University of Alabama, Tuscaloosa, AL (1997).
22. Zhang, B., Garro, M., Chautard, D., Tagliano, C., “Gas Evolution from Resin-Bonded Sand Cores Prepared by Various Processes,” Metallurgical Science and Technology, vol. 20 no. 2, pp. 27-32, (2002).
23. Scarber, P., Bates, C.E., Griffin, J., “Effects of Mold and Binder Formulations on Gas Evolution When Pouring Aluminum Castings,” AFS Transactions, vol.
114, pp. 435-445 (2006).24. Winardi, L., Littleton, H.E., Bates, C.E., “Gas
Pressures in Sand Cores,” AFS Transactions, vol. 115, pp. 303-312 (2007).
25. Winardi, L., Griffin, R.D., Littleton, H.E., Griffin, J.A., “Variables Affecting Gas Evolution Rates and Volumes from Cores in Contact with Molten Metal,” AFS Transactions, vol. 116, pp. 505-521 (2008).
26. Thole, J. and Beckermann, C., “Measurement of Elastic Modulus of PUNB Bonded Sand as a Function of Temperature,” Int. J. Metalcasting, vol. 4, no. 4, pp. 7-18 (2010).
27. Samuels, G.J., “Measurement of Gas Evolution from PUNB Bonded Sand as a Function of Temperature,” Master’s Thesis, University of Iowa, Iowa City, IA (2011).
28. DASYLab® v8.0, National Instruments, 11500 N. Mopac Expwy, Austin, TX 78759.
29. Incropera,F.P.,DeWitt,D.P.,Bergman,T.L.,Lavine,A.S.,Fundamentals of Heat and Mass Transfer,6thedition,pp.563-564,JohnWiley&Sons,Inc.,Hoboken,NJ(2007).
30. Munson, B.R., Young, D.F., Okiishi, T.H., and Huebsch, W.W., Fundamentals of Fluid Mechanics, 6th edition, pp. 50-53, John Wiley & Sons, Inc., Hoboken, NJ (2009).
31. Moran, M.J., Shapiro, H.N., Boettner, D.D., and Bailey, M.B., Fundamentals of Engineering Thermodynamics, 7th edition, pp. 706-711, John Wiley & Sons, Inc., Hoboken, NJ (2010).
32. Vargaftik, N.B., Filippov, L.P., Tarzimanov, A.A., and Totskii, E.E. Handbook of Thermal Conductivity of Liquids and Gases, pp. 16-48, CRC Press, Boca Raton, FL (1994).
33. Peters, F., Voigt, R., Ou, S.Z., and Beckermann, C. “Effect of Mould Expansion on Pattern Allowances in Sand Casting of Steel,” Int. J. Cast Metals Research, vol. 20, no. 5, pp. 275-287 (2007).
34. Giese, S.R., Roorda, S.C., and Patterson, M.A., “Thermal Analysis of Phenolic Urethane Binder and Correlated Properties,” AFS Transactions, vol. 117, pp. 355-366 (2009).

39International Journal of Metalcasting/Spring 2012
technical review and discussion
Measurement of Gas evolution from PunB Bonded sand as a function of temperatureG. Samuels and C. Beckermann; Dept. of Mechanical and Industrial Engineering, University of Iowa, Iowa City, IA, USA
Reviewer: The main drawback of the experimental tech-nique is that the collected gas is not necessarily the gas trans-porting through the core under casting conditions. Gas-metal physical (dissolution) and chemical reactions should affect what transports and it would be useful to study this interac-tion in a controlled experiment.
Authors: Additional experiments may be needed to study the effect of gas-metal interactions. The present study fo-cuses on binder gas evolution away from the metal-mold interface. Unlike in previous experiments, the evolved gas in the present volume measurement apparatus stays in contact with both the already evolved gas and the yet unreacted binder. This is quite close to the situation in-side of a mold, away from the metal-mold interface. It is true that the binder gas is transported in the mold and its composition continually changes. But the atmosphere in the present measurement apparatus is evolved binder gas, not some inert gas.
Reviewer: The claim that the rate dependence is weak is unsubstantiated. Metal-mold interface heating rates are at least an order of magnitude higher than those achieved in the experiment. Even at the achieved rates, the overall shift of the decomposition curve to the right by about 50 degrees in Figure 3 is in fact not insignificant. The trend will continue as the heating rates begin approaching cast-ing conditions.
Authors: Yes, heating rates at the metal-mold interface are at least an order of magnitude higher. As is stated in the paper, the heating rates in the present experiments are encountered during casting at distances from the metal-mold interface greater than about 1.3 cm (0.5 in). The statement that the rate dependency is not strong up to 100oC/min is substantiated by the present TGA measure-ments. The shifts in Fig. 3 are explained in the paper as follows: “More likely, the delays are simply caused by greater non-isothermality of the bonded sand samples for higher heating rates. For high heating rates, the center of the bonded sand samples can be expected to be some-what cooler than the surface. This implies that the lower heating rate results better reflect the ‘true’ decomposition behavior at a given temperature.” In other words, we be-lieve that the shift to the right at higher heating rates is simply due to non-isothermality of the sample in the TGA apparatus. Our studies with higher TGA gas flow rates (see Samuels’ thesis) also back up this statement.
Furthermore, we say in the Conclusions: “Since the present TGA measurements reveal that the binder gas mass evolu-tion is not a strong function of the heating rate up to 100°C/min (180°F/min), it may be concluded that the present data can be used to describe the gas evolution behavior at any distance from the mold-metal interface. Such a conclusion may be erroneous and additional measurements at very high heating rates, corresponding to locations very near the mold-metal interface, are needed to investigate the rate dependency.”
Reviewer: Polynomial fits used in Table 3, while useful, are not exactly appropriate to the context. A first order kinetic fit (multi-rate) has the mentioned “shift-up” effect built into it, was used by Lytle and McKinley to parameterize TGA of PUCB, and could be used here.
Authors: The present polynomial fits are appropriate up to about 100oC/min, when the heating rate effect is small. While we did perform TGA measurements at multiple heating rates, and could have done a “kinetic” fit of those data, it would have been inappropriate due to the closeness of these TGA data (considering the scatter even at a single heating rate) and the lack of data at higher heating rates. We believe that the “shift-up” effect seen in the present TGA measurements is simply due to sample non-isothermality, not any chemical kinetics. We did not perform gas volume measurements at different heating rates (only at 2oC/min), so a “kinetic” fit of the molecular weight data is not possible.
Reviewer: A multi-rate 1st order Arrhenius fit would allow comparison of binders. A claim is made that the two (PUCB and PUNB) are “similar”. Judging from the TGA in [20, 21], this claim is incorrect. The decomposition range of PUCB with 150 deg/min heating is ~77-527 C and the residue frac-tion is 28%. The data in Figure 3 for PUNB suggest a range of ~200-700 C and a residue fraction of 15%. Further the decomposition rate of PUNB looks bi-modal, while PUCB decomposition rate is not.
Authors: The paper introduction states that PUCB and PUNB can be “reasonably compared”. However, the paper does not use the PUCB data for much other than to show that at high temperatures, the previously measured gas mo-lecular weights for PUCB and PUNB are very close to each other. A more detailed comparison with PUCB is outside the scope of the present study. The residue fraction for PUCB of 28% in references 20 and 21 is likely inaccurate and is in reality probably closer to our measured value for PUNB of 18% (not 15%). We state in the paper that “It should be noted that applying the correction changes the fraction of original binder mass remaining by as much as 10% at the maximum decomposition temperature.” This refers to the correction of the bias in the TGA machine. The details of this correction are provided in Samuels’ thesis. In references 20 and 21, the bias was not corrected.

40 International Journal of Metalcasting/Spring 2012
Reviewer: The data in Figure 7 could be presented in a “dif-ferential” form (with an aid of a chain rule and a measured de-pendence). This (arguably) would be a more useful data to the modeler of gas pressure. This would also shed more light on the observed inverse peak. The peak could very well be a result of a specific gas phase reaction active at that temperature (the possibility is not discussed). One way to distinguish gas-phase from condensed phase decomposition reactions is to look at the DTA trace collected under an inert (purged) atmosphere.
Authors: The paper indicates that the inverse peak could be due to “the manner in which the previously evolved binder gas components react with one another”. The fact that con-densed phase decomposition is probably not causing the peak can be seen from the absence of any peak in the TGA curve in Fig. 3.