measurement of expanding oak wilt centers in live oak · measurement of expanding oak wilt centers...
TRANSCRIPT
Ecology and Epidemiology
Measurement of Expanding Oak Wilt Centers in Live Oak
D. N. Appel, R. C. Maggio, E. L. Nelson, and M. J. Jeger
Associate professor, Department of Plant Pathology and Microbiology; associate professor, Department of Forest Science; andgraduate research assistant, Computer Science Department, Texas A&M University, College Station 77843; and U.K. OverseasDevelopment Natural Resources Institute, London, U.K.
We acknowledge the city of Austin and the USDA Forest Service, Region 8, State and Private Forestry, Forest Pest Management,for their financial assistance in completing this work.
Accepted for publication 28 July 1989 (submitted for electronic processing).
ABSTRACT
Appel, D. N., Maggio, R. C., Nelson, E. L., and Jeger, M. J. 1989. Measurement of expanding oak wilt centers in live oak. Phytopathology79:1318-1322.
Local, tree-to-tree spread of Ceratocystis fagacearum was monitored live oak density. The largest initial focus had a lesser oak density andin live oak (Quercus fusiformis) with sequential, color infrared aerial increased from 1.5 to 6.6 ha, affecting 11,396 m2 of crown cover. Crownphotography during 1982-1987. A computer-based system for analyzing survival in 1987 ranged from 4 to 26% for trees that originally showedexpanding foci was developed to measure rates of crown defoliation and symptoms in 1982. A strong linear correlation between the area of affectedmortality, as well as expansion distances. Four foci expanded radially crown cover and total area occupied by each focus was noted. The rapidan average of 11-16 m/yr, with longer maximum distances of expansion rates of focus expansion were attributed to a high potential for root(up to 40 m/yr) commonly occurring. One focus that expanded most grafting and the occurrence of common root systems among clonallyrapidly increased from 0.3 to 3.6 ha over 5 yr, affecting 10,774 m2 of propagated live oaks.crown cover. This was initially the smallest focus, and it had the greatest
Additional keywords: Ceratocystisfagacearum, epidemiology, Quercusfusiformis.
Oak wilt "centers" are classical examples of disease foci, or in live oak; and to facilitate the placement of barriers for diseaselocal concentrations of diseased plants about primary sites of control. This report describes the system and illustrates someinfection (10). As defined, the size and shape of foci tend to important aspects of oak wilt epidemiology in Texas.influence patterns of further spread. Contaminated insects(Coleoptera: Nitidulidae) initiate foci in new areas by acquiring MATERIALS AND METHODSCeratocystisfagacearum (Bretz) Hunt from inoculum sources inpreviously established centers (11). After initial infection, these The sequential, 1:12,000 scale, CIR aerial photography wasfoci then expand from perimeter trees to adjacent trees by fungal described in the report of a previous survey (4). The first phototransmission through functional root connections (16,25,26). The mission was flown in August 1982 and followed by similar missionsconnections are usually root grafts, but common root systems in August 1983, October 1985, and September 1987. Photointer-arising from vegetative root suckering may also contribute to pretation was done on a Krones LZK Photomultiplier (Krones,fungal spread in live oaks (Quercusfusiformis Small) (2). Inc., Franklin, WI) at approximately a 7.5 times enlargement
Transmission of C. fagacearum through root connections is of the original photographs. The crowns of individual trees andtermed "local" spread and is usually specified as any occurrence clumps of trees were delineated as polygons and rated as healthyof a diseased tree within 15.2 m (50 ft) of the originally infected (0), diseased (1 or 2), dead (3), or trees of other species (4). Whensource tree (6). Local spread causes the majority of tree losses removal of diseased trees was detected, they were recorded asin the midwestern United States (1,19). The same is believed to dead. A geographic information system (Micro-GIS) was usedbe true of live oak mortality in Texas, but attempts to quantify to digitize both spatial and attribute data into a microcomputerthe rates of local spread and resultant losses have not been re- (18). These data were then transferred to a mainframe computerported. In a previous survey, patches of oak wilt in Texas live for further analysis.oak averaged 3.6 ha, sometimes reached 80 ha, and contained A Fortran program (Interactive Oak Wilt Analysis Program,hundreds of trees (2,4). These large patches are often conglom- IOWAP) was prepared to reproduce a map of the disease centererates of numerous foci with long, rapidly expanding, and irregular and to compute simple statistics (5). The IOWAP software packageperimeters. The large sizes make local spread difficult to predict includes tools for data verification, high quality graphics output,and control, particularly in urban locations (3). and interactive analysis. Because of the expected large sizes of
Remote sensing with color infrared (CIR) aerial photography the input data sets, most of the computation is done in an inter-has proven to be a valuable tool in studying spatial patterns of active environment on the mainframe. The package does provideforest disease extending over large areas (23). In an aerial survey additional analyses for interaction on a microcomputer. The un-of Texas oak mortality, discrete oak wilt foci were easily discerned derlying goal for the analyses is to determine an origin and theon CIR photography (4). The expansion of individual foci was distances from it to the perimeter of the focus. The perimeteralso clearly observed when sequential photographs were taken distances, areas, and yearly health categories for individual poly-in subsequent surveys (5). A computerized system was developed gons are listed by the program, and total areas are computedfor detecting patterns of mortality and measuring rates of expan- for each disease category in every year. The polygon selectedsion in actively growing foci, as monitored by CIR aerial pho- as a reference point (origin) from which linear rates of expansiontography. The objectives of this project were: to investigate the were measured is chosen on the bases of least distance from allpotential for utilizing aerial photography to predict patterns of other polygons and poorest health rating; it was considered thefungal spread; to gain a better understanding of fungal behavior hypothetical original infection point.
In this study, four foci confirmed as oak wilt in previous surveys_________________________________________________ were selected to illustrate the capabilities of the system and various
© 1989 The American Phytopathological Society aspects of the disease in live oak. The sizes and characteristics
1318 PHYTOPATHOLOGY
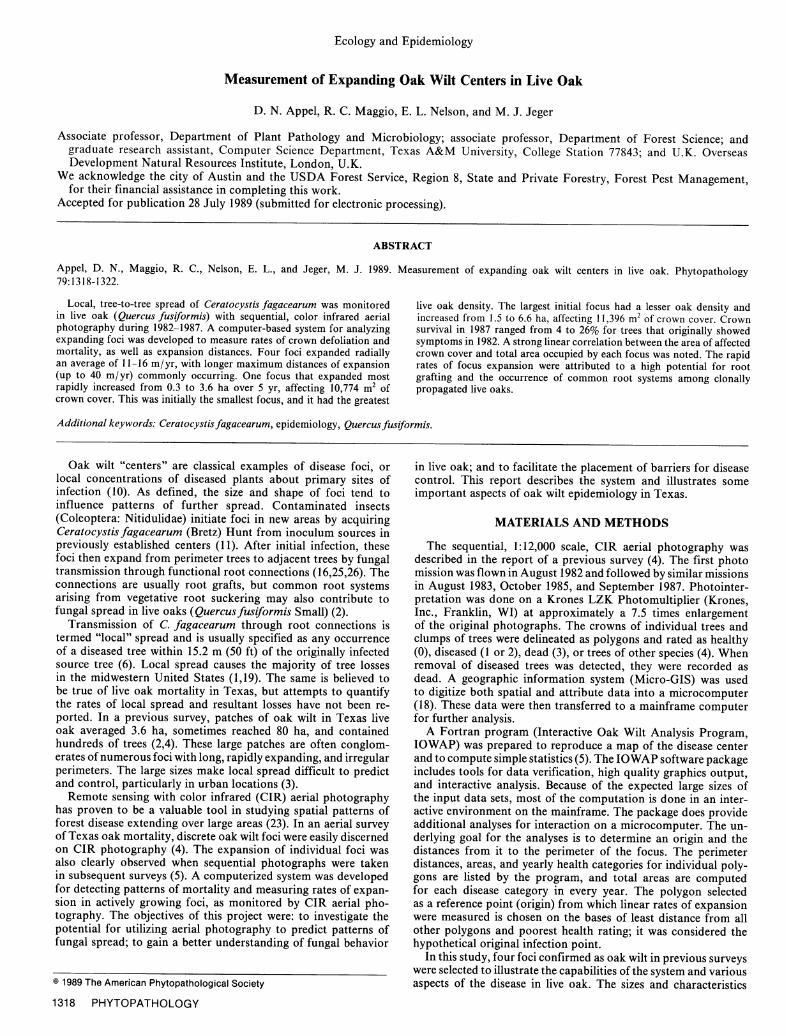
of the crown cover comprising each disease center are given in geographic boundaries, were not included in determining ratesTable 1. Foci sizes were measured with a planimeter on a simulated of expansion.map of diseased and healthy crowns. Two population parameterswere used to describe live oak stand characteristics. The first RESULTSis the area of live oak crown cover, expressed as a proportionof total crown cover, including other species. The second was The four foci in Table 1 were chosen for illustration becauserelative density of live oak, defined as the area of live oak crown they were distinct, relatively small, and surrounded by susceptiblecover per total area of the foci in 1987. Species of trees other hosts. The opportunity for spread was not the same in each loca-than live oak were identified by their defoliated condition using tion. For example, all eight octants in foci KBBP282 containedwinter aerial photography. susceptible hosts immediately adjacent to diseased trees during
To measure linear expansion, each focus was divided into oc- 1982-1983 and 1983-1985 (Table 1), but during the first year,tants as described by Cobb et al (9). Two different measurements spread occurred in only one octant (Fig. 1). During the secondwere made to define expansion of the foci. The average expansion and third years (1983-1985), KBBP282 spread in seven directions.rate was determined by analyzing the changes in annual distances As this focus expanded, the opportunity for new infections wasfrom diseased crowns to the original infection in all octants where reduced to five octants in the fourth and fifth years; spreadsusceptible hosts existed on foci perimeters. The maximum expan- occurred in only three. A similar trend was observed at the othersion rate represented similar measurements for only those octants foci, where expansion systematically depleted susceptible hostswhere spread actually occurred. Octants where no opportunity in various directions. Although delays of a year or more sometimesexisted for spread, such as those adjacent to open fields or major occurred, healthy trees on perimeters eventually became diseased
(Fig.l). The least opportunity for spread was found in KBB26bbecause the center was initiated along a fencerow on the edge
METERS METERS of a mixed oak stand (Q. fusiformis and Q. stellata) bounded300 300 by an open field. Other barriers to expansion included deep
A. Year 1 B. Year 2• streams and gullies, major highways, or abrupt changes in species250 250ascomposition.
200 Because of the limited opportunity for spread, the size increase200 •200
200 • • 200 .for KBB26b (from 0.8 to 2.8 ha) was the smallest of the four15 0 150 •i)
12000
100 •100
50 50E * KBBP2825o / 50 10000 B0--A--" KBB26b
0 50 100 150 200 250 0 50 100 150 200 250 -f- -- KBBP5METERS METERS r
LwIMETERS METERS > 8000
300 300 0C. Year 4 D. Year6 6 0
250 25
.. 6000
10 I 00 400
150 1 50 l
0 0~o 20000 50 100 150 200 250 0 50 100 1SO 200 250
METERS METERS
Rating System •0 • n • z
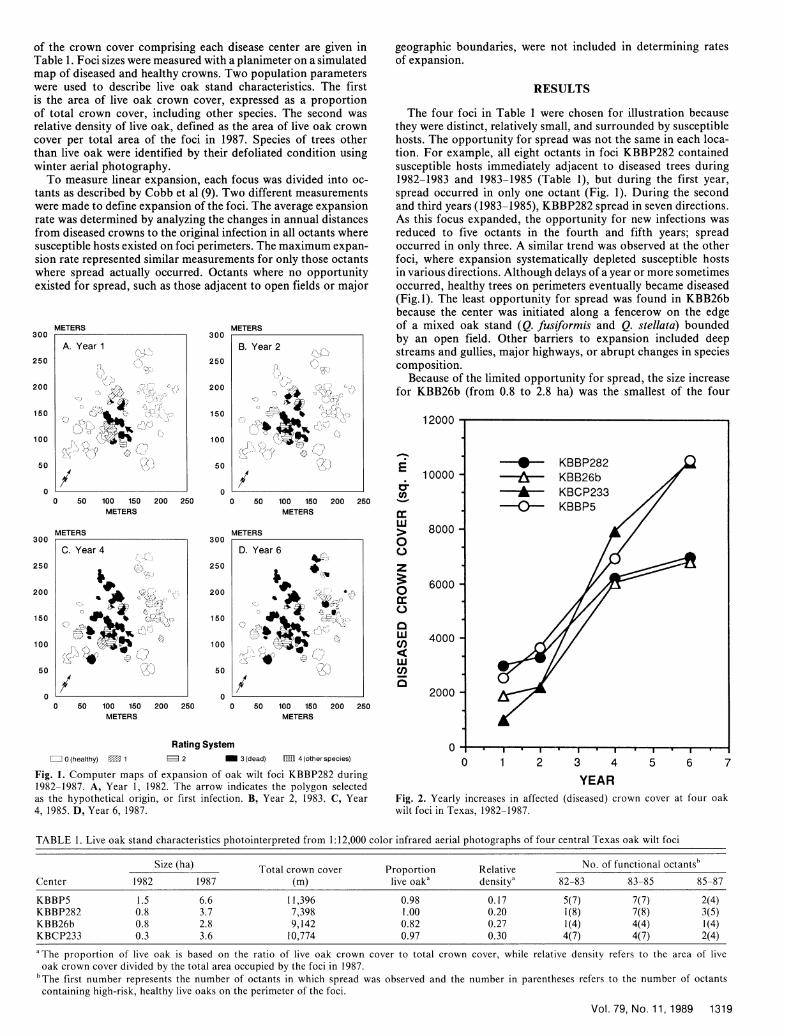
ESS 0 (healthy) 1 2 3 (dead) tIllTI 4 (other species) 0 1 2 3 4 5 6 7Fig. 1. Computer maps of expansion of oak wilt foci KBBP282 during YEAR1982-1987. A, Year 1, 1982. The arrow indicates the polygon selectedas the hypothetical origin, or first infection. B, Year 2, 1983. C, Year Fig. 2. Yearly increases in affected (diseased) crown cover at four oak4, 1985. D, Year 6, 1987. wilt foci in Texas, 1982-1987.
TABLE 1. Live oak stand characteristics photointerpreted from 1:12,000 color infrared aerial photographs of four central Texas oak wilt foci
Size (ha) Total crown cover Proportion Relative No. of functional octantsh
Center 1982 1987 (in) live oaka density' 82-83 83-85 85-87
KBBP5 1.5 6.6 11,396 0.98 0.17 5(7) 7(7) 2(4)KBBP282 0.8 3.7 7,398 1.00 0.20 1(8) 7(8) 3(5)K BB26b 0.8 2.8 9,142 0.82 0.27 1(4) 4(4) 1(4)KBCP233 0.3 3.6 10,774 0.97 0.30 4(7) 4(7) 2(4)
'•The proportion of live oak is based on the ratio of live oak crown cover to total crown cover, while relative density refers to the area of liveoak crown cover divided by the total area occupied by the foci in 1987.
bThe first number represents the number of octants in which spread was observed and the number in parentheses refers to the number of octantscontaining high-risk, healthy live oaks on the perimeter of the foci.
Vol. 79, No. 11, 1989 1319
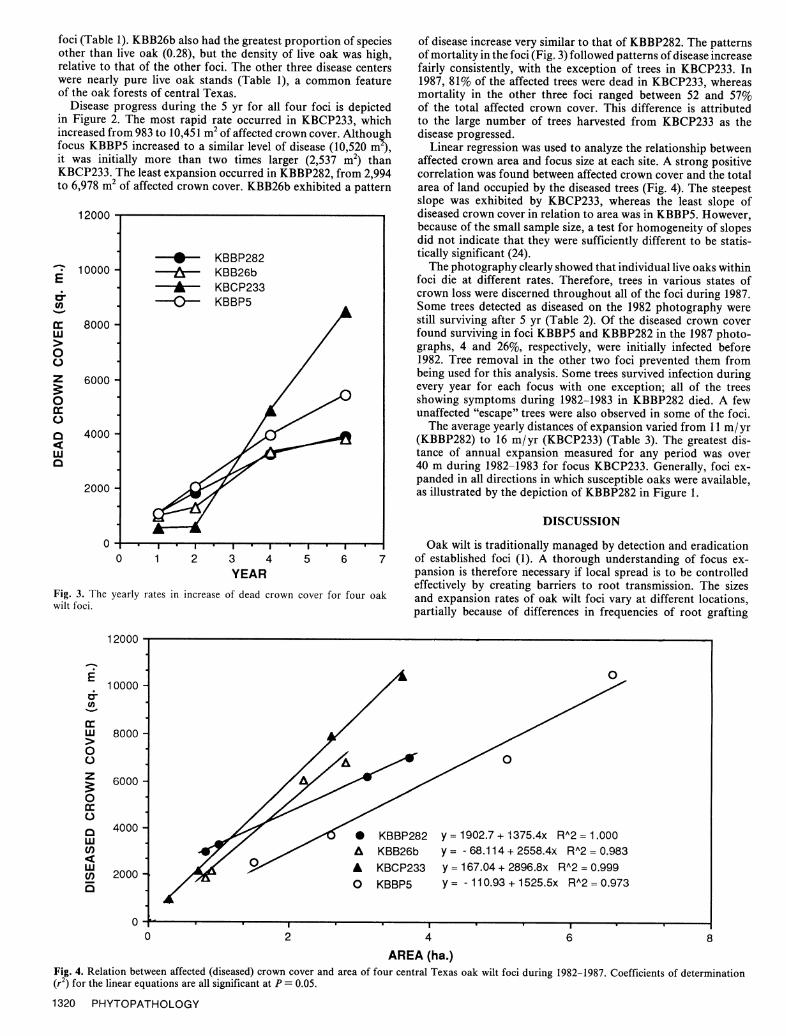
foci (Table 1). KBB26b also had the greatest proportion of species of disease increase very similar to that of KBBP282. The patternsother than live oak (0.28), but the density of live oak was high, of mortality in the foci (Fig. 3) followed patterns of disease increaserelative to that of the other foci. The other three disease centers fairly consistently, with the exception of trees in KBCP233. Inwere nearly pure live oak stands (Table 1), a common feature 1987, 81% of the affected trees were dead in KBCP233, whereasof the oak forests of central Texas. mortality in the other three foci ranged between 52 and 57%
Disease progress during the 5 yr for all four foci is depicted of the total affected crown cover. This difference is attributedin Figure 2. The most rapid rate occurred in KBCP233, which to the large number of trees harvested from KBCP233 as theincreased from 983 to 10,451 m2 of affected crown cover. Although disease progressed.focus KBBP5 increased to a similar level of disease (10,520 mi), Linear regression was used to analyze the relationship betweenit was initially more than two times larger (2,537 M2
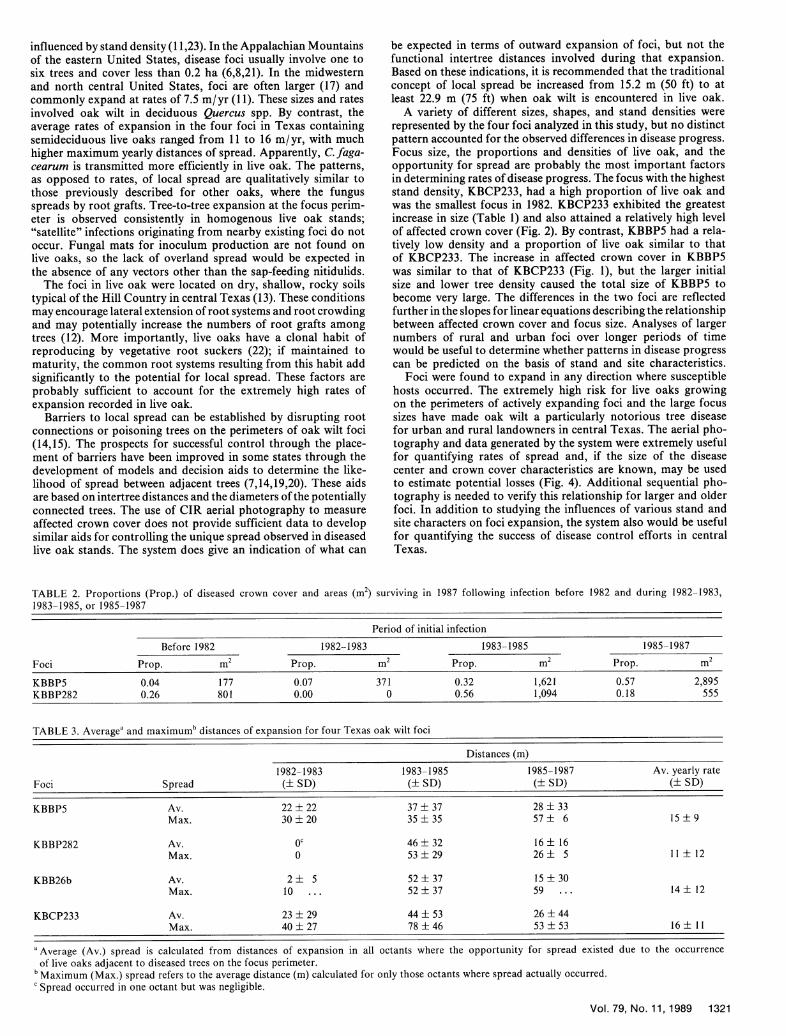
) than affected crown area and focus size at each site. A strong positiveKBCP233. The least expansion occurred in KBBP282, from 2,994 correlation was found between affected crown cover and the totalto 6,978 m2 of affected crown cover. KBB26b exhibited a pattern area of land occupied by the diseased trees (Fig. 4). The steepest
slope was exhibited by KBCP233, whereas the least slope of12000 diseased crown cover in relation to area was in KBBP5. However,
because of the small sample size, a test for homogeneity of slopesdid not indicate that they were sufficiently different to be statis-
KBBP282 tically significant (24).- 10000 A KBB26b The photography clearly showed that individual live oaks within
E -0000- KB0P263 foci die at different rates. Therefore, trees in various states ofKBCP233 crown loss were discerned throughout all of the foci during 1987.
C" Q KBBP5 Some trees detected as diseased on the 1982 photograph
CC 8000 still surviving after 5 yr (Table 2). Of the diseased crown coverwU found surviving in foci KBBP5 and KBBP282 in the 1987 photo-> graphs, 4 and 26%, respectively, were initially infected before0 1982. Tree removal in the other two foci prevented them fromZ 6000 being used for this analysis. Some trees survived infection duringZ 60every year for each focus with one exception; all of the treesO showing symptoms during 1982-1983 in KBBP282 died. A few
unaffected "escape" trees were also observed in some of the foci.0 The average yearly distances of expansion varied from 11 I/yrO 4000 - (KBBP282) to 16 m/yr (KBCP233) (Table 3). The greatest dis-wU tance of annual expansion measured for any period was overO 40 m during 1982-1983 for focus KBCP233. Generally, foci ex-
panded in all directions in which susceptible oaks were available,2000 as illustrated by the depiction of KBBP282 in Figure 1.
DISCUSSION
0..' .i. Oak wilt is traditionally managed by detection and eradication0 1 2 3 4 5 6 7 of established foci (1). A thorough understanding of focus ex-
YEAR pansion is therefore necessary if local spread is to be controlledeffectively by creating barriers to root transmission. The sizesFig. 3. The yearly rates in increase of dead crown cover for four oak and expansion rates of oak wilt foci vary at different locations,wilt foci. partially because of differences in frequencies of root grafting
12000 1
E010000 0
Wu 80000
Z 6000-
0
0S4000
wA•I A KBB26b y = - 68.114 + 2558.4x R^2 = 0.983
cn 20000 KBBP5 y = - 110.93 + 1525.5x R'2 =0.973
0 "I"' I I
0 2 4 6 8
AREA (ha.)Fig. 4. Relation between affected (diseased) crown cover and area of four central Texas oak wilt foci during 1982-1987. Coefficients of determination(r2) for the linear equations are all significant at P = 0.05.
1320 PHYTOPATHOLOGY
influenced by stand density (11,23). In the Appalachian Mountains be expected in terms of outward expansion of foci, but not theof the eastern United States, disease foci usually involve one to functional intertree distances involved during that expansion.six trees and cover less than 0.2 ha (6,8,21). In the midwestern Based on these indications, it is recommended that the traditionaland north central United States, foci are often larger (17) and concept of local spread be increased from 15.2 m (50 ft) to atcommonly expand at rates of 7.5 m/yr (11). These sizes and rates least 22.9 m (75 ft) when oak wilt is encountered in live oak.involved oak wilt in deciduous Quercus spp. By contrast, the A variety of different sizes, shapes, and stand densities wereaverage rates of expansion in the four foci in Texas containing represented by the four foci analyzed in this study, but no distinctsemideciduous live oaks ranged from 11 to 16 m/yr, with much pattern accounted for the observed differences in disease progress.higher maximum yearly distances of spread. Apparently, C. faga- Focus size, the proportions and densities of live oak, and thecearum is transmitted more efficiently in live oak. The patterns, opportunity for spread are probably the most important factorsas opposed to rates, of local spread are qualitatively similar to in determining rates of disease progress. The focus with the highestthose previously described for other oaks, where the fungus stand density, KBCP233, had a high proportion of live oak andspreads by root grafts. Tree-to-tree expansion at the focus perim- was the smallest focus in 1982. KBCP233 exhibited the greatesteter is observed consistently in homogenous live oak stands; increase in size (Table 1) and also attained a relatively high level"satellite" infections originating from nearby existing foci do not of affected crown cover (Fig. 2). By contrast, KBBP5 had a rela-occur. Fungal mats for inoculum production are not found on tively low density and a proportion of live oak similar to thatlive oaks, so the lack of overland spread would be expected in of KBCP233. The increase in affected crown cover in KBBP5the absence of any vectors other than the sap-feeding nitidulids. was similar to that of KBCP233 (Fig. 1), but the larger initial
The foci in live oak were located on dry, shallow, rocky soils size and lower tree density caused the total size of KBBP5 totypical of the Hill Country in central Texas (13). These conditions become very large. The differences in the two foci are reflectedmay encourage lateral extension of root systems and root crowding further in the slopes for linear equations describing the relationshipand may potentially increase the numbers of root grafts among between affected crown cover and focus size. Analyses of largertrees (12). More importantly, live oaks have a clonal habit of numbers of rural and urban foci over longer periods of timereproducing by vegetative root suckers (22); if maintained to would be useful to determine whether patterns in disease progressmaturity, the common root systems resulting from this habit add can be predicted on the basis of stand and site characteristics.significantly to the potential for local spread. These factors are Foci were found to expand in any direction where susceptibleprobably sufficient to account for the extremely high rates of hosts occurred. The extremely high risk for live oaks growingexpansion recorded in live oak. on the perimeters of actively expanding foci and the large focus
Barriers to local spread can be established by disrupting root sizes have made oak wilt a particularly notorious tree diseaseconnections or poisoning trees on the perimeters of oak wilt foci for urban and rural landowners in central Texas. The aerial pho-(14,15). The prospects for successful control through the place- tography and data generated by the system were extremely usefulment of barriers have been improved in some states through the for quantifying rates of spread and, if the size of the diseasedevelopment of models and decision aids to determine the like- center and crown cover characteristics are known, may be usedlihood of spread between adjacent trees (7,14,19,20). These aids to estimate potential losses (Fig. 4). Additional sequential pho-are based on intertree distances and the diameters of the potentially tography is needed to verify this relationship for larger and olderconnected trees. The use of CIR aerial photography to measure foci. In addition to studying the influences of various stand andaffected crown cover does not provide sufficient data to develop site characters on foci expansion, the system also would be usefulsimilar aids for controlling the unique spread observed in diseased for quantifying the success of disease control efforts in centrallive oak stands. The system does give an indication of what can Texas.
TABLE 2. Proportions (Prop.) of diseased crown cover and areas (M2) surviving in 1987 following infection before 1982 and during 1982-1983,
1983-1985, or 1985-1987
Period of initial infection
Before 1982 1982-1983 1983-1985 1985-1987
Foci Prop. m2 Prop. m2 Prop. m2 Prop. m2
KBBP5 0.04 177 0.07 371 0.32 1,621 0.57 2,895KBBP282 0.26 801 0.00 0 0.56 1,094 0.18 555
TABLE 3. Averagea and maximumb distances of expansion for four Texas oak wilt foci
Distances (in)
1982-1983 1983-1985 1985-1987 Av. yearly rateFoci Spread (±_ SD) (± SD) (± SD) (± SD)
KBBP5 Av. 22±+22 37±+37 28±+33Max. 30±_20 35±_35 57±_ 6 15±_9
KBBP282 Av. 0c 46 ±_ 32 16 ±_ 16Max. 0 53±_29 26±_ 5 11± 12
KBB26b Av. 2±__ 5 52±+_37 15±__30Max. 10 ... 52±__37 59 ... 14±__12
KBCP233 Av. 23 ±_ 29 44 ±_ 53 26 ±_ 44
Max. 40±__27 78±__46 53±__53 16±__11
aAverage (Av.) spread is calculated from distances of expansion in all octants where the opportunity for spread existed due to the occurrenceof live oaks adjacent to diseased trees on the focus perimeter.
bMaximum (Max.) spread refers to the average distance (in) calculated for only those octants where spread actually occurred.cSpread occurred in one octant but was negligible.
Vol. 79, No. 11, 1989 1321
LITERATURE CITED Exp. Stn. Bull. 680:48.15. Jones, T. W. 1971. An appraisal of oak wilt control programs in
I. Anderson, G. W., and Anderson, R. L. 1963. The rate of spread Pennsylvania and West Virginia. U.S. Dep. Agric. For. Serv. Res.of oak wilt in the Lake States. J. For. 61:823-825. Pap. NE-204. 15 pp.
2. Appel, D. N. 1986. Recognition of oak wilt in live oak. J. Arboric. 16. Kuntz, J. E., and Riker, A. J. 1950. Root grafts as possible means12:213-218. for local transmission of oak wilt. (Abstr.) Phytopathology 40:16-
3. Appel, D. N., and Lewis, R. L. 1985. Prospects for oak wilt control 17.in Texas. Pages 60-68 in: Insects and Diseases of Southern Forests. 17. MacDonald, W., and Hindal, D. 1981. Life cycle and epidemiologyR. A. Goyer and J. P. Jones, eds. Proc. 34th Annu. For. Symp., La. of Ceratocystis. Pages 113-144 in: Wilt Diseases of Plants. M. B.Agric. Exp. Stn., Louisiana State University, Baton Rouge. 135 pp. Mace, A. A. Bell, and C. H. Beckman, eds. Academic Press, New
4. Appel, D. N., and Maggio, R. C. 1984. Aerial survey for oak wilt York. 640 pp.incidence at three locations in central Texas. Plant Dis. 68:661-664. 18. Maggio, R. C., and Wunneburger, D. 1986. A microcomputer-based
5. Appel, D. N., Maggio, R. C., Nelson, E. L., and Jeger, M. J. 1987. geographic information system for natural resource managers. PagesA system for epidemiological analysis of oak wilt. (Abstr.) 296-300 in: Conference Proceedings; Geographic Information SystemPhytopathology 77:1717. Workshop. American Society for Photogrammetry and Remote
6. Boyce, J. S., Jr. 1957. Oak wilt spread and damage in the southern Sensing, April 1986. Atlanta, GA.Appalachians. J. For. 55:499-505. 19. Menges, E. S., and Kuntz, J. E. 1985. Predictive equations for local
7. Bruhn, J., Pickens, J., and Sunblade, M. 1987. Oak wilt in Menominee spread of oak wilt in southern Wisconsin. For. Sci. 31:43-51.Co., MI. Pages 72-81 in: Michigan Forest Pest Report, 1987. B. 20. Menges, E. S., and Loucks, 0. L. 1984. Modeling a disease-causedA. Montgomery, ed. MI Coop. For. Pest Management Pro. Ann. patch disturbance: Oak wilt in the midwestern United States. EcologyRep. 8-2. 81 pp. 65:487-498.
8. Casdorph, P. D. 1974. The 1974 oak wilt program. W. Va. Dep. 21. Mielke, M. E., Haynes, C., and Rexrode, C. 0. 1983. Local spreadAgric. Special Survey Rep. 74-2. 35 pp. of oak wilt in northeastern West Virginia during 1970-1982. Plant
9. Cobb, F. W., Slaughter, G. W., Rowney, D. L., and DeMars, C. Dis. 67:1222-1223.J. 1982. Rate of spread of Ceratocystis wageneri in ponderosa pine 22. Muller, C. H. 1951. The significance of vegetative reproduction instands in the central Sierra Nevada. Phytopathology 72:1359-1362. Quercus. Madrono 11:129-137.
10. Federation of British Plant Pathologists. 1973. A guide to the use 23. Nandris, D., van Canh, T., Geiger, J. P., Omont, H., and Nicole,of terms in plant pathology. Phytopathological Papers No. 17. Com- M. 1985. Remote sensing in plant diseases using infrared colour aerialmonwealth Mycological Institute, Kew. photography: Applications trials in the Ivory Coast to root disease
11. Gibbs, J. N., and French, D. W. 1980. Transmission of oak wilt. of Hevea brasiliensis. Eur. J. For. Pathol. 15:11-21.U.S. For. Serv. Res. Pap. NC-185. 17 pp. 24. Ostle, B. 1963. Statistics in Research. The Iowa State University Press,
12. Gillespie, W. H., and True, R. P. 1959. Three factors which influence Ames. 585 pp.the local spread of oak wilt in five northeastern counties of West 25. Rexrode, C. 0., and Frame, R. E. 1977. Root graft incidence atVirginia. Plant Dis. Rep. 43:588-593. oak wilt sites in West Virginia. Plant Dis. Rep. 61:970-971.
13. Hensell, J. L., Dittmar, G. W., and Taylor, F. 1977. Soil Survey 26. Yount, W. L. 1955. Longevity of the oak wilt fungus in oak rootsof Bandera County, Texas. USDA Soil Conservation Service and as related to spread through root grafts. Plant Dis. Rep. 39:256-Texas Agricultural Experiment Station, College Station, TX. 49 pp. 257.
14. Himelick, E. B., and Fox, H. W. 1961. Oak wilt control. Ill. Agric.
1322 PHYTOPATHOLOGY
SUSTAINING ASSOCIATES
ABBOTT AGRIC. RES. CTR., Long Grove, IL ICI AMERICAS, INC., Richmond, CA
AGRI-DIAGNOSTICS ASSOCIATES, Cinnaminson, NJ ILLINOIS CROP IMPROVEMENT ASSOCIATION, Urbana, IL
AGRICULTURE CANADA, Vineland Station, Ontario ILLINOIS FOUNDATION SEEDS, INC., Champaign, IL
ALF CHRISTIANSON SEED CO., Mount Vernon, WA ISTITUTO DI FITOVIROLOGIA, Torino, Italy
AMERICAN CYANAMID CO., Agriculture Center, Princeton, NJ JANSSEN PHARMACEUTICA, Piscataway, NJ
BASF CORPORATION, Parsippany, NJ LANDIS ASSOCIATES, INC., Valdosta, GA
BOTANIC GARDENS OF ADELAIDE, Adelaide, Australia LOXTON RESEARCH CENTRE, Loxton, South Australia
BUCKMAN LABORATORIES, Memphis, TN MERCK & CO., INC., Rahway, NJ
CALGENE, INC., Davis, CA MOBAY CORPORATION, Kansas City, MO
CARGILL HYBRID SEEDS, Aurora, IL MONSANTO CO., St. Louis, MO
CHEVRON CHEMICAL CO., Richmond, CA NOR-AM CHEMICAL CO., Wilmington, DE
CHEVRON CHEMICAL CO., San Ramon, CA NORTHERN MARIANAS COLLEGE, Saipan, Guam
CIBA-GEIGY CORPORATION, Agric. Div., Greensboro, NC NORTHFIELD LAB, Adelaide, Australia
DEKALB-PFIZER GENETICS, DeKalb, IL NORTHRUP KING CO., Woodland, CA
DEKALB-PFIZER GENETICS, Groton, CT PENNWALT CORPORATION, Geneva, NY
DEL MONTE FOODS USA, Walnut Creek, CA PEST PROS, INC., Plainfield, WI
DNA PLANT TECHNOLOGIES, INC., Oakland, CA PETOSEED CO., INC., Woodland, CA
E. I. DUPONT DE NEMOURS & CO., INC., Agric. Chem. Dept., PFIZER, INC.-TEKCHEM, Chem. Div., New York, NYNewark, DE
RHONE-POULENC AG. CO., Research Triangle Park, NCELI LILLY & CO., Lilly Res. Labs, Greenfield, IN
RICERCA, INC., Painesville, OHFERMENTA PLANT PROTECTION CO., Mentor, OH
ROHM & HAAS CO., Philadelphia, PAFERRY MORSE SEED CO., San Juan Bautista, CA
ROTHAMSTED EXP. STATION, Hents, EnglandFUNK SEEDS INTERNATIONAL, INC., Bloomington, IL
SAKATA SEED AMERICA, INC., Salinas, CAGREAT LAKES CHEMICAL CORPORATION, West Lafayette, IN
SANDOZ CROP PROTECTION CORP., Des Plaines, ILGRIFFIN CORPORATION, Fresno, CA
0. M. SCOTT & SONS, Marysville, OHGUSTAFSON, INC., Des Moines, IAUNIROYAL CHEMICAL CROP PROT. R&D, Bethany, CTHARRIS MORAN SEED CO., Hayward, CA
UNOCAL CHEMICALS, West Sacramento, CAHARTMAN'S PLANTS, INC., Sebring, FL
USDA FOREST SERVICE, Ogden, UTH. J. HEINZ CO., Bowling Green, OH
W-L RESEARCH, INC., Evansville, WIHOECHST ROUSSEL AGRI. VET. CO., Somerville, NJ
ICI AMERICAS, INC., Mountain View, CA
M A Great New Reason to Join APS: MPMI,. Other Member Benefits Include:
A subscription to Molecular Plant U Monthly Newsletter. Phytopathology NewsMicrobe Interactions (MPMI), Plant keeps you informed about APSDisease, or Phytopathology is now happenings.p included in your APS membership N FREE Job Placement Service.
Sfee. U Discounts to 25% on APS Press Publications.Better yet, two or all three journals Receive free book catalogs and new titlecan be yours at substantial member announcements.M savings.
Saig APS...More Than Ever Before Your Professional Resource
Call Now for an Application: Toll-Free 1-800-328-7560 (U.S.) 1-612-454-7250
The American Phytopathological Society 0 3340 Pilot Knob Road 0 St. Paul, MN 55121 U.S.A.