measurement crankshaft angular speed of an om403 engine · measurement crankshaft angular speed of...
TRANSCRIPT

SERBIAN JOURNAL OF ELECTRICAL ENGINEERING Vol. 14, No. 2, June 2017, 257-275
257
Measurement Crankshaft Angular Speed of an OM403 Engine
Stojko Biočanin1, Milica Biočanin2
Abstract: In this paper, the methodology of the measurement of the angular speed of the crankshaft of a ten-cylinder diesel OM403 engine is presented, with regular and irregular engine operation. The angular velocity was measured under laboratory conditions, on already installed measuring equipment from the laboratory and on the break of a well known brand-Schenck, by using an opto-electronic incremental rotary encoder, a data acquisition module and the LabVIEW software for synchronization and management of the measuring equipment. The goal of this paper is to give a practical contribution to researches of measuring of crankshaft angular speed of the crankshaft engine OM 403.
Keywords: Measurement, Angular velocity, Engine.
1 Introduction
In the literature, there could be found many different approaches of the procedure of the measurement of the engine crankshaft angular speed [1 – 5]. The majority of the methods for measuring crankshaft angular speed was developed with the aim of the engine condition diagnostics.
In this paper, the experiment was performed and the mathematical model was developed in order to measure the variations of the crankshaft angular speed with regular and irregular OM403 engine operation.
Irregularities of the working processes of the engine are simulated by suspension of fuel supply into certain engine cylinders. Along with this the course of engine crankshaft angular speed were followed in the real time, that means in the function of the crankshaft angle.
Besides the monitoring of the engine crankshaft angular speed changes, the following parameters were observed to:
Indicator pressures in the cylinders, Fluctuation of the pressures of the exhaust gases in the left exhaust
collector, and Fluctuation of the pressures of the exhaust gases in the right exhaust
collector.
1Filipa Filipovića 43 Čačak, [email protected] 2Faculty of mechanical engineering, Kraljice Marije 16, 11120 Belgrade, [email protected]
UDC: 621.436.1-233 DOI: https://doi.org/10.2298/SJEE1702257B

S. Lj. Biočanin, M. S. Biočanin
258
Although the examinations were performed in the same time, the only results presented in this paper will be the results of crankshaft angular speed measurement.
Angular speed measurement was performed in the normal engine operation condition, in the condition of fuel suspension in the first engine cylinder and parallel fuel suspension in the third and sixth engine cylinder.
The examination was first performed on the OM403 engine of the special purpose vehicle. For this aim the achievements used were the achievements in the researches of specialized tracked vehicles series V-46 6 – 9.
2 Mathematical Modeling of Crankshaft Angular Speed of an OM403 Engine
Since the focus of this work is to demonstrate the methodology for measuring of the variations of the engine crankshaft angular speed, the mathematical model will be presented in its final form only.
According to [12] the mathematical model of the variation of the OM403 engine crankshaft angular speed is based on the general dynamic equation of the body motion of the inertial moment of motion around the fixed axis:
2d 1( ) ( ) ( ) ( )
d 2 U OPK M M
. (1)
By neglecting individual sizes, the model is simplified and a differential equation of variation of the engine crankshaft angular speed in the function of the angle of rotation of the crankshaft is obtained:
0
d ( ) 1( ) ( )
d ( ) 180U OPRT MJ
. (2)
3 Measurement Crankshaft Angular Speed
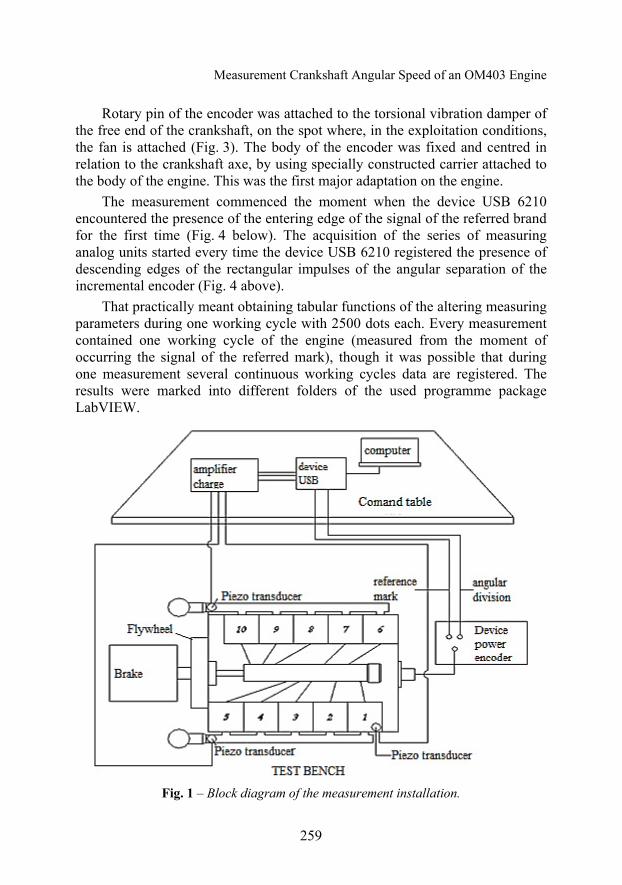
A block diagram representation of the measurement installation used for the experiment, described in [12], is shown in Figs. 1 and 2.
A standard technique for measuring the angular speed, described in detail in reference [6], was applied.
An opto-electronic incremental rotary encoder is directly mounted on the free end of t he crankshaft and connected to a power supply unit (Fig. 1 and 3).
The encoder has a rectangular output signal in the form of 0 to +5V pulses with an angular resolution of 0,288° (or 1250 impulses) and one reference marker in a 360° revolution of the crankshaft. The signals from the encoder are transmitted to the USB 6210 device and used to manage and control the A/D conversion of measured analog values.
Measurement Crankshaft Angular Speed of an OM403 Engine
259
Rotary pin of the encoder was attached to the torsional vibration damper of the free end of the crankshaft, on the spot where, in the exploitation conditions, the fan is attached (Fig. 3). The body of the encoder was fixed and centred in relation to the crankshaft axe, by using specially constructed carrier attached to the body of the engine. This was the first major adaptation on the engine.
The measurement commenced the moment when the device USB 6210 encountered the presence of the entering edge of the signal of the referred brand for the first time (Fig. 4 below). The acquisition of the series of measuring analog units started every time the device USB 6210 registered the presence of descending edges of the rectangular impulses of the angular separation of the incremental encoder (Fig. 4 above).
That practically meant obtaining tabular functions of the altering measuring parameters during one working cycle with 2500 dots each. Every measurement contained one working cycle of the engine (measured from the moment of occurring the signal of the referred mark), though it was possible that during one measurement several continuous working cycles data are registered. The results were marked into different folders of the used programme package LabVIEW.
Fig. 1 – Block diagram of the measurement installation.

S. Lj. Biočanin, M. S. Biočanin
260
Fig. 2 – OM403 engine on test stand.
Fig. 3 –An opto-electronic incremental rotary encoder is directly mounted on the
free end of the crankshaft.
Fig. 4 – Voltage signals obtained from the incremental encoder.
The role of the device for powering the encoder was to transform AC electricity from the network of 220V into one DC electricity of 12V and to forward the voltage signals generated in the encoder towards the device USB 6210.
The USB 6210 (Fig. 5) is a 16-bit data acquisition module, small, with exceptional flexibility and very low price. The product is from the renowned company National Instruments and is easy to use with any PC with the software package Lab View installed on.
USB6210 device has fast multiplexer which enables the measurement of 250 000 samples per second, which means that the minimal needed time between measuring the two analogue sizes is 4 s. Depending on the nature of measuring sizes the mode of connecting of the conductor ends. USB6210 device has the ability of parallel measuring up to 16 analogue sizes at `single ended`

Measurement Crankshaft Angular Speed of an OM403 Engine
261
and up to 8 analogue sizes at differential connecting of the conductor ends. Besides this, the device supports four input and output digital signals, which could be used for managing A/D conversion.
Fig. 5 – Device USB 6210.
The use of the USB 6210 implied the existence of a program for the synchronization and management of the measuring equipment. For this purpose, a special adaptive Lab View application was developed. This application enabled the synchronization of measurement of any rapidly changing parameter of the engine working cycle and its subsystems in the function of the crank angle.
On the right side of the Fig. 6, the column `Period Length` can be seen in which current average values are marked of the minute number of rpms in the function of the angle of crankshaft rotating.
Fig. 6 – LabVIEW application.

S. Lj. Biočanin, M. S. Biočanin
262
It should be mentioned that time intervals between adjacent increments of the encoder passed during the crankshaft rotation are marked in the folders. On the front panel of the application some of those values can be seen in the `data` row and the values of the current minute number of rotations of the crankshaft in the column `Period Length` and these are derived values.
The measurement of physical quantities implies their conversion to analog voltage values. After their amplification, the digitization of these analog signals was performed. The procedure of processing and obtaining parameter values as real physical quantities was performed in two phases.
The objective of the first phase was to convert these digitalized records to real physical values. The second phase included the determination of the so called “zero line” for the measured pressures, the process of „filtration“ and their connection to the working cycle in cylinder number 1, in order to enable the clearly tracking of the pressure changes during the engine working cycle.
The measurement was organized so that, for every analysed stationary regime, 50 cycles with the associated data on the changes of the measured values in the function of the crank angle were recorded. After that, for each test regime, a specially developed FORTRAN program was used to create separate files with “representative” samples of averaged measured values in order to partly eliminate the present “noise” and stochastic nature of the considered parameters.
Angular speed of the crankshaft is a value derived on the basis of the marked time intervals between the adjacent increments of the encoder which passed during the rotation of the crankshaft, which are going to be marked here as i. This is obtained in a way that the inner timer (clock) of the device USB 6210 is used, of the resolution 10 MHz, which produced rectangular voltage signals from 0 to +5V with the period of 0,1·10-6ѕ each (Fig. 7). Time interval i was defined by plain counting of the registered input edges of these signals between two increments of the encoder, that is during every period from 0.288° of the crankshaft. The principle applied inevitably implied the presence of the system error during measuring of the time interval i. For example, in the Fig. 7 it can be seen that the error of the measuring of the i value, when it is accidentally started directly before the first incoming input edge of the rectangular signal, finished directly behind the last incoming input edge of the rectangular signal (period 1-1) can be up to +0,1·10-6ѕ. In this case the number of the registered input edges increased by one from the real number of full periods of the rectangular voltage signals. In the case when the measuring is started directly behind the first incoming input edge of the rectangular voltage signal and finished directly before the last incoming input edge of the rectangular voltage signal (period 2-2 in the Fig. 7), the error of the measuring of the time interval marked with 2 can be up to –0.1·10-6ѕ. This the number of

Measurement Crankshaft Angular Speed of an OM403 Engine
263
registered incoming edges decreased by on from the real number of full periods of rectangular voltage signals.
Even greater influence on the system error of measurement caused inaccuracy of the creation of the angle separation of the increment encoder affected.
Fig. 7 – Rectangular voltage pulses of the internal timer encoder USB 6210 with 10 MHz resolution.
According to the data of the producer the maximum error of the angle separation of the applied increment encoder with 1250 impulses (0.288°) is 2 angle minutes, that is 0.0333°, which is the value that cannot be negligible. The described system error of measuring directly affected the results of measuring of the time interval i, which is characterized by highly expressed `noise` which is clearly seen in the Fig. 8. It is totally logical that the angular speed of the crankshaft as derived, that is to say inversely proportional value given by (3), will have similar course which is illustrated in the Fig. 9. For eliminating` of this system error of measuring and obtaining the curved line which can serve more efficiently for the analyses and comparing the results of the mathematical modelling of the angular speed, Fourier trigonometric interpolation polynomials were used.
d 0.288
d 180t
. (3)
In the second phase during the `filtering` of the very `noisy` signals of the current of the angular speed of the crankshaft as derived value (Fig. 11), we started from the analyses of the values of the amplitudes of the first 250 harmonic Fourier trigonometric interpolation polynomials of that signal, which is presented in the Fig. 10. In these diagrams we can see two important things. First, the most dominant the fifth harmonic, which correspondents the real nature of the signal of the angular speed of the crankshaft and the results of the mathematic modelling, of which it is going to be spoken later. Second,

S. Lj. Biočanin, M. S. Biočanin
264
extremely high values of the taller harmonics which are piled around 50th, 100th, and around 150th harmonics, can not be the reflection of the real physical action.
Fig. 8 – Typical changes in measured values of time intervals Δτi.
Fig. 9 – Angular speed of the crankshaft as an inversely
proportional value to the measured.
Fig. 10 – Typical histogram of harmonic amplitudes of the Fourier's
trigonometric interpolation polynomial for the crankshaft angular speed.

Measurement Crankshaft Angular Speed of an OM403 Engine
265
Fig. 11 – Angular speed of the crankshaft before and after “filtering“.
In this taller harmonics there are listed superimposed system errors of measuring, so it is logical that during the `filtering` of the signal they should be neglected. Keeping only the first 25 harmonicas of Fourier trigonometric interpolation polynomials, we get `filtered` signal of the angular speed of the crankshaft as the curved line (Fig. 11), which can be compared more easily with the results of mathematic modelling, as well as for other kinds of the analyses of that parameter.
4 Test Results
In the framework of the experimental method changes of the angular speed at the crankshaft's free end were monitored. The following cases were simulated [10 – 12]:
normal operation in all cylinders,
misfire in all cylinders individually, and
simultaneous misfire in two cylinders (the 3rd and 6th).
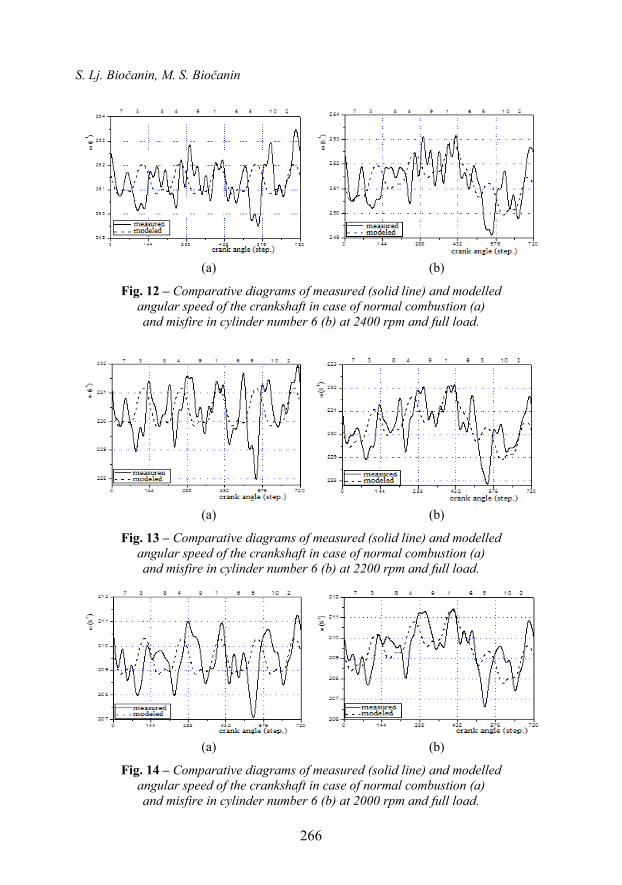
Trial tests previously suggested that the optimal operating regime, which is common in practice, and at which all measured parameters of the work process are making their full contribution to the diagnosis of the engine’s proper operation, should be found at lower angular speed. The optimal operating regime was determined regarding maximum force realized on a laboratory brake for different speeds (from 2400 rpm to 1400 rpm). At the same time, the instantaneous crankshaft angular speed in case of misfire in cylinder number 6 and in the case of normal operation of all cylinders was measured. Comparative diagrams of direct measurement and mathematical modelling at the limit values of angular speed (2400 rpm and 1400 rpm) are shown in Figs. 12 – 17.
S. Lj. Biočanin, M. S. Biočanin
266
(a) (b)
Fig. 12 – Comparative diagrams of measured (solid line) and modelled angular speed of the crankshaft in case of normal combustion (a) and misfire in cylinder number 6 (b) at 2400 rpm and full load.
(a) (b)
Fig. 13 – Comparative diagrams of measured (solid line) and modelled angular speed of the crankshaft in case of normal combustion (a) and misfire in cylinder number 6 (b) at 2200 rpm and full load.
(a) (b)
Fig. 14 – Comparative diagrams of measured (solid line) and modelled angular speed of the crankshaft in case of normal combustion (a) and misfire in cylinder number 6 (b) at 2000 rpm and full load.
Measurement Crankshaft Angular Speed of an OM403 Engine
267
(a) (b)
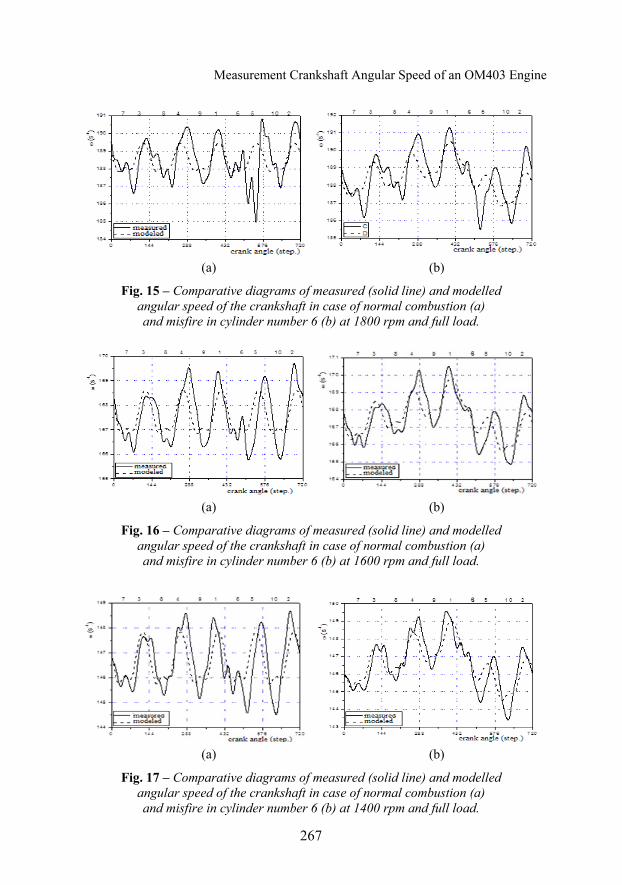
Fig. 15 – Comparative diagrams of measured (solid line) and modelled angular speed of the crankshaft in case of normal combustion (a) and misfire in cylinder number 6 (b) at 1800 rpm and full load.
(a) (b)
Fig. 16 – Comparative diagrams of measured (solid line) and modelled angular speed of the crankshaft in case of normal combustion (a) and misfire in cylinder number 6 (b) at 1600 rpm and full load.
(a) (b)
Fig. 17 – Comparative diagrams of measured (solid line) and modelled angular speed of the crankshaft in case of normal combustion (a) and misfire in cylinder number 6 (b) at 1400 rpm and full load.

S. Lj. Biočanin, M. S. Biočanin
268
The presented diagrams clearly show that the deviation of the measured data from values obtained by mathematical modelling rapidly decreases with decreasing engine speed. Therefore, operating modes for the efficient implementation of the method should be sought from 1800 rpm downwards. At lower speeds the influence of elastic deformations (torsion oscillations) of the crankshaft is lower, which can be seen from Figs. 12 and 17.
Considering that the highest thermal engine load is achieved at the maximum torque (according to declaration at 1500 rpm) this operation mode is advisable to use less frequently in practice. Since operating modes at speeds lower than 1500 rpm are rarely used during exploitation, as the optimal mode to display the success of implementation of the developed method, 1800 rpm and full engine load were chosen.
The crankshaft angular speed, during simulated misfire in cylinders, was measured by disconnecting the high pressure fuel lines from the high pressure pump. All diagrams are shown as a function of the crank angle and are related to the working cycle of cylinder number 1, where the crank angle value equals 0° when the piston of this cylinder is at the top dead centre (TDC) and the start of suction process.
Fig. 18 – Comparative diagram of measured and modelled angular speed of the crankshaft during normal operation.
During normal operation in all cylinders, the measured angular speed of the crankshaft does not match perfectly with the results of the modelling (Fig. 18), but in either case five dominant peaks can be clearly identified. The main reason for deviations should be sought in the imperfections of the applied mathematical model.
There is also a good match between measured and modelled angular velocity of the crankshaft in the case of misfire in cylinder number 1 (Fig. 19). This feature is repeated in all cases of misfire in individual cylinders. Fig. 19

Measurement Crankshaft Angular Speed of an OM403 Engine
269
shows clearly the decline of angular speed on the segment that follows the number 1 inscribed on the top of the diagram, which indicates the angular interval referring to the working cycle of cylinder number 1.
]
Fig. 19 – Comparative diagram of measured and modelled angular speed in
case of misfire in cylinder number 1.
Fig. 20 – Comparative diagram of measured and modelled angular speed in
case of misfire in cylinder number 2.
Simultaneous misfire in cylinders 2, 3, 4, 5, 6, 7, 8, 9 and 10 is presented in Figs. 20 to 28.
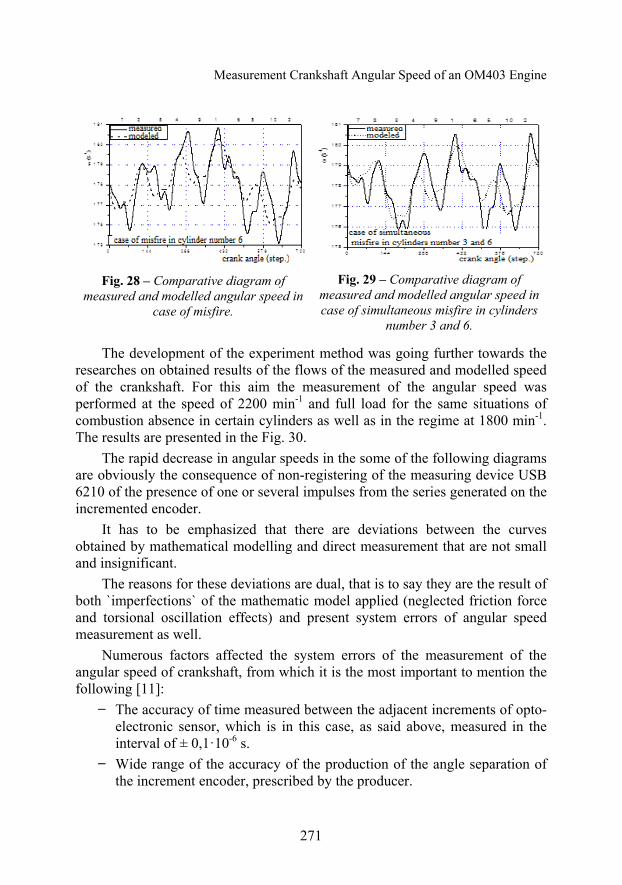
In all figures, representing diagrams of instantaneous angular speed of the crankshaft, declines on segments which follow the bolded numbers inscribed on the top of the diagrams can be clearly noticed, which indicate the angular interval of misfire in the defect cylinder represented by this number.
Similar analyses are valid in case of simultaneous misfire in two cylinders (Fig. 29) and do not need a special comment.
Fig. 21 – Comparative diagram of measured and modelled angular speed in case of misfire in cylinder number 3.

S. Lj. Biočanin, M. S. Biočanin
270
Fig. 22 – Comparative diagram of measured and modelled angular speed in
case of misfire in cylinder number 4.
Fig. 23 – Comparative diagram of measured and modelled angular speed in
case of misfire in cylinder number 5.
Fig. 24 – Comparative diagram of measured and modelled angular speed in
case of misfire in cylinder number 10.
Fig. 25 – Comparative diagram of measured and modelled angular speed in
case of misfire in cylinder number 9.
Fig. 26 – Comparative diagram of measured and modelled angular speed in
case of misfire in cylinder number 8.
Fig. 27 – Comparative diagram of measured and modelled angular speed in
case of misfire in cylinder number 7.
Measurement Crankshaft Angular Speed of an OM403 Engine
271
Fig. 28 – Comparative diagram of measured and modelled angular speed in
case of misfire.
Fig. 29 – Comparative diagram of measured and modelled angular speed in case of simultaneous misfire in cylinders
number 3 and 6.
The development of the experiment method was going further towards the researches on obtained results of the flows of the measured and modelled speed of the crankshaft. For this aim the measurement of the angular speed was performed at the speed of 2200 min-1 and full load for the same situations of combustion absence in certain cylinders as well as in the regime at 1800 min-1. The results are presented in the Fig. 30.
The rapid decrease in angular speeds in the some of the following diagrams are obviously the consequence of non-registering of the measuring device USB 6210 of the presence of one or several impulses from the series generated on the incremented encoder.
It has to be emphasized that there are deviations between the curves obtained by mathematical modelling and direct measurement that are not small and insignificant.
The reasons for these deviations are dual, that is to say they are the result of both `imperfections` of the mathematic model applied (neglected friction force and torsional oscillation effects) and present system errors of angular speed measurement as well.
Numerous factors affected the system errors of the measurement of the angular speed of crankshaft, from which it is the most important to mention the following [11]:
The accuracy of time measured between the adjacent increments of opto-electronic sensor, which is in this case, as said above, measured in the interval of ± 0,1·10-6 s.
Wide range of the accuracy of the production of the angle separation of the increment encoder, prescribed by the producer.

S. Lj. Biočanin, M. S. Biočanin
272
The application, for current conditions relatively simple and cheap measurement device USB 6210, out of which the maximum of performance was obtained, taking into consideration its limited performance.
Fig. 30 – Comparative diagrams of measured (solid line) and modelled angular speed of the Crankshaft at 2200 rpm full load for different case misfire in certain cylinder.
Measurement Crankshaft Angular Speed of an OM403 Engine
273
To these factors it can be added the possibility of the `skipping`, i.e. non-registering some of the series of the signals of the increments, as the increment encoder of the old generation was used, which has been in active usage for numerous years.
If we had eliminated the system errors in filtering procedures and if we neglect the numeral error of interpolation, the total error is the result of the error of real angle separation and the accuracy of time intervals` measurement within each of them. The fake error of this indirect measuring of the average angular speed during one angle period, i.e. one increment can be gained by logarithm differentiating of definitional equation of angular speed ( = /t) [8]. If we change the differentials with the appropriate errors , (Δ) and (t), we gain the following expression:
( ) ( )t
t
. (4)
According to the data of the producer, the maximum error of the angle separation of the applied increment encoder at 1250 impulses (each impulse at 0.882° of crankshaft) was 2 angle minutes, i.e. 0.0333°. The average value of the time τi between two impulses of increment encoder during one working cycle of the engine at 1700 min-1 was 28,235·10-6ѕ. The total maximum false error of the measured angular speed during one increment could be in this case defined from the relation
0.333 0.1
0.112080.288 28.235
, (5)
that is, to say, it can measure up to 11,208%. By using Fourier harmonic analyses and neglecting taller harmonicas in which there are numbered superimposed system errors of the measurement and by keeping only the first 25 harmonicas, the `filtering` of the raw signals was conducted and the trial of decreasing the level of the system error of measurement.
5 Conclusion
Measuring crankshaft angular speed variations is suitable method which contains a large amount of information about engine operation and working processes that take place within individual cylinders.
The measured crankshaft angular speed principally follows the course of angular speed obtained by simplified a mathematical modelling which proves the validity of the measurement taken.
The measured curve of angular velocity, for the given regime and the normal operation in all cylinders, represents a sort of record or code which will always be repeated when the engine finds itself in identical conditions.

S. Lj. Biočanin, M. S. Biočanin
274
There are deviations between the curves obtained by mathematical modelling and direct measurement. The cause of these deviations is the simplification of the mathematical model: the crankshaft is considered to be rigid, the fluctuating form of moment of inertia is neglected, losses due to the engine friction are neglected and the torque at the flywheel is considered to be constant.
While measuring the angular velocity using an incremental transducer, two main causes of measuring systematic errors were identified: the accuracy of time estimation between two adjacent increments and the accuracy of encoder angular division.
It is important to emphasize that the time interval between adjacent encoder increments (Δτi) can be estimated more precisely by using an encoder of higher angular accuracy and an internal timer of higher resolution, and also by using representative measured values made by averaging a higher number od consecutive working cycles.
6 References
[1] T. S. Brown, W. S. Neill. Determination of Engine Cylinder Pressures from Crankshaft Speed Fluctuations, SAE Paper 920463, 1992.
[2] Francisco V. Tinaut, Andrés Melgar, Hannes Laget, José I. Doménguez. Misfire and Compression Fault Detection Through the Energymodel. Mechanical Systems and Signal Processing 21, pp 1521–1535, 2007.
[3] Yuhua Lia, Fengshou Gu, Georgina Harris, Andrew Ball, Nick Bennett, Ken Travis. The Measurement of Instantaneous Angular Speed,Mechanical Systems and Signal Processing 19, pp 786–805, 2005.
[4] R. Jankov. Results of Development of CADEX System for Research and Technical Diagnosis of Engines and Other Machines. Researchin IC Engines Field, Monograph, pp. 297-314, Kragujevac 2000. (in Serbian).
[5] M. Desbazeille, R.B.Randall , F.Guillet, M.El Badaoui, C.Hoisnard. Model-Based Diagnosis of Large Diesel engines Based on Angular Speed Variations of the Crankshaft. Mechanical Systems and Signal Processing 24,.pp 1529–1541, 2010.
[6] Ž. Bulatović. (2008). Possibilities of Engine Work process Diagnostic Using the Analysis of Crankshaft Angular Velocity Variations. MSc Thesis, Faculty of Mech. Eng., University of Belgrade, Belgrade 2008.
[7] M. Štavljanin. Research of Injection Process in Multi-Cylinder Diesel engines at Non-Stationary Working Conditions for the Fuel Injection System. PhD Thesis, Faculty of Mech. Eng., University of Belgrade, Belgrade 2007.
[8] D. Radonjić. The analysis of parameters influencing on the rotation evenness of the crankshaft of internal combustion engines used in vehicles. Motor vehicles and motors, YU ISSN 0350–1027, Novembar 1977, Kragujevac.

Measurement Crankshaft Angular Speed of an OM403 Engine
275
[9] Ž. M. Bulatović, M. S. Štavljanin, M. V. Tomić, D. M. Knežević, S. Lj. Biočanin. (2011). Measurement and Analysis of Angular Velocity Variations of Twelve-Cylinder, Diesel engine Crankshaft. Mechanical Systems and Signal Processing, Volume 25, Issue 8, November 2011, p.p. 3043 – 3061, ISSN 0888-3270, DOI: 10.1016/j.ymssp.2011.05.002.
[10] S. LJ. Biočanin. Upravljanje kretanja obrtne platforme. MSc Thesis, Faculty of Mech. Eng. Kraljevo, University of Kragujevac, Kraljevo 2005.
[11] S. LJ. Biočanin. Optimal periodicity of the vehicle of special purpose maintenance. PhD Thesis, Faculty of Mech. Eng., University of East Sarajevo, East Sarajevo 2013.
[12] S. LJ. Biočanin, Ž. M. Bulatović, A. Milašinović, I. Mujanović, R. Božičković. (2015). Crankshaft angular velocity of a ten – cylinder diesel engine as a diagnostics parametar. DEMI 2015.