mcgraw-hill/irwin © the mcgraw-hill companies, inc., 2005 21-1 cost allocation and performance...
TRANSCRIPT
McGraw-Hill/Irwin © The McGraw-Hill Companies, Inc., 2005
21-1
Cost Allocation and Performance Measurement
Chapter
2121Modified from Publisher Provided Slides

McGraw-Hill/Irwin © The McGraw-Hill Companies, Inc., 2005
21-2
One of the most difficult tasks in
computing accurate unit costs lies in determining the
proper amount of overhead cost to
assign to each job.
Assigningoverhead is
difficult. I agree!
Overhead Cost Allocation MethodsOverhead Cost Allocation Methods

McGraw-Hill/Irwin © The McGraw-Hill Companies, Inc., 2005
21-3
Level of C
omplexity
Level of C
omplexity
Overhead Allocation
Plantwide Overhead
Rate
DepartmentalOverhead
Rates
Activity BasedCosting
Activity-Based Cost AllocationActivity-Based Cost Allocation

McGraw-Hill/Irwin © The McGraw-Hill Companies, Inc., 2005
21-4
In the ABC method, we recognize that many
activities within a department drive overhead costs.
In the ABC method, we recognize that many
activities within a department drive overhead costs.A
B CACB
Activity-Based Cost AllocationActivity-Based Cost Allocation

McGraw-Hill/Irwin © The McGraw-Hill Companies, Inc., 2005
21-5
Identify activities and assign indirect costs to those activities.
Central idea . . .• Products require activities.
• Activities consume resources. A
B CACB
Activity-Based CostingActivity-Based Costing

McGraw-Hill/Irwin © The McGraw-Hill Companies, Inc., 2005
21-6
More detailed measures of costs. Better understanding of activities. More accurate product costs for . . .
• Pricing decisions.
• Product elimination decisions.
• Managing activities that cause costs.
Benefits should always be comparedto costs of implementation.
More detailed measures of costs. Better understanding of activities. More accurate product costs for . . .
• Pricing decisions.
• Product elimination decisions.
• Managing activities that cause costs.
Benefits should always be comparedto costs of implementation.
Activity-Based Costing BenefitsActivity-Based Costing Benefits

McGraw-Hill/Irwin © The McGraw-Hill Companies, Inc., 2005
21-7
Most cost drivers are related to either volume or complexity of production.• Examples: machine time, machine setups,
purchase orders, production orders.
Three factors are considered in choosing a cost driver: • Causal relationship.
• Benefits received.
• Reasonableness.
Most cost drivers are related to either volume or complexity of production.• Examples: machine time, machine setups,
purchase orders, production orders.
Three factors are considered in choosing a cost driver: • Causal relationship.
• Benefits received.
• Reasonableness.
Identifying Cost DriversIdentifying Cost Drivers

McGraw-Hill/Irwin © The McGraw-Hill Companies, Inc., 2005
21-8
Identify activities that consume resources.
Assign costs to a cost pool for each activity.
Identify cost drivers associated with each activity.
Compute overhead rate for each cost pool:
Assign costs to products: Overhead Actual Rate Activity
×
Rate = Estimated overhead costs in activity cost pool
Estimated number of activity units
Activity-Based Costing ProceduresActivity-Based Costing Procedures

McGraw-Hill/Irwin © The McGraw-Hill Companies, Inc., 2005
21-9
Let’s look at anexample comparingtraditional costing
with ABC. We will start with
traditional costing.
Activity-Based CostingActivity-Based Costing

McGraw-Hill/Irwin © The McGraw-Hill Companies, Inc., 2005
21-10
Pear Company manufactures a product in regular and deluxe models. Overhead is assigned on the basis of direct labor hours. Budgeted overhead for the current year is $2,000,000. Other information:
First, determine the unit cost of each model using traditional costing methods.
Traditional Costing vs. ABCExampleTraditional Costing vs. ABCExample

McGraw-Hill/Irwin © The McGraw-Hill Companies, Inc., 2005
21-11
Traditional CostingTraditional Costing
Overhead Estimated overhead costs Rate Estimated activity
=
Overhead $2,000,000 Rate 40,000 DLH
= = $50 per DLH

McGraw-Hill/Irwin © The McGraw-Hill Companies, Inc., 2005
21-12
Deluxe RegularModel Model
Direct Material 150$ 112$ Direct Labor 16 8 Manufacturing Overhead$50 per hour × 1.6 hours 80 $50 per hour × 0.8 hours 40 Total Unit Cost 246$ 160$
ABC will have differentoverhead per unit.
Traditional CostingTraditional Costing

McGraw-Hill/Irwin © The McGraw-Hill Companies, Inc., 2005
21-13
Pear Company plans to adopt activity-based costing. Using the following activity center
data, determine the unit cost of the two products using activity-based costing.
Activity-Based CostingActivity-Based Costing

McGraw-Hill/Irwin © The McGraw-Hill Companies, Inc., 2005
21-14
Overhead UnitsActivity Cost Cost for ofCenter Driver Activity Activity Rate
Purchasing Orders 84,000$ 1,200 Scrap Rework Orders 216,000 900 Testing Tests 450,000 15,000 Machine Related Hours 1,250,000 50,000 Total Overhead 2,000,000$
400 deluxe + 800 regular = 1,200 total
Activity-Based CostingActivity-Based Costing

McGraw-Hill/Irwin © The McGraw-Hill Companies, Inc., 2005
21-15
Overhead UnitsActivity Cost Cost for ofCenter Driver Activity Activity Rate
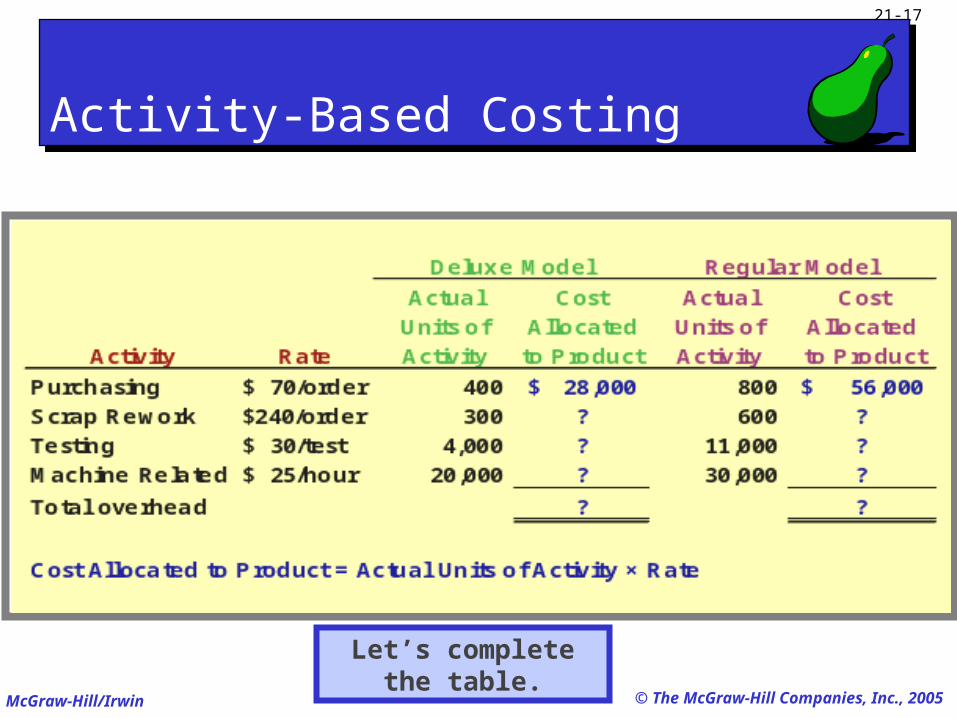
Purchasing Orders 84,000$ 1,200 $ 70 per orderScrap Rework Orders 216,000 900 $240 per orderTesting Tests 450,000 15,000 $ 30 per testMachine Related Hours 1,250,000 50,000 $ 25 per hourTotal Overhead 2,000,000$
Rate = Overhead Cost for Activity ÷ Units of Activity
Activity-Based CostingActivity-Based Costing

McGraw-Hill/Irwin © The McGraw-Hill Companies, Inc., 2005
21-16
Activity-Based CostingActivity-Based Costing
McGraw-Hill/Irwin © The McGraw-Hill Companies, Inc., 2005
21-17
Let’s completethe table.
Activity-Based CostingActivity-Based Costing

McGraw-Hill/Irwin © The McGraw-Hill Companies, Inc., 2005
21-18
Activity-Based CostingActivity-Based Costing

McGraw-Hill/Irwin © The McGraw-Hill Companies, Inc., 2005
21-19
Activity-Based CostingActivity-Based Costing
Total overhead = $720,000 + $1,280,000 = $2,000,000Recall that $2,000,000 was the original amount of
overhead assigned to the products using traditional overhead costing.

McGraw-Hill/Irwin © The McGraw-Hill Companies, Inc., 2005
21-20
Activity-Based CostingActivity-Based Costing

McGraw-Hill/Irwin © The McGraw-Hill Companies, Inc., 2005
21-21
This result is not uncommon when activity-based costing is used. Many companies have found that low-volume, specialized products have greater overhead costs than
previously realized.
Traditional Costing ABCDeluxe Regular Deluxe RegularModel Model Model Model
Direct labor 150$ 112$ 150$ 112$ Direct material 16 8 16 8 Overhead 80 40 144 32 Total cost 246$ 160$ 310$ 152$
Traditional Costing vs. ABCTraditional Costing vs. ABC

McGraw-Hill/Irwin © The McGraw-Hill Companies, Inc., 2005
21-22
Cost Cost DriverMaterials purchasing Number of purchase ordersMaterials handling Number of materials
requisitionsPersonnel processing Number of employees hired
or laid offEquipment depreciation Number of products
produced or hours of useQuality inspection Number of units inspectedIndirect labor for Number of setups required equipment setupsEngineering costs for Number of modifications product modifications
Costs and Cost Drivers inActivity-Based CostingCosts and Cost Drivers inActivity-Based Costing Exh.
21-6

McGraw-Hill/Irwin © The McGraw-Hill Companies, Inc., 2005
21-23
Direct expenses are incurred for the sole benefit of a specific
department.
Indirect expenses benefit more than one department and are
allocated among departments benefited.
Departmental Expense AllocationDepartmental Expense Allocation

McGraw-Hill/Irwin © The McGraw-Hill Companies, Inc., 2005
21-24
Classic Jewelry pays its janitorial service $300 per month to clean its store. Management allocates this cost to its three departments
according to the floor space each occupies.
Illustration of IndirectExpense AllocationIllustration of IndirectExpense Allocation Exh.
21-7

McGraw-Hill/Irwin © The McGraw-Hill Companies, Inc., 2005
21-25
Classic Jewelry pays its janitorial service $300 per month to clean its store. Management allocates this cost to its three departments
according to the floor space each occupies.
Illustration of IndirectExpense AllocationIllustration of IndirectExpense Allocation Exh.
21-7

McGraw-Hill/Irwin © The McGraw-Hill Companies, Inc., 2005
21-26
Classic Jewelry pays its janitorial service $300 per month to clean its store. Management allocates this cost to its three departments
according to the floor space each occupies.
Illustration of IndirectExpense AllocationIllustration of IndirectExpense Allocation Exh.
21-7

McGraw-Hill/Irwin © The McGraw-Hill Companies, Inc., 2005
21-27
Service department costs are shared, indirect expenses that support the activities of two or
more production departments.
Bases for AllocatingService Department CostsBases for AllocatingService Department Costs Exh.
21-8

McGraw-Hill/Irwin © The McGraw-Hill Companies, Inc., 2005
21-28
ABCO allocates its $300,000 personnel cost to operating departments based on the number of employees in each department. The assembly
department has 100 employees and the packing department has 150 employees. What
amount of cost is allocated to assembly?a. $100,000b. $120,000c. $150,000d. $180,000
ABCO allocates its $300,000 personnel cost to operating departments based on the number of employees in each department. The assembly
department has 100 employees and the packing department has 150 employees. What
amount of cost is allocated to assembly?a. $100,000b. $120,000c. $150,000d. $180,000
Service Department CostsQuestionService Department CostsQuestion

McGraw-Hill/Irwin © The McGraw-Hill Companies, Inc., 2005
21-29
ABCO allocates its $300,000 personnel cost to operating departments based on the number of employees in each department. The assembly
department has 100 employees and the packing department has 150 employees. What
amount of cost is allocated to assembly?a. $100,000b. $120,000c. $150,000d. $180,000
ABCO allocates its $300,000 personnel cost to operating departments based on the number of employees in each department. The assembly
department has 100 employees and the packing department has 150 employees. What
amount of cost is allocated to assembly?a. $100,000b. $120,000c. $150,000d. $180,000
Assembly percentage= 100 ÷ (100 + 150) = 40%
40% of $300,000 = $120,000
Service Department CostsQuestionService Department CostsQuestion

McGraw-Hill/Irwin © The McGraw-Hill Companies, Inc., 2005
21-30
Let’s prepare departmental income statements using the following steps:
Direct expense accumulation.
Indirect expense allocation.
Service department expense allocation.
Preparing DepartmentalIncome StatementsPreparing DepartmentalIncome Statements

McGraw-Hill/Irwin © The McGraw-Hill Companies, Inc., 2005
21-31
Service Dept. One
Service Dept. Two
Operating Dept. One
Direct expenses are traced to eachdepartment without allocation.
Operating Dept. Two
Step 1: Direct Expense AccumulationStep 1: Direct Expense Accumulation

McGraw-Hill/Irwin © The McGraw-Hill Companies, Inc., 2005
21-32
Service Dept. One
Service Dept. Two
Operating Dept. One
Indirect expenses are allocated to all departmentsusing appropriate allocation bases.
Allocation Allocation Allocation Allocation
Step 2: Indirect Expense AllocationStep 2: Indirect Expense Allocation
Operating Dept. Two

McGraw-Hill/Irwin © The McGraw-Hill Companies, Inc., 2005
21-33
Operating Dept. One
Operating Dept. Two
Service department total expenses (original direct expenses + allocated indirect expenses) are
allocated to operating departments.
Allocation Allocation
Service Dept. One
Service Dept. Two
Step 3: Service Department Expense AllocationStep 3: Service Department Expense Allocation

McGraw-Hill/Irwin © The McGraw-Hill Companies, Inc., 2005
21-34
Let’s examine this three-step allocation procedure for
Owl Company.
Departmental ExpenseAllocation SpreadsheetDepartmental ExpenseAllocation Spreadsheet

McGraw-Hill/Irwin © The McGraw-Hill Companies, Inc., 2005
21-35
Departmental ExpenseAllocation SpreadsheetDepartmental ExpenseAllocation Spreadsheet
Expense Allocation to DepartmentsService Service Sales Sales
Allocation Total Dept. Dept. Dept. Dept.Base Expense One Two One Two
Direct expenses Salaries Payroll 20,000$ 1,000$ 2,000$ 6,000$ 11,000$ Supplies Requisitions 1,500 100 300 400 700
Step 1: Direct expenses are traced to service departments and sales departments without allocation.

McGraw-Hill/Irwin © The McGraw-Hill Companies, Inc., 2005
21-36
Departmental ExpenseAllocation SpreadsheetDepartmental ExpenseAllocation Spreadsheet
Expense Allocation to DepartmentsService Service Sales Sales
Allocation Total Dept. Dept. Dept. Dept.Base Expense One Two One Two
Direct expenses Salaries Payroll 20,000$ 1,000$ 2,000$ 6,000$ 11,000$ Supplies Requisitions 1,500 100 300 400 700 Indirect expenses Rent Floor space 10,000 1,000 1,000 3,000 5,000 Utilities Floor space 1,000 100 100 300 500 Total dept. expenses 32,500$ 2,200$ 3,400$ 9,700$ 17,200$
Step 2: Indirect expenses are allocated to both the service and the sales departments based on floor space occupied.
Of a total of 2,000 square feet, the service departments occupy 200 square feet each, sales department one occupies 600 square feet, and sales department two
occupies 1,000 square feet.

McGraw-Hill/Irwin © The McGraw-Hill Companies, Inc., 2005
21-37
Expense Allocation to DepartmentsService Service Sales Sales
Allocation Total Dept. Dept. Dept. Dept.Base Expense One Two One Two
Direct expenses Salaries Payroll 20,000$ 1,000$ 2,000$ 6,000$ 11,000$ Supplies Requisitions 1,500 100 300 400 700 Indirect expenses Rent Floor space 10,000 1,000 1,000 3,000 5,000 Utilities Floor space 1,000 100 100 300 500 Total dept. expenses 32,500$ 2,200$ 3,400$ 9,700$ 17,200$
Service dept. expenses Service Dept. One Sales (2,200) 1,000 1,200 Service Dept. Two EmployeesTotal expenses 32,500$ $ 0 3,400$ 10,700$ 18,400$
Sales department one has $40,000 in sales and sales department two has $48,000 in sales.
Step 3: Service department total expenses (original direct expenses + allocated indirect expenses) are allocated to
sales departments.
Departmental ExpenseAllocation SpreadsheetDepartmental ExpenseAllocation Spreadsheet

McGraw-Hill/Irwin © The McGraw-Hill Companies, Inc., 2005
21-38
Departmental ExpenseAllocation SpreadsheetDepartmental ExpenseAllocation Spreadsheet
Expense Allocation to DepartmentsService Service Sales Sales
Allocation Total Dept. Dept. Dept. Dept.Base Expense One Two One Two
Direct expenses Salaries Payroll 20,000$ 1,000$ 2,000$ 6,000$ 11,000$ Supplies Requisitions 1,500 100 300 400 700 Indirect expenses Rent Floor space 10,000 1,000 1,000 3,000 5,000 Utilities Floor space 1,000 100 100 300 500 Total dept. expenses 32,500$ 2,200$ 3,400$ 9,700$ 17,200$
Service dept. expenses Service Dept. One Sales (2,200) 1,000 1,200 Service Dept. Two Employees (3,400) 1,400 2,000 Total expenses 32,500$ $ 0 $ 0 12,100$ 20,400$
Sales department one has 28 employees and sales department two has 40 employees.
Step 3: Service department total expenses (original direct expenses + allocated indirect expenses) are allocated to
sales departments.

McGraw-Hill/Irwin © The McGraw-Hill Companies, Inc., 2005
21-39
Expense Allocation to DepartmentsService Service Sales Sales
Allocation Total Dept. Dept. Dept. Dept.Base Expense One Two One Two
Direct expenses Salaries Payroll 20,000$ 1,000$ 2,000$ 6,000$ 11,000$ Supplies Requisitions 1,500 100 300 400 700 Indirect expenses Rent Floor space 10,000 1,000 1,000 3,000 5,000 Utilities Floor space 1,000 100 100 300 500 Total dept. expenses 32,500$ 2,200$ 3,400$ 9,700$ 17,200$
Service dept. expenses Service Dept. One Sales (2,200) 1,000 1,200 Service Dept. Two Employees (3,400) 1,400 2,000 Total expenses 32,500$ $ 0 $ 0 12,100$ 20,400$
Departmental ExpenseAllocation SpreadsheetDepartmental ExpenseAllocation Spreadsheet

McGraw-Hill/Irwin © The McGraw-Hill Companies, Inc., 2005
21-40
Now that we have the costs, let’s do an income statement.
DepartmentalIncome StatementsDepartmentalIncome Statements

McGraw-Hill/Irwin © The McGraw-Hill Companies, Inc., 2005
21-41
Sales SalesCombined Dept. One Dept. Two
Sales 88,000$ 40,000$ 48,000$ Cost of goods sold 38,000 20,000 18,000 Gross profit on sales 50,000$ 20,000$ 30,000$ Operating expenses Salaries 17,000$ 6,000$ 11,000$ Supplies 1,100 400 700 Rent 8,000 3,000 5,000 Utilities 800 300 500
DepartmentalIncome StatementsDepartmentalIncome Statements

McGraw-Hill/Irwin © The McGraw-Hill Companies, Inc., 2005
21-42
DepartmentalIncome StatementsDepartmentalIncome Statements
Sales SalesCombined Dept. One Dept. Two
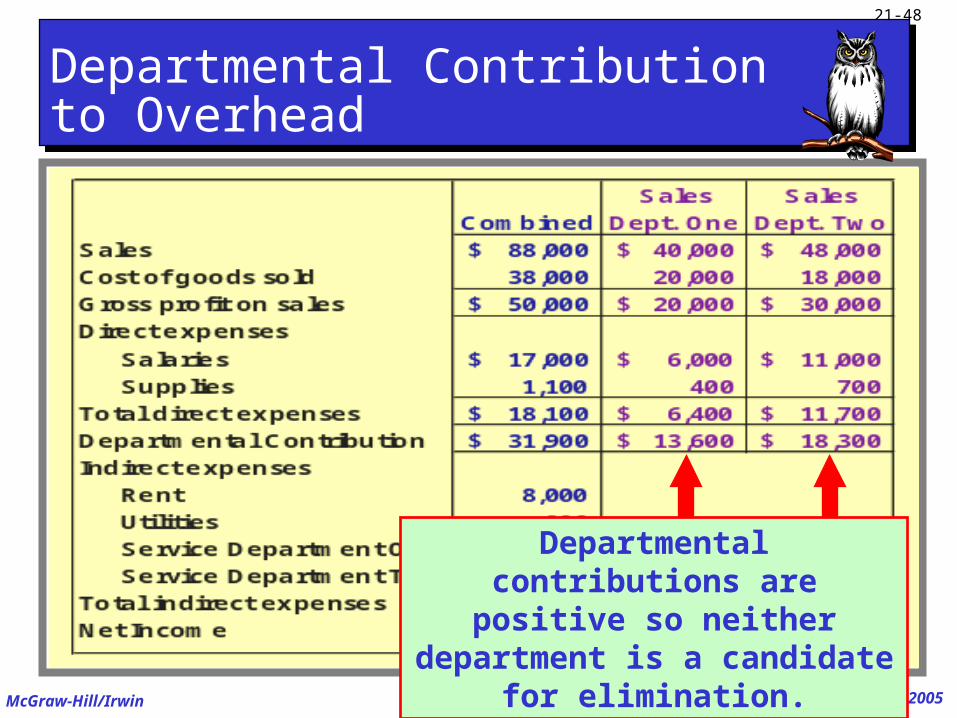
Sales 88,000$ 40,000$ 48,000$ Cost of goods sold 38,000 20,000 18,000 Gross profit on sales 50,000$ 20,000$ 30,000$ Operating expenses Salaries 17,000$ 6,000$ 11,000$ Supplies 1,100 400 700 Rent 8,000 3,000 5,000 Utilities 800 300 500 Service Department One 2,200 1,000 1,200 Service Department Two 3,400 1,400 2,000 Total operating expenses 32,500$ 12,100$ 20,400$ Net income 17,500$ 7,900$ 9,600$

McGraw-Hill/Irwin © The McGraw-Hill Companies, Inc., 2005
21-43
Departmental contribution . . . • Is used to evaluate departmental performance.
• Is not a function of arbitrary allocations of indirect expenses.
A department may be eliminated when its departmental contribution is negative.
Departmental revenue– Direct expenses = Departmental contribution
Departmental revenue– Direct expenses = Departmental contribution
Departmental Contributionto OverheadDepartmental Contributionto Overhead

McGraw-Hill/Irwin © The McGraw-Hill Companies, Inc., 2005
21-44
As a general rule, a department canbe considered a candidate for
elimination if its revenues are lessthan its escapable expenses.
• Direct expenses are usually escapable.• Indirect expenses are usually inescapable.
Eliminating anUnprofitable DepartmentEliminating anUnprofitable Department

McGraw-Hill/Irwin © The McGraw-Hill Companies, Inc., 2005
21-45
Let’s recast Owl Company’s income statement using the departmental
contribution approach where indirect expenses are not allocated.
Departmental Contributionto OverheadDepartmental Contributionto Overhead

McGraw-Hill/Irwin © The McGraw-Hill Companies, Inc., 2005
21-46
Net income for the company is
still $17,500.
Departmental Contributionto OverheadDepartmental Contributionto Overhead

McGraw-Hill/Irwin © The McGraw-Hill Companies, Inc., 2005
21-47
Departmental contributions to indirect expenses
(overhead) are emphasized.
Departmental Contributionto OverheadDepartmental Contributionto Overhead
McGraw-Hill/Irwin © The McGraw-Hill Companies, Inc., 2005
21-48
Departmental contributions are positive so neither department is a candidate for elimination.
Departmental Contributionto OverheadDepartmental Contributionto Overhead

McGraw-Hill/Irwin © The McGraw-Hill Companies, Inc., 2005
21-49
Costs are controllableif the manager
has the power to determine, or strongly influence, the amounts
incurred.
A manager’s performance evaluation
should be based on controllable costs.
I’m in control
Controllable CostsControllable Costs

McGraw-Hill/Irwin © The McGraw-Hill Companies, Inc., 2005
21-50
Direct costs are traced to departments, but may not be controllable by the department manager. • Example: Department managers usually
have no control over their own salaries.
Controllable costs are identified with a particular manager and a definite time period.• All costs are controllable at some level of management if
the time period is long enough.
Distinguishing Controllableand Direct CostsDistinguishing Controllableand Direct Costs

McGraw-Hill/Irwin © The McGraw-Hill Companies, Inc., 2005
21-51
An accounting system thatprovides information . . .
Responsibility AccountingResponsibility Accounting
Relating to theresponsibilities of
individual managers.
To evaluatemanagers on
controllable items.
McGraw-Hill/Irwin © The McGraw-Hill Companies, Inc., 2005
21-52
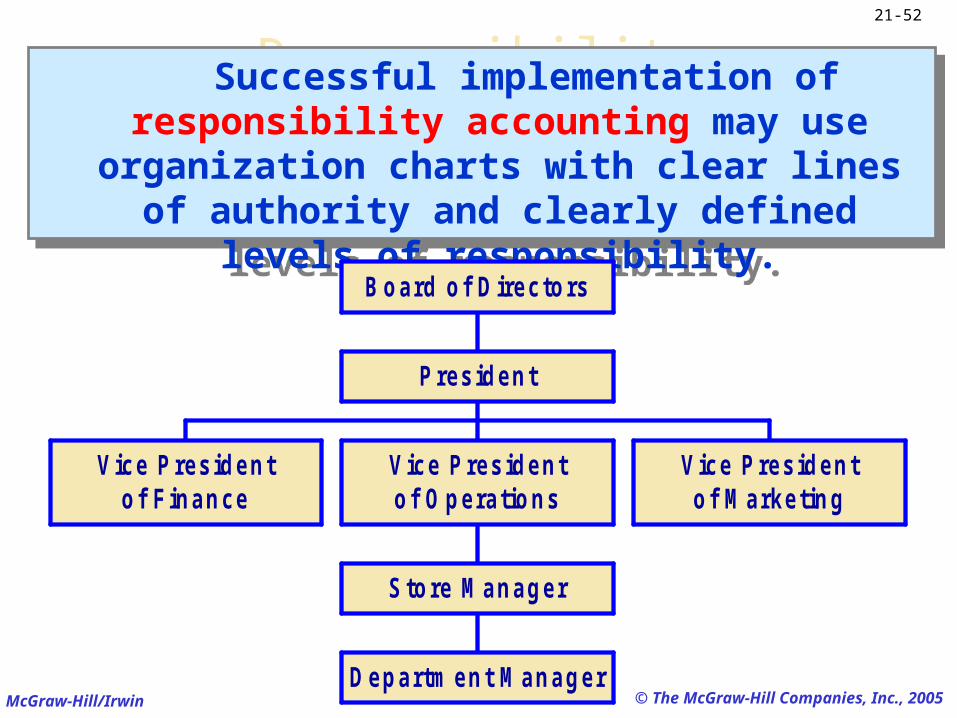
Responsibility Accounting Successful implementation of responsibility accounting may use organization charts with
clear lines of authority and clearly defined levels of responsibility.
Successful implementation of responsibility accounting may use organization charts with
clear lines of authority and clearly defined levels of responsibility.
Vice Presidentof F inance
D epartm ent M anager
Store M anager
V ice Presidentof O perations
V ice Presidentof M arketing
President
B oard of D irectors

McGraw-Hill/Irwin © The McGraw-Hill Companies, Inc., 2005
21-53
Amount of detail varies according to level in organization.
A department manager receives detailed reports.
A store manager receives summarized information from each department.
Responsibility AccountingPerformance ReportsResponsibility AccountingPerformance Reports

McGraw-Hill/Irwin © The McGraw-Hill Companies, Inc., 2005
21-54
The vice president of operations receives summarized information
from each store.
Management by exception:
Upper-level management does not receive operating
detail unless problems arise.
Amount of detail varies according to level in organization.
Responsibility AccountingPerformance ReportsResponsibility AccountingPerformance Reports

McGraw-Hill/Irwin © The McGraw-Hill Companies, Inc., 2005
21-55
End of Chapter 21End of Chapter 21