mcbrady, a_qfm_finalpaper_2015 (3)
TRANSCRIPT

Observational comparisons of environmental stress on grassland species
diversity at the Fort Ord Landfill and native counterpart:
A submission for Final Project in ENVS 350, CSUMB, Spring 2015
McBrady, A., Chow, K., Schulze, B.
Division of Science & Environmental Policy, California State University Monterey Bay, Seaside, CA, USA.
Abstract
Extreme stress on plant communities has been known to facilitate species interactions and
increase species richness. Survey methods were used to compare plant species diversity between
a recently capped landfill and its potential native grassland habitat. We recorded percent cover of
plant species, species type, and average height along transects at two landfill and two native
sites. The collected data was analyzed using Jmp statistical software and compared between each
site for species diversity, evenness, richness, and percent cover. We found that the most
disturbed landfill site had the greatest species richness overall with a combination of native and
exotic species while the native grassland was dominated by exotic species. This study was an
observational comparison focusing on a landfill whose physical disturbance is site-specific;
however, increasing the number of samples will add the ability to draw conclusions for future
remediation methods.
Introduction
Environmental limiting factors are some of the greatest determinants for growth and
development of biological communities. These stresses result from fluctuating conditions
ranging from the abiotic (slope, wind, temperature, etc.) to the biotic (competition for space,
nutrients, access to sunlight, etc.). For many species these environmental stressors only have
negative impacts; however, positive species interactions, or facilitation, have been known to
occur in plant communities (Qiang and Bertness 2014). Plants band together under such stress
for the purpose of associational defense which actually increases species richness (Qiang and
Bertness 2014). Plant communities will often trend along environmental stress gradients, and
those in the harshest physical habitat will have communities whose structure is determined
directly by the severity of the stress (Menge, 2000; Menge and Branch, 2001). There are many
environments that have experienced high levels of physical stress, but few with as long a history
of continued human disturbance as Fort Ord.
Since its purchase by the U.S. Army in 1917, until its closure in 1993, Fort Ord served as a
training ground for infantry and munitions testing and grew into a major military installation
(BLM 2015). The former base comprised approximately 28,000 acres adjacent to Monterey
County (BLM 2015). The entire Fort Ord area is significant because of its rich biodiversity and
important Central Coast habitats, supporting a diverse group of rare and endemic species of
plants and animals (Obama 2012). Unfortunately, some grassland habitats have been negatively
impacted with stresses and physical disturbance in part from the Fort Ord landfills’ construction
and waste.
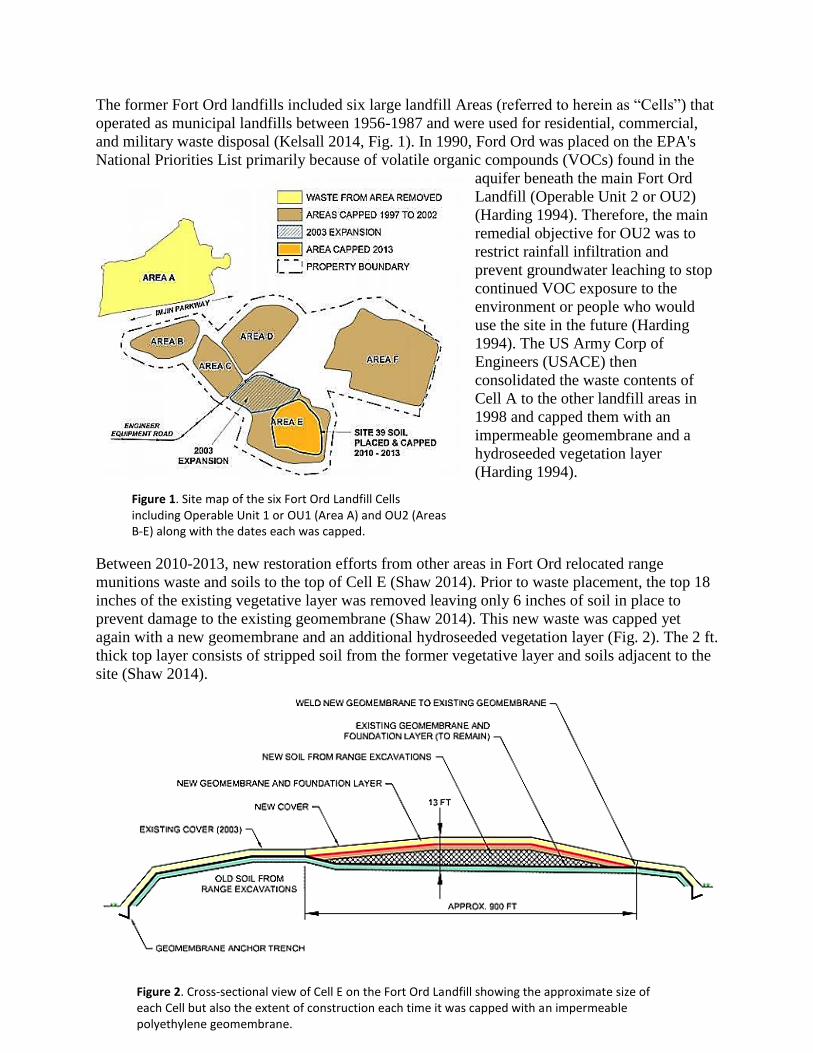
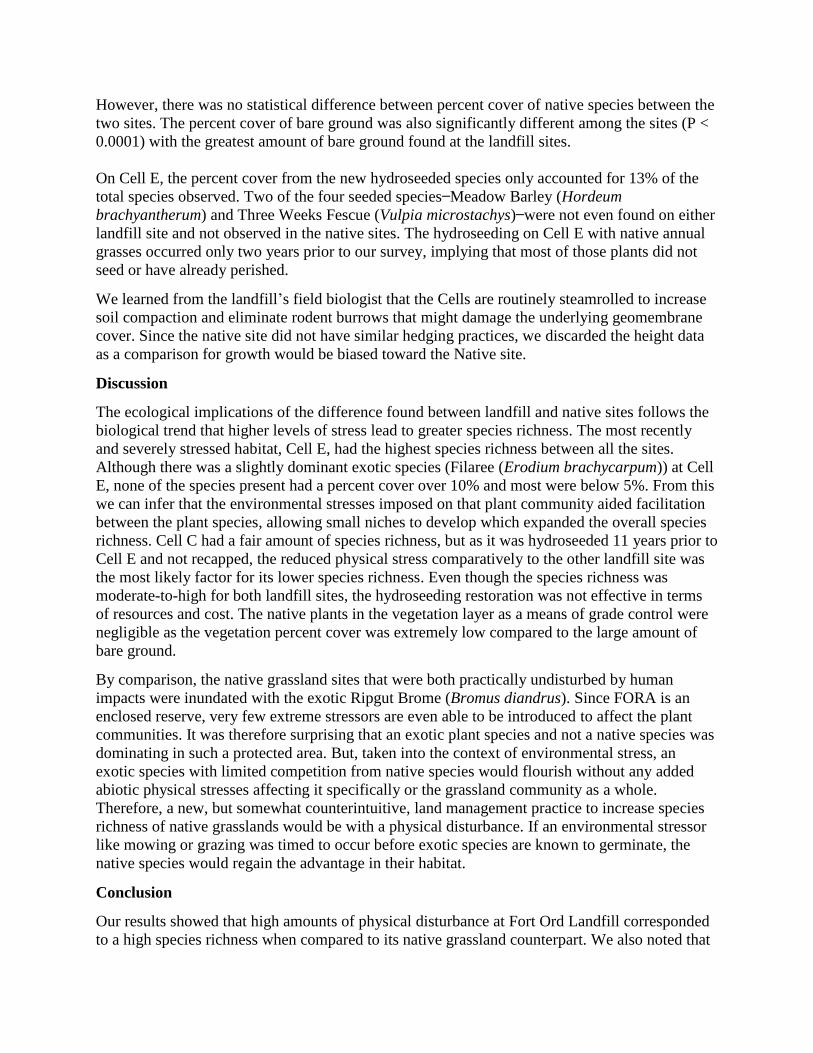
Figure 2. Cross-sectional view of Cell E on the Fort Ord Landfill showing the approximate size of each Cell but also the extent of construction each time it was capped with an impermeable polyethylene geomembrane.
The former Fort Ord landfills included six large landfill Areas (referred to herein as “Cells”) that
operated as municipal landfills between 1956-1987 and were used for residential, commercial,
and military waste disposal (Kelsall 2014, Fig. 1). In 1990, Ford Ord was placed on the EPA's
National Priorities List primarily because of volatile organic compounds (VOCs) found in the
aquifer beneath the main Fort Ord
Landfill (Operable Unit 2 or OU2)
(Harding 1994). Therefore, the main
remedial objective for OU2 was to
restrict rainfall infiltration and
prevent groundwater leaching to stop
continued VOC exposure to the
environment or people who would
use the site in the future (Harding
1994). The US Army Corp of
Engineers (USACE) then
consolidated the waste contents of
Cell A to the other landfill areas in
1998 and capped them with an
impermeable geomembrane and a
hydroseeded vegetation layer
(Harding 1994).
Between 2010-2013, new restoration efforts from other areas in Fort Ord relocated range
munitions waste and soils to the top of Cell E (Shaw 2014). Prior to waste placement, the top 18
inches of the existing vegetative layer was removed leaving only 6 inches of soil in place to
prevent damage to the existing geomembrane (Shaw 2014). This new waste was capped yet
again with a new geomembrane and an additional hydroseeded vegetation layer (Fig. 2). The 2 ft.
thick top layer consists of stripped soil from the former vegetative layer and soils adjacent to the
site (Shaw 2014).
Figure 1. Site map of the six Fort Ord Landfill Cells including Operable Unit 1 or OU1 (Area A) and OU2 (Areas B-E) along with the dates each was capped.

In an effort to promote restoration, even in this severely impacted area, the USCAE hydroseeded
the new vegetative layer with four native grassland species: California Brome (Bromus
carinatus), Meadow Barley (Hordeum brachyantherum), Three Weeks Fescue (Vulpia
microstachys), and Tomcat Clover (Trifolium wildenovii) (Shaw 2014). The vegetation layer
protected the geomembrane and supported the regrowth of the seeded species. Even though the
vegetative layer itself was merely a byproduct of the larger landfill remediation, considerable
time and money had been spent simulating the native grassland habitat. Therefore, we focused
our research to measure possible differences between the landfill site and native grasslands by
testing: (A) what plant species are growing in this physically disturbed grassland versus the
native habitat, (B) how plant growth on this harsh landscape compared to its undisturbed
counterparts, and (C) if the remediation efforts on the landfill to restore native species were an
effective allocation of resources.
Methods
Site Selection Physically altering a natural habitat can have drastic impacts to native plant species. The Fort
Ord Landfill was used by the Army for both residential and military waste. Before the transfer of
Fort Ord lands from Army to public control, federal mandates required that the area go through
remediation efforts. However, lasting disturbances can persist even in areas that have undergone
restoration. In order to measure possible differences in grassland species diversity and abundance
from stress, we surveyed two impacted sites located on the Fort Ord Landfill and two
comparison sites within the Marina Fort Ord Reuse Authority (FORA) Reserve.
The habitat disturbances were relatively site-specific so we categorized all areas within the Fort
Ord Landfill as disturbed (landfill) and any neighboring undeveloped grassland areas as
undisturbed (native). All of the sites chosen were located within the city of Marina, CA and
selected based on the dominant soil texture (Sand) and soil type (Baywood Sand) that matched
the Landfill area (CCoWS 2015, Fig. 3 & 4). We wanted to account for the greatest range of
restoration growth and chose Cells C and E from the landfill as they were hydroseeded 11 years
apart. The privately-managed landfill could only be surveyed over 4 hours while we were
escorted by their field biologist. The proximity between C and E also allowed for ease of
surveying during our limited access time.
Figure 3. Approximate Fort Ord Landfill area highlighted in red (bottom) identified as Sand soil texture with matching soil texture in the area of the FORA reserve (top).
Figure 4. Approximate Fort Ord Landfill area highlighted in red (bottom) identified as Baywood Sand soil type with matching soil type in the area of the FORA reserve (top).

We chose the sites at FORA based off of their characteristic grasslands as a portrayal of what
habitat would occur naturally in the landfill area. The FORA reserve had the added benefit of
being enclosed by a perimeter fence that restricted outside influence to the habitats. Both of the
native grassland sites (Native 1 and 2) were at least 100 m away from any perimeter fence/road
as to represent undisturbed land parcels with little human impact (Fig. 5).
Data Collection and Analysis We surveyed the landfill and native grassland sites within a two-week period in the spring so the
sites would not have bias in growth time. We used systematic sampling within the homogeneous
grassland areas and laid out a 75 m main transect at each site. We then recorded the approximate
slope and UTM coordinates from the zero mark on the main transect. We included random
number generation and coin-flips to further reduce bias in our sampling methods. We designated
a random starting distance (0-5 m) on the main transect for each 50 m branching transect, after
which they would be replicated in increasing 5 m intervals along one side of the main transect
(15 total). We then flipped a coin to determine the starting side of our 50 m branch transects
where tails started on the left and heads was right, after which we alternated sides every 5 m. We
collected the percent cover of each species based on a visual estimate using a 0.5 m2 unstrung
quadrat. Bare ground, thatch, and unidentified species were also included in the visual estimates.
We used a meter stick to record the average height of vegetation within the quadrats to measure
vigor between sites.
There were 150 quadrats per site and a total of 600 quadrats in the study: 300 quadrats collected
from the native sites and 300 quadrats collected from the landfill sites.
Figure 5. . Survey locations on the Fort Ord Landfill, Site C and Site E (bottom left), and on the FORA reserve, Native 1 and Native 2. These positions were found using the GPS coordinates gathered during each site transect survey.

Statistical Analysis
We tested the grassland species richness, evenness, and species diversity between all sites using
nonparametric distribution comparisons (Wilcoxon-Rank Sum, Shannon-Weiner Diversity
Index). We also tested percent cover of native and exotic grassland species between the landfill
and native areas (Mann-Whitney U test). Additional paired comparisons were made between
each site at α = 0.05 (Steel-Dwass). The data collected was not normally distributed and did not
respond to transformation. However, the data met the assumptions that the independent samples
were drawn from populations with an ordinal distribution. We then compared the percent cover
of the hydroseeded species to the total percent cover in the landfill to quantify the effectiveness
of the restoration effort.
We organized our data using Excel and then used Jmp Pro 11.7z for all statistical analysis and
figure generation.
Results
Grassland Species
Diversity Comparisons
From the grassland surveys
of the landfill and native
sites we found a total of 17
exotic plant species, 23
native species, and 4
unknown species within the
four sites. The diversity of
plant species from each site
was significantly different
(P < 0.0001, Fig. 6).
Further comparisons found
that evenness in species
diversity significantly
differed between each site
(P < 0.0001) except for a
paired comparison of Cell
E and Native 1 (P < 0.9665,
Fig. 7). A significant
difference in species
richness was also found per
site (P < 0.0001) but only
sites Native 1 and 2 did not
differ significantly for the paired comparison (P < 0.1129, Fig. 8).
Figure 6. A Wilcoxon-Rank Sum and Shannon-Weiner Diversity Index comparing the diversity of grassland species per native areas (Native 1 and 2) and landfill sites (Cell C and E) found that they all differed significantly.

Percent Cover
Native Site 1 contained 18 observed plant species (12 native, 6 exotic) while Site 2 had 17 (8
native, 8 exotic, and 1 unknown species). A percent cover site comparison revealed that the
dominant species from both native sites was the exotic species Ripgut Brome (Bromus diandrus)
and not any of the native grassland species (Appendix A1 & A2). The native sites also had very
little bare ground except for thatch which
suggests that the soils are fertile enough to
facilitate consistent plant growth. Even
though the majority of the landfill cover
was bare ground, Cell C contained 15
total species (6 native, 6 exotic, and 3
unknown) and Cell E contained 29 species
(17 native, 12 exotic); more species
richness than any other site (Appendix A3
& A4, respectively). Also, the average
topography of the landfill sites was much
steeper (11% slope) than the native site
(2.5% slope), which might have increased
environmental stress conditions. Analysis
of the sites indicate that the percent of
exotic grassland species differ between
the landfill and native sites with the native
having a higher percent cover of exotics
than the landfill site (P < 0.0001, Fig. 9).
Figure 7. Comparison of grassland species evenness between each of the FORA native and Fort Ord landfill survey sites found significant difference between all except Cell E and Native 1.
Figure 8. Comparison of grassland species richness between each of the Fort Ord landfill and FORA native sites survey sites found significant difference between all sites except Native 1 and Native 2.
Figure 9. Percent cover comparison of exotic grassland species found at both the native and landfill sites. The highest total percent cover of exotic plants was found in the FORA reserve areas and not at the Fort Ord Landfill.
However, there was no statistical difference between percent cover of native species between the
two sites. The percent cover of bare ground was also significantly different among the sites (P <
0.0001) with the greatest amount of bare ground found at the landfill sites.
On Cell E, the percent cover from the new hydroseeded species only accounted for 13% of the
total species observed. Two of the four seeded species ̶ Meadow Barley (Hordeum
brachyantherum) and Three Weeks Fescue (Vulpia microstachys) ̶ were not even found on either
landfill site and not observed in the native sites. The hydroseeding on Cell E with native annual
grasses occurred only two years prior to our survey, implying that most of those plants did not
seed or have already perished.
We learned from the landfill’s field biologist that the Cells are routinely steamrolled to increase
soil compaction and eliminate rodent burrows that might damage the underlying geomembrane
cover. Since the native site did not have similar hedging practices, we discarded the height data
as a comparison for growth would be biased toward the Native site.
Discussion
The ecological implications of the difference found between landfill and native sites follows the
biological trend that higher levels of stress lead to greater species richness. The most recently
and severely stressed habitat, Cell E, had the highest species richness between all the sites.
Although there was a slightly dominant exotic species (Filaree (Erodium brachycarpum)) at Cell
E, none of the species present had a percent cover over 10% and most were below 5%. From this
we can infer that the environmental stresses imposed on that plant community aided facilitation
between the plant species, allowing small niches to develop which expanded the overall species
richness. Cell C had a fair amount of species richness, but as it was hydroseeded 11 years prior to
Cell E and not recapped, the reduced physical stress comparatively to the other landfill site was
the most likely factor for its lower species richness. Even though the species richness was
moderate-to-high for both landfill sites, the hydroseeding restoration was not effective in terms
of resources and cost. The native plants in the vegetation layer as a means of grade control were
negligible as the vegetation percent cover was extremely low compared to the large amount of
bare ground.
By comparison, the native grassland sites that were both practically undisturbed by human
impacts were inundated with the exotic Ripgut Brome (Bromus diandrus). Since FORA is an
enclosed reserve, very few extreme stressors are even able to be introduced to affect the plant
communities. It was therefore surprising that an exotic plant species and not a native species was
dominating in such a protected area. But, taken into the context of environmental stress, an
exotic species with limited competition from native species would flourish without any added
abiotic physical stresses affecting it specifically or the grassland community as a whole.
Therefore, a new, but somewhat counterintuitive, land management practice to increase species
richness of native grasslands would be with a physical disturbance. If an environmental stressor
like mowing or grazing was timed to occur before exotic species are known to germinate, the
native species would regain the advantage in their habitat.
Conclusion
Our results showed that high amounts of physical disturbance at Fort Ord Landfill corresponded
to a high species richness when compared to its native grassland counterpart. We also noted that

native grassland areas had the highest percent cover of exotic plant species between the sites. We
were limited in our total assessment as surveying only two sites was not enough to draw
conclusions about the potential differences between sites. Since the habitat disturbances from the
Fort Ord Landfill are relatively site-specific because of the waste types and construction,
replication cannot be performed. However, landfill capping is not a practice limited to this site
and so, before applying vegetative covers as the restoration solution, land managers could utilize
our data as a baseline for assessing their remediation and maintenance.
Acknowledgements
We would like to thank David Masters for his help gathering field data. We would also like to
thank Bartholmew Kowalski for facilitating our research on the landfill site as well as Krikor
Adonian for helping us to identify many of the unknown plant species we found. Last, but not
least, we would like to thank the Undergraduate Research Opportunities Center (UROC) for
providing us with the materials and equipment needed to conduct the surveys. Without each of
their support this project would not have been possible.

Appendix A
Appendix A1. Percent cover comparison of the different grassland species found at Native 1. Bromus diandrus (BRDI) had the highest percentage of cover for the entire site with no other exotic or native species exceeding 10% cover.
Appendix A2. Percent cover comparison of the different grassland species found at Native 2. Bromus diandrus (BRDI) had the highest percentage of cover for the entire site. Thatch (TH) had the second highest percentage followed by another exotic species, Erodium brachycarpum (ERBR). None of the native species exceeded 10% cover except for Croton californicus (CRCA).

Appendix A (cont.)
Appendix A3. Percent cover comparison of the different grassland species found at landfill Cell C. The highest percentage of cover was observed as bare ground (BG) and Bromus diandrus (BRDI) had the highest percentage of cover for any plant species at the site.
Appendix A4. Percent cover comparison of the different grassland species found at landfill Cell E. The highest percentage of cover was observed as bare ground (BG) and Erodium brachycarpum (ERBR) had the highest percentage of cover for any plant species at the site.

References
Bureau of Land Management, BLM. 2015. Fort Ord National Monument. Hollister Field Office.
Central Coast Watershed Studies Team, CCoWS. 2015. Fort Ord Maps & Visualizations. Soil &
Farmland.
Harding Lawson Associates. 1994. EPA Superfund Record of Decision: Operable Unit 2, Fort
Ord Landfills Fort Ord, California. USACE
Kelsall, P. 2014. Site 39 Soil Remediation, OU2 Landfill Capping, Groundwater Treatment Plant
Relocation. Community Involvement Mobile Workshop and Presentation.
Menge, B. A., 2000. Top-down and bottom-up community regulation in marine rocky intertidal
habitats. J. Exp. Mar. Biol. Ecol, 250257-289.
Menge, B. A., and G. M. Branch., 2001. Rocky intertidal communities. In M. D. Bertness, S. D.
Gaines, and M. E. Hay (eds.), Marine community ecology, pp. 221–251. Sinauer Associates,
Inc., Sunderland, Massachusetts.
Obama, B., 2012. Establishment of the Fort Ord National Monument by the President of the
United States of America. Presidential Proclamation.
Qiang H., and Bertness M. D., 2014. Extreme stresses, niches, and positive species interactions
along stress gradients. Ecology, 95(6), 2014, pp. 1437–1443
Shaw Environmental, Inc. 2014. Final Construction Quality Control and Assurance Report Area
E, Phase I Operable Unit 2 Landfills Former Fort Ord, California. Worldwide Environmental
Remediation Services, USACE Contract W912DY-10-D-0024