mc donald’s group 3 1.le thi thuy linh 2.tu ngoc hinh 3.pham thanh an 4.nguyen thi my hang
TRANSCRIPT

Mc Donald’s
Group 3
1. Le Thi Thuy Linh2. Tu Ngoc Hinh3. Pham Thanh An4. Nguyen Thi My Hang

Recomendation
Conclusion
Ratios analysis
Common size
Introduction
Content

Introduction1. History
Name McDonald's Corporation
Industries served Restaurants, Food
Geographic areas served Worldwide
Headquarters U.S.
Current CEO Don Thompson
Revenue $ 27.56 billion (2012)
Profit $ 5.46 billion (2012)
Employees 1,800,000 (2013)
McDonald’s is the world’s leading fast food restaurant chain with more than 34,000 local restaurants serving approximately 69 million people in 119 countries each day.

Introduction2. Product of Mc Donald’s
Delicious, freshly made, and oh-so-satisfying. From the Big Mac to our Premium Grilled Chicken Club to our classic Cheeseburger, McDonald’s sandwiches make the meal
From our ever-popular Chicken McNuggets, our fabulously fresh salads or the classic Filet-O-Fish, both chicken and fish from McDonald’s are delicious choices.
Burger
Chicken, fish and pork
Introduction
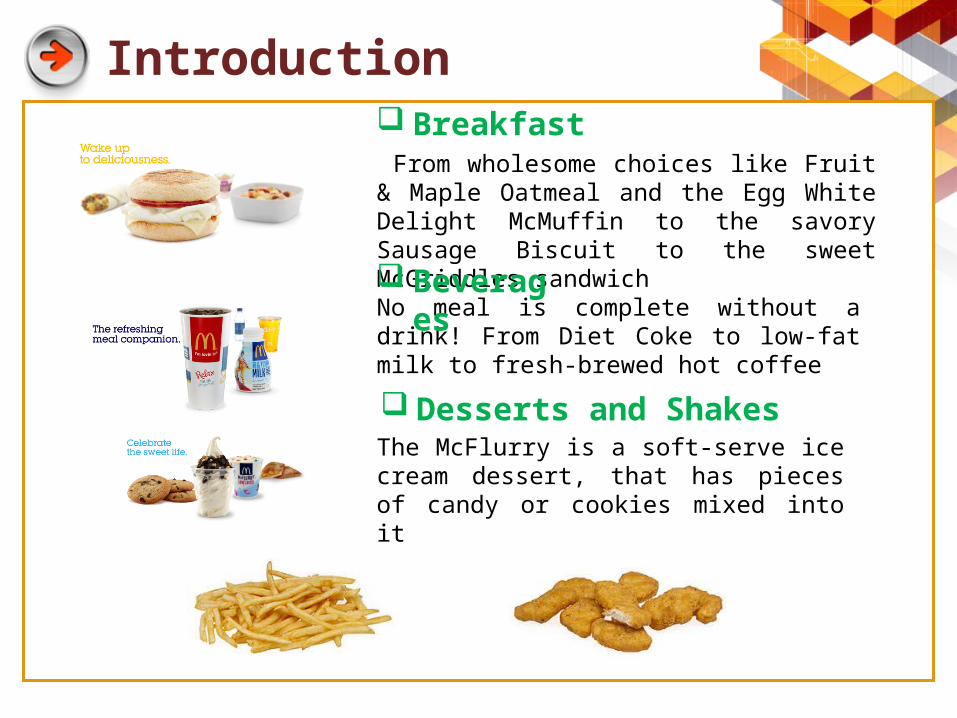
From wholesome choices like Fruit & Maple Oatmeal and the Egg White Delight McMuffin to the savory Sausage Biscuit to the sweet McGriddles sandwich
No meal is complete without a drink! From Diet Coke to low-fat milk to fresh-brewed hot coffee
The McFlurry is a soft-serve ice cream dessert, that has pieces of candy or cookies mixed into it
Breakfast
Beverages
Desserts and Shakes

3. Mc Donald’s in Viet Nam
• In 10/02/2014, McDonald's Corporation opened the first restaurant in Vietnam.
• Strategically located at the busy roundabout at intersection of Dien Bien Phu and Nguyen Binh Khiem Streets in District 1.
• McDonald's 350-seat restaurant.
• With a total floor area more than 1,300 square meters on a property close to 3,000 square meters, the restaurant is designed as a modern dining destination
Introduction
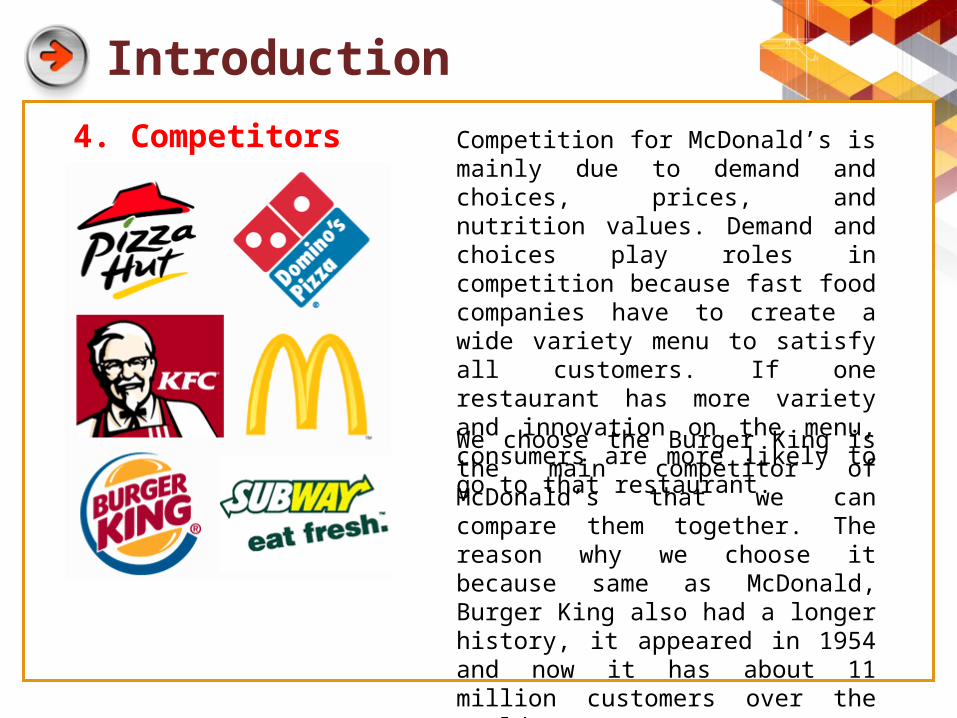
4. Competitors
Introduction
Competition for McDonald’s is mainly due to demand and choices, prices, and nutrition values. Demand and choices play roles in competition because fast food companies have to create a wide variety menu to satisfy all customers. If one restaurant has more variety and innovation on the menu, consumers are more likely to go to that restaurant.
We choose the Burger King is the main competitor of McDonald’s that we can compare them together. The reason why we choose it because same as McDonald, Burger King also had a longer history, it appeared in 1954 and now it has about 11 million customers over the world
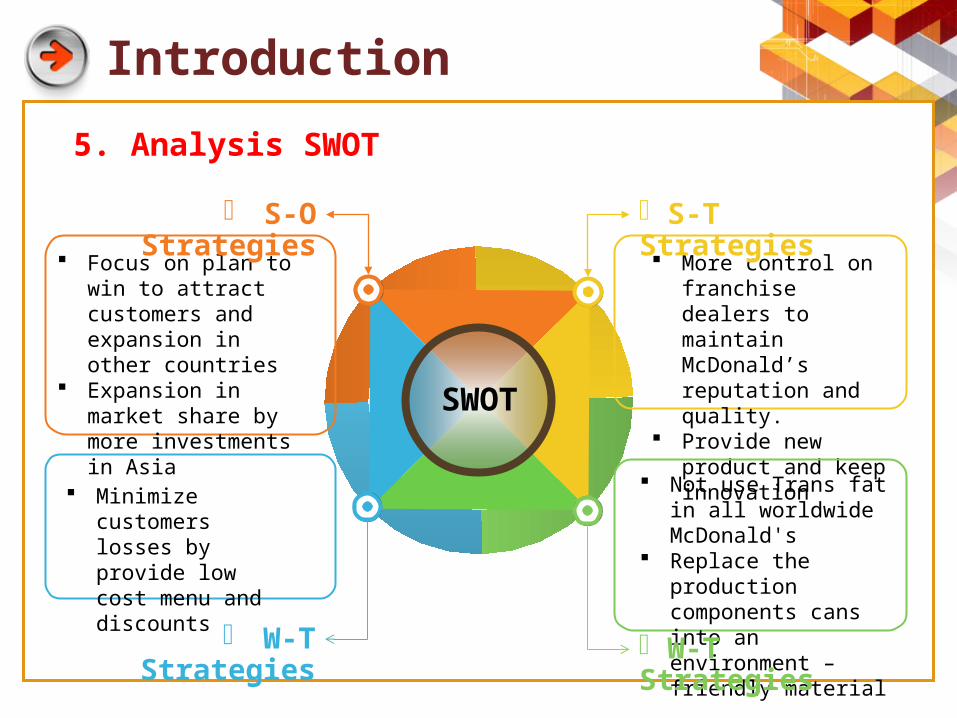
Focus on plan to win to attract customers and expansion in other countries
Expansion in market share by more investments in Asia
S-O Strategies
Minimize customers losses by provide low cost menu and discounts
W-T Strategies
More control on franchise dealers to maintain McDonald’s reputation and quality.
Provide new product and keep innovation
S-T Strategies
Not use Trans fat in all worldwide McDonald's
Replace the production components cans into an environment – friendly material
W-T Strategies
SWOT
Introduction
5. Analysis SWOT

Common size
Income Statement(%)
2011 2012 2013
MD BK MD BK MD BK
Sales 100 100 100 100 100 100
COGS 60.43 60.68 60.76 53.29 61.21 19.58
Gross profit 51.24 20.33 51.09 29.74 51.71 61.82
EBIT 31.58 21.34 31.21 26.96 31.18 51.28
Interest expense
1.82 9.69 1.87 11.36 1.86 17.45
EBT 31.58 11.65 31.21 15.61 31.18 33.83
Net Income 20.38 3.77 19.82 5.97 19.87 20.39

Common size
Balance sheet (%)
2011 2012 2013
MD BK MD BK MD BK
Cash 7.08 8.22 6.60 9.83 7.64 13.50
Account receivable 4.05 2.74 3.89 3.22 3.60 3.08
Inventory 0.35 0.25 0.34 0.12 0.34 0.02
Current asset 13.35 12.94 13.91 16.00 13.79 18.43
Non-current asset 17.44 1.99 16.35 3.19 15.91 6.24
Total asset 100 100 100 100 100 100
Account payable 2.91 1.76 3.23 1.23 2.97 0.53
Current liabilities 10.64 8.44 9.62 7.15 8.65 5.94
Equity 43.62 25.96 43.22 21.12 43.71 26.01
Total Liabilities & equity
100 100 100 100 100 100

Common size
Cash flow (%)
Consolidated Statement of Cash flow
Year 2011 2012 2013
Cash provided by operation 7150.1 6966.1 7120.7
Cash used for investing activities (2570.9) (3167.3) (2673.8)
Cash used for financing activities (4533.0) (3849.8) (4043.0)

Ratios analysis
01. Activity Ratios
- Short-term activity ratios- Long-term activity ratios
Our group focused to analyze 4 ratios to understand all McDonald’s financial situation
02. Liquidity ratios
- Current ratio- Quick ratio- Cash from operation ratio- Description of the contents
03. Long-term debt and solvency ratios
- Debt to total capital- Debt to equity- Time interest earned- Financial leverage
04. Profitability ratios
- Net profit margin- Gross profit margin- ROS- ROA- ROE

Activity ratios
Dec 31, 2013 Dec 31, 2012 Dec 31, 2011
Activity ratiosShort-term activity ratios
Inventory turnover 140.2038 140.4671 143.9735
DOH 2.5677 2.5629 2.5005
Receivables turnover 20.8569 20.3446 21.4862
DOS 17.2605 17.6951 16.7549
Working capital turnover 16.5371 22.8506 23.1057
Payable turnover 25.2307 26.2143 28.3498
Number of day of payables 13.7329 12.6985
Long-term activity ratios
Total asset turnover 0.7806 0.8063 0.8314
Fixed asset turnover 1.1148 1.1604 1.2031
Activity ratios

Activity ratios (cont.)
The inventory turnover ratio=𝐶𝑜𝑠𝑡𝑜𝑓 𝑔𝑜𝑜𝑑 𝑠𝑜𝑙𝑑𝐴𝑣𝑒𝑟𝑎𝑔𝑒𝑖𝑛𝑣𝑒𝑛𝑡𝑜𝑟𝑦
=17,203
(123.7+121.7 )/2=140.2038
Because of McDonald’s is the merchandise company so most of inventories of company only focus on finished goods.
1. Short-term activity ratios1.1 The inventory turnover ratios
Inventory Turnover, comparison with Burger King
Dec 31, 2013 Dec 31, 2012 Dec 31, 2011
McDonald’s 140.2038 140.4671 143.9735
Burger King 57.0127 102.9412 97.5945
Data of Inventory of McDonald’s from 2010 to 2013Year 2010 2011 2012 2013
Inventories (million) 109.9 116.8 121.7 123.7
Average Inventories 113.35 119.25 122.7

Activity ratios (cont.)
Dec, 2011 Dec, 2012 Dec,20130
20
40
60
80
100
120
140
160 143.9735 140.4671 140.2038
97.5945102.9412
57.0127
McDonald'sBurger King

Activity ratios (cont.)1. Short-term activity ratios
1.2. Average number of day inventory in stock
Days of inventory on hand, comparison with Burger King
Dec 31, 2013 Dec 31, 2012 Dec 31, 2011
McDonald’s 2.5677 2.5629 2.5005
Burger King 3.2488 2.6516 2.8289
Dec, 2011 Dec, 2012 Dec,20130
1
2
3
4
2.5005 2.5629 2.5677
2.8289 2.65163.2488 McDonald's
Burger King
Average numberof day inventory∈stock=360
𝐼𝑛𝑣𝑒𝑛𝑡𝑜𝑟𝑦 𝑡𝑢𝑟𝑛𝑜𝑣𝑒𝑟=
360140.2038
=2.5677

Activity ratios (cont.)
Thereceivable turnover=𝑆𝑎𝑙𝑒𝑠
𝐴𝑣𝑒𝑟𝑎𝑔𝑒𝑎𝑐𝑐𝑜𝑢𝑛𝑡𝑟𝑒𝑐𝑒𝑖𝑣𝑎𝑏𝑙𝑒𝑠=
28,105.7(1,319.8+1,375.3)/2
1. Short-term activity ratios1.3. The receivable turnover
Receivables Turnover, comparison with Burger King
Dec 31, 2013 Dec 31, 2012 Dec 31, 2011
McDonald’s 20.8569 20.3446 21.4862
Burger King 6.3914 11.8800 15.2785
Data of Receivable of McDonald’s from 2010 to 2013Year 2010 2011 2012
Account receivable (million)
1,179.1 1,334.7 1,375.3
Average account receivable 1256.9 1355

Activity ratios (cont.)
Dec, 2011 Dec, 2012 Dec,20130
5
10
15
20
2521.4862
20.3446 20.8569
15.2785
11.88
6.3914
McDonald'sBurger King

Activity ratios (cont.)1. Short-term activity ratios
1.4. Average number of day receivable outstanding
DOS (Days of sales outstanding), comparison with Burger King Dec 31, 2013 Dec 31, 2012 Dec 31, 2011
McDonald’s 17.2605 17.6951 16.7549
Burger King 56.3256 30.3029 23.5625
Dec, 2011 Dec, 2012 Dec,20130
10
20
30
40
50
60 McDonald'sBurger King
Average numberof dayreceivable outstanding=360
The receivable turnover=
36020.8569
=17.2605
Activity ratios (cont.)
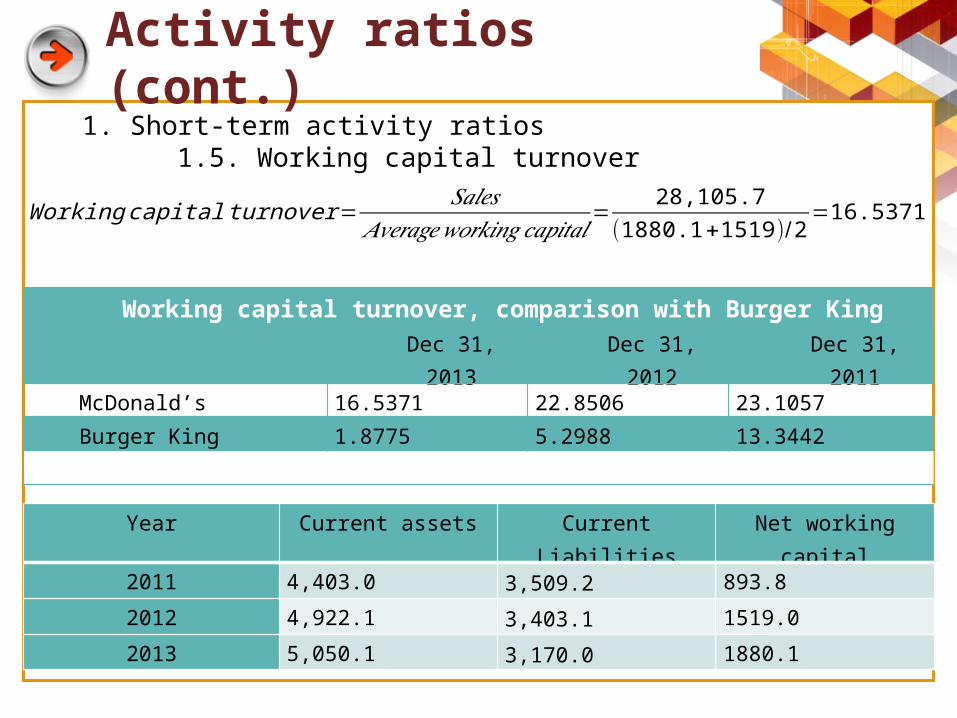
Working capital turnover=𝑆𝑎𝑙𝑒𝑠
𝐴𝑣𝑒𝑟𝑎𝑔𝑒𝑤𝑜𝑟𝑘𝑖𝑛𝑔𝑐𝑎𝑝𝑖𝑡𝑎𝑙=
28,105.7(1880.1+1519)/2
=16.5371
1. Short-term activity ratios1.5. Working capital turnover
Working capital turnover, comparison with Burger King
Dec 31, 2013 Dec 31, 2012 Dec 31, 2011
McDonald’s 16.5371 22.8506 23.1057
Burger King 1.8775 5.2988 13.3442
Year Current assets Current Liabilities Net working capital
2011 4,403.0 3,509.2 893.8
2012 4,922.1 3,403.1 1519.0
2013 5,050.1 3,170.0 1880.1

Activity ratios (cont.)
Dec, 2011 Dec, 2012 Dec,20130
5
10
15
20
25 23.1057 22.8506
16.5371
13.3442
5.2988
1.8775
McDonald'sBurger King

Activity ratios (cont.)1. Short-term activity ratios
1.6. Payable turnover
Year Begin Inventories
COGS Ending Inventories
Purchase
2011 109.9 16,319.4 116.8 16,326.3
2012 116.8 16,750.7 121.7 16,755.6
2013 121.7 17,203.0 123.7 17,205
Data of Account Payable of McDonald’s from 2010 to 2013Year 2010 2011 2012
Account payable (million) 943.9 961.3 1,141.9
Average account payable 952.6 1051.6
InventoriesBegin Inventories Purchases COGSEnding Inventories
So: Purchase = Ending inventories + COGS – Begin Inventories
Activity ratios (cont.)
2011 2012 201302468
1012141618
17.138415.9334 15.445
13.849912.6511
4.6232
McDonald'sBurger King
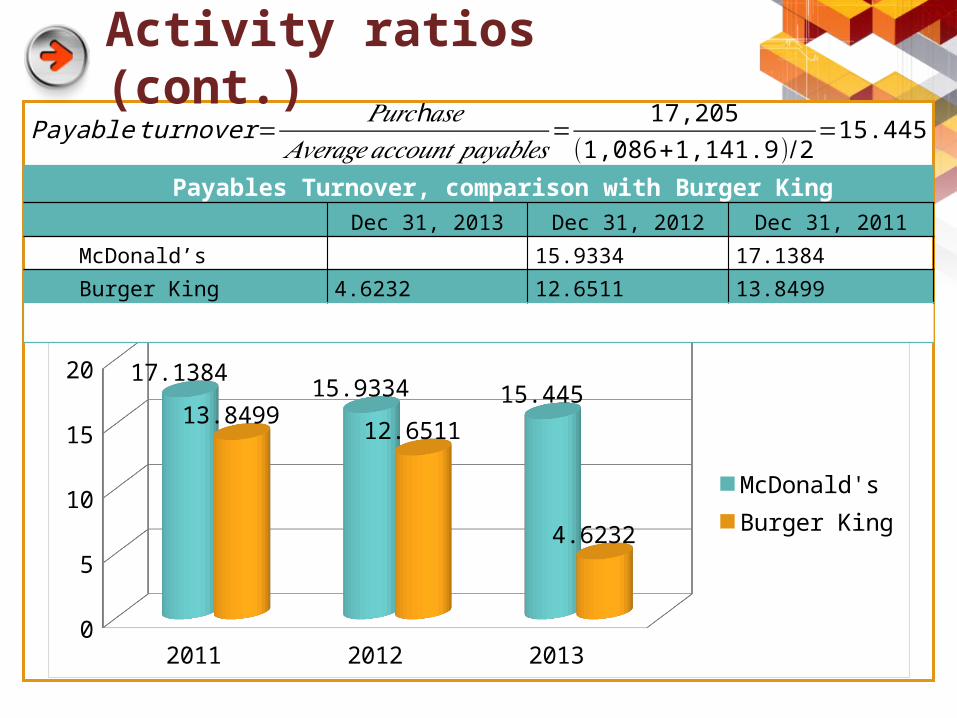
Payable turnover=h𝑃𝑢𝑟𝑐 𝑎𝑠𝑒
𝐴𝑣𝑒𝑟𝑎𝑔𝑒𝑎𝑐𝑐𝑜𝑢𝑛𝑡 𝑝𝑎𝑦𝑎𝑏𝑙𝑒𝑠=
17,205(1,086+1,141.9)/2
=15.445
Payables Turnover, comparison with Burger King
Dec 31, 2013 Dec 31, 2012 Dec 31, 2011
McDonald’s 15.9334 17.1384
Burger King 4.6232 12.6511 13.8499

Activity ratios (cont.)1. Short-term activity ratios
1.7. Number of days of payable
, comparison with Burger King
Dec 31, 2013 Dec 31, 2012 Dec 31, 2011
McDonald’s 23.5940 21.0055
Burger King 77.8681 28.4560 25.9929
Dec, 2011 Dec, 2012 Dec,20130
20
40
60
80
21.0055 23.594 23.308523.594 28.456
77.8681McDonald'sBurger King
Number of daysof payable=360
𝑃𝑎𝑦𝑎𝑏𝑙𝑒 𝑡𝑢𝑟𝑛𝑜𝑣𝑒𝑟 𝑟𝑎𝑡𝑖𝑜=
36025.2307
=14.2683

Activity ratios (cont.)
Total asset turnovers=𝑆𝑎𝑙𝑒
𝐴𝑣𝑒𝑟𝑎𝑔𝑒𝑡𝑜𝑡𝑎𝑙 𝑎𝑠𝑠𝑒𝑡𝑠=
28,105.7(36,626.3+35,386.5)/2
=0.7806
2. Long-term activity ratios2.1. Asset turnover
, comparison with Burger King
Dec 31, 2013 Dec 31, 2012 Dec 31, 2011
McDonald’s 0.7806 0.8063 0.8314
Burger King 0.2012 0.3536 0.4154
According to Income statement of McDonald’s, our group finds out that most of total asset of McDonald’s also come from Net property plant and equipment

Activity ratios (cont.)
Dec, 2011 Dec, 2012 Dec,20130
0.1
0.2
0.3
0.4
0.5
0.6
0.7
0.8
0.90.7806 0.8063 0.8314
0.41540.3536
0.2012
McDonald'sBurger King

Activity ratios (cont.)
¿ asset turnover=𝑆𝑎𝑙𝑒
𝐴𝑣𝑒𝑟𝑎𝑔𝑒𝑛𝑒𝑡 𝑓𝑖𝑥𝑒𝑑𝑎𝑠𝑠𝑒𝑡𝑠=
28,105.7(25,747.3+24,677.2)/2
=1.1148
2. Long-term activity ratios2.2. Fixed asset turnover
, comparison with Burger King
Dec 31, 2013 Dec 31, 2012 Dec 31, 2011
McDonald’s 1.1148 1.1604 1.2031
Burger King 1.3592 2.0619 2.1897

Activity ratios (cont.)
Dec, 2011 Dec, 2012 Dec,20130
0.5
1
1.5
2
2.5
1.1827 1.1171 1.0916
2.18972.0619
1.3592McDonald'sBurger King

Liquidity ratios
Dec 31, 2013 Dec 31, 2012 Dec 31, 2011
Liquidity analysis
Current ratio 1.593 1.446 1.255
Quick ratio 1.554 1.411 1.221
Cash ratio 0.8829 0.6865 0.6656
%Inventory/CA 2.45% 2.47% 2.65%
Cash flow from operation ratio 2.239 2.057 2.052
Liquidity analysis

Liquidity ratios (cont.)
Current ratio=𝐶𝑢𝑟𝑟𝑒𝑛𝑡 𝑎𝑠𝑠𝑒𝑡𝑠𝐶𝑢𝑟𝑟𝑒𝑛𝑡 𝑙𝑖𝑎𝑏𝑖𝑙𝑖𝑡𝑖𝑒𝑠
=5,050.13,170
=1.593
1. Current ratio
, comparison with Burger King
Dec 31, 2013 Dec 31, 2012 Dec 31, 2011
McDonald’s 1.593 1.446 1.255
Burger King 3.1052 2.2386 1.5328

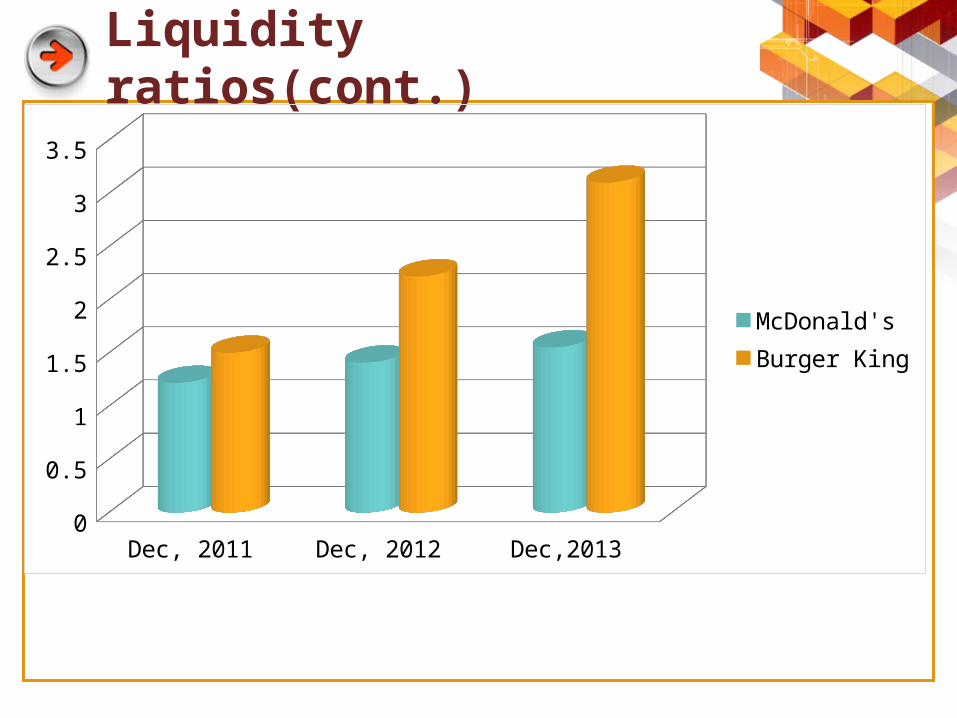
Liquidity ratios(cont.)
Dec, 2011 Dec, 2012 Dec,20130
0.5
1
1.5
2
2.5
3
3.5
1.2551.446
1.5931.5328
2.2386
3.1052
McDonald'sBurger King
Liquidity ratios (cont.)
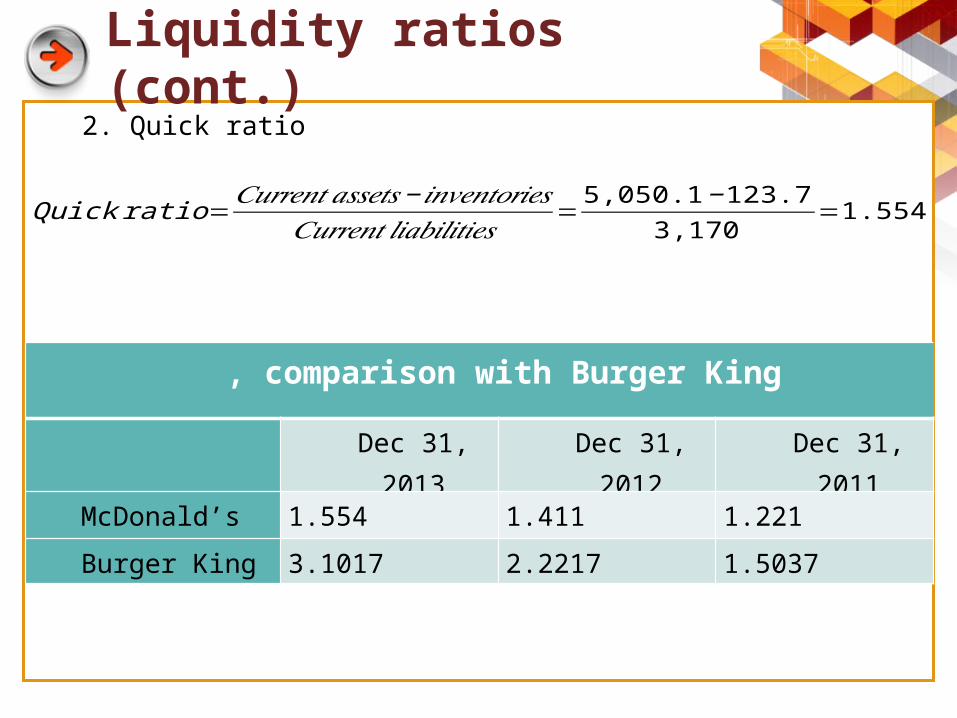
Quick ratio=𝐶𝑢𝑟𝑟𝑒𝑛𝑡 𝑎𝑠𝑠𝑒𝑡𝑠−𝑖𝑛𝑣𝑒𝑛𝑡𝑜𝑟𝑖𝑒𝑠
𝐶𝑢𝑟𝑟𝑒𝑛𝑡 𝑙𝑖𝑎𝑏𝑖𝑙𝑖𝑡𝑖𝑒𝑠=
5,050.1−123.73,170
=1.554
2. Quick ratio
, comparison with Burger King
Dec 31, 2013 Dec 31, 2012 Dec 31, 2011
McDonald’s 1.554 1.411 1.221
Burger King 3.1017 2.2217 1.5037
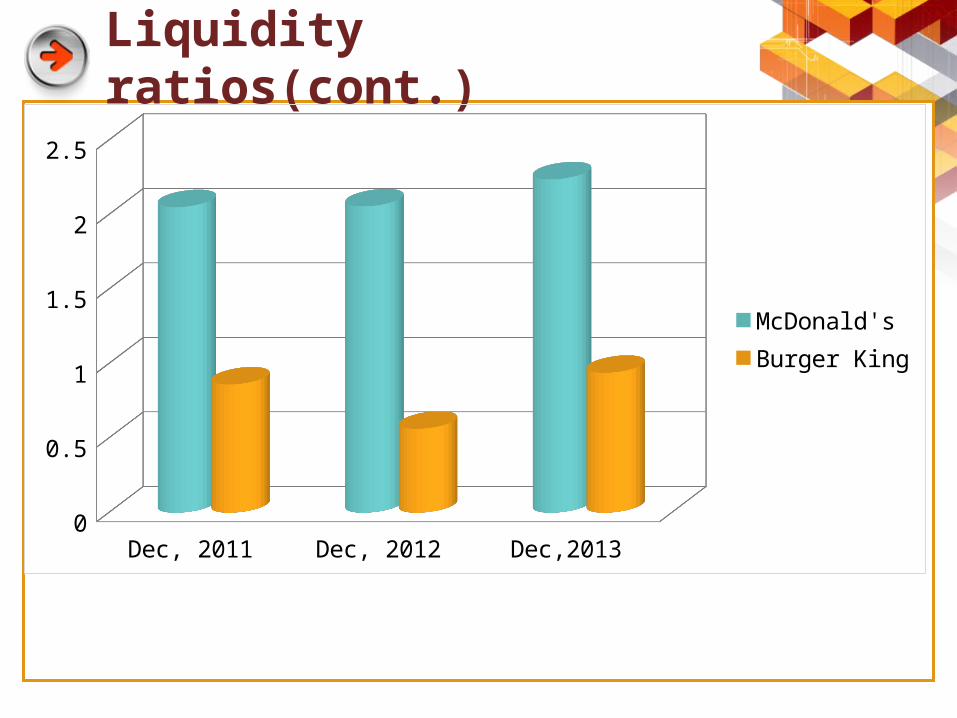
Liquidity ratios(cont.)
Dec, 2011 Dec, 2012 Dec,20130
0.5
1
1.5
2
2.5
3
3.5
McDonald'sBurger King

Liquidity ratios (cont.)
h𝐶𝑎𝑠 𝑟𝑎𝑡𝑖𝑜=h𝐶𝑎𝑠 +𝑀𝑎𝑟𝑘𝑒𝑡 𝑠𝑒𝑐𝑢𝑟𝑖𝑡𝑖𝑒𝑠𝐶𝑢𝑟𝑟𝑒𝑛𝑡 𝑙𝑖𝑎𝑏𝑖𝑙𝑖𝑡𝑖𝑒𝑠
=2,798.73,170.0
=0.8829
3. Cash ratio
, comparison with Burger King
Dec 31, 2013 Dec 31, 2012 Dec 31, 2011
McDonald’s 0.8829 0.6865 0.6656
Burger King 0.9731 1.3743 2.2743

Liquidity ratios(cont.)
2011 2012 20130
0.5
1
1.5
2
2.5
0.665600000000001 0.6865
0.8829
2.2743
1.3743
0.9371McDonald'sBurger King

Liquidity ratios (cont.)
Cash ¿operation ratio=Cash flow ¿ operation ¿𝐶𝑢𝑟𝑟𝑒𝑛𝑡 𝑙𝑖𝑎𝑏𝑖𝑙𝑖𝑡𝑖𝑒𝑠
=7,1003,170
=2.239
4. Cash from operation ratio
, comparison with Burger King
Dec 31, 2013 Dec 31, 2012 Dec 31, 2011
McDonald’s 2.239 2.057 2.052
Burger King 0.9399 0.5641 0.8615
Liquidity ratios(cont.)
Dec, 2011 Dec, 2012 Dec,20130
0.5
1
1.5
2
2.5
McDonald'sBurger King

Long-term debt and solvency ratio
Dec 31, 2013 Dec 31, 2012 Dec 31, 2011
Long-term debt and solvency analysis
Capitalization table and debt ratio
Debt to total capital 1.122 1.116 1.285
Debt to equity 0.198 0.223 0.244
Interest coverage ratios
Times interest earned 0.4531 0.4538 0.4617
Financial leverage 2.2878 2.3138 2.2925
Long-term debt and solvency analysis
Long-term debt and solvency ratio (cont.)
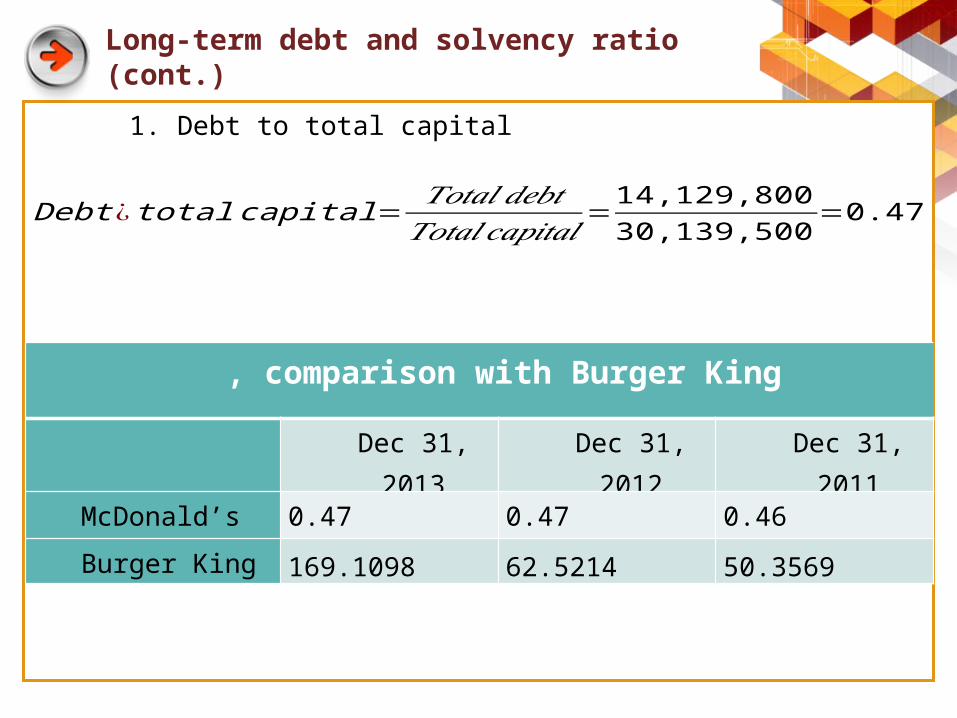
Debt ¿ total capital=𝑇𝑜𝑡𝑎𝑙 𝑑𝑒𝑏𝑡𝑇𝑜𝑡𝑎𝑙 𝑐𝑎𝑝𝑖𝑡𝑎𝑙
=14,129,80030,139,500
=0.47
1. Debt to total capital
, comparison with Burger King
Dec 31, 2013 Dec 31, 2012 Dec 31, 2011
McDonald’s 0.47 0.47 0.46
Burger King 169.1098 62.5214 50.3569

Long-term debt and solvency ratio (cont.)
Dec, 2011 Dec, 2012 Dec,20130
20
40
60
80
100
120
140
160
180
1.285 1.116 1.122
50.356962.5214
169.1098
McDonald'sBurger King
Long-term debt and solvency ratio (cont.)
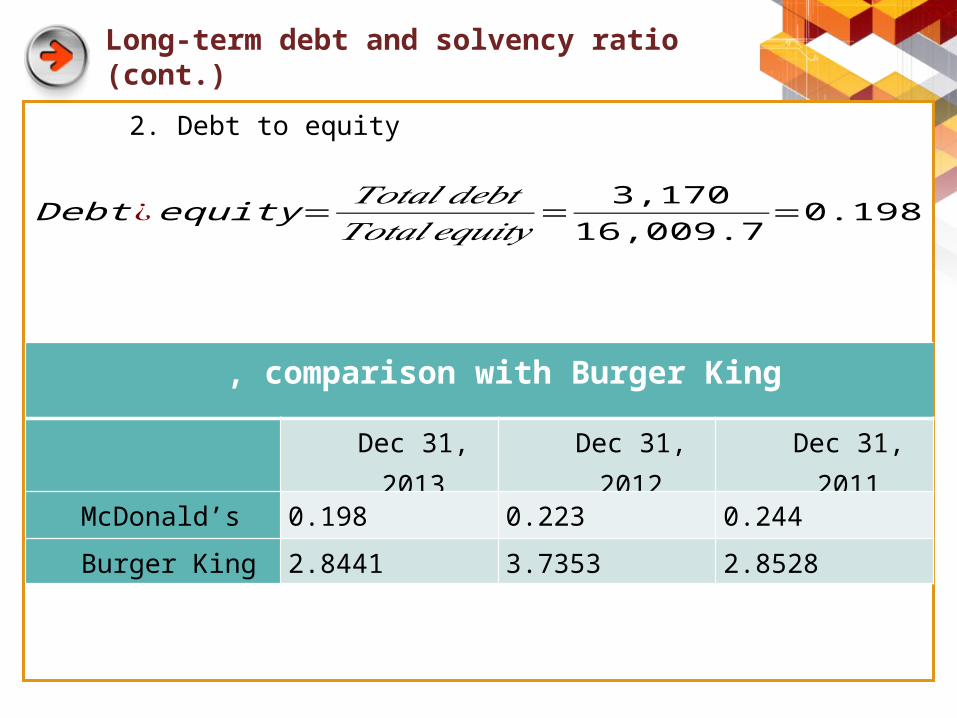
Debt ¿equity=𝑇𝑜𝑡𝑎𝑙𝑑𝑒𝑏𝑡𝑇𝑜𝑡𝑎𝑙𝑒𝑞𝑢𝑖𝑡𝑦
=3,170
16,009.7=0.198
2. Debt to equity
, comparison with Burger King
Dec 31, 2013 Dec 31, 2012 Dec 31, 2011
McDonald’s 0.198 0.223 0.244
Burger King 2.8441 3.7353 2.8528

Long-term debt and solvency ratio (cont.)
Dec, 2011 Dec, 2012 Dec,20130
0.5
1
1.5
2
2.5
3
3.5
4
McDonald'sBurger King

Long-term debt and solvency ratio (cont.)
Time interest earned=𝐸𝐵𝐼𝑇
𝐼𝑛𝑡𝑒𝑟𝑒𝑠𝑡 𝑒𝑥𝑝𝑒𝑛𝑠𝑒=
8,764.3521,900
=16.72
3. Time interest earned
, comparison with Burger King
Dec 31, 2013 Dec 31, 2012 Dec 31, 2011
McDonald’s 16.72 16.64 17.26
Burger King 2.2029 2.3744 2.9390

Long-term debt and solvency ratio (cont.)
Dec, 2011 Dec, 2012 Dec,20130
2
4
6
8
10
12
14
16
1817.3 16.64 16.72
2.939 2.3744 2.2029
McDonald'sBurger King

Long-term debt and solvency ratio (cont.)
Financial leverage=𝑡𝑜𝑡𝑎𝑙𝑎𝑠𝑠𝑒𝑡𝑠𝑡𝑜𝑡𝑎𝑙𝑒𝑞𝑢𝑖𝑡𝑦
=36,626.316,009.7
=2.2878
4. Financial leverage
comparison with Burger King
Dec 31, 2013 Dec 31, 2012 Dec 31, 2011
McDonald’s 2.2878 2.3138 2.2925
Burger King 3.8441 4.7353 3.8528

Long-term debt and solvency ratio (cont.)
Dec, 2011 Dec, 2012 Dec,20130
0.5
1
1.5
2
2.5
3
3.5
4
4.5
5
McDonald'sBurger King
Profitability ratio
Dec 31, 2013 Dec 31, 2012 Dec 31, 2011
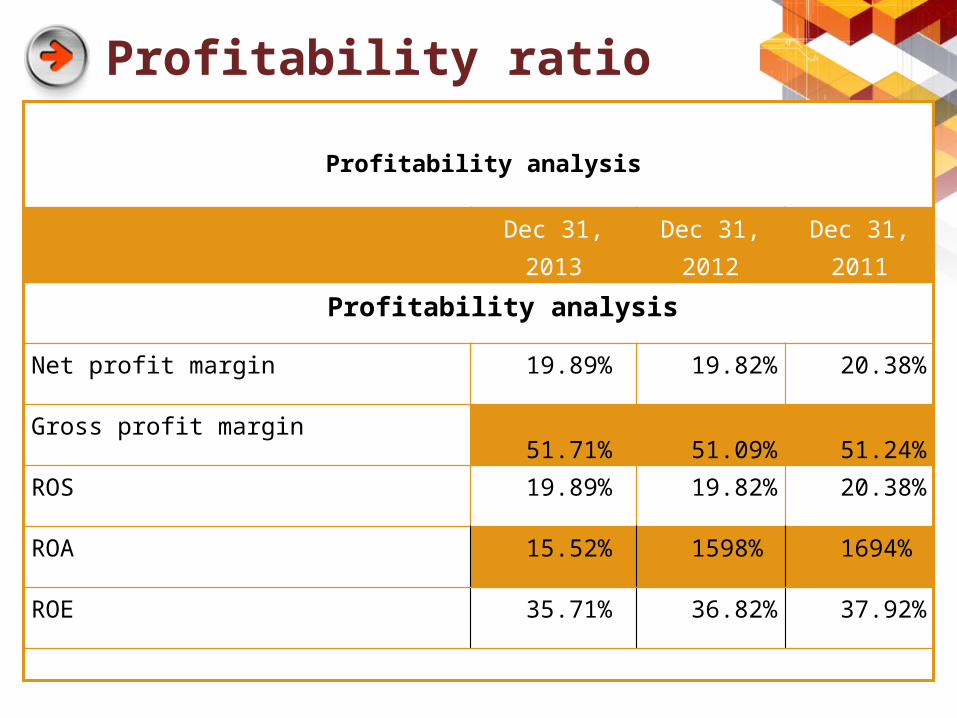
Profitability analysis
Net profit margin 19.89% 19.82% 20.38%
Gross profit margin51.71% 51.09% 51.24%
ROS 19.89% 19.82% 20.38%
ROA 15.52% 1598% 1694%
ROE 35.71% 36.82% 37.92%
Profitability analysis

Profitability ratio (cont.)
Net profit margin=𝑁𝑒𝑡 𝐼𝑛𝑐𝑜𝑚𝑒𝑅𝑒𝑣𝑒𝑛𝑢𝑒
=5,589.9
28,105.7=19.89 %
1. Net profit margin
comparison with Burger King
Dec 31, 2013 Dec 31, 2012 Dec 31, 2011
McDonald’s 19.89% 19.82% 20.38%
Burger King 20.39% 5.97% 3.77%

Profitability ratio (cont.)
Dec, 2011 Dec, 2012 Dec,20130
0.05
0.1
0.15
0.2
0.25
McDonald'sBurger King

Profitability ratio (cont.)
Gross profit margin=Gross profit𝑅𝑒𝑣𝑒𝑛𝑢𝑒
=14,534.728,105.7
=51.71 %
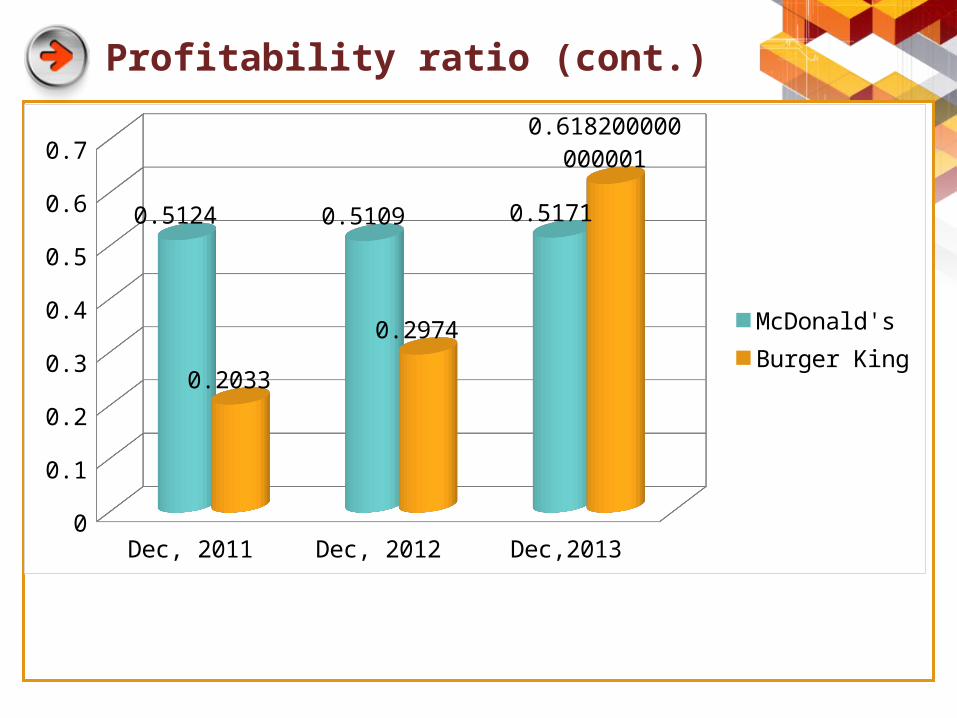
2. Gross profit margin
comparison with Burger King
Dec 31, 2013 Dec 31, 2012 Dec 31, 2011
McDonald’s 51.71% 51.09% 51.24%
Burger King 61.82% 29.74% 20.33%
Profitability ratio (cont.)
Dec, 2011 Dec, 2012 Dec,20130
0.1
0.2
0.3
0.4
0.5
0.6
0.7
0.5124 0.5109 0.5171
0.2033
0.2974
0.618200000000001
McDonald'sBurger King
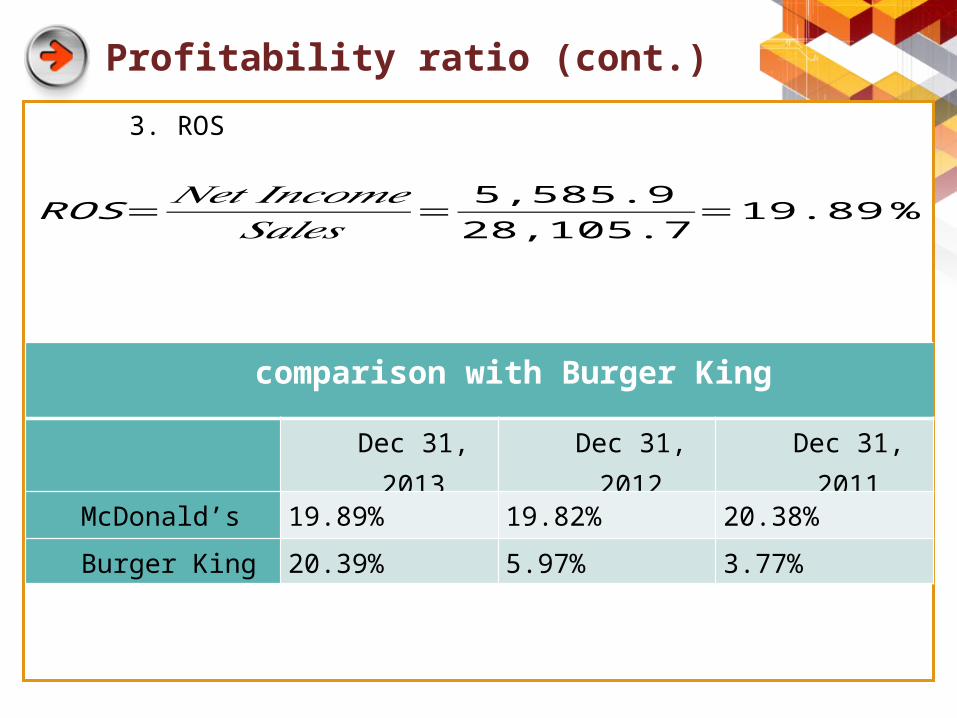
Profitability ratio (cont.)
ROS=𝑁𝑒𝑡 𝐼𝑛𝑐𝑜𝑚𝑒𝑆𝑎𝑙𝑒𝑠
=5,585.9
28,105.7=19.89 %
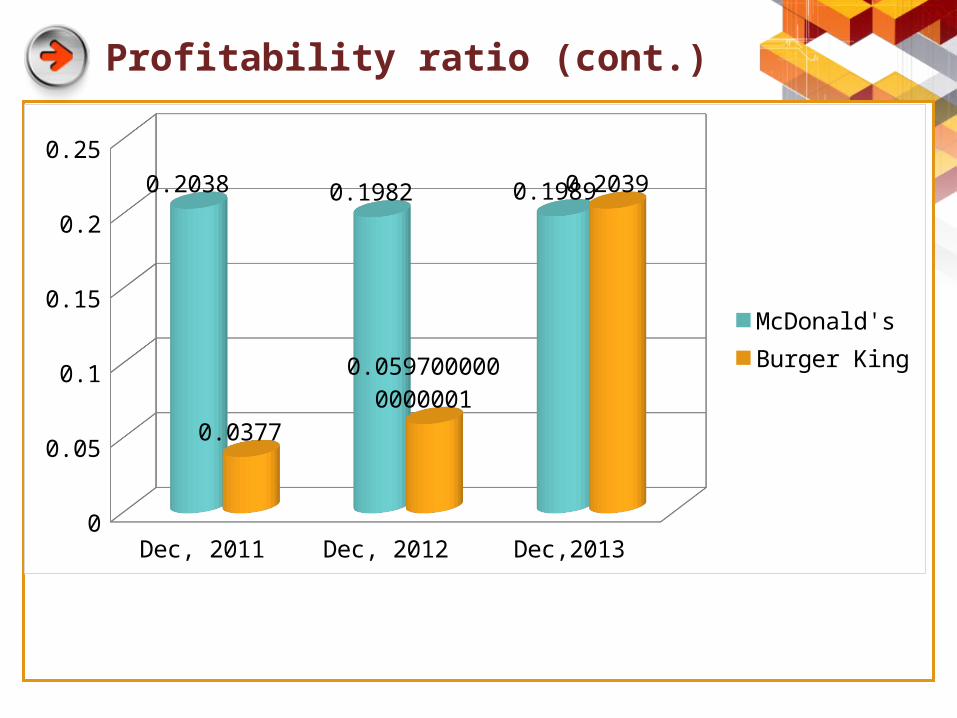
3. ROS
comparison with Burger King
Dec 31, 2013 Dec 31, 2012 Dec 31, 2011
McDonald’s 19.89% 19.82% 20.38%
Burger King 20.39% 5.97% 3.77%
Profitability ratio (cont.)
Dec, 2011 Dec, 2012 Dec,20130
0.05
0.1
0.15
0.2
0.25
0.2038 0.1982 0.1989
0.0377
0.0597000000000001
0.2039
McDonald'sBurger King

Profitability ratio (cont.)
ROA=𝑁𝑒𝑡 𝐼𝑛𝑐𝑜𝑚𝑒
𝐴𝑣𝑒𝑟𝑎𝑔𝑒𝑡𝑜𝑡𝑎𝑙𝑎𝑠𝑠𝑒𝑡𝑠=
5,589.9(36,626.3+35,386.5)/2
=15.52 %
4. ROA
comparison with Burger King
Dec 31, 2013 Dec 31, 2012 Dec 31, 2011
McDonald’s 15.52% 15.98% 16.94%
Burger King 4.10% 2.11% 1.56%

Profitability ratio (cont.)
Dec, 2011 Dec, 2012 Dec,20130.00%
2.00%
4.00%
6.00%
8.00%
10.00%
12.00%
14.00%
16.00%
18.00% 16.94%15.98% 15.52%
0.0156 0.0211
0.041
McDonald'sBurger King

Profitability ratio (cont.)
ROE=𝑁𝑒𝑡 𝐼𝑛𝑐𝑜𝑚𝑒
𝐴𝑣𝑒𝑟𝑎𝑔𝑒𝑡𝑜𝑡𝑎𝑙𝑒𝑞𝑢𝑖𝑡𝑦=
5,589.9(16,009.7+15,293.6 )/2
=0.3571
5. ROE
comparison with Burger King
Dec 31, 2013 Dec 31, 2012 Dec 31, 2011
McDonald’s 35.71% 36.82% 37.92%
Burger King 17.37% 8.97% 6.09%

Profitability ratio (cont.)
Dec, 2011 Dec, 2012 Dec,20130.00%
5.00%
10.00%
15.00%
20.00%
25.00%
30.00%
35.00%
40.00% 37.92% 36.82% 35.71%
0.0609
0.0897000000000001
0.1737 McDonald'sBurger King

Dupont
ROE = ROA x Leverage
Dec 31, 2013
35.51% 15.52% 2.2878
Dec 31, 2012
36.97% 15.98% 2.3138
Dec 31, 2011
38.83% 16.94% 2.2925
Two-component disaggregation of ROE
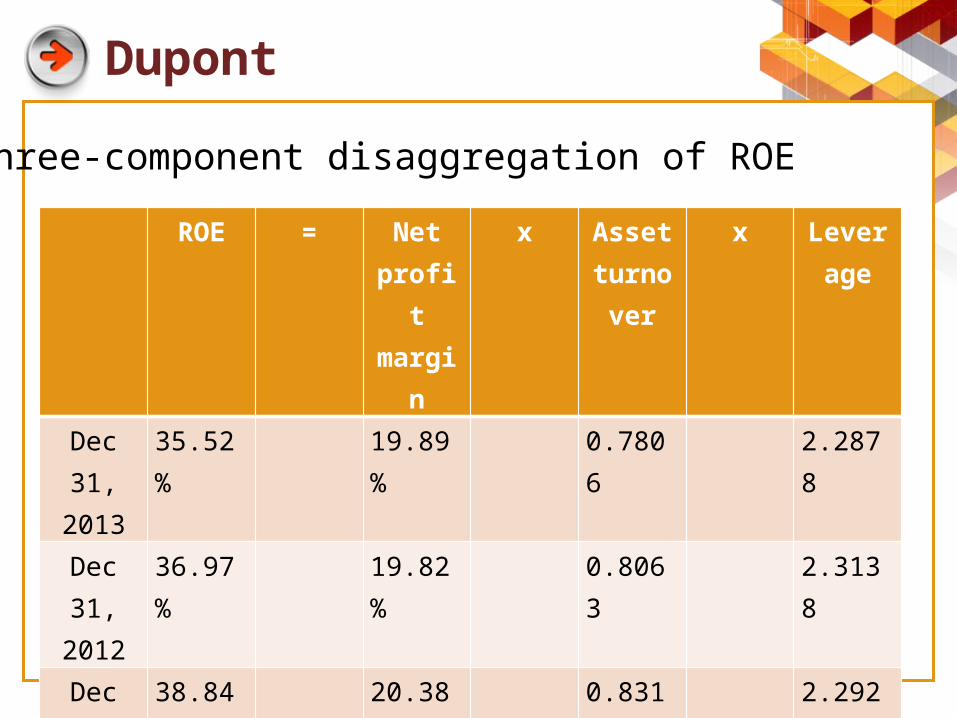
Dupont
ROE = Net profit
margin
x Asset turnov
er
x Leverage
Dec 31, 2013
35.52% 19.89% 0.7806 2.2878
Dec 31, 2012
36.97% 19.82% 0.8063 2.3138
Dec 31, 2011
38.84% 20.38% 0.8314 2.2925
Three-component disaggregation of ROE
Recommendation
The investors should concern in investing McDonald’s because:
Both of their revenue and net profit were increasing significantly with a stable growth in the future.
Strong finance situation:-use less debt in total asset-both of current ratio and quick ratio also higher
than 1-The amounts of cash reserve are also high

Conclusion
McDonald still doesn’t have competitors in fast food factor.
Most of ratios also are higher and equal to benchmark and McDonald’s have been maintained their ratios throughout from 2011 to 2013
McDonald’s should improve their Dupont ratios

Thank You!