mbp 5394 duston primary school v1 - northamptonshire
TRANSCRIPT

= j_m= jáÅÜ~Éä=jáÅÜ~Éä=jáÅÜ~Éä=jáÅÜ~Éä=_~êÅä~ó=m~êíåÉêëÜáé_~êÅä~ó=m~êíåÉêëÜáé_~êÅä~ó=m~êíåÉêëÜáé_~êÅä~ó=m~êíåÉêëÜáé===== = =
ÅçåëìäíáåÖ=ÉåÖáåÉÉêë=
= = NMRÓNMV=píê~åÇ=içåÇçå===t`Oo=M^^=
= = qqqq=MOM=TOQM=NNVN====cccc=MOM=TOQM=OOQN=
= = b =b =b =b = ä çå Ççå]ãÄé Jìâ KÅçã=
= = ïïïKãÄé Jìâ K Åçã ====
28 October 2013 jáÅÜ~Éä=_~êÅä~ó=m~êíåÉêëÜáé=iim=áë=~=iáãáíÉÇ=iá~Äáäáíó=m~êíåÉêëÜáé=êÉÖáëíÉêÉÇ=áå=båÖä~åÇ=~åÇ=t~äÉë=Ó=oÉÖ=kç=l`=PORNSQ=Ó=oÉÖáëíÉêÉÇ=~ÇÇêÉëë=NMRJNMV=píê~åÇ=içåÇçå=t`Oo=M^^
DUSTON PRIMARY SCHOOL NORTHAMPTON PRIMARY SCHOOLS EXPANSION OCTOBER 2013

MBP-5394: NORTHAMPTON SCHOOLS EXPANSION j_m=
DRAINAGE ASSESSMENTS
^ Based upon the discharge unit method from BS EN 12056 Part 2
* Based upon a 30 year return period.
PREAMBLE This report has been prepared by Michael Barclay Partnership LLP on the instructions of, and for
the sole use and benefit of, the Client. Michael Barclay Partnership LLP shall not be responsible for any use of the report or its contents for any purpose other than that for which it was prepared and provided. If the Client wishes to pass copies of the report to other parties for information, the whole of the report should be
copied. No professional liability or warranty is extended to other parties by Michael Barclay Partnership LLP as a result of permitting the report to be copied or by any other cause without
the express written agreement of Michael Barclay Partnership L LP.

MBP-5394: NORTHAMPTON SCHOOLS EXPANSION j_m=
DRAINAGE ASSESSMENTS
^ Based upon the discharge unit method from BS EN 12056 Part 2
* Based upon a 30 year return period.
CONTENTS
1 Executive Summary ............................................................................................................ 3
2 Introduction ........................................................................................................................ 4
2.1 Existing Site .................................................................................................................... 4
2.2 Development Proposals .................................................................................................... 4
2.3 Existing run-off ................................................................................................................ 5
3 Flood Risk .......................................................................................................................... 5
3.1 Flood Mechanisms ........................................................................................................... 5
3.2 Fluvial (River) Flooding ..................................................................................................... 5
3.3 Urban Drainage ................................................................................................................ 5
3.6 Flood Risk Vulnerability and Zone Compatibility .................................................................. 7
5 Drainage Strategy ............................................................................................................. 10
6 Assessment of attenuation storage requirements. ............................................................... 11
7 Conclusions ...................................................................................................................... 11
Appendix A – Proposed Development and Site Location Plan. ................................................. 14
Appendix B – Aerial Photograph of Proposed Site. .................................................................. 15
Appendix C – Topographic Survey. ....................................................................................... 17
Appendix D – Proposed Drainage Strategy Drawings. ............................................................. 18
Appendix E – Anglian Water sewer asset location plan. .......................................................... 19
Appendix F – Attenuation Calculations. ................................................................................. 20

MBP-5394: NORTHAMPTON SCHOOLS EXPANSION j_m=
DRAINAGE ASSESSMENTS
^ Based upon the discharge unit method from BS EN 12056 Part 2
* Based upon a 30 year return period.
1 EXECUTIVE SUMMARY Michael Barclay Partnership LLP has been commissioned by Architecture Initiative to carry out a
Flood Risk Assessment (FRA) on behalf of Northampton City Council for a proposed development at Duston Primary School, Northampton, NN4 8AZ. The report has been undertaken with direct reference to the National Planning Policy Framework (NPPF) and its Technical Guidance (NPPF:TG) which superseded PPS25 in March 2012. The
developer is responsible for providing a FRA, demonstrating:
• Whether any proposed development is likely to be affected by current or future flooding from any source;
• satisfying the LPA that the development is safe and where possible reduces flood risk overall;
• Whether it will increase flood risk elsewhere; and • The measures proposed to deal with these effects and risks. Any necessary flood risk
management measures should be sufficiently funded to ensure that the site can be developed and occupied safely throughout its proposed lifetime.
Furthermore Annex E states “Planning applications for development proposals of 1 hectare or greater in Flood Zone 1 and all proposals for new development located in Flood Zones 2 and 3
should be accompanied by a FRA.”
This report also makes reference to the following documents: • Level 2 Strategic Flood Risk Assessment by Scott Wilson on behalf of Northampton City
Council, dated February 2010. • Level 1 Strategic Flood Risk Assessment by Scott Wilson on behalf of West
Northamptonshire, dated August 2009. The site being considered is located in Flood Zone 1 on the Environment Agency’s indicative flood maps. Although PPS25 does not require this site to be the subject of a FRA, Northampton City Council have requested one as the site is identified in the SFRA as a site at risk of sewer flooding. This FRA will look at the site details, assess how the proposed scheme is currently at risk from flooding, specify expected flood risk on neighbouring sites in light of development, and make a recommendation on future action to be taken.

MBP-5394: NORTHAMPTON SCHOOLS EXPANSION j_m=
DRAINAGE ASSESSMENTS
^ Based upon the discharge unit method from BS EN 12056 Part 2
* Based upon a 30 year return period.
2 INTRODUCTION
2.1 Existing Site The school is located off Berrywood Road, Northampton at Grid Reference 471262, 261664. The site falls within Flood Zone 1 on the Environment Agency’s indicative flood map as shown in figure 1 below. Flood Zone 1 is defined in the NPPF:TG as “land assessed as having a less than 1 in 1,000 annual probability or river or sea flooding (<0.1%)”. All uses of land development are considered appropriate in this zone.
Figure 1: EA Indicative Flood Zone Map showing Site Location (circled) An aerial photograph of the site is provided in Appendix B showing the areas of development.
2.2 Development Proposals The proposed development consists of the construction of a new 2 storey 2FE (Form Entry) primary school within the grounds of the existing Duston School. The development also includes the extension of the existing car park to provide an additional 65 car parking spaces and 2 new hard play courts. The proposed development is shown in Appendix A.

MBP-5394: NORTHAMPTON SCHOOLS EXPANSION j_m=
DRAINAGE ASSESSMENTS
^ Based upon the discharge unit method from BS EN 12056 Part 2
* Based upon a 30 year return period.
2.3 Existing run-off Run-off from the existing school is discharged into the public sewers at 2 locations, Berrywood Road, and Alderley Close. The Anglian Water asset plan is contained in Appendix E). Flows into the sewers are restricted through the use of flow control devices. Excess flows are temporarily stored in 2 attenuation basins located within the school grounds. Both of the basins are sized to accommodate a 1 in 200 year storm event (it is unknown whether the original design for this basin included a climate change allowance – it is assumed that it did not).
3 FLOOD RISK
3.1 Flood Mechanisms This Flood Risk Assessment has considered all the possible flooding mechanisms and Table 3.1
below shows the expected risk identifying the key areas.
The site falls within Flood Zone 1. However, the potential flooding from the existing drainage systems due to increased surface water runoff is considered as part of the flood risk assessment.
Potential source Site at Risk? Reasoning
Fluvial No Site located in Flood Zone 1
Tidal/Coastal No Site located outside of the
current tidal flooding zones.
Urban Drainage No There are no known sewer
flooding incidents.
Groundwater No There are no known groundwater flooding
incidents.
Overland Flow Yes Proposed development
increases impermeable areas by 7,721m2.
Infrastructure Failure No No groundwater pumping
present/no water abstraction
Artificial Drainage No There are currently no
significant artificial water sources.
Table 3.1 - Expected Risk from Flood Mechanisms
3.2 Fluvial (River) Flooding Flooding from rivers occurs when water levels rise above bank levels causing floodwater to spread across adjacent land. As shown in Figure 1, the school is located in Flood Zone 1 and as such is unlikely to be at risk.
3.3 Urban Drainage
Sewer asset location plans have been obtained from Anglian Water and an extract is presented in Appendix E. All public sewers are located outside of the school grounds.
3.5 Flood Zones

MBP-5394: NORTHAMPTON SCHOOLS EXPANSION j_m=
DRAINAGE ASSESSMENTS
^ Based upon the discharge unit method from BS EN 12056 Part 2
* Based upon a 30 year return period.
The site falls within Flood Zone 1 on the EA’s indicative flood maps. The definitions of Flood
Zones are given in Table 3.2 below.
Zone 1 Low Probability
Land assessed as having a less than 1 in 1000 annual
probability of river or sea flooding in any
year (<0.1%).
Appropriate uses All uses of land are appropriate in this zone.
FRA requirements For development proposals on sites comprising one hectare or above the
vulnerability to flooding from other sources as well as from river and sea flooding, and the potential to increase flood risk elsewhere through the
addition of hard surfaces and the effect of the new development on surface water run-off, should be incorporated in a FRA. Policy aims In this zone, developers and local authorities should seek opportunities to reduce the overall level of flood risk in the area and beyond through
the layout and form of the development, and the appropriate application of sustainable drainage techniques.
Zone 2 Medium Probability
Land assessed as having between a 1 in 100 and 1 in 1000 annual probability of river flooding (1% – 0.1%) or between a 1 in 200 and 1 in 1000 annual probability of sea flooding (0.5% – 0.1%) in any year.
Appropriate uses The water-compatible, less vulnerable and more vulnerable uses of land and essential infrastructure in Table 3.3 are appropriate in this zone. Subject to the Sequential Test being applied, the highly vulnerable uses in Table 3.3 are only appropriate in this zone if the Exception Test is passed. FRA requirements All development proposals in this zone should be accompanied by a FRA. Policy aims In this zone, developers and local authorities should seek opportunities to reduce the overall level of flood risk in the area through the layout and form of the development, and the appropriate application of sustainable drainage techniques.
Zone 3a High Probability
Land assessed as having a 1 in 100 or greater annual probability of river flooding (>1%) or a 1 in 200 or greater annual probability of
flooding from the sea (>0.5%) in any year.
Appropriate uses The water-compatible and less vulnerable uses of land in Table 3.3 are appropriate in this zone. The highly vulnerable uses in Table 3.3 should not be permitted in this zone. The more vulnerable and essential infrastructure uses in Table 3.3 should only be permitted in this zone if the Exception Test is passed.
FRA requirements All development proposals in this zone should be accompanied by a
FRA.
Policy aims In this zone, developers and local authorities should seek opportunities to:

MBP-5394: NORTHAMPTON SCHOOLS EXPANSION j_m=
DRAINAGE ASSESSMENTS
^ Based upon the discharge unit method from BS EN 12056 Part 2
* Based upon a 30 year return period.
• reduce the overall level of flood risk in the area through the layout and form of the development and the appropriate application of sustainable drainage techniques;
• relocate existing development to land in zones with a lower probability of flooding;
• create space for flooding to occur by restoring functional floodplain and flood flow pathways and by identifying, allocating and safeguarding open space for flood storage.
Zone 3b The Functional Floodplain
Land where water has
to flow or be stored in times of flood. (Land
which would flood with an annual probability of 1 in 20 (5%) or greater in any year or is designed to flood in an extreme (0.1%) flood, or at another probability to be
agreed between the LPA and the Environment Agency, including water conveyance routes).
Appropriate uses Only the water-compatible uses and the essential infrastructure listed in Table 3.3 that has to be there should be permitted in this zone. It should
be designed and constructed to: • remain operational and safe for users in times of flood • result in no net loss of floodplain storage • not impede water flows • not increase flood risk elsewhere.
FRA requirements All development proposals in this zone should be accompanied by a FRA. Policy aims In this zone, developers and local authorities should seek opportunities
to: • reduce the overall level of flood risk in the area through the layout
and form of the development and the appropriate application of sustainable drainage techniques
• relocate existing development to land with a lower flood risk.
Table 3.2 - Flood Zones Source: NPPF:TG Table 1
3.6 Flood Risk Vulnerability and Zone Compatibility The proposed development is classified as ‘More Vulnerable’ as shown in table 3.3 below.
Essential
Infrastructure
• Essential transport infrastructure (including mass evacuation routes) which has to cross the area at risk, and strategic utility infrastructure, including electricity generating power stations and grid and primary substations.
Highly Vulnerable
• Police stations, Ambulance stations, Fire stations, Command Centres and telecommunications installations required to be operational during flooding & Emergency dispersal points;
• Basement dwellings, caravans, mobile homes and park homes intended for permanent residential use;
• Installations requiring hazardous substances consent.
More Vulnerable
• Hospitals, residential institutions such as residential care homes, children’s homes, social services homes, prisons and hostels
• Buildings used for dwelling houses; student halls of residence, drinking establishments, nightclubs and hotels.
• Non–residential uses for health services, nurseries and educational establishments

MBP-5394: NORTHAMPTON SCHOOLS EXPANSION j_m=
DRAINAGE ASSESSMENTS
^ Based upon the discharge unit method from BS EN 12056 Part 2
* Based upon a 30 year return period.
• Landfill and sites used for waste management facilities for hazardous waste.
Less Vulnerable
• Buildings used for shops, financial, professional and other services, restaurants and cafes, hot food takeaways, offices, general industry, storage and distribution and assembly and leisure.
• Land and buildings used for agriculture and forestry. • Waste treatment (except landfill and hazardous waste facilities). • Minerals working and processing (except for sand and gravel working). • Water treatment plants and sewage treatment plants (if adequate pollution control
measures are in place).
Water compatible Development
• Flood control infrastructure, water transmission infrastructure and pumping stations. • Sewage transmission infrastructure and pumping stations. • Sand and gravel workings. • Docks, marinas, wharves and navigation facilities. • MOD defence installations. • Ship building, repairing and dismantling, dockside fish processing and refrigeration and
compatible activities requiring a waterside location. • Water-based recreation (excluding sleeping accommodation). • Lifeguard and coastguard stations. • Amenity open space, nature conservation and biodiversity, outdoor sports and recreation
and essential facilities such as changing rooms. • Essential ancillary sleeping or residential accommodation for staff required by uses in this
category, subject to a specific warning and evacuation plan.
Table 3.3 - Flood Risk Vulnerability Classification
Notes:
1) This classification is based partly on DEFRA/Environment Agency research on Flood Risks to People (FD2321/TR2)1 and also on the need of some uses to keep functioning during flooding.
2) Buildings that combine a mixture of uses should be placed into the higher of the relevant classes of flood risk sensitivity. Developments that allow uses to be distributed over the site may fall within several classes of flood risk sensitivity.
3) The impact of a flood on the particular uses identified within this flood risk vulnerability classification will vary within each vulnerability class. Therefore, the flood risk management infrastructure and other risk mitigation measures needed to ensure the development is safe may differ between uses within a particular vulnerability classification.
Source: NPPF:TG Table 2
Vulnerability Classification
(see Table 3-3)
Essential Infrastructure
Water compatible
Highly Vulnerable
More Vulnerable
Less Vulnerable
Floo
d Zon
e
(see
Tab
le 3
-2)
Zone 1
Zone 2 Exception
Test
Zone 3a Exception
Test
Exception Test
Residential
Zone 3b Exception
Test
1 See www.defra.gov.uk/science/Project_Data/DocumentLibrary/FD2320_3364_TRP.pdf for further details.

MBP-5394: NORTHAMPTON SCHOOLS EXPANSION j_m=
DRAINAGE ASSESSMENTS
^ Based upon the discharge unit method from BS EN 12056 Part 2
* Based upon a 30 year return period.
Table 3.4 - Flood Risk Vulnerability and Flood Zone ‘Compatibility’
Key
� Development is appropriate.
� Development should not be permitted. Source: NPPF:TG Table 3
In summary, Table 3.2 (Flood Zones) classifies the flood zone for the site as ‘Zone 1 - Low
Probability’. The development is classified as ‘More Vulnerable’ within Table 3.3 (Flood Risk Vulnerability Classification). Therefore, from Table 3.4, the development is considered appropriate.

MBP-5394: NORTHAMPTON SCHOOLS EXPANSION j_m=
DRAINAGE ASSESSMENTS
^ Based upon the discharge unit method from BS EN 12056 Part 2
* Based upon a 30 year return period.
5 DRAINAGE STRATEGY New Primary School building and playground
The new primary school building and playground sits on an area that is currently playing field increasing impermeable areas by 3,378m2; as such this means that the run-off from that area will increase by approximately 110l/s2.
There are two options for draining the new school building…
1. A series of new soakaways constructed at least 10m from the building line. Whilst no soakaway testing has been undertaken, a SuDS GeoReport obtained from the British Geological Society (BGS) suggests that this area is “Probably compatible for infiltration SuDS” and that the depth to ground water is “…likely to be more than 5m…”. The soakaways would be sized in accordance with BRE3653 and CIRIA C6974.
2. Flows from the new school are discharged into the existing storm water drainage network. This option would require either a large increase of the discharge rate into the public sewers, or increasing the size of the attenuation tank under the new car park extension. Appendix … contains calculations to show the increase in attenuation storage that would be required.
Further investigation (soakaway tests to BRE365, and a capacity check from Anglian Water) is required to establish the most suitable option. Car Park Extension
The new car park extension is located on top of the existing storm water attenuation basin which serves the discharge into Berrywood Road. It is intended to replace the basin with an
underground tank sized to accommodate the flows up to and including the 30 year return period storms (plus a 30% addition for climate change) from, not only the existing school, but also from the new car park. The car park is to be designed to allow for storms in excess of this to be stored on the surface of the car park. The existing 450mm diameter storm pipe parallel to the tank will need to be diverted to allow sufficient room for the tank. The existing discharge rate will be
maintained with the existing Hydrobrake. A new petrol interceptor shall be installed to serve the new car park. This is shown on drawing number MBP5394-511c.
New Hard Play Courts The new hard play courts are to be constructed with a porous surface. This will enable run-off to permeate into a porous sub-base situated under the courts. This sub-base can then either act as an attenuation tank or, provided infiltration test results are suitable, it can act as an infiltration blanket with water soaking into the ground below. The existing attenuation basin will be reduced in size (where it sits under the new hard play courts) and an attenuation tank provided under the courts as compensatory volumes. This tank will also provide additional storage volumes to allow for climate change. The existing discharge rate will be maintained by moving the existing Hydrobrake flow control device from its current
2 Based upon a 30 year return period rainfall intensity of 107.2mm/hr (including a 30% allowance for climate change). 3 Building Research Establishment Booklet 365 – Soakaway Design. 4 The SUDS Manual.

MBP-5394: NORTHAMPTON SCHOOLS EXPANSION j_m=
DRAINAGE ASSESSMENTS
^ Based upon the discharge unit method from BS EN 12056 Part 2
* Based upon a 30 year return period.
position to a new manhole located outside of the marked play courts. Appendix … contains calculations to show the increase in attenuation storage that would be required. The existing storm drainage under the new courts will be amended to connect into the new tank. Existing foul drains will need to be diverted to remove the manhole under the courts and also to avoid clashing with the new tank. This is shown on drawing number MBP5394-511b.
6 ASSESSMENT OF ATTENUATION STORAGE REQUIREMENTS. The Environment Agency Policy quoted within Paragraph 7.4 of the West Northamptonshire SFRA states “for the Upper Nene catchment (that is through Northampton and within the Nene catchment upstream of Northampton), surface water attenuation should be provided up to the 1 in 200 year flood (rainfall) event plus climate change allowance”.
Attenuation Tank 1.
Attenuation tank 1 is situated on the site on an existing attenuation pond, for the 100 year storm the pond has been designed to store a volume of 858m3, based on a total catchment area of
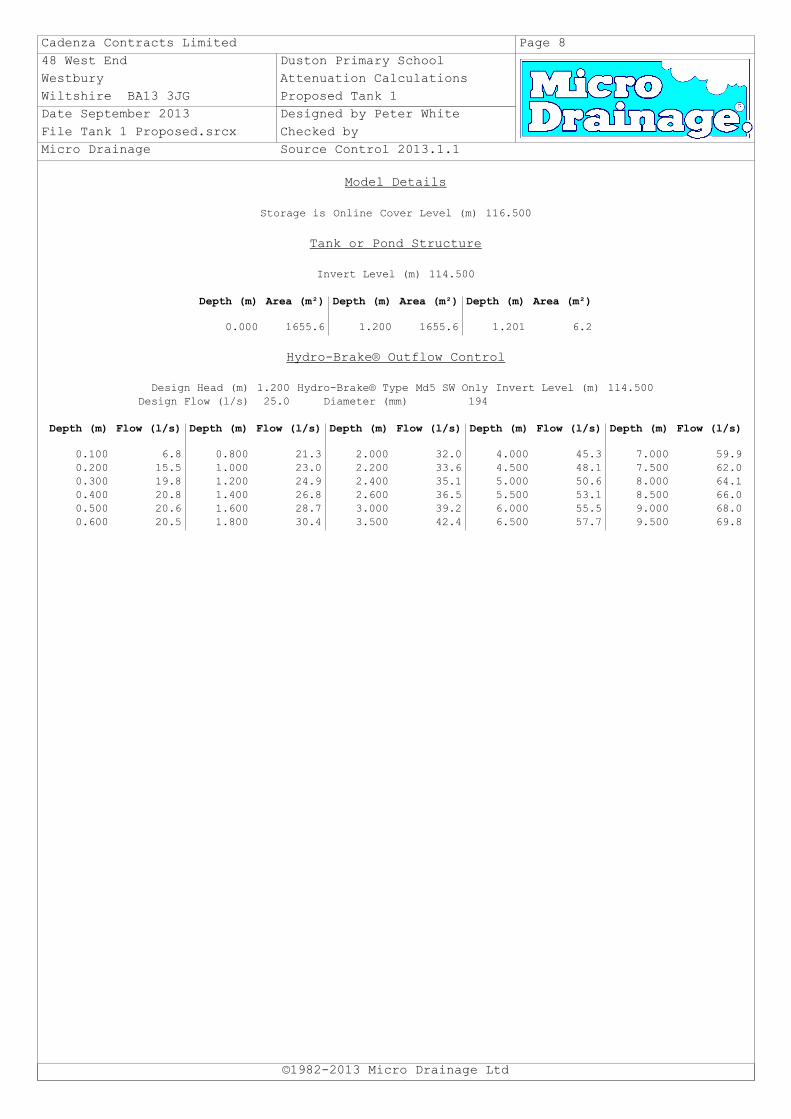
19,000m2 (1.9ha). This pond is assumed to have been designed using the FSR rainfall model with no allowance for climate change (Refer to WinDes calculations in Appendix F). The additional hard standing areas (new primary school and car park extension) equates to 4,613m2, this increases the total contributing area to 23,613m3 (2.361ha). Using the FEH rainfall model with a 30% allowance for climate change, the required storage volume increases to 1,982m3 (Refer to WinDes calculations in Appendix F). Attenuation Tank 2
Attenuation tank 2 is situated under the new play court; the play courts have a porous surface and as such will not contribute to the drainage system. This pond has been previously design to take a 200 year storage volume of 521m3. Based on an assumed total catchment area of 13,400m2 (1.340ha). Again this pond is assumed to have been designed using the FSR rainfall model with no allowance for climate change. (Refer to WinDes
calculations in Appendix F).
Although there is no increase in the contributing area the storage volumes have been re-assessed using the FEH rainfall model with a 30% allowance for climate change. This increases the
required storage volume to 966m3 (Refer to WinDes Calculations in Appendix F). Note: More accurate attenuation calculations should be undertaken at the detailed design stage which should include for the construction of a hydraulic model of the existing drainage network. 7 CONCLUSIONS The development site is located within Flood Zone 1 on the Environment Agency’s Indicative Flood Map with a low risk of flooding from fluvial sources.

MBP-5394: NORTHAMPTON SCHOOLS EXPANSION j_m=
DRAINAGE ASSESSMENTS
^ Based upon the discharge unit method from BS EN 12056 Part 2
* Based upon a 30 year return period.
However, the site has been identified in the strategic flood risk assessment as a site at risk from
sewer flooding.
The impermeable area of the site will increase by 7,721m2. The development is compliant with both the Sequential and Exception tests as set out in the NPPF:TG and therefore, it is considered, planning permission should not be refused on flood risk grounds.

MBP-5394: NORTHAMPTON SCHOOLS EXPANSION j_m=
DRAINAGE ASSESSMENTS
^ Based upon the discharge unit method from BS EN 12056 Part 2
* Based upon a 30 year return period.
APPENDIX A – PROPOSED DEVELOPMENT AND SITE LOCATION PLAN.


MBP-5394: NORTHAMPTON SCHOOLS EXPANSION j_m=
DRAINAGE ASSESSMENTS
^ Based upon the discharge unit method from BS EN 12056 Part 2
* Based upon a 30 year return period.
APPENDIX B – AERIAL PHOTOGRAPH OF PROPOSED SITE.

MBP-5394: NORTHAMPTON SCHOOLS EXPANSION j_m=
DRAINAGE ASSESSMENTS
^ Based upon the discharge unit method from BS EN 12056 Part 2
* Based upon a 30 year return period.
Copyright © GetMapping 2013

MBP-5394: NORTHAMPTON SCHOOLS EXPANSION j_m=
DRAINAGE ASSESSMENTS
^ Based upon the discharge unit method from BS EN 12056 Part 2
* Based upon a 30 year return period.
APPENDIX C – TOPOGRAPHIC SURVEY.

LP
LP
S2
49.26
49.25
49.24
49.23
50.25
50.06
49.81
49.62
49.70
49.96
50.12
50.18
50.18
50.21 50.04
50.10
50.11
50.12
50.07
49.88
49.73
49.66
49.57
49.51
49.38
49.47
49.59
49.68
49.84
49.93
50.02
49.98
50.00
50.05
50.06
50.00
49.78
49.54
49.24
49.66
49.99
49.95
49.93
49.92
49.88
49.81
49.67
49.54
49.39
49.34
49.30
49.15
49.20
49.25
49.42
49.58
49.72
49.76
49.73
49.83
49.83
49.81
49.58
49.55
49.72
49.69
49.66
49.63
49.52
49.42
49.25
49.15
49.07
48.91
48.83
48.68
48.80
48.87
49.03
49.17
49.26
49.36
49.46
49.50
49.52
49.52
t2
Grass
Grass
GrassGrass
Grass
Grass
Grass
Tarmac
W/M 1.8m
LP
LP
LP
LP
LP
SP
SP
SPSP
SP
PO
GY
DP
DP
LPB
LPB
LPB
LPB
CAM
S2
S1
50.00
49.26
49.25
49.24
49.23
49.22
49.25
49.24
49.31
49.31
49.29
49.31
49.29
49.27
49.45
49.32
49.34
50.42
50.37
50.40
50.43
50.51
50.36
50.25
50.06
49.81
49.62
49.70
49.96
50.12
50.18
50.18
50.21
50.11
50.24
50.21
50.21
50.27
50.22
50.02
50.06
50.02
50.07
50.17
50.13
50.04
50.10
50.11
50.12
50.07
49.88
49.73
49.66
49.57
49.51
49.38
49.47
49.59
49.68
49.84
49.93
50.02
49.98
50.00
50.05
50.06
50.00
49.97
49.94
49.95
49.88
49.77
49.93
49.92
49.78
49.54
49.24
49.28
49.34
49.39
49.40
49.38
49.73
50.11
50.49
49.66
49.99
49.95
49.93
49.92
49.88
49.81
49.67
49.54
49.39
49.34
49.30
49.15
49.20
49.25
49.42
49.58
49.72
49.76
49.73
49.83
49.83
49.81
49.58
49.55
49.72
49.69
49.66
49.63
49.52
49.42
49.25
49.15
49.07
48.91
48.83
48.68
48.80
48.87
49.03
49.17
49.26
49.36
49.46
49.50
49.52
49.52
49.18
49.17
49.30
49.4549.46
49.64
50.38
50.36
50.36
49.74
49.47
49.24
49.25
49.3849.38
49.36
49.20
49.25
49.55
49.78
49.45
49.29
49.29
49.29
49.86
t1
t2
s3
Grass
Grass
Grass
GrassGrass
Grass
Grass
Grass
Grass
Tarmac
Tarmac
Tarmac
Tarmac
Tarmac
Tarmac
W/M 1.8m
W/M 1.8m
W/M 1.8m
W/M
1.8
m
W/M
1.8m
Grass
Grass
Grass
Northampton Schools
Duston School
Topographical Survey
KF RB AB
Survey
633_001 /
Mantra Services Limited15 St Johns Way Piddington Northampton NN7 2DL
Tel: 0845 3884241 Fax: 01604 [email protected]
Notes
1. This drawing is to be read in conjunction with all relevant specifications, service providers record drawings, RICS Surveys of Land, Buildings and Utility Surveys at Scales of 1:500 and Larger and the surveyors report
2. All dimensions to be checked on site prior to commencement of works
3. Exact location and setting out to be agreed on site
4. Do not scale fron this drawing
AB - Anchor BlockAG - Above GroundBH - BoreholeBN - BinBO - BollardBT - British TelecomCC - Security CameraCL - Cable LevelCT - Cable TV PointEL - Eaves LevelEJ - Expansion JointEP - Electricity PoleFH - Fire HydrantFL - Floor LevelFP - Fence/Gate PostGP - Gate PostGV - Gas ValveGY - GulleyIB - Illuminated BollardIC - Inspection ChamberIL - Invert LevelIM - Incoming MainIP - Small PostLP - Lamp ColumnMH - ManholeMP - Marker PostOH - Overhead CablePB - Post BoxPL - PilePO - PostRE - Rodding EyeRL - Ridge LevelP/B - Pedestrian BarrierC/L - Chainlink FenceC/B - Close Board FenceP/L - Pallisade FenceO/F - Open Wooden FenceW/M - Weld Mesh Fence
Tree
Gate
Inspection Chamber
Inspection Chamber
50.29 Spot Level
Control Box
Inspection Chamber
S - StepsSL - Soffit LevelSP - Sign PostST - Steel StancionSV - Stop ValveSY - Stay WireTH - Trial HoleTS - Traffic SignalTV - Cable TVTW - Top of WallWL - Water LevelWO - Wash Out(A) - Assumed LineBOC - Bank of Cablesd/u - Depth UnknownEMP - Electricity Marker PostElec - ElectricityEOT - End of trace (loss of reading)GAS - GasGMP - Gas Marker PostHEG - Top of HedgeP - PostPBC - Push Button Control(R) - Utility From RecordsRWP - Down PipeSFT - Soffit LevelSTU - StumpSVP - Soil & Vent PipeTPB - Telephone BoxTPO - Tree Preservation OrderUTS - Unable to SurveyUTT - Unable to TraceUTL - Unable to LiftWat - WaterS/B - Safety BarrierCBL - Concrete BlockSC - Steel Column

FW1
FW2
FW3
FW4
FW5
FW6
FW7
FW8
FW13
Existing foul chamber.
Approx. 2.25m deep.
FW12
FW11
FW10
FW9
Grease trap
SW2
Soakaway
SW1
Soakaway
Rainwater pipe to
supply water to
Habitat pond.
1
0
0
Ø
Gullies relocated to
suit new layout.
Existing pipework
to be retained.
Mic
hael
Bar
clay
Par
tner
ship
T 0
20 7
240
1191
F
020
724
0 22
41
ww
w.m
bp-u
k.co
m
105-
109
Str
and
cons
ulti
ng e
ngin
eers
Lon
don
WC
2R 0
AA
E lo
ndon
@m
bp-u
k.co
m
Job
Sca
leD
ate
By
Che
cked
Sta
tus
Tit
le
Dra
win
g N
umbe
rR
evis
ion
Rev
Dat
eB
yD
escr
ipti
on
Copyright
Mic
hael Barc
lay P
art
ners
hip
C
A
ll r
ights
described in c
hapte
r IV
of
the C
opyright
Desig
ns a
nd P
ate
nts
Act
1988 h
ave b
een g
enera
lly a
ssert
ed.
INF 1
OC
T 1
2FO
R IN
FO
RM
ATIO
NM
B
DU
ST
ON
P
RIM
AR
Y S
CH
OO
L
BE
RR
YW
OO
D R
OA
D
DR
AIN
AG
E S
TR
AT
EG
Y P
LA
N
NE
W S
CH
OO
L +
A
ME
ND
ED
C
AR
P
AR
K
1:500
JU
L 13
PT
W
5394/511a

MBP-5394: NORTHAMPTON SCHOOLS EXPANSION j_m=
DRAINAGE ASSESSMENTS
^ Based upon the discharge unit method from BS EN 12056 Part 2
* Based upon a 30 year return period.
APPENDIX D – PROPOSED DRAINAGE STRATEGY DRAWINGS.
MBP5394-511a – Strategy for new building and playground
MBP5394-511b – Strategy for new hard play courts
MBP5394-511c – Strategy for car park extension
MBP5394-511d – Additional impermeable areas

FW1
FW2
FW3
FW4
FW5
FW6
FW7
FW8
FW13
Existing foul chamber.
Approx. 2.25m deep.
FW12
FW11
FW10
FW9
Grease trap
SW2
Soakaway
SW1
Soakaway
Rainwater pipe to
supply water to
Habitat pond.
1
0
0
Ø
Gullies relocated to
suit new layout.
Existing pipework
to be retained.
Mic
hael
Bar
clay
Par
tner
ship
T 0
20 7
240
1191
F
020
724
0 22
41
ww
w.m
bp-u
k.co
m
105-
109
Str
and
cons
ulti
ng e
ngin
eers
Lon
don
WC
2R 0
AA
E lo
ndon
@m
bp-u
k.co
m
Job
Sca
leD
ate
By
Che
cked
Sta
tus
Tit
le
Dra
win
g N
umbe
rR
evis
ion
Rev
Dat
eB
yD
escr
ipti
on
Copyright
Mic
hael Barc
lay P
art
ners
hip
C
A
ll r
ights
described in c
hapte
r IV
of
the C
opyright
Desig
ns a
nd P
ate
nts
Act
1988 h
ave b
een g
enera
lly a
ssert
ed.
INF 1
OC
T 1
2FO
R IN
FO
RM
ATIO
NM
B
DU
ST
ON
P
RIM
AR
Y S
CH
OO
L
BE
RR
YW
OO
D R
OA
D
DR
AIN
AG
E S
TR
AT
EG
Y P
LA
N
NE
W S
CH
OO
L +
A
ME
ND
ED
C
AR
P
AR
K
1:500
JU
L 13
PT
W
5394/511a

EXISTING HARD COURT
EXISTING MUGA
Existing headwall to be broken out.
Existing pipe connected to new
vented off-line attenuation tank.
Existing Hydrobrake
transferred to new manhole.
Existing storm
manholes and
pipework to be
abandoned.
Existing foul manhole to be
abandoned. Extend existing
150Ø pipe to new manhole.
FW14
Attenuation Tank 2
F
A
L
L
F
A
L
L
2
2
5
Ø
SW10
SW8
SW9
SW11
2
2
5
Ø
3
0
0
Ø
2
2
5
Ø
3
0
0
Ø
L
i
n
e
a
r
D
r
a
i
n
a
g
e
C
h
a
n
n
e
l
Mic
hael
Bar
clay
Par
tner
ship
T 0
20 7
240
1191
F
020
724
0 22
41
ww
w.m
bp-u
k.co
m
105-
109
Str
and
cons
ulti
ng e
ngin
eers
Lon
don
WC
2R 0
AA
E lo
ndon
@m
bp-u
k.co
m
Job
Sca
leD
ate
By
Che
cked
Sta
tus
Tit
le
Dra
win
g N
umbe
rR
evis
ion
Rev
Dat
eB
yD
escr
ipti
on
Copyright
Mic
hael Barc
lay P
art
ners
hip
C
A
ll r
ights
described in c
hapte
r IV
of
the C
opyright
Desig
ns a
nd P
ate
nts
Act
1988 h
ave b
een g
enera
lly a
ssert
ed.
INF 1
OC
T 1
2FO
R IN
FO
RM
ATIO
NM
B
DU
ST
ON
P
RIM
AR
Y S
CH
OO
L
BE
RR
YW
OO
D R
OA
D
DR
AIN
AG
E S
TR
AT
EG
Y P
LA
N
PR
OP
OS
ED
C
AR
P
AR
K
1:500
JU
L 13
PT
W
5394/511b

EXISTING MUGA
CAR PARK
EXISTING
CAR PARK
EXISTING
EXTENDED CAR PARK
Attenuation Tank 1
D
i
v
e
r
t
e
d
4
5
0
m
m
Ø
SW4
SW6
SW3
SW5
SW7
Petrol Interceptor
Existing headwall to be broken out.
Existing pipe connected to new
vented off-line attenuation tank.
1
5
0
Ø
Car park to be constructed in such a
way as to provide additional surface
storage during extreme rainfall events.
Mic
hael
Bar
clay
Par
tner
ship
T 0
20 7
240
1191
F
020
724
0 22
41
ww
w.m
bp-u
k.co
m
105-
109
Str
and
cons
ulti
ng e
ngin
eers
Lon
don
WC
2R 0
AA
E lo
ndon
@m
bp-u
k.co
m
Job
Sca
leD
ate
By
Che
cked
Sta
tus
Tit
le
Dra
win
g N
umbe
rR
evis
ion
Rev
Dat
eB
yD
escr
ipti
on
Copyright
Mic
hael Barc
lay P
art
ners
hip
C
A
ll r
ights
described in c
hapte
r IV
of
the C
opyright
Desig
ns a
nd P
ate
nts
Act
1988 h
ave b
een g
enera
lly a
ssert
ed.
INF 1
OC
T 1
2FO
R IN
FO
RM
ATIO
NM
B
DU
ST
ON
P
RIM
AR
Y S
CH
OO
L
BE
RR
YW
OO
D R
OA
D
DR
AIN
AG
E S
TR
AT
EG
Y P
LA
N
CA
R P
AR
K E
XT
EN
SIO
N
1:500
JU
L 13
PT
W
5394/511c

MBP-5394: NORTHAMPTON SCHOOLS EXPANSION j_m=
DRAINAGE ASSESSMENTS
^ Based upon the discharge unit method from BS EN 12056 Part 2
* Based upon a 30 year return period.
APPENDIX E – ANGLIAN WATER SEWER ASSET LOCATION PLAN.

This plan is provided by Anglian Water pursuant its obligations under the Water Industry Act 1991 sections 198 or 199. It must be used in conjunction with any search results attached. The information on this plan is based on data currently recorded but position must be regarded as approximate. Service pipes, private sewers and drains are generally not shown. Users of this map are strongly advised to commission their own survey of the area shown on the plan before carrying out any works. The actual position of all apparatus MUST be established by trial holes. No liability whatsoever, including liability for negligence, is accepted by Anglian Water for any error or inaccuracy or omission, including the failure to accurately record, or record at all, the location of any water main, discharge pipe, sewer or disposal main or any item of apparatus. This information is valid for the date printed. The plan is produced by Anglian Water Services Limited from Ordnance Survey © Crown Copyright, 100018507. This map is to be used for the purposes of viewing the location of Anglian Water plant only. Any other uses of the map data or further copies is not permitted. This notice is not intended to exclude or restrict liability for death or personal injury resulting from negligence.
Pumping Station
Manhole
Inlet
Outfall
Sewage Treatment Works
Foul Sewer
Final Effluent
Decommissioned Sewer
(Colour denotes effluent type)
(Colour denotes effluent type)
Surface Sewer
Combined Sewer(Colour denotes effluent type)
(Colour denotes effluent type)
(Colour denotes effluent type)
Date: 29/06/13 Scale: 1:1250 Data updated: 01/04/13Map Centre: 471262,261664Ordnance Survey Mapping © Crown Copyright 1000018507 Wastewater Plan A2Our Ref: 65590 - 1
Duston School
Rising Main
Private Sewer(Colour denotes effluent type)

Manhole Reference Liquid Type Cover Level Invert Level Depth to Invert
0800 F 115.416 113.276 2.14
0801 F 114.996 113.581 1.415
2400 F 118.852 116.011 2.841
2401 F 119.012 116.112 2.9
2404 F 118.318 115.638 2.68
2500 F 118.838 116.185 2.653
3400 F 117.805 115.236 2.569
3402 F 118.078 115.435 2.643
3500 F 118.609 116.289 2.32
3801 F - 113.439 -
4401 F 114.91 112.83 2.08
449A F - - -
449B F - - -
4701 F - 113.129 -
4702 F - 112.69 -
5501 F - 108.966 -
5701 F - 110.794 -
5702 F - 110.947 -
5703 F - 111.252 -
5704 F - 111.556 -
5801 F - - -
6802 F - - -
9401 F 115.338 - -
9402 F 115.085 - -
9402 F 116.358 - -
9500 F 116.282 - -
9501 F 116.282 - -
9503 F 117.798 - -
9504 F 116.818 - -
9600 F 117.575 - -
9601 F 117.67 - -
9602 F 118.003 - -
9803 F 114.116 111.436 2.68
9804 F 114.981 112.941 2.04
9807 F 114.953 112.978 1.975
0851 S 115.06 114.04 1.02
0852 S 115.076 113.911 1.165
0853 S 115.46 113.76 1.7
1651 S 119.58 119.1 0.48
2451 S 118.345 115.872 2.473
2452 S 118.849 116.167 2.682
2455 S 119.075 116.387 2.688
2551 S 118.838 116.689 2.149
2552 S 118.665 117.113 1.552
2553 S 119.503 117.695 1.808
3451 S - - -
3452 S - - -
3454 S 117.748 115.432 2.316
3551 S 118.285 117.575 0.71
3552 S 118.69 116.782 1.908
3851 S - 112.46 -
4451 S 114.196 112.96 1.236
4452 S 114.925 113.76 1.165
4453 S 112.569 111.833 0.736
4751 S - 112.843 -
4851 S - 113.156 -
5451 S 111.71 110.17 1.54
5551 S - 109.27 -
5552 S - 111.306 -
5553 S - 109.77 -
5651 S - 112.775 -
5751 S - 111.252 -
5752 S - 111.556 -
5753 S - 111.861 -
5754 S - 111.09 -
5851 S - - -
6752 S - 113.385 -
6852 S - - -
9404 S - - -
9451 S 115.308 - -
9452 S 116.214 - -
Manhole Reference Liquid Type Cover Level Invert Level Depth to Invert
Manhole Reference Liquid Type Cover Level Invert Level Depth to Invert
9453 S 115.205 - -
9550 S 117.723 - -
9551 S 116.407 - -
9552 S 117.107 - -
9552 S 116.646 - -
9553 S 116.725 - -
9554 S 117.517 - -
9650 S 117.689 - -
9651 S 118.011 - -
9652 S 118.123 - -
9854 S 114.961 113.341 1.62
9856 S - - -
9858 S 114.944 113.454 1.49
Manhole Reference Liquid Type Cover Level Invert Level Depth to Invert
Our Ref: 65590 - 1

MBP-5394: NORTHAMPTON SCHOOLS EXPANSION j_m=
DRAINAGE ASSESSMENTS
^ Based upon the discharge unit method from BS EN 12056 Part 2
* Based upon a 30 year return period.
APPENDIX F – ATTENUATION CALCULATIONS.

Cadenza Contracts Limited Page 1
48 West End Duston Primary School
Westbury Attenuation Calculations
Wiltshire BA13 3JG Existing Pond 1
Date September 2013 Designed by Peter White
File Pond 1 Existing.srcx Checked by
Micro Drainage Source Control 2013.1.1
Summary of Results for 200 year Return Period
©1982-2013 Micro Drainage Ltd
Storm
Event
Max
Level
(m)
Max
Depth
(m)
Max
Control
(l/s)
Max
Volume
(m³)
Status
30 min Summer 115.515 1.015 22.7 543.0 O K60 min Summer 115.601 1.101 23.7 639.9 O K120 min Summer 115.651 1.151 24.2 701.9 O K180 min Summer 115.657 1.157 24.2 709.5 O K240 min Summer 115.647 1.147 24.1 697.0 O K360 min Summer 115.625 1.125 23.9 669.4 O K480 min Summer 115.603 1.103 23.7 642.6 O K600 min Summer 115.580 1.080 23.4 615.5 O K720 min Summer 115.557 1.057 23.2 588.8 O K960 min Summer 115.512 1.012 22.7 539.1 O K1440 min Summer 115.428 0.928 21.8 453.9 O K2160 min Summer 115.315 0.815 20.5 353.4 O K2880 min Summer 115.216 0.716 19.2 277.6 O K4320 min Summer 115.055 0.555 17.0 177.5 O K5760 min Summer 114.935 0.435 15.1 118.7 O K7200 min Summer 114.847 0.347 13.5 84.1 O K8640 min Summer 114.786 0.286 12.2 63.4 O K10080 min Summer 114.746 0.246 11.1 51.5 O K
30 min Winter 115.576 1.076 23.4 611.3 O K60 min Winter 115.668 1.168 24.4 723.2 O K120 min Winter 115.725 1.225 24.9 799.6 O K180 min Winter 115.736 1.236 25.0 815.3 O K240 min Winter 115.730 1.230 25.0 807.0 O K360 min Winter 115.703 1.203 24.7 769.9 O K480 min Winter 115.678 1.178 24.5 736.7 O K600 min Winter 115.650 1.150 24.2 700.8 O K720 min Winter 115.621 1.121 23.9 664.2 O K
Storm
Event
Rain
(mm/hr)
Flooded
Volume
(m³)
Discharge
Volume
(m³)
Time-Peak
(mins)
30 min Summer 80.635 0.0 574.5 3360 min Summer 49.372 0.0 703.5 62120 min Summer 29.132 0.0 830.3 122180 min Summer 21.101 0.0 902.0 180240 min Summer 16.684 0.0 951.0 220360 min Summer 11.954 0.0 1022.0 278480 min Summer 9.437 0.0 1075.8 342600 min Summer 7.850 0.0 1118.6 410720 min Summer 6.751 0.0 1154.4 478960 min Summer 5.317 0.0 1212.3 6141440 min Summer 3.793 0.0 1297.0 8802160 min Summer 2.701 0.0 1385.5 12562880 min Summer 2.121 0.0 1450.7 16204320 min Summer 1.507 0.0 1545.8 23365760 min Summer 1.181 0.0 1615.5 30487200 min Summer 0.977 0.0 1670.9 37448640 min Summer 0.837 0.0 1717.0 441610080 min Summer 0.734 0.0 1756.6 5144
30 min Winter 80.635 0.0 643.4 3360 min Winter 49.372 0.0 788.0 62120 min Winter 29.132 0.0 929.9 120180 min Winter 21.101 0.0 1010.3 176240 min Winter 16.684 0.0 1065.1 230360 min Winter 11.954 0.0 1144.7 294480 min Winter 9.437 0.0 1204.9 366600 min Winter 7.850 0.0 1252.9 444720 min Winter 6.751 0.0 1292.9 520

Cadenza Contracts Limited Page 2
48 West End Duston Primary School
Westbury Attenuation Calculations
Wiltshire BA13 3JG Existing Pond 1
Date September 2013 Designed by Peter White
File Pond 1 Existing.srcx Checked by
Micro Drainage Source Control 2013.1.1
Summary of Results for 200 year Return Period
©1982-2013 Micro Drainage Ltd
Storm
Event
Max
Level
(m)
Max
Depth
(m)
Max
Control
(l/s)
Max
Volume
(m³)
Status
960 min Winter 115.561 1.061 23.2 593.5 O K1440 min Winter 115.445 0.945 22.0 470.7 O K2160 min Winter 115.287 0.787 20.1 331.3 O K2880 min Winter 115.151 0.651 18.4 234.0 O K4320 min Winter 114.942 0.442 15.2 121.9 O K5760 min Winter 114.808 0.308 12.7 70.6 O K7200 min Winter 114.739 0.239 10.8 49.4 O K8640 min Winter 114.701 0.201 9.3 39.2 O K10080 min Winter 114.676 0.176 8.2 32.9 O K
Storm
Event
Rain
(mm/hr)
Flooded
Volume
(m³)
Discharge
Volume
(m³)
Time-Peak
(mins)
960 min Winter 5.317 0.0 1357.8 6641440 min Winter 3.793 0.0 1452.7 9402160 min Winter 2.701 0.0 1551.9 13242880 min Winter 2.121 0.0 1624.8 17004320 min Winter 1.507 0.0 1731.3 23805760 min Winter 1.181 0.0 1809.4 30567200 min Winter 0.977 0.0 1871.4 36808640 min Winter 0.837 0.0 1923.0 440810080 min Winter 0.734 0.0 1967.3 5136

Cadenza Contracts Limited Page 3
48 West End Duston Primary School
Westbury Attenuation Calculations
Wiltshire BA13 3JG Existing Pond 1
Date September 2013 Designed by Peter White
File Pond 1 Existing.srcx Checked by
Micro Drainage Source Control 2013.1.1
Rainfall Details
©1982-2013 Micro Drainage Ltd
Rainfall Model FSR Winter Storms YesReturn Period (years) 200 Cv (Summer) 0.750
Region England and Wales Cv (Winter) 0.840M5-60 (mm) 20.800 Shortest Storm (mins) 30
Ratio R 0.450 Longest Storm (mins) 10080Summer Storms Yes Climate Change % +0
Time Area Diagram
Total Area (ha) 1.900
Time
From:
(mins)
To:
Area
(ha)
0 4 1.900

Cadenza Contracts Limited Page 4
48 West End Duston Primary School
Westbury Attenuation Calculations
Wiltshire BA13 3JG Existing Pond 1
Date September 2013 Designed by Peter White
File Pond 1 Existing.srcx Checked by
Micro Drainage Source Control 2013.1.1
Model Details
©1982-2013 Micro Drainage Ltd
Storage is Online Cover Level (m) 116.500
Tank or Pond Structure
Invert Level (m) 114.500
Depth (m) Area (m²) Depth (m) Area (m²)
0.000 140.1 2.000 2824.4
Hydro-Brake® Outflow Control
Design Head (m) 1.220 Hydro-Brake® Type Md11 Invert Level (m) 114.500Design Flow (l/s) 25.0 Diameter (mm) 197
Depth (m) Flow (l/s) Depth (m) Flow (l/s) Depth (m) Flow (l/s) Depth (m) Flow (l/s) Depth (m) Flow (l/s)
0.100 4.5 0.800 20.3 2.000 31.7 4.000 44.8 7.000 59.30.200 9.3 1.000 22.6 2.200 33.3 4.500 47.5 7.500 61.40.300 12.6 1.200 24.7 2.400 34.7 5.000 50.1 8.000 63.40.400 14.5 1.400 26.6 2.600 36.1 5.500 52.6 8.500 65.30.500 16.2 1.600 28.4 3.000 38.8 6.000 54.9 9.000 67.20.600 17.7 1.800 30.1 3.500 41.9 6.500 57.1 9.500 69.1

Cadenza Contracts Limited Page 5
48 West End Duston Primary School
Westbury Attenuation Calculations
Wiltshire BA13 3JG Proposed Tank 1
Date September 2013 Designed by Peter White
File Tank 1 Proposed.srcx Checked by
Micro Drainage Source Control 2013.1.1
Summary of Results for 200 year Return Period (+30%)
©1982-2013 Micro Drainage Ltd
Storm
Event
Max
Level
(m)
Max
Depth
(m)
Max
Control
(l/s)
Max
Volume
(m³)
Status
30 min Summer 115.281 0.781 21.2 1293.4 O K60 min Summer 115.373 0.873 21.9 1446.1 O K120 min Summer 115.463 0.963 22.7 1593.9 O K180 min Summer 115.508 1.008 23.1 1668.1 O K240 min Summer 115.532 1.032 23.3 1709.0 O K360 min Summer 115.551 1.051 23.5 1739.9 O K480 min Summer 115.548 1.048 23.5 1734.8 O K600 min Summer 115.535 1.035 23.4 1714.1 O K720 min Summer 115.523 1.023 23.2 1694.2 O K960 min Summer 115.483 0.983 22.9 1627.6 O K1440 min Summer 115.409 0.909 22.2 1505.4 O K2160 min Summer 115.307 0.807 21.4 1336.1 O K2880 min Summer 115.215 0.715 20.8 1183.2 O K4320 min Summer 115.052 0.552 20.8 914.6 O K5760 min Summer 114.927 0.427 20.8 707.3 O K7200 min Summer 114.843 0.343 20.5 568.3 O K8640 min Summer 114.788 0.288 19.5 477.3 O K10080 min Summer 114.750 0.250 18.3 414.5 O K
30 min Winter 115.376 0.876 21.9 1450.9 O K60 min Winter 115.481 0.981 22.9 1623.8 O K120 min Winter 115.583 1.083 23.8 1793.6 O K180 min Winter 115.636 1.136 24.3 1881.1 O K240 min Winter 115.667 1.167 24.6 1931.5 O K360 min Winter 115.694 1.194 24.9 1976.4 O K480 min Winter 115.697 1.197 24.9 1981.7 O K600 min Winter 115.687 1.187 24.8 1965.9 O K720 min Winter 115.670 1.170 24.7 1937.8 O K
Storm
Event
Rain
(mm/hr)
Flooded
Volume
(m³)
Discharge
Volume
(m³)
Time-Peak
(mins)
30 min Summer 149.243 0.0 1242.4 3460 min Summer 84.790 0.0 1482.7 64120 min Summer 48.172 0.0 1684.6 122180 min Summer 34.607 0.0 1814.9 182240 min Summer 27.368 0.0 1913.1 242360 min Summer 19.661 0.0 2060.0 360480 min Summer 15.549 0.0 2170.1 480600 min Summer 12.961 0.0 2258.9 548720 min Summer 11.170 0.0 2333.2 600960 min Summer 8.720 0.0 2422.0 7221440 min Summer 6.151 0.0 2541.1 9822160 min Summer 4.339 0.0 2757.1 13882880 min Summer 3.387 0.0 2868.4 17924320 min Summer 2.382 0.0 3016.4 25525760 min Summer 1.855 0.0 3150.3 32407200 min Summer 1.528 0.0 3242.6 39608640 min Summer 1.304 0.0 3318.3 459210080 min Summer 1.141 0.0 3378.0 5336
30 min Winter 149.243 0.0 1381.0 3360 min Winter 84.790 0.0 1660.8 62120 min Winter 48.172 0.0 1886.7 120180 min Winter 34.607 0.0 2032.2 180240 min Winter 27.368 0.0 2141.9 238360 min Winter 19.661 0.0 2305.6 352480 min Winter 15.549 0.0 2428.2 464600 min Winter 12.961 0.0 2526.5 572720 min Winter 11.170 0.0 2608.6 672

Cadenza Contracts Limited Page 6
48 West End Duston Primary School
Westbury Attenuation Calculations
Wiltshire BA13 3JG Proposed Tank 1
Date September 2013 Designed by Peter White
File Tank 1 Proposed.srcx Checked by
Micro Drainage Source Control 2013.1.1
Summary of Results for 200 year Return Period (+30%)
©1982-2013 Micro Drainage Ltd
Storm
Event
Max
Level
(m)
Max
Depth
(m)
Max
Control
(l/s)
Max
Volume
(m³)
Status
960 min Winter 115.618 1.118 24.1 1850.3 O K1440 min Winter 115.522 1.022 23.2 1692.7 O K2160 min Winter 115.382 0.882 22.0 1460.6 O K2880 min Winter 115.251 0.751 21.0 1243.8 O K4320 min Winter 115.016 0.516 20.8 855.1 O K5760 min Winter 114.856 0.356 20.6 588.8 O K7200 min Winter 114.771 0.271 19.0 448.5 O K8640 min Winter 114.724 0.224 17.1 371.3 O K10080 min Winter 114.696 0.196 15.3 324.5 O K
Storm
Event
Rain
(mm/hr)
Flooded
Volume
(m³)
Discharge
Volume
(m³)
Time-Peak
(mins)
960 min Winter 8.720 0.0 2705.2 7601440 min Winter 6.151 0.0 2828.3 10662160 min Winter 4.339 0.0 3088.2 15122880 min Winter 3.387 0.0 3212.9 19364320 min Winter 2.382 0.0 3380.7 27205760 min Winter 1.855 0.0 3528.8 33447200 min Winter 1.528 0.0 3632.4 39688640 min Winter 1.304 0.0 3717.7 466410080 min Winter 1.141 0.0 3786.4 5344

Cadenza Contracts Limited Page 7
48 West End Duston Primary School
Westbury Attenuation Calculations
Wiltshire BA13 3JG Proposed Tank 1
Date September 2013 Designed by Peter White
File Tank 1 Proposed.srcx Checked by
Micro Drainage Source Control 2013.1.1
Rainfall Details
©1982-2013 Micro Drainage Ltd
Rainfall Model FEH F (1km) 2.552Return Period (years) 200 Summer Storms Yes
Site Location 472650 261000 SP 72650 61000 Winter Storms YesC (1km) -0.026 Cv (Summer) 0.750D1 (1km) 0.322 Cv (Winter) 0.840D2 (1km) 0.277 Shortest Storm (mins) 30D3 (1km) 0.269 Longest Storm (mins) 10080E (1km) 0.307 Climate Change % +30
Time Area Diagram
Total Area (ha) 2.361
Time
From:
(mins)
To:
Area
(ha)
0 4 2.361
Cadenza Contracts Limited Page 8
48 West End Duston Primary School
Westbury Attenuation Calculations
Wiltshire BA13 3JG Proposed Tank 1
Date September 2013 Designed by Peter White
File Tank 1 Proposed.srcx Checked by
Micro Drainage Source Control 2013.1.1
Model Details
©1982-2013 Micro Drainage Ltd
Storage is Online Cover Level (m) 116.500
Tank or Pond Structure
Invert Level (m) 114.500
Depth (m) Area (m²) Depth (m) Area (m²) Depth (m) Area (m²)
0.000 1655.6 1.200 1655.6 1.201 6.2
Hydro-Brake® Outflow Control
Design Head (m) 1.200 Hydro-Brake® Type Md5 SW Only Invert Level (m) 114.500Design Flow (l/s) 25.0 Diameter (mm) 194
Depth (m) Flow (l/s) Depth (m) Flow (l/s) Depth (m) Flow (l/s) Depth (m) Flow (l/s) Depth (m) Flow (l/s)
0.100 6.8 0.800 21.3 2.000 32.0 4.000 45.3 7.000 59.90.200 15.5 1.000 23.0 2.200 33.6 4.500 48.1 7.500 62.00.300 19.8 1.200 24.9 2.400 35.1 5.000 50.6 8.000 64.10.400 20.8 1.400 26.8 2.600 36.5 5.500 53.1 8.500 66.00.500 20.6 1.600 28.7 3.000 39.2 6.000 55.5 9.000 68.00.600 20.5 1.800 30.4 3.500 42.4 6.500 57.7 9.500 69.8

Cadenza Contracts Limited Page 9
48 West End Duston Primary School
Westbury Attenuation Calcs
Wiltshire BA13 3JG Existing Pond 2
Date September 2013 Designed by Peter White
File Pond 2 Existing.srcx Checked by
Micro Drainage Source Control 2013.1.1
Summary of Results for 200 year Return Period
©1982-2013 Micro Drainage Ltd
Storm
Event
Max
Level
(m)
Max
Depth
(m)
Max
Control
(l/s)
Max
Volume
(m³)
Status
15 min Summer 113.442 0.882 24.0 296.8 O K30 min Summer 113.624 1.064 24.0 372.6 O K60 min Summer 113.756 1.196 24.0 430.8 O K120 min Summer 113.806 1.246 24.0 454.0 O K180 min Summer 113.784 1.224 24.0 443.7 O K240 min Summer 113.751 1.191 24.0 428.8 O K360 min Summer 113.683 1.123 24.0 398.4 O K480 min Summer 113.616 1.056 24.0 369.2 O K600 min Summer 113.550 0.990 24.0 341.2 O K720 min Summer 113.485 0.925 24.0 314.3 O K960 min Summer 113.358 0.798 24.0 263.6 O K1440 min Summer 113.124 0.564 24.0 176.9 O K2160 min Summer 112.912 0.352 23.7 105.1 O K2880 min Summer 112.826 0.266 21.1 77.9 O K4320 min Summer 112.758 0.198 16.0 57.1 O K5760 min Summer 112.724 0.164 12.8 46.9 O K7200 min Summer 112.703 0.143 10.6 40.6 O K8640 min Summer 112.688 0.128 9.1 36.2 O K10080 min Summer 112.677 0.117 8.0 33.0 O K
15 min Winter 113.533 0.973 24.0 334.1 O K30 min Winter 113.733 1.173 24.0 420.4 O K60 min Winter 113.880 1.320 24.4 488.4 O K120 min Winter 113.948 1.388 24.9 521.3 O K180 min Winter 113.931 1.371 24.7 512.7 O K240 min Winter 113.888 1.328 24.4 492.2 O K360 min Winter 113.805 1.245 24.0 453.3 O K480 min Winter 113.715 1.155 24.0 412.7 O K
Storm
Event
Rain
(mm/hr)
Flooded
Volume
(m³)
Discharge
Volume
(m³)
Time-Peak
(mins)
15 min Summer 124.910 0.0 313.2 1830 min Summer 80.635 0.0 404.5 3360 min Summer 49.372 0.0 495.9 62120 min Summer 29.132 0.0 585.3 120180 min Summer 21.101 0.0 635.9 156240 min Summer 16.684 0.0 670.4 186360 min Summer 11.954 0.0 720.5 252480 min Summer 9.437 0.0 758.4 320600 min Summer 7.850 0.0 788.6 386720 min Summer 6.751 0.0 813.8 456960 min Summer 5.317 0.0 854.6 5861440 min Summer 3.793 0.0 914.3 8222160 min Summer 2.701 0.0 977.0 11482880 min Summer 2.121 0.0 1022.9 14964320 min Summer 1.507 0.0 1089.7 22045760 min Summer 1.181 0.0 1139.2 29367200 min Summer 0.977 0.0 1178.3 36728640 min Summer 0.837 0.0 1210.7 440010080 min Summer 0.734 0.0 1238.4 5136
15 min Winter 124.910 0.0 350.8 1830 min Winter 80.635 0.0 453.0 3260 min Winter 49.372 0.0 555.5 60120 min Winter 29.132 0.0 655.5 118180 min Winter 21.101 0.0 712.2 172240 min Winter 16.684 0.0 750.9 196360 min Winter 11.954 0.0 807.0 272480 min Winter 9.437 0.0 849.4 348

Cadenza Contracts Limited Page 10
48 West End Duston Primary School
Westbury Attenuation Calcs
Wiltshire BA13 3JG Existing Pond 2
Date September 2013 Designed by Peter White
File Pond 2 Existing.srcx Checked by
Micro Drainage Source Control 2013.1.1
Summary of Results for 200 year Return Period
©1982-2013 Micro Drainage Ltd
Storm
Event
Max
Level
(m)
Max
Depth
(m)
Max
Control
(l/s)
Max
Volume
(m³)
Status
600 min Winter 113.623 1.063 24.0 372.1 O K720 min Winter 113.529 0.969 24.0 332.3 O K960 min Winter 113.337 0.777 24.0 255.3 O K1440 min Winter 112.996 0.436 24.0 132.8 O K2160 min Winter 112.817 0.257 20.6 75.2 O K2880 min Winter 112.764 0.204 16.5 58.8 O K4320 min Winter 112.715 0.155 11.9 44.2 O K5760 min Winter 112.690 0.130 9.3 36.8 O K7200 min Winter 112.674 0.114 7.7 32.1 O K8640 min Winter 112.663 0.103 6.6 28.9 O K10080 min Winter 112.654 0.094 5.8 26.4 O K
Storm
Event
Rain
(mm/hr)
Flooded
Volume
(m³)
Discharge
Volume
(m³)
Time-Peak
(mins)
600 min Winter 7.850 0.0 883.3 422720 min Winter 6.751 0.0 911.5 492960 min Winter 5.317 0.0 957.2 6261440 min Winter 3.793 0.0 1024.0 8362160 min Winter 2.701 0.0 1094.3 11442880 min Winter 2.121 0.0 1145.7 14964320 min Winter 1.507 0.0 1220.5 22045760 min Winter 1.181 0.0 1275.9 29367200 min Winter 0.977 0.0 1319.7 36728640 min Winter 0.837 0.0 1356.1 440010080 min Winter 0.734 0.0 1387.1 5112

Cadenza Contracts Limited Page 11
48 West End Duston Primary School
Westbury Attenuation Calcs
Wiltshire BA13 3JG Existing Pond 2
Date September 2013 Designed by Peter White
File Pond 2 Existing.srcx Checked by
Micro Drainage Source Control 2013.1.1
Rainfall Details
©1982-2013 Micro Drainage Ltd
Rainfall Model FSR Winter Storms YesReturn Period (years) 200 Cv (Summer) 0.750
Region England and Wales Cv (Winter) 0.840M5-60 (mm) 20.800 Shortest Storm (mins) 15
Ratio R 0.450 Longest Storm (mins) 10080Summer Storms Yes Climate Change % +0
Time Area Diagram
Total Area (ha) 1.340
Time
From:
(mins)
To:
Area
(ha)
0 4 1.340

Cadenza Contracts Limited Page 12
48 West End Duston Primary School
Westbury Attenuation Calcs
Wiltshire BA13 3JG Existing Pond 2
Date September 2013 Designed by Peter White
File Pond 2 Existing.srcx Checked by
Micro Drainage Source Control 2013.1.1
Model Details
©1982-2013 Micro Drainage Ltd
Storage is Online Cover Level (m) 114.500
Tank or Pond Structure
Invert Level (m) 112.560
Depth (m) Area (m²) Depth (m) Area (m²)
0.000 275.0 1.940 586.0
Hydro-Brake® Outflow Control
Design Head (m) 1.400 Hydro-Brake® Type Md6 SW Only Invert Level (m) 112.560Design Flow (l/s) 25.0 Diameter (mm) 191
Depth (m) Flow (l/s) Depth (m) Flow (l/s) Depth (m) Flow (l/s) Depth (m) Flow (l/s) Depth (m) Flow (l/s)
0.100 6.4 0.800 22.1 2.000 29.5 4.000 41.6 7.000 55.10.200 16.2 1.000 22.4 2.200 30.9 4.500 44.2 7.500 57.00.300 22.6 1.200 23.5 2.400 32.2 5.000 46.5 8.000 58.90.400 24.0 1.400 25.0 2.600 33.6 5.500 48.8 8.500 60.70.500 23.8 1.600 26.5 3.000 36.1 6.000 51.0 9.000 62.40.600 23.1 1.800 28.0 3.500 38.9 6.500 53.1 9.500 64.2

Cadenza Contracts Limited Page 13
48 West End Duston Primary School
Westbury Attenuation Calcs
Wiltshire BA13 3JG Proposed Pond/Tank 2
Date September 2013 Designed by Peter White
File Storage 2 Proposed.srcx Checked by
Micro Drainage Source Control 2013.1.1
Summary of Results for 200 year Return Period (+30%)
©1982-2013 Micro Drainage Ltd
Storm
Event
Max
Level
(m)
Max
Depth
(m)
Max
Control
(l/s)
Max
Volume
(m³)
Status
15 min Summer 113.570 1.010 24.0 642.0 O K30 min Summer 113.665 1.105 24.0 716.6 O K60 min Summer 113.750 1.190 24.0 786.3 O K120 min Summer 113.810 1.250 24.0 836.7 O K180 min Summer 113.820 1.260 24.0 845.5 O K240 min Summer 113.810 1.250 24.0 836.9 O K360 min Summer 113.774 1.214 24.0 806.5 O K480 min Summer 113.739 1.179 24.0 777.1 O K600 min Summer 113.703 1.143 24.0 748.1 O K720 min Summer 113.668 1.108 24.0 719.5 O K960 min Summer 113.582 1.022 24.0 651.4 O K1440 min Summer 113.423 0.863 24.0 531.2 O K2160 min Summer 113.205 0.645 24.0 377.8 O K2880 min Summer 113.032 0.472 24.0 265.9 O K4320 min Summer 112.858 0.298 22.6 161.2 O K5760 min Summer 112.794 0.234 19.0 124.8 O K7200 min Summer 112.760 0.200 16.1 105.6 O K8640 min Summer 112.736 0.176 13.9 92.9 O K10080 min Summer 112.720 0.160 12.3 83.7 O K
15 min Winter 113.669 1.109 24.0 720.5 O K30 min Winter 113.773 1.213 24.0 805.8 O K60 min Winter 113.869 1.309 24.3 887.1 O K120 min Winter 113.940 1.380 24.8 949.7 O K180 min Winter 113.958 1.398 24.9 966.2 O K240 min Winter 113.955 1.395 24.9 963.2 O K360 min Winter 113.918 1.358 24.6 930.5 O K480 min Winter 113.873 1.313 24.3 891.3 O K
Storm
Event
Rain
(mm/hr)
Flooded
Volume
(m³)
Discharge
Volume
(m³)
Time-Peak
(mins)
15 min Summer 262.688 0.0 656.4 1930 min Summer 149.243 0.0 746.0 3360 min Summer 84.790 0.0 850.9 62120 min Summer 48.172 0.0 967.0 122180 min Summer 34.607 0.0 1042.0 180240 min Summer 27.368 0.0 1098.8 240360 min Summer 19.661 0.0 1184.1 298480 min Summer 15.549 0.0 1248.6 360600 min Summer 12.961 0.0 1301.0 424720 min Summer 11.170 0.0 1345.4 492960 min Summer 8.720 0.0 1400.3 6281440 min Summer 6.151 0.0 1481.4 8962160 min Summer 4.339 0.0 1569.3 12722880 min Summer 3.387 0.0 1633.3 15884320 min Summer 2.382 0.0 1721.5 22485760 min Summer 1.855 0.0 1789.5 29447200 min Summer 1.528 0.0 1842.6 36728640 min Summer 1.304 0.0 1886.9 440810080 min Summer 1.141 0.0 1924.5 5136
15 min Winter 262.688 0.0 735.3 1930 min Winter 149.243 0.0 835.6 3360 min Winter 84.790 0.0 953.1 62120 min Winter 48.172 0.0 1083.1 120180 min Winter 34.607 0.0 1167.2 176240 min Winter 27.368 0.0 1230.8 232360 min Winter 19.661 0.0 1326.3 338480 min Winter 15.549 0.0 1398.5 380

Cadenza Contracts Limited Page 14
48 West End Duston Primary School
Westbury Attenuation Calcs
Wiltshire BA13 3JG Proposed Pond/Tank 2
Date September 2013 Designed by Peter White
File Storage 2 Proposed.srcx Checked by
Micro Drainage Source Control 2013.1.1
Summary of Results for 200 year Return Period (+30%)
©1982-2013 Micro Drainage Ltd
Storm
Event
Max
Level
(m)
Max
Depth
(m)
Max
Control
(l/s)
Max
Volume
(m³)
Status
600 min Winter 113.830 1.270 24.0 854.2 O K720 min Winter 113.785 1.225 24.0 815.3 O K960 min Winter 113.671 1.111 24.0 721.5 O K1440 min Winter 113.444 0.884 24.0 546.9 O K2160 min Winter 113.114 0.554 24.0 318.0 O K2880 min Winter 112.908 0.348 23.6 190.5 O K4320 min Winter 112.786 0.226 18.4 120.4 O K5760 min Winter 112.742 0.182 14.5 95.9 O K7200 min Winter 112.717 0.157 12.0 82.0 O K8640 min Winter 112.699 0.139 10.3 72.7 O K10080 min Winter 112.687 0.127 9.0 65.9 O K
Storm
Event
Rain
(mm/hr)
Flooded
Volume
(m³)
Discharge
Volume
(m³)
Time-Peak
(mins)
600 min Winter 12.961 0.0 1457.2 458720 min Winter 11.170 0.0 1506.9 534960 min Winter 8.720 0.0 1568.5 6841440 min Winter 6.151 0.0 1659.3 9682160 min Winter 4.339 0.0 1757.7 13202880 min Winter 3.387 0.0 1829.4 16124320 min Winter 2.382 0.0 1928.4 22485760 min Winter 1.855 0.0 2004.3 29927200 min Winter 1.528 0.0 2063.7 36728640 min Winter 1.304 0.0 2113.5 440810080 min Winter 1.141 0.0 2155.8 5136

Cadenza Contracts Limited Page 15
48 West End Duston Primary School
Westbury Attenuation Calcs
Wiltshire BA13 3JG Proposed Pond/Tank 2
Date September 2013 Designed by Peter White
File Storage 2 Proposed.srcx Checked by
Micro Drainage Source Control 2013.1.1
Rainfall Details
©1982-2013 Micro Drainage Ltd
Rainfall Model FEH F (1km) 2.552Return Period (years) 200 Summer Storms Yes
Site Location 472650 261000 SP 72650 61000 Winter Storms YesC (1km) -0.026 Cv (Summer) 0.750D1 (1km) 0.322 Cv (Winter) 0.840D2 (1km) 0.277 Shortest Storm (mins) 15D3 (1km) 0.269 Longest Storm (mins) 10080E (1km) 0.307 Climate Change % +30
Time Area Diagram
Total Area (ha) 1.340
Time
From:
(mins)
To:
Area
(ha)
0 4 1.340

Cadenza Contracts Limited Page 16
48 West End Duston Primary School
Westbury Attenuation Calcs
Wiltshire BA13 3JG Proposed Pond/Tank 2
Date September 2013 Designed by Peter White
File Storage 2 Proposed.srcx Checked by
Micro Drainage Source Control 2013.1.1
Model Details
©1982-2013 Micro Drainage Ltd
Storage is Online Cover Level (m) 114.500
Tank or Pond Structure
Invert Level (m) 112.560
Depth (m) Area (m²) Depth (m) Area (m²)
0.000 505.1 1.940 1076.3
Hydro-Brake® Outflow Control
Design Head (m) 1.400 Hydro-Brake® Type Md6 SW Only Invert Level (m) 112.560Design Flow (l/s) 25.0 Diameter (mm) 191
Depth (m) Flow (l/s) Depth (m) Flow (l/s) Depth (m) Flow (l/s) Depth (m) Flow (l/s) Depth (m) Flow (l/s)
0.100 6.4 0.800 22.1 2.000 29.5 4.000 41.6 7.000 55.10.200 16.2 1.000 22.4 2.200 30.9 4.500 44.2 7.500 57.00.300 22.6 1.200 23.5 2.400 32.2 5.000 46.5 8.000 58.90.400 24.0 1.400 25.0 2.600 33.6 5.500 48.8 8.500 60.70.500 23.8 1.600 26.5 3.000 36.1 6.000 51.0 9.000 62.40.600 23.1 1.800 28.0 3.500 38.9 6.500 53.1 9.500 64.2

Duston School, Northampton
Assessment of attenuation storage volumes.
Attenuation Tank 1.
Attenuation tank 1 is situated on the site on an existing attenuation pond, for the 30 year storm the
pond has been designed to store a volume of 588m3. Based on a total catchment area of 19,001m2
(1.9ha) this equates to 0.031m3 per m2 of pre extension contributing area.
Taking climate change into consideration, the storage volumes should increase to 0.037m3 per m2 of
post extension contributing area.
The additional hard standing areas (new primary school and car park extension) equates to 4,613m2.
Using the above post extension storage volume, the total storage volume of the new attenuation
tank can be calculated as follows…
Total contributing area: 19,000 + 4,613 = 23,613m2
Storage volume: 23,613 x 0.037 = 874m2
Attenuation Tank 2
Attenuation tank 2 is situated under the new play court; the play courts have a porous surface and
as such will not contribute to the drainage system.
This pond has been previously design to take a 30 year storage volume of 268m3. Based on a total
catchment area of 4,236m2 (existing hard play courts to the north of the school) this equates to a
storage volume of 0.063m3 per m2 of pre-extension contributing area.
Taking climate change into consideration, the storage volume should increase to 0.076m3 per m2 of
post extension contributing area.
As there are no additional hard-standing areas contributing to this tank/pond the storage volume
should account for only the additional run-off due to climate change. To that effect, the required
storage volume can be calculated as below…
Total contributing area: 4,326m2
Total storage volume (pond and tank): 4,326 x 0.076 = 329m3.
Note: The above calculations are very simplistic. More accurate attenuation calculations should be
undertaken at the detailed design stage which should include for the construction of a hydraulic
model of the existing drainage network.