mba 1st year statitics - data analytics project
TRANSCRIPT
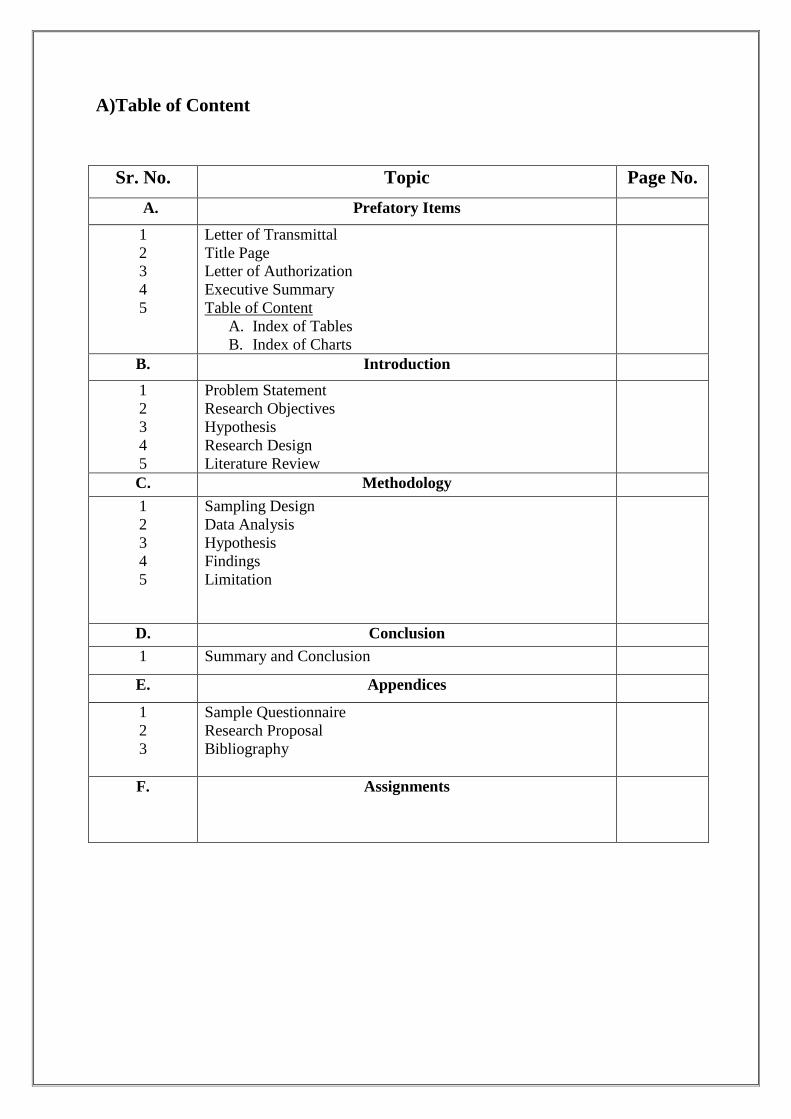
A)Table of Content
Sr. No. Topic Page No.
A. Prefatory Items
1
2
3
4
5
Letter of Transmittal
Title Page
Letter of Authorization
Executive Summary
Table of Content
A. Index of Tables
B. Index of Charts
B. Introduction
1
2
3
4
5
Problem Statement
Research Objectives
Hypothesis
Research Design
Literature Review
C. Methodology
1
2
3
4
5
Sampling Design
Data Analysis
Hypothesis
Findings
Limitation
D. Conclusion
1 Summary and Conclusion
E. Appendices
1
2
3
Sample Questionnaire
Research Proposal
Bibliography
F. Assignments

PREFATORY
ITEMS

Letter of Transmittal
April 5, 2015
Dr.Vijay Wagh
Director,
Sheila Raheja School of Business Management.
Mumbai, 400051
Re: Presentation Of research to study the water supply in Kalyan
Dear Dr.Wagh.
The Report Outline in the research proposal of 19th Jan 2015 is complete. We have
personally supervised the project, conducted the statistical analysis & prepare this Report.
The names of research associates involved there in are:
YEDNESH CHAVAN
ROHIT DESHMUKH
ALI MURTUZA RIZVI
PANKAJ SHARMA
The report addresses the key decision statement in what way we can decrease the
percentage of water supply. The key research question involves, studying the factors that are
involved in water supply. As agreed upon in the proposal, the report offers more specific
recommendations for managerial action, but rather it presents conclusions which should be
enable one to make more informed decisions. Thus, the confirm to the deliverables described
in the proposal letter.
Successfully accomplished the research objectives described as the outlines. We able to
meet our goal for interviewing the students and teachers. Once you have a look in the project.
Please contact us and we will schedule a formal preparations and question and answer period
for your management team.
Sincerely,
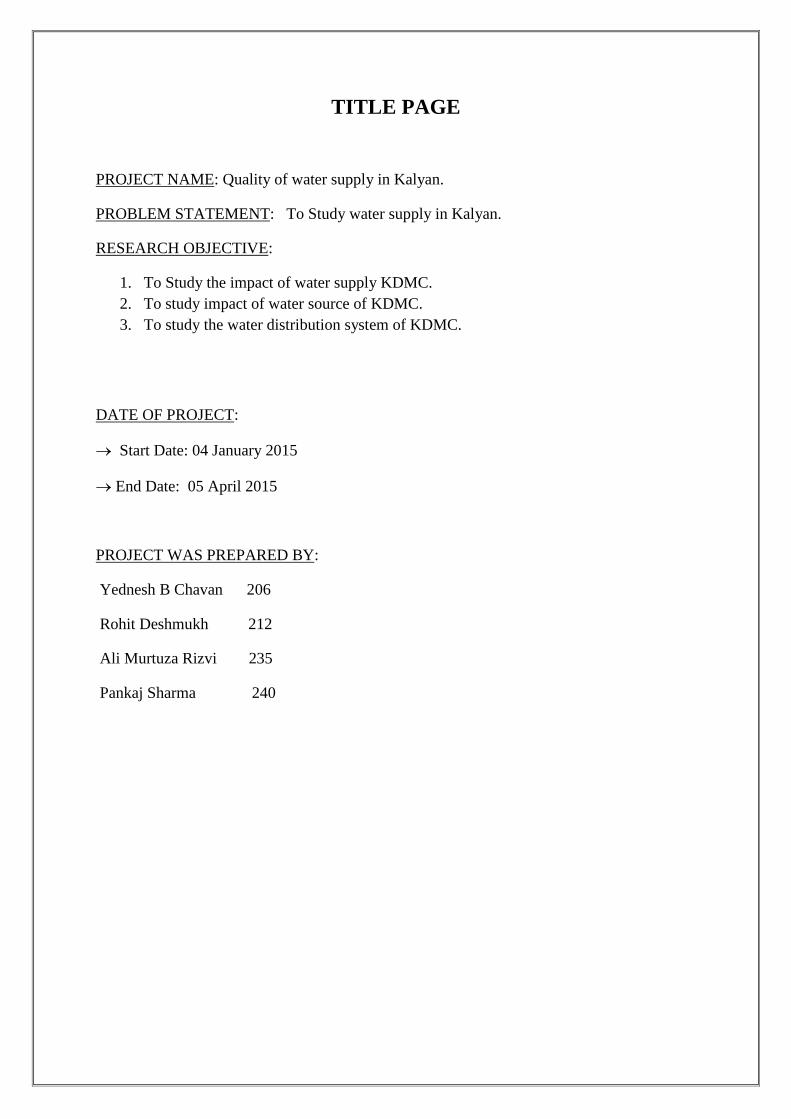
TITLE PAGE
PROJECT NAME: Quality of water supply in Kalyan.
PROBLEM STATEMENT: To Study water supply in Kalyan.
RESEARCH OBJECTIVE:
1. To Study the impact of water supply KDMC.
2. To study impact of water source of KDMC.
3. To study the water distribution system of KDMC.
DATE OF PROJECT:
Start Date: 04 January 2015
End Date: 05 April 2015
PROJECT WAS PREPARED BY:
Yednesh B Chavan 206
Rohit Deshmukh 212
Ali Murtuza Rizvi 235
Pankaj Sharma 240

LETTER OF AUTHORIZATION
April 05, 2015
Dr.Vijay Wagh
Director,
Sheila Raheja School of Business Management & Research,
Bandra, Mumbai-400051
Report: Presentation of research report
Respected sir,
The report outlined is research proposal of January 04, 2015, is complete. We have
personally supervised the project, conducted the statistical analysis and prepared the report
along with research associated:-
Yednesh Chavan 206
Rohit Deshmukh 212
Ali Murtuza Rizvi 235
Pankaj Sharma 240
The report outlined addresses the key decision statement: in what way you can find
out the impact of water supply, sources of drinking water, quality of water supply. The key
research involves the quality of water supply in Kalyan. It present conclusion confirm the
deliverables described in the research proposal letter.
We successfully accomplished the research project as described in outline. We were
able to meet goal for interviewing the peoples, and common literate people of the age group
from above 18 years.

EXECUTIVE SUMMARY
The research project proposed will consist of analytical review of quality of water
supply with particular reference to Mumbai. This encompasses the profiling of various
residents residing in Kalyan.
Understanding their lifestyle and ways of water consumption. This research done to
know whether the Kalyan residents are getting sufficient and clean water. Is there a viral
diseases spreading mainly due to bad quality of water supply.
This research will provide;
An in- depth socio-economic analysis quality of water supply
A brand analysis of water and its source’s
Assessment of Kalyan residents and their use of water.
The project will be completed step wise in the following manner:
PROBLEM STATEMENT:
To study water supply of KDMC.
RESEARCH OBJECTIVE:
To study the impact of KDMC in Kalyan.
To study the impact of water sources of Kalyan.
To study the impact of distribution system in Kalyan.
RESEARCH DESIGN:-
The following research design method will be implementing:
Descriptive Research Design
&
Exploratory Research Design

HYPOTHESIS STATEMENT:
HO: KDMC does not have impact on quality of water supply in Kalyan.
H1: KDMC have impact on quality of water supply in Kalyan.
HO: Water source of Kalyan does not have impact on quality of water supply in Kalyan.
H1: Water source of Kalyan have impact on quality of water supply in Kalyan.
HO: Distribution system does not have impact on quality of water supply in Kalyan.
H1: Distribution system has impact on quality of water supply in Kalyan.
DATA COLLECTION PLAN:
The primary and secondary data will be collected by means of:
Survey:-
Conducting Survey of 120 people residing in suburbs of Kalyan.
Questionnaires:-
Asking people to fill questionnaires from Kalyan Region & Literature review.
SAMPLING PLAN:-
The sampling plan will be implement as follows:
Target population -
People above 18years of age & irrespective of their profession.

Sampling Frame:-
People who live in suburbs of Kalyan.
Sample Size –
Here sample size is 120.
Sampling Method:-
Simple Random Sampling.
STATISTICAL TOOLS USED:-
The following statistical tool will be used:
Standard deviation. (SD)
QUALIFICATION OF RESEARCHER:
All four member of our group are 2nd
Sem M.M.S Students.
FINDING OF THE RESEARCH:-
1. The number of people using piped water is more as compared to other source. So
these people are dependent on KDMC as they provide piped water.
2. As 10 % people find that the water supplied to them is muddy often. Hence
improvement is need in quality of water supply.
3. Moreover 25.83% people feel that the water tariff is unreasonable as compared to the
quality supplied by KDMC.
4. Quality of water is rated on the scale of 1-5 and 33.33% people have rated it on the
scale of 1-2 which is the lowest where as 35% people fell that the water quality is just
average.

B. Index of Charts
Chart No.
Table Name / Title
Page No.
1
Sources of water supply?
2
Rating the quality of water?
3
Water with different odour?
4
Taste of water?
5
Supply of muddy water?
6
Diseases spreading in kalyan?
7
Method to make the water safe for drinking?
8
Frequency of cleaning storage tank?
9 Conducting potable water test?
10 Water tariff in term of its quality?

C) Chart Index
Chart No.
Chart Name / Title
Page No.
1
Sources of water supply
2
Rating the quality of water
3
Water with different odour
4
Taste of water
5
Supply of muddy water
6
Diseases spreading in kalyan
7
Method to make the water safe for drinking
8
Frequency of cleaning storage tank
9 Conducting potable water test
10 Water tariff in term of its quality

INTRODUCTION

INTRODUCTION
Safe drinking water is essential for human existence. Hence, the right to adequate
drinking water is considered as fundamental human right (Ramachandraiah C. (2001),
Kanmany J.C. (2003)). The proportion of urban population of India is projected to increase
from 28 per cent of the total population to about 38 per cent in 2026.The current state of
supply of core services in the urban areas, viz, water supply, sewerage, solid waste
management and street lighting, is inadequate by any standards. The higher growth of urban
population will add further pressure on provision of these services (MOF 2009). The growth
of urbanisation is higher in Maharashtra. The government has promoted industrialization due
to such policy automobile, engineering, electronic, information technology (IT) and
biotechnology industries have grown fast. Such industries have created huge employment
opportunities in the state. Therefore immigration of the indigent rural labour and qualified
professionals from other states took place. Along with the production and manufacturing, the
growth of services sector also occurred in the state. The BPO, call centres’, banking,
insurance companies have opened their corporate offices and grown significantly in terms of
numbers. The abandoned industrial sights are getting converted into residential locations.
Township planning and low cost affordable housing is developed for growing population.
Water has price in terms of time, space, quality and quantity. But water tariffs are not
high and uniform across the municipal corporations. They do not have funds to invest in
water supply projects. The whole water supply systems are not efficiently and regularly
managed. The alternative policies such as roof rain water harvesting, reducing leakages,
increasing tariff and metering, water use laws, and private investment in water supply will
reduce the future drinking water supply deficit.

PROBLEM STATEMENT
To study water supply in Kalyan.
RESEARCH OBJECTIVE
To study the impact of water supply KDMC.
To study the impact of water source of KDMC.
To study the water distribution system of KDMC.
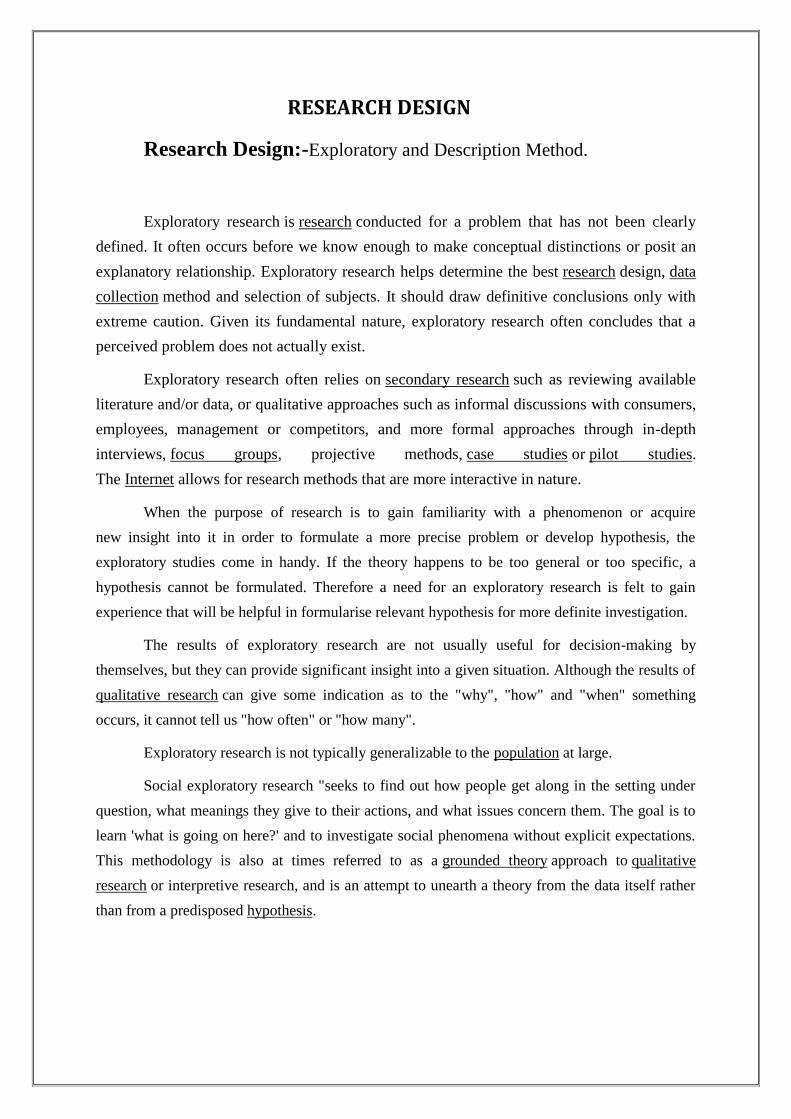
RESEARCH DESIGN
Research Design:-Exploratory and Description Method.
Exploratory research is research conducted for a problem that has not been clearly
defined. It often occurs before we know enough to make conceptual distinctions or posit an
explanatory relationship. Exploratory research helps determine the best research design, data
collection method and selection of subjects. It should draw definitive conclusions only with
extreme caution. Given its fundamental nature, exploratory research often concludes that a
perceived problem does not actually exist.
Exploratory research often relies on secondary research such as reviewing available
literature and/or data, or qualitative approaches such as informal discussions with consumers,
employees, management or competitors, and more formal approaches through in-depth
interviews, focus groups, projective methods, case studies or pilot studies.
The Internet allows for research methods that are more interactive in nature.
When the purpose of research is to gain familiarity with a phenomenon or acquire
new insight into it in order to formulate a more precise problem or develop hypothesis, the
exploratory studies come in handy. If the theory happens to be too general or too specific, a
hypothesis cannot be formulated. Therefore a need for an exploratory research is felt to gain
experience that will be helpful in formularise relevant hypothesis for more definite investigation.
The results of exploratory research are not usually useful for decision-making by
themselves, but they can provide significant insight into a given situation. Although the results of
qualitative research can give some indication as to the "why", "how" and "when" something
occurs, it cannot tell us "how often" or "how many".
Exploratory research is not typically generalizable to the population at large.
Social exploratory research "seeks to find out how people get along in the setting under
question, what meanings they give to their actions, and what issues concern them. The goal is to
learn 'what is going on here?' and to investigate social phenomena without explicit expectations.
This methodology is also at times referred to as a grounded theory approach to qualitative
research or interpretive research, and is an attempt to unearth a theory from the data itself rather
than from a predisposed hypothesis.

LITRETURE REVIEW
Quality of water supply management in municipal corporations of Kalyan & Dombivali
Abstract
This paper measures the demand and supply of water in Municipal Corporations in
Kalyan and Dombivali. The demand for drinking water is continuously increasing due to
growth of population, industrialization and commercial units. Drinking water is not provided
on a sustainable basis in the municipal corporations. Water has price in terms of time, space,
quality and quantity. But water tariffs are not high and uniform across the municipal
corporations. They do not have funds to invest in water supply projects. The whole water
supply systems are not efficiently and regularly managed. The alternative policies such as
roof rain water harvesting, reducing leakages, increasing tariff and metering, water use laws,
and private investment in water supply will reduce the future drinking water supply deficit.
Introduction:
Safe drinking water is essential for human existence. Hence, the right to adequate
drinking water is considered as fundamental human right (Ramachandraiah C. (2001),
Kanmany J.C. (2003)). The proportion of urban population of India is projected to increase
from 28 per cent of the total population to about 38 per cent in 2026.The current state of
supply of core services in the urban areas, viz, water supply, sewerage, solid waste
management and street lighting, is inadequate by any standards. The higher growth of urban
population will add further pressure on provision of these services (MoF 2009). The growth
of urbanization is higher in Maharashtra. The government has promoted industrialization due
to such policy automobile, engineering, electronic, information technology (IT) and
biotechnology industries have grown fast. Such industries have created huge employment
opportunities in the state.
www.wikipedia.com

Kalyan-Dombivali is a twin city and a municipal corporation with its headquarters
located in Kalyan in Thane district in the Indianstate of Maharashtra. It was formed in 1982
to administer the twin townships of Kalyan and Dombivali. The municipal corporation has a
population 1,193,266 (2001 census), and covers 137.15 square km, giving a density of 8,700
people per square km [2]
Kalyan has a history 700 years.
Kalyan-Dombivali is near the villages Mohone, Ambivli and Titwala.
Kalyan Dombivali Municipal Corp
Current Water Supply: 255 MLD in 2010 at 188 lpcd. (Kalyan Dombivali City
Development Plan) Current population: 15, 46,381 Sources: Mahane weir on Ulhas
River and KT weir on Kalu Rivers and from MIDC from its Barvi and Shahad Temghar
Water Works (http://www.midcindia.org/Pages/WaterSupplyScheme.aspx)
Lakes in KDMC which were water sources and are now heavily polluted Sr No Name of the
lake Area in sq. m. Location 1 Kala Talav 96757
Kalyan 2 Gauripada Talav
Kalyan 3 Chole Talav 3250
Dombivali 4
Titwala Talav 32800
Tiwala 5
Umbarde Talav 29915
Umbarde 6
Rahatale Talav 16683
www.wikipedia.com

A Kalyan-Dombivali Municipal Corporation is depending on the Ulhas and Kalu
River for drinking water. Around 255 MLD water is supplied from such scheme (NIUB
2008a). The residents of the Mira-Bhayandar get only 91MLD drinking water supply. Before
two years ago, MIDC promised 30MLD drinking water supply but Mira-Bhayandar
Municipal Corporation has received five to eight million liters a day drinking water supply
(NIUB 2008b).
In Ulhasnagar, the water supply system is very old. In 1948, the drinking water was
supplied to military camp from Badlapur barrage head work. It was 18 diameters tapping
from 24CI line. Total water supply was 1.59 MLD through Balkan-is-Bari GSR. Total nine
distribution mainlines were laid from supplying water to camp one to five. Total water supply
was inadequate to the rising population. Therefore in 1967, a special pipeline of 15 MLD was
developed at Shanti nagar. Similarly pump house of 0.9 million liters capacity was
constructed for supplying water to camp number four. In 1978, the water demand was higher
for growing population. The old water supply system was not yielding adequate water.
Therefore water from the Badlapur barrage system was stopped. Total water was supplied
from the Shahad water works and Barvi dam. The population growth for a year 1991 was
forecasted as 3.66 lakh. The water supply for the growing population was designed as 55
MLD. In 1995, Kirloskar Company prepared a 51crores water supply scheme to the
Ulhasnagar city from Barvi and Shahad reservoirs. Such water supply is managed by the MJP
and MIDC. Total 112 MLD water is supplied to the whole Ulhasnagar city. Thane district
gets water from the Andhra dam. Barvi dam is located in the Ambernath tahasil. Water from
both the dam is sent in Ulhas River. Such water is provided to Kalyan-Dombivali, Thane,
Mira-Bhaynder and Ulhasnagar Municipal Corporation (BMRDA 1995).
In Pune city, drinking water supply system is very old and it exists since 1750. Pune
city received first piped drinking water supply from Katraj via Amboli odha, Shanivarvada.
After the first scheme, the Swargate water work came in existence in the year 1873. Such
scheme is planned to treat raw water and supply to Pune city.
www.KDMC.ac.in

Other than two major water supply schemes, Pune city gets drinking water from the
Holkar water works. It is constructed in 1919 on Mula River. It is supplying 22 MLD water
to Pune city and Khadki Cantonment. The Warje water work is constructed in 1999 which
added 23 MLD drinking water. Such scheme is built on Khadakwasla dam. The capacity of
Khadakwasla dam is 56 million cubic meters. The Wagholi water work is built on the Pavana
dam in the year 2000. It added 23MLD drinking water. Such scheme is planned to provide
water to the villages on the boundary of Pune city. Due to merger of the villages in the Pune
Municipal Corporation, the villagers are obliged to provide the drinking water. Total installed
capacity of five water supply schemes for Pune Municipal Corporation is 793 MLD.
www.wikipedia.com

Ulhasnagar Municipal Corporation
Population: 6, 10,000 Water Supply: 170 lpcd Sewage Treatment: Of the 68 MLD sewage
generated (in reality it will be closer to 110 MLD); only 16.5% gets collected and may
get treated. Rest flows through nallahs to the Ulhas River untreated. 94% water supply is
not metered Water Supply: 120 MLD (196.72 lpcd if total supply is divided by current
population) Water Sources: Supplied by MIDC from Barvi and Shahda Dams at the rate
of Rs. 7 per cu m. (Ulhas Nagar City Sanitation Plan, March 2012, Water Supply and
Sanitation Dept, GOM)
http://www.urbanindia.nic.in/programme/uwss/CSP/Draft_CSP/Ulhasnagar_CSP.pdf)
Urbanization is putting more pressure on the existing civic amenities in all the municipal
corporations. The policy of 24*7 drinking water supply is beyond the limit of all the
Municipal Corporations in Maharashtra. Drinking water is provided for few hours with lower
pressure. The water received by the households is depending on the time, number of
connections in the area, water leakages, repairing, season etc. There are large inequalities in
the drinking water supply where richer households are getting more water and poorer are
getting less. The reasons are faculty pipeline, inadequate distribution system, transmission
and distribution losses, storage capacity etc. The richer households have more water storage
facilities but the poor households are struggling to get basic necessary water supply. If the
distance of drinking water taps is more than it is a forceful activity for women and children to
carry water. Most of the women are working in industrial and services sector units. Children
are studying in various municipal and private schools. Women and children do not have time
to stand in a long queue and carry drinking water from longer distance. It is not only affecting
on their day to day activities but such time has high opportunity cost for future development.
The study of Mehta L.et.al (2007) shows that better and easier access to water makes more
time available for economic activities and keep children in school thus improving human
capital. It also helps for income generation. Most of the women can take part in income
generating activities because piped water availability in the house increases time for
household chores, leisure and learning. Women involved in the informal sector have to work
hard to get enough drinking water. They have to wake up early in the morning, stand in a
queue and carry drinking water from longer distance for whole family. If the distance is
higher and beyond the limit, then household has to pay an extravagant price for safe water.
Reliable safe drinking water supply is a scarce commodity across the Municipal Corporations
in Maharashtra. Safe drinking water can be brought at substantial cost. The amount for water
which a poor family uses is depending on the family members including children’s, family
income, habits and cleanliness, distance and price of water etc. If the price of safe drinking
water is higher than poor household reduces its use. After all, the poor households are
spending large proportion of their income for few liters of drinking water every day, which is
necessary to sustain life in the cities.
http://www.urbanindia.nic.in/programme/uwss/CSP/Draft_CSP/Ulhasnagar_CSP.pdf)

Time spends in hospital, travel and visiting time of relatives is also important. If the
recovery period due to the water washed and water borne diseases is more or repeated visits
are occurring then poorer households have to borrow money from different sources. Such
burden of diseases on poor household is difficult to measure. The poor households are not
insured against such diseases.
Drinking water supply project is highly capital intensive activity. The initial cost
comprises as building dam, pipeline, storage and filtering system, water distribution system,
metering and bill collection system etc. Municipal corporations do not have money to invest
in water supply projects. The grants received from the central government under JNNURM
are not enough. Water tariffs in various municipal corporations are different and they are too
low. Water bills for actual use of water are not paid regularly by the consumers. Water supply
is not charged according to the actual use and water meters are not installed. Lack of
complete coverage of safe water supply on sustainable basis is an important challenge for
Municipal Corporations in Maharashtra.
The first part of the paper deals with research methodology and drinking water supply
system. The second part of the paper deals with drinking water demand estimation in
Municipal Corporations in Maharashtra. The third part of the papers deals with regression
results and policy implications.
.
http://www.urbanindia.nic.in/programme/uwss/CSP/Draft_CSP/Ulhasnagar_CSP.pdf)

Data and Methodology
Data for this study is mainly brought from various sources. For Greater Mumbai, the
ward wise data of population, industrial and commercial units is available on the Municipal
Corporation website. The MMRDA reports are referred for water supply schemes and
investment. The city development reports of Pune and Pimpri-Chinchwad are referred. The
environment status report and storm water plan report of Pune city has given the major
insight to study the drinking water supply system. Thane district has six municipal
corporations. The Thane, Navi Mumbai, Ulhasnagar, Mira-Bhayandar, Bhiwandi-Nizampur
and Kalyan-Dombivali Municipal Corporation’s city development report is referred. In
Maharashtra, there are Amravati, Kolhapur, Nanded-Waghala, Nagpur, Nasik and Nagpur
Municipal corporations. The city development report of these municipal corporations is also
referred. For this study, the water supply schemes of United Kingdom, World Bank projects
particularly Nepal, Sri Lanka, are also studies. The Asian Development Bank’s project
proposals by various SAARC countries are also referred. The proposals on drinking water
supply submitted by various municipalities to HUDCO are studied. Few water conservation
experts are interviewed.
We have calculated water demand for domestic, industrial, commercial and institutional
units based on the water demand norms. Total deficit of water is calculated as total demand
of drinking water minus total supply of drinking water within a particular year for each
Municipal Corporation. We have used to bit and ordinary regression model for each and
group of municipal corporations. The data is processed in STATA@10 software.
http://www.urbanindia.nic.in/programme/uwss/CSP/Draft_CSP/Ulhasnagar_CSP.pdf)

Drinking water supply systems
Kalyan city is grown from seven islands that are Ulhasnagar, Dombivali, Ambernath,
Thane, Kalwa, and Mumbra. Over the period of time, these islands were acquired by series of
reclamations. Due to wide business opportunities in Mumbai city, the communities like
Guajarati, Parsi, Boharas, Jews and Bania came to Mumbai. The continuous expansion of
infrastructural facilities and establishment of mills, commercial units in the city, the massive
employment was generated. Many people from western Maharashtra, Kokan and other states
came to Mumbai in search of employment. Therefore continuous migration was resulted into
congestion in the city. The population of Mumbai city was ten thousand in 1661 and it
increased up to sixty thousand in 1675. For drinking water, the city population was depending
on number of tanks such as Mumba Devi, Manamala, Babula, Govaliam Gilder, Banganga
etc. The people of city were fetching water from the wells and shallow tanks. These sources
tended to dry up in summer and quality of water used to get deteriorate. The local residents
had complaint against the shortage and bad quality of water. Therefore this was the beginning
to search sources of water to meet the city’s demand. Further expansion of education
facilities and technical advancement in the city, the larger work force was attracted from all
over the country. There was urgency to establish water supply system to Mumbai city. The
valley of river Mithi located near Vihar village was chosen for creating water source to
Mumbai city. The work was started in the year 1856. The Vihar lake was completed in the
year 1860. This was the first piped water supply to the Mumbai city. The quantity of water
supplied was 32 Million Litres a Day (MLD). The population of the city was 644405 in 1872.
During the year 1872, the height of Vihar lake was increased in order to supply more water to
city. The water supply from this lake was increased up to 68 MLD. Because of acute water
shortage in 1879, Tulsi dam was constructed across the Mithi river. Through this dam
additional 18 MLD water was brought to the city. In order to provide the additional water
supply, an emergency measure was undertaken in 1891. Pawai lake on a tributary of Mithi
river was developed. It added 4 MLD water supply. Instead of continuous efforts and
investment in water supply system, the potable water was not sufficient to growing city.
http://www.midcindia.org/watersupply scheme.aspx.

It added 82 MLD water supply. In spite of tapping all these resources, the water
supply to the growing population in the city was not adequate. Therefore Tansa-III was
developed after raising the dam height on river Tansa. In 1948, total water supply for the two
million populations was 541MLD. Dam on Vaitarna and tunnel between Vaitarna and Tansa
lake was completed in the year 1957. It supplied additional 490 MLD water to Mumbai city.
In 1967, the water supply added by Ulhas river was 90 MLD. During 1973. Bhatsa-1 was
completed in 1981. It supplied additional 455 MLD water to city. In 1989, additional 455
MLD water was supplied to city by Bhatsa-II. During 1998, drinking water was insufficient
for city therefore Bhatsa –III was developed. Following table shows the water sources and
water yield from various sources.
Table 1 Water sources to Mumbai city.
Sources Yield (MLD) Percent
Tulsi 18 0.54
Vihar 110 3.28
Tansa 417 12.45
Upper Vaitarna 1025 30.60
Bhatsa 1650 49.25
Mumbai-III 150 4.48
Sub-total 3350 100
En-route supply 120 -3.58
Total water supply 3230 96.42
http://www.midcindia.org/watersupply scheme.aspx.

Lowest water supply is available from the Tulsi lake and it is 18 MLD. Water is also
supplied to en-route villages. It is 120 MLD. Therefore the total water available for the entire
city is 3230 MLD. It is continuously provided throughout all seasons to the Greater Mumbai.
Water supply gets fluctuate because of rainfall in the catchments area. If the rainfall in the
catchments area is low or drought like situation arises, then Brihanmumbai Municipal
Corporation (BMC) and Government of Maharashtra (GoM) announces the water cuts in the
city. The municipal corporation confirms the water level in the various lakes. If it is
satisfactory then water is regularly supplied to the city. The level of the water is regularly
observed during the monsoon and summer season.
In Thane district, each municipal corporation has its own independent source of
drinking water supply. Thane Municipal Corporation (TMC) was use to get the drinking
water supply from the state owned organizations such as Maharashtra Jeevan Pradhikaran and
Maharashtra Industrial Development Corporation (MIDC). But in 2002, the municipal
commissioner of Thane took up a first step of setting up of a 100 MLD water supply project
from Bhatsa dam. The project was self funded by Thane Municipal Corporation. Water from
such dam began to flow in to the city from 2003. The cost of the project was much cheaper as
compare to the other water supply projects. The second big step in this direction took place in
2003 when the state government proposed to turn STEM into a joint stock company between
the TMC and two other civic bodies as well as Zilla Parishad, Thane. The TMC has a biggest
share of assets in the first joint stock water firm of a country. The corporation effectively took
up the responsibility and made STEM turn round the corner. Thane city is getting around
127mld water from such firm. The third major step towards making the city self reliant in
water supply took place in late 2007 when commissioner decided to launch the 110 MLD
water project. Other than these schemes, Brihanmumbai Municipal Corporation (BMC) is
supplying 30 MLD as a raw and 30 MLD as pure drinking water. MIDC is also supplying 75
MLD drinking water to Thane Municipal Corporation. From all sources, Thane Municipal
Corporation gets 362 MLD drinking water supply on a regular basis. The new drinking water
supply project has further added 110 MLD water. TMC began to make the city independent
of state owned water suppliers.
http://www.midcindia.org/watersupply scheme.aspx.

Mumbai Municipal Corporation in 1998. But such water supply system was
inadequate and insufficient for rising population of a planned city. Therefore in 2005, NNMC
decided to purchase the water from More dam. The official ownership of the More dam is
transferred from the government of Maharashtra to NMMC.A Kalyan-Dombivali Municipal
Corporation is depending on the Ulhas and Kalu river for drinking water. Around 255 MLD
water is supplied from such scheme (NIUB 2008a). The residents of the Mira-Bhayandar get
only 91MLD drinking water supply. Before two years ago, MIDC promised 30MLD drinking
water supply but Mira-Bhayandar Municipal Corporation has received five to eight million
liters a day drinking water supply (NIUB 2008b).
In Ulhasnagar, the water supply system is very old. In 1948, the drinking water was
supplied to military camp from Badlapur barrage head work. It was 18 diameters tapping
from 24CI line. Total water supply was 1.59 MLD through Balkan-is-Bari GSR. Total nine
distribution mainlines were laid from supplying water to camp one to five. Total water supply
was inadequate to the rising population. Therefore in 1967, a special pipeline of 15 MLD was
developed at Shanti nagar. Similarly pump house of 0.9 million liters capacity was
constructed for supplying water to camp number four. In 1978, the water demand was higher
for growing population. The old water supply system was not yielding adequate water.
Therefore water from the Badlapur barrage system was stopped. Total water was supplied
from the Shahad water works and Barvi dam. The population growth for a year 1991 was
forecasted as 3.66 lakh. The water supply for the growing population was designed as 55
MLD. In 1995, Kirloskar Company prepared a 51crores water supply scheme to the
Ulhasnagar city from Barvi and Shahad reservoirs. Such water supply is managed by the MJP
and MIDC. Total 112 MLD water is supplied to the whole Ulhasnagar city. Thane district
gets water from the Andhra dam. Barvi dam is located in the Ambernath tahasil. Water from
both the dam is sent in Ulhas river. Such water is provided to Kalyan-Dombivali, Thane,
Mira-Bhaynder and Ulhasnagar Municipal Corporation (BMRDA 1995).
www.BMC.gov.ac.in/water supply

In Pune city, drinking water supply system is very old and it exists since 1750. Pune
city received first piped drinking water supply from Katraj via Amboli odha, Shanivarvada.
After the first scheme, the Swargate water work came in existence in the year 1873. Such
scheme is planned to treat raw water and supply to Pune city. Such water supply scheme is on
Mutha right back cannel and it is picked up at Swargate. Total water supply was inadequate
for rising population and commercial activities in the city. Therefore when Pune city reached
at a status of the municipal corporation in the year 1950, a project of 45 MLD was developed
on the Mutha right back cannel. Such scheme has provided water to the Pune city and
Cantonment. It added 23MLD drinking water. Such scheme is planned to provide water to the
villages on the boundary of Pune city. Due to merger of the villages in the Pune Municipal
Corporation, the villagers are obliged to provide the drinking water. Total installed capacity
of five water supply schemes for Pune Municipal Corporation is 793 MLD.
For Pimpri Chinchwad Municipal Corporation (PCMC), Pavana dam is a major
source of drinking water. It is constructed in 1972. Intake works are constructed in the river
bed 150 meter upstream of the existing Punawale weir near Ravet village. It is six kilometre
away from the city. Around 91 percent of the stored water is utilised for the non irrigation
purposes. Drinking water is mainly supplied to Talegaon, Dehu Road cantonment, and Pimpri
Chinchawad township. Every day 350 MLD (51 per cent) raw water is lifted from Pavana
dam and supplied to Pimpri Chinchwad Municipal Corporation area. The Pawana dam has
capacity of 241 million cubic meters. A Kolhapur Municipal Corporation gets 128 MLD
drinking water supply from two independent sources. Nearly 120 MLD water is obtained
from the corporation and 8 MLD obtained as ground water source. The ground water is
supplied through 809 wells. For the piped water Kolhapur city is depend on three rivers. The
Bhogavati river is a first source and it is eight kilometre away from the city. Secondly,
Panchganga river via Bawada, which is six kilometres away from the city. Third source is via
Singapore, which is eleven kilometres and the Kalamba tank is three kilometres away.
www.BMC.gov.ac.in/water supply

But it added only 37.5 MLD drinking water to the total stock. The litre per capita
daily was increased up to 149 but water supply was inadequate. The population of Nagpur
city became almost double within two decades. During August 1961, the municipal
corporation decided to develop Kanhan source for drinking water. It added 35 MLD drinking
water which was not sufficient. Drinking water was the need of 644000 and still rising
population. The liters per capita daily came down up to 124. Therefore third time in August
1981, the Kanhan source was repaired. It added only 45 MLD drinking water. Total stock did
not increase much and therefore liters per capita daily were remained low. The dam on river
Pench-I and Pench-II was developed. It added further 245 MLD drinking water to total stock.
In 2001, the population of the Nagpur city was 2150000. In the same year, the number of
commercial units that is hotels, restaurants, small and large industrial units, cinema halls and
garages was increased. Therefore nearly 100 MLD drinking water supply was developed
through Pench-III dam. But it was still insufficient. From the Old Gorewada, another 16
MLD drinking water was withdrawn. From different sources, Nagpur city gets 470 MLD
drinking water supply.
For Amravati Municipal Corporation, the river Wardha is a major source of drinking
water. A Nal-Damayanti dam at upper Wardha is constructed at Simbhora. It supplied around
95 MLD drinking water. Other than this dam, bore and tube wells are the sources of drinking
water. The plant is functioning below the overall capacity of 95 MLD. In Nanded city, water
supply system is developed over the long period of time. In 1936, first drinking water supply
was planned to city. Such scheme was designed for the projected population of fifty thousand
for the year 1966. The head water work was located at old Dunkin near Govardhan Ghat on
the bank of river Godhavari. The water treatment plant with a capacity of 9 MLD was located
at Fort. Due to rising population and industries, such water was inadequate
http://www.TMC.ac.in/water demand

Apart from this source, Municipal Corporation pumps water from Godavari river in
the city through Jack wells dug on the banks of the river at new pump house. Other than this
source, the municipal corporation has 91 bore wells. They are located at different locations
but they provide water to local population in specific pockets. The total quantity of water
drawn from various sources is 54.40 MLD. For Aurangabad city, there are two water supply
systems. An old water supply pipeline of 700 mm diameter provides 42 MLD drinking water.
The new water supply pipeline line of 1400mm diameter provides 88 MLD water in the city.
Therefore total 130 MLD water is provided to the Aurangabad city. At present, Nasik
Municipal Corporation gets 280 MLD drinking water supply. Such water is provided from
the two sources. The Gangapur dam water is a first source. It is 1200mm diameter pipeline.
The municipal corporation has developed their own source of drinking water over the period
of time.
All the municipal corporations are regularly supplying water to respective area. Water supply
get fluctuate due to small repairing, joining pipeline etc. If there is drought like situation
arises in the state then all the Municipal Corporations cut the drinking water supply at some
extent. It is precautionary measure adopted by the municipal corporations. If the monsoon
arrives on time and there is enough water in the lakes, then water supply is regularly
maintained.
Water Demand in urban local bodies:
We have calculated the drinking water demand in all the municipal corporations and
regions for the year 2008-09. Such water demand is comprises as water used by different
units for different purposes. The number of units and standard use of water is available in the
literature. Therefore, we have calculated future growth of units in each Municipal
Corporation and region and calculated with water supply norms. Such water demand is
presented in the following table.
http://www.mcgm.ac.in
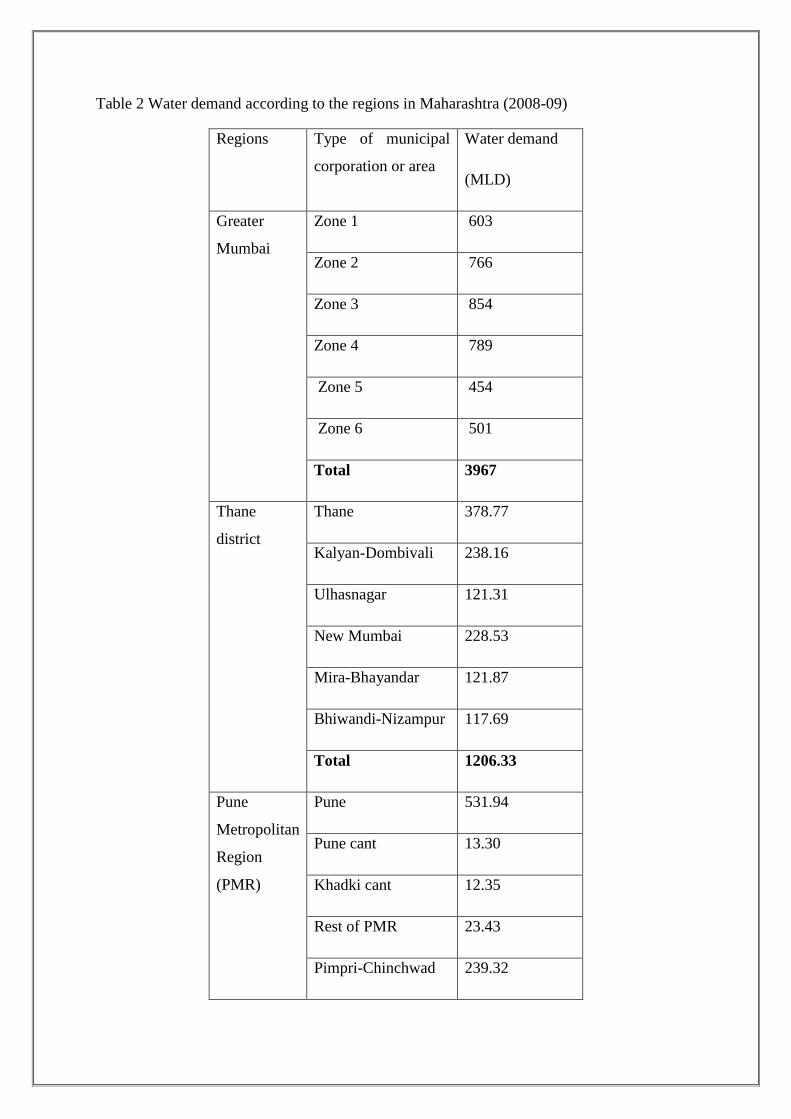
Table 2 Water demand according to the regions in Maharashtra (2008-09)
Regions Type of municipal
corporation or area
Water demand
(MLD)
Greater
Mumbai
Zone 1 603
Zone 2 766
Zone 3 854
Zone 4 789
Zone 5 454
Zone 6 501
Total 3967
Thane
district
Thane 378.77
Kalyan-Dombivali 238.16
Ulhasnagar 121.31
New Mumbai 228.53
Mira-Bhayandar 121.87
Bhiwandi-Nizampur 117.69
Total 1206.33
Pune
Metropolitan
Region
(PMR)
Pune 531.94
Pune cant 13.30
Khadki cant 12.35
Rest of PMR 23.43
Pimpri-Chinchwad 239.32

Total 820.34
Rest of
Maharashtra
Aurangabad 208.52
Nasik 299.40
Amravati 113.20
Nagpur 438.34
Nanded-Waghala 110.00
Kolhapur 115.50
Total 1284.96
http://www.mcgm.ac.in

The water demand in the Greater Mumbai is 3967 MLD for the year 2008-09. The
water demand from the zone three is 854 MLD. Such area has higher density of population,
small and large industries, hotels and slums. Therefore water is demand by different units for
different purposes is higher. In the Zone five, water demand is only 454 MLD. It is lowest as
compare to all other zones in the city.
In Thane district, the water demand of the Thane Municipal Corporation is highest
and it is 378.77 MLD. It is followed by the Kalyan-Dombivali Municipal Corporation, where
water demand is 238.16 MLD. In Thane Municipal Corporation water demand is higher due
to rising population. Thane city is well connected to the financial capital of country through
road and railway network. It is also an immediate proximity to Mumbai city. Most of the
industrial sites are getting converted in to residential areas in Thane city. Thane Municipal
Corporation (TMC) has restructured its water supply system in the new residential areas.
TMC has built new MBR and put additional new water supply system. Small industrial units
in Wagale estate and surrounding area require water but it is in small quantity. The water
demand in the Ulhasnagar and Mira-Bhayandar is almost similar. The lowest demand of
drinking water in Thane district is observed by the Bhiwandi-Nizampur Municipal
Corporation. It is mainly because density of population is very low. Most of the cotton and
garment units are located in the Municipal Corporation area. They hardly use drinking water
for different purposes. The water demand by six municipal corporations in Thane district is
calculated as 1206.33 MLD for the year of 2008-09.
Water demand in the Pune Municipal Corporation is consists of water demand by
Pune municipal Corporation area, Pune and Khadki cantonment and rest of Pune
Metropolitan Region. The water demand in this Pune Municipal Corporation is 581.02 MLD.
The water demand in the Pimpri-Chinchwad municipal corporation area is 239.32 MLD. It is
an industrial area in Pune Metropolitan Region. Density of population is very low; therefore
water demand is also low.
http://www.mcgm.ac.in

Water use by different units:
Drinking water is not only used for drinking and cooking purposes but it is used for
variety of purposes by different units. We have identified some units and their water use in
different Municipal Corporations or regions. It is shown in the table.
Table 3 Water demand according to units (MLD)
Type of unit Greater
Mumbai
Thane
District
Pune Metro-
politan
Region Rest of
Maharashtra
Population 3463.64 859.9 672.00 975.40
Small and large
Industries 297.41 310.83 41.14 121.00
Hotels, Restaurants
Shops 101.8 6.09 61.14 11.00
Garages 13.92 10.90 10.93 76.60
Theatres and malls 1.18 3.49 0.52 4.18
Public and private
Hospitals 10.45 2.49 1.71 1.60
Fire stations and hydrants 55.95 6.71 8.10 1.70
Educational institutions 21.56 1.66 24.28 83.42
Parks and gardens 0.64 3.92 0.43 10.10
Total 3966.55 1205.99 820.25 1285.08
Source: Computed from data
http://www.CGE.ac.in/water harwasting

Greater Mumbai where sixty percent population live in slums. In Thane district, the
water demand by population is 859.9 MLD. Among the six Municipal Corporations, the
water demand by population is 975.4 MLD. Water demand by the industrial units is highest
in the Thane district and it is 310.83MLD. In the Kalyan-Dombivali, Bhiwandi-Nizampur,
Ulhasnagar and Navi Mumbai Municipal Corporations, there are many small and large
industrial units located. They are demanding drinking water for various purposes. Water
demand by the hotels, restaurants and shops in Greater Mumbai is 101.8 MLD. The number
of shops, restaurants and hotels and their use of water for drinking, cleaning and washing are
higher. In Thane district, water demand by shops, restaurant and hotels is only 6.09 MLD.
Water demand for garages is 76.60 MLD in the six Municipal Corporations of Maharashtra.
In Greater Mumbai it is only 13.92 MLD. In Mumbai, Public transport is available but the
use of private vehicles is higher in Mumbai city. Therefore vehicles require much of water for
cleaning and washing. But it is much less as compare to Municipal Corporations in rest of
Maharashtra. The water demand by theatres, Cinema Halls and multiplexes is 3.49 MLD in
Thane district. In Municipal Corporations in rest of Maharashtra, it is 4.18 MLD. It is higher
because water is provided at lower tariff. In Mumbai city, the water demand is only 1.18
MLD because higher tariff is higher and it is continuously increasing. Water demand by the
public and private hospital is calculated as 10.45 MLD in Brihanmumbai Municipal
Corporation. The numbers of public and private hospitals are more and their use of water for
different purposes is also higher. In Thane district, it is only 2.49 MLD.
The water demand by the fire stations and hydrants is 55.95 MLD in Greater Mumbai.
It is only 6.71 percent in Thane district. This is mainly because every municipal corporation
has only one fire station. Water demand by the schools and colleges is 83.50 MLD in six
Municipal Corporations in rest of Maharashtra. In Greater Mumbai, water demand by
educational institutions is only 21.56 MLD. The reason is that in Mumbai, there is no
adequate space for schools and colleges therefore there are no gardens for schools and
colleges. Water is only used for drinking, toilets and cleaning purposes. In Brihanmumbai
Municipal Corporation, parks and gardens are concerned then the water demand is 0.64
MLD. The drinking water demand for parks and gardens in rest of Maharashtra is 10.10
MLD
http://www.CGE.ac.in/water harwasting

Water distribution system
Drinking water which is brought by the pipelines requires treatment before it gets
distributed to the consumers. Water treatment is necessary because of water contamination by
various sources at the different points. In Greater Mumbai, the raw water is regularly treated
and then it is transferred to Bhandup and Pawai master reservoirs. The Bhandup Master
Balancing Reservoir supply water to eastern and western suburbs. It provides water to A, C,
D, K and H ward. The H east ward is partly served by this reservoir. The Pawai reservoir
supply water to F/N and F/Sward. It is also provided water to M, N and L ward. They are
partly served by this reservoir. Water distribution system is very complex in the Greater
Mumbai. The water transmission (650 kilometre) and service pipes (3200 kilometre) are
covering entire city. Water supply to each ward is difficult to measure and it changes
according to total water availability. The water pressure is also gets affected due to total
stock, leakages, repairing etc. The numbers of household, commercial, small and large
industrial units are also matters (MCGM 1995). Drinking water supply distribution system
for Pune and Pimpri-Chinchwad Municipal Corporation is different. In Pune city, water
supply operation is divided into seven zones. Each zone has its specified area and water
supply service. In some part of the city water is pumped and in some part water is distributed
through gravity. It is also depending on the zone reservoirs. Water is distributed through
pipes consist of different diameters. The lowest size of the pipe is 80mm and highest diameter
is 1600mm. Total length of the network of pipeline in the city is 647.18 kilo meters. Total
length of the distribution of drinking water pipeline is 2474 kilo meter. It also includes the 24
kilo meter transmission line. In Pune city, water supply pipeline is mainly located near road.
Some roads have more than one water supply pipeline. The reason is that they are put at
different time. Total length of roads in Pune city is 1750 kilo meter (ESR 2008, PMC 2006).
In Pimpri-Chinchwad Municipal Corporation, the distribution network covers length of 722
kilo meters. It is 95 percent of road length. The water supply system in Pimpri-Chinchwad
Municipal Corporation covers whole developed area including slums. The newly added areas
are catered by the tanker supply.
http://www.CGE.ac.in/water harwasting
Municipal Corporation are filled more than two times a day. The water supply is
distributed by gravity and pumping zone in the city. The gravity zone covers west side of
Mumbai-Pune highway and railway line. There are 24 Elevated Service Reservoirs (ESR’s)
in the gravity zone. The pumping zone comprises areas north of ridge and slopping towards
the Indrayani river. They are subdivided in to eight water districts. Each water district is
served from the local ESR. There are total 15 ESR’s in pumping zone. It is also depending on
the water supply system in that particular ward. In Pune city, water supply operation and
maintenance, pumping of water treatment, distribution is taken care by municipal corporation
staff. Due to wide service area and connections, total 1650 person’s including technical staff
is employed by the Pune Municipal Corporation. In Pimpri-Chinchwad municipal area, water
supply distribution network and service area is small. Therefore only fifty persons are
employed. The contractors are involved in distribution and maintenance at the boundary level
(PCMC 2006).
In Thane Municipal Corporation, the length of the water supply is 42 kilo meters. The
distribution network is spread on 369 kilo meters. The whole Thane Municipal Corporation
area is divided into three major zones and 44 water districts. Each zone has provided the
water by separate source. It is further supplied to the ESR in respective area. The central zone
has 13 water districts. It gets 100 MLD water from STEM. The northern zone gets 100 MLD
water from STEM and it has 14 water districts. Eastern part of the Thane city gets water from
MIDC source. It has seven sub districts. All the zones are regularly supply water to different
water districts (TMC 2006). In New Mumbai Municipal Corporation, the drinking water is
supplied from More dam. The supply system network is spread in CBD Belapur, Neural,
Sanpada, and Vashi. Water is regularly supplied to all the households, commercial and
industrial units in the municipal area. (NMMC2006). In Ulhasnagar Municipal Corporation,
due to topography, the water supply system is divided into 16 water zones. Out of these
zones, the southern and northern part of the municipal area is further divided in to seven
zones (UMC2006). Water supply in Kolhapur Municipal Corporation is divided in to A to E
wards. Drinking water is supplied through the network pipeline which consists of reservoirs
and distribution system
http://www.CGE.ac.in/water harwasting

In Nagpur Municipal Corporation, there is old Gorewada and another two working
pumping schemes. At Pench-II, there are three working pumps but their capacity is very high.
At 17 location’s, there are 28 service reservoirs. Such service reservoirs are supplying the
water to the entire city. These service reservoirs are divided into seven water supply zones.
Pure water is supplied to the Master Balancing reservoirs. There are only two MBR’s such as
Seminary Hills and Guest House. These two major reservoirs supply water to 28 reservoirs.
The seminary Hill reservoir receives water from Pench WTP and old Gorewada WTP. There
are two GSR’s with a capacity of around 27.97million liters. It also includes the old GSR of 3
million liters capacity. The old GSR gets water from old Gorewada water treatment plant
whereas the new GSR gets water from Pench I and II. Both these reservoirs are supplying the
water to different regions (NMC 2006).
In Amravati, the water treatment plant is maintained by the Maharashtra Jeevan
Pradhikaran (MJP). The raw water is pumped in Master Balancing Reservoir (MBR). In the
AMC, there is only one MBR. The water is further pumped in to the ESR. There are three
GSR’s and eight ESR’s in the AMC. Total length of the pipe line is about 550 kilo meters
(AMC 2008). In 1977 additional distribution system of Nanded town was completed due to
growth of population in the city. Similarly in 1979, ESR’s was constructed at Chouphala of
2.2.In 1997 new pump house at Kotithirth was developed. In 1997, new WTP with capacity
of 60 Million liters is also established. From 1998 onward numbers of water supply projects
are planned. The first 13 ESR’s and 2 MBR’s were completed. The entire water supply
scheme is planned to supply at least 135 liters per capita daily water to urban population. The
open bore and tube wells are constructed in an authorized and unauthorized layouts and slums
to cater the local needs. Some pipe network has not reached in such area. The ground water
resource needs to be protected for present as well as future generation. In Nanded Municipal
Corporation, water treatment facilities are located at three places. The Kabra nagar WTP is
located 9 kilo meter away from city and it is commissioned in 1997 on Vishnupuri dam. It is
a sand filter and Chlorination type of treatment with installed capacity of 60 MLD.
http://www.CGE.ac.in/water harwasting

It has used capacity of 10 MLD. It is sand filter and Chlorination type treatment plant.
The last Dankin WTP (New and old) is located in the Nanded city. The installed capacity is
27 MLD but only 20 MLD capacity is used for water transmission. The water is distributed
separately for two different zones. They are serviced through 10 Elevated Storage Reservoirs
(ESR’s). The total capacity of all reservoirs is 15.35million liters. The distribution system in
the Nanded city is 526 kilo metes. In 1936, total 30 kilo meters distribution system was laid.
In 1966 to 1975 total 300 kilo meters pipe line was laid. During 1980 to 1996 another 30 kilo
meters was laid and rest was laid in1997 to 2004 (NWMC 2006). In Aurangabad Municipal
Corporation, the water supply was inadequate for rising population. Total 675 kilo meter
pipeline is distributed in the city to supply water (AMC 2006). At present, Nasik Municipal
Corporation provides drinking water through 1200mm diameter ms pipeline. After filtration,
water is supplied to CIDCO and Satpur area. Water pumping main is located in Gangapur
dam and it supply water to Nasik, Gandhinagar, Panchavati and Nasik road WTP (NMC
2008). In each municipal corporation water supply network is developed over the period of
time and it is bigger in Size.
http://www.CGE.ac.in/water harwasting

Water Tariff
Drinking water is a merit good. All individuals in each Municipal Corporation
have a right to an adequate, reliable, affordable supply of potable water. Water supply must
be priced in such a way that which will cover the capital cost such as operating and
maintenance cost. Drinking water has economic value in terms of space, time, quantity and
quality. But its uncertainty and quality increases further cost. Water tariffs are different in
different Municipal Corporation. The water pricing is depending on density of population,
small and large industries, commercial units and how the raw water is purchased.
http://www.TMC.ac.in/water demand

Table 4 Water Charges for Different Purposes in Greater Mumbai (per 1000 Litres)
No. Category 2007 2006
2002
1 Slum area, Stand post, Residential chaws 2.50 2.25 2.25
2 Dharmashala, Asylum, Women’s hotels, Balwadi, hotels,
All residential premises, Bungalows, Row houses,
Offices of trade unions, Educational institutions,
Gardens.
3.50 3.50 3.50
3 Halls for religions and social functions, Hospitals,
Dispensaries, Piggeries, Coaching classes, Playgrounds
Swimming Pools.
10.50 10.50 10.50
4 Industrial establishments, Dhobi-ghats, Ice factories,
Photo studio, Xerox shops.
18.00 18.00 15.00
5 All shops, Mall, Stores, Parlors, Training Centers,
Schools , Colleges , restraints , All hotels , Cinema halls,
Multiplex-warehouses, Petrol pumps, Workshops ,
Garages, Swimming pools, Ice cream factories, Studios.
38.00 25.00 22.00
6 All three star hotels, Aerated water factories,
Manufacturers of bottled water.
38.00 38.00 38.00
Source: Brihanmumbai Mahan agar Palika, Hydraulic engineer’s Department
In Brihanmumbai Municipal Corporation area, water for residential chaws, slums is
charged for Rs.2.50 per thousand liters in 2007. But for all residential premises it is Rs.3.50
per thousand liters. pools is Rs 38 per thousand liters. Such water tariff is higher and
Municipal Corporation has increased tariff in the city. Certainly, the poor people are not
visiting to these places.
http://www.TMC.ac.in/water demand

In Thane Municipal Corporation, water from the source is available at different prices.
The STEM and raw water received from BMC is charged at Rs.4 per thousand liters. The
water received from the MIDC is Rs.7.50 and pure water received from BMC is charged at
Rs.8 per thousand liters. The water received from the PISE is cheap and the rate is Rs.2.50
per thousand liters. In Thane city, water meters will get installed in few months. The civic
body charges water at a flat rate on monthly basis. It is irrespective of the quantity of water
used. The charges for water are set to be Rs.5 for every thousand liters for first 18000 liters
per month per flat. It is Rs. 6 per thousand liters for consumption between 18000 and 24000
liters (Rode S.2009b).
In NMMC, tariff for water is based on consumption categories ranging from Rs.3.75
to Rs.4.65 for domestic metered connections. Water tariff for the non metered connection is
Rs. 60 to Rs.100 per month. The rate of tariff for the commercial consumers is Rs.30 per
thousand liters. The NMMC does not supply water to industries in MIDC area. It supplies
water to slums through public stand posts. Few wells are provided in slum pockets of Airoli,
Digha, TTC and Dahisar ward. In Pune municipal corporation area, thousand liters of
drinking water is provided at Rs.3. For Pune and Khadaki cantonment, it is Rs. 5. For
commercial and industrial unit, the rate is Rs.21 per thousand liters. Households in slum have
to pay Rs.365 per annum. Water for stand post is free of charge. In PCMC, domestic water
supply connections are charged at Rs.3.30 per thousand liters. Non domestic connections are
charged Rs 28 per thousand liters. Unmetered domestic connections are charged a minimum
of Rs. 792 per annum. Commercial and industrial unmetered connections are charged of Rs.
652 per annum to Rs.11358 per annum depending on the diameter of connection. In PCMC
the water charges are different for different apartments and years. In 2004-05, per apartment
the water tariff rate was Rs.872 but in 2007-08 it was reported as Rs.1160. It means every
year per apartment, one percent water tariff has increased (Rode S. 2009a). In Kolhapur city,
the water tariff for domestic purposes is Rs7 per thousand liters and for commercial
connections it is Rs. 20. For industrial purposes water charges is Rs. 4 per thousand liters.
Such water tariff rates get revised every year. In Amravati, for residential purposes, the water
tariff rate per thousand liters is Rs.10.20. Water for non residential purposes is charged as
Rs.46.20. For institutions, it is Rs.19.65 paisa per thousand liters.
www.BMC.gov.ac.in/water supply

Regression results
The water demand is increasing in all the municipal corporations but it is difficult to
identity which units are contributing to such increase in water demand. Population and
commercial units are important but some units are also showing the decline in the use of
water. Therefore in order to examine the correlation with the units, we have used To bit and
ordinary least square regression model (Wooldridge, J.M. 2003, Greene 2003, Baltagi Badi
H. 2008).
Y*i=x’iβ+εi
Where Y*i>0
The results are presented in the following table.
Table 5 Regression results for Municipal Corporations and regions
Variables Greatermumbai
Municipal
Corporation
Thane district Pune Metropolitan
Region
Rest of
Maharashtra
(To bit) (OLS) (OLS) (To bit)
Co-
efficie
nt
Z test Co-
efficient
Z test Co-
efficient
T test Co-
efficie
nt
Z test
Population 0.00*
(0.00)
257.6
9
0.29***
(0.11)
2.58 1.00*
(0.00)
2143.75 1.93*
(0.00)
401.85
Hotel and
restaurants
0.20*
(0.00)
21.89 208.88*
(18.66)
11.07 3.17*
(0.05)
58.29 - -
Cinema house
and theatres
0.02*
(0.00)
9.62 - - 1.32*
(0.20)
6.59 - -
Educational 0.00 0.93 94.22** 2.90 4.42* 94.00 - -

institutions (0.00) (32.50) (0.04)
Small and
large
Industrial
Units
0.03*
(0.00)
4.59 0.99*
(0.00)
771.1
1
- - - -
Fire stations -0.02*
(0.00)
-4.05 - - - - -
10.04*
(3.33)
-3.02
Constant 0.49
(0.28)
1.75 -59.36
(0.67)
-
87.64
-0.20
(0.26)
-0.79 -2.30
(1.54)
-14.95
L
RChi2=221.75
Prob>chi2=0.00
Log Likelihood
=-330.54
R square =1.00
Adjusted R
square =1.00
Root MSE=0.04
R square =0.99
Adjusted R square
=0.99
Root MSE=1.88
L
RChi2=221.75
Prob >chi2=0.00
Log Likelihood
=
-330.54
P seudo
R2=0.25
Figures in Parenthesis shows standard errors
*Significant at 1 percent **significant at 5 percent *** significant at 10 percent
Water demand by population is positive and significantly correlated in all the
municipal corporations. It is observed that because of urbanization, population in all the
municipal corporations is growing. Therefore rising population requires more water for
different purposes. The demand of water to the hotels, restaurants is positively co-related
in the Brihanmumbai Municipal Corporation, Thane district and Pune Metropolitan
Region. The population in the municipal corporations often visit to such places. Therefore
water is used for cleaning, washing, drinking and food preparation etc. Water demand of
cinema and theatres is positively co-related in Greater Mumbai and Pune Metropolitan

Region. In both regions, people visit cinema houses to watch movies. They use different
recreational facilities at such places. The water is used for drinking, food preparation,
cleaning and toilets etc. Water demand by educational institutions is positively correlated
in the Pune Metropolitan Region and Thane district. The demand of water by educational
institutions is statistically insignificant in Greater Mumbai. The water demand by the
industrial units in Brihanmumbai Municipal Corporation and Thane district is positively
correlated and statistically significant. The water demand by the fire hydrants/stations is
negatively correlated in Brihanmumbai Municipal Corporation and Municipal
Corporations in rest of Maharashtra. .
www.BMC.gov.ac.in/water supply

Future water demand and supply estimation:
Water demand is increasing in the each municipal corporation area due to the growth
of the population and commercial units. But the supply is stagnant and it increase at once. It
is the local urban body which decides on the available and distribution of drinking water
supply. But it is difficult to ensure the adequate water to the population on a sustainable basis.
We have calculated the growth of the different units and the requirement of drinking water.
The water demand is sharply increasing in the Mumbai city but supply is stagnant. The deficit
of drinking water is increasing and it is calculated as more than 6000 million liters till 2021.
The supply of drinking water schemes are planned till 2021. Municipal Corporation will able
to keep the deficit of drinking water at constant rate but it will not decline.
Figure 1 Water deficit in the Greater Mumbai
The water supply projects are announced and completion of such projects is expected till
2021. We have calculated the water supply and demand situation in Pune Metropolitan
Region. In Pune metropolitan region, water demand and supply is increasing. The numbers of
water supply schemes are planning along with the growth of the population in the region.
www.BMC.gov.ac.in/water supply
Figure 2 Water demand and supply in PMR
Water Deficit
0
2000
4000
6000
8000
2000 2010 2020 2030
Year of projection
ML
D
Series1

Therefore deficit of the drinking water is not observed in the city till 2031. But it is also
depend on how the water supply schemes get completed. If they are not completed on time
then water demand will rise but supply will not. Similarly, there are different small and large
industries located in Pune metropolitan area. They have their own arrangement of water
supply. In Thane district, Thane Municipal Corporation is completely becoming independent
in terms of water supply. The demand of drinking water is continuously increasing but supply
schemes are not announced. The deficit of drinking water till 2031 is 50 MLD. It is small
deficit in drinking water and it is required to adjust with new water supply scheme.
www.BMC.gov.ac.in/water supply
Demand and supply of drinking water in PMR
0
200
400
600
800
1000
1200
1400
2005 2010 2015 2020 2025 2030 2035
Year
Dri
nkin
g w
ate
r (M
LD
)
Demand Supply

Figure 3: Deficit of drinking water in municipal corporations in Thane district (MLD)
Water deficit in New Mumbai Municipal Corporation is rising fast and in the year
2031, the water deficit will be 200 MLD. It is a planned city and therefore population,
commercial units, malls and theatres are continuously increasing. The New Mumbai
Municipal Corporation has to increase the supply of water in future through announcement of
water supply projects. Water deficit in the Ulhasnagar Municipal Corporation is also
increasing and in the year 2031, the water deficit will be more than 125 MLD. Water deficit
in Kalyan-Dombivali Municipal Corporation is also increasing and it will be more than 150
MLD till 2031. Water supply schemes are not announced by the Municipal Corporation and
few schemes are not enough to cater the need of rising population. In Mira-Bhayandar, water
deficit is not observed till 2031. The water supply schemes are planned according to future
growth of population. In Bhiwandi-Nizampur Municipal Corporation, the water demand is
rising but the deficit is very low. In such municipal corporation, density of population is very
low. Such Municipal Corporation area is not well connected through rail and highway.
Therefore water demand is very low. But in future monorail is planned from the corporation
which will increase population and other units. Therefore water demand may increase in
future.
www.BMC.gov.ac.in/water

Figure 4: Deficit/surplus of drinking water in Municipal Corporations in rest of Maharashtra
(MLD)
Water supply is surplus in Nagpur city. In 2011, water supply schemes will add 200
MLD water to total stock. In Future, water supply is planned according to the rising
population and other units. Therefore there is surplus in the drinking water supply in the
Nagpur Municipal Corporation. It is similar case for the Aurangabad Municipal Corporation.
The water supply scheme of 2031 will add 150 MLD water. Therefore surplus of 100 MLD is
observed at the year of 2031. At present, drinking water deficit is not observed in Kolhapur
city. In the year 2031 the water deficit is observed as up to 50MLD. For Kolhapur city, not a
single water supply scheme is planned. For Amravati Municipal Corporation, the deficit is
not observed at current period. But in future water deficit will increase. There is not a single
water supply scheme which is planned for city. The water deficit in the year 2031 is observed
as more than 50 MLD. In Nanded city, in current year more than 50 MLD drinking water
deficit is observed. In the year 2031, the water deficit is observed as more than 140 MLD. For
Nanded city, not a single water supply scheme is planned
www.BMC.gov.ac.in/water supply

Policy Implication
India has made gains after independence but the fact remains that more people are
vulnerable to water related diseases. (Biksham G.and Hajara S. 2005). In Maharashtra,
demand for drinking water is continuously increasing. The growth of population in urban
centres is more because of higher employment opportunities and infrastructure services.
Population growth is a challenge because it is not growing uniformly across the state. Some
municipal corporations are facing the problem of provision of urban services to its
population. Population is increasing but the supply of drinking water is constant. The future
growth of schools, shops, commercial, industrial units, garages is very high. The deficit in
drinking water will increase. Therefore municipal corporations must plan water supply with
rising population and commercial units. In Pune Metropolitan Region, Aurangabad and
Nagpur municipal corporation water supply is planned according to the future water needs. In
order to tackle the water supply deficit, the municipal corporations must make the roof rain
water harvesting system compulsory. Rainwater harvesting is an old method of capturing run-
off rainwater from the terrace. It is important to examine whether the rainwater harvesting
technique is efficient, functional, and sustainable. Rainwater harvesting system increases
ground water level and it provides ready and natural source of water. It is also helpful to
reduce the salinity in groundwater. Tanks, lakes and wells are the natural sources of water.
Time has come to use these natural sources more effectively and efficiently because of higher
water demand. Tanks in the corporation area can be repaired and reused. Water for toilets
must be provided through wells and ponds. Municipal corporations must reduce the leakages
and theft of water in their area. Wastewater can be treated and reused for different purposes.
It can be recycled from the different residential buildings, commercial establishments,
factories, and institutions. Such recycled water can be used for flushing, gardening, car
washing etc. The water demand can be managed through increase in water use efficiency,
recyclining and promotion of water saving technologies (Reddy V.R. 2001).In the present
juncture, the city population is using potable water for flushing, gardening etc. There are
alternative sources of water and they can be substituted for different use. .
www.BMC.gov.ac.in/water supply

In Brihanmumbai Municipal Corporation, unaccounted water is almost 20 percent. 15
percent leakage is considered as acceptable in a distribution system because further
reductions are not cost effective. Such reduction in the leakages through immediate measures
will add 162 MLD water in the city (Rode S.2008). When water is supplied to consumer, it is
wasted during washing clothes, drinking and brushing etc. It is visible that most of the people
keep tap running while brushing. Rich people regularly like tub and shower bath. Women
keep tap running while washing clothes. People drink half glass of water and half glass is
thrown in the drainage. Potable water is wasted during all these activities. Proper awareness
and advertisement could save drinking water wastage. There is need to prepare small
advertisements of running tap, washing clothes, potable water thrown in drainage etc.
Television programs and small advertisements can save few million liters of potable water in
the state. Municipal Corporations can reduce water theft through proper laws and legal
actions. Water theft across the pipelines can be reduced through protective walls and
compounds. Sometime the water supply is by and large limited by natural availability,
technologies for harnessing, recyclining and reusing can enhance supplies but only to a
limited extent. The crux of water management lies in managing demand (Krishnan R.
2003).Water tariff can satisfy three objectives. It helps to discourage water use for particular
activity or category. It is a useful method to reduce the water wastage. Higher water tariff is
useful to generate more money for future projects and maintaining present water supply
system. At present, water supply systems are not effectively managed. Total collection of
money of water bills is low because of irregularity of water bills, errors in readings and
invisible water reading. There is need for efficiency in water supply system. The water tariff
needs to be revised in the all the municipal corporations. Present flat system of tariff needs to
be replaced with marginal pricing of water. It will help to achieve long term efficiency in
deploying water resource. In the short period it will affect water demand but it will promote
efficiency in the long term. In a competitive economy, prices of goods and services are
always decided on the basis of demand and supply. The water charges can be framed on the
basis of standard use of water. Such water tariff must be high enough to meet the different
expenses. Regular revision of water tariff structure will certainly help to increase the financial
resources.
www.BMC.gov.ac.in/water supply

There is also need to provide technical training to Municipal Corporation staff about
the computerized billing system and simple method of water bill collection. The public water
supply needs modernization and technical up gradation. At present, investment and building a
new dam is time-consuming process and sometimes it takes 10 to 15 years. It needs to take
clearance from forest and environment department. Rehabilitation of project-affected
villages/people is another problem. Because of all these reasons, cost of the project
continuously increases. Sometimes the new water supply schemes cannot be managed
because they are the most capital intensive and expensive ones. Major costs incurred are costs
of planning, water storage and rehabilitation of villages; establish production capacity,
maintenance of storage, new pipeline, and transmission and distribution network. The water
supply scheme has fixed cost and returns are low over the period of time. The schemes are
announced when there is acute shortage of water supply. It takes maximum time to get funds,
clearance from various departments and actual work of the project and supply of water. After
a huge investment in water supply schemes, the recovery is very low because of low tariff,
water wastage, leakages etc. The whole water supply system suffers from mismanagement
and lack of modern system and equipments. In order to avoid all the above problems,
government can introduce the public private partnership in water supply system. There are
many advantages of this partnership, it can help to complete time bound projects, meeting
water quality standards, resource mobilization, and ensuring speedy recovery. Public private
partnership is helpful to build reservoir and treatment plants. Through this partnership better
water supply management, modern techniques for repairing, and leakages can be managed.
This partnership is useful to provide regular, reliable and affordable water supply to all
citizen. There is need of private sector participation in water related investment. Such
investment can be converted as technological investment in water supply system (Thomas
Wipperman, 2007). The private sector should not allow fixing the tariff structure. Municipal
Corporations must monitor the service of the private companies. Water supply system needs
more capital and such capital can be generated through private companies. There is need to
see the entire water supply system in terms of the modern water supply distribution system.
www.BMC.gov.ac.in/water supply

Mumbai's Water Supply Had the then Mumbai's British administrators not taken
seriously an agitation by the island's natives over the drinking water problem in 1845 and
subsequent search for water sources even 100km deep into the mainland, Mumbai's citizens,
perhaps, would have been as harassed for water as Chennai's people are now. Like Chennai,
Mumbai also depended on wells and ponds/lakes for its water supply. Overdrawing of water by
ever-increasing population caused depletion of ground water sources and also ingress of
seawater in Chennai. The same could have happened to Mumbai, as both these are coastal cities.
But, water supply in Mumbai kept rising with newer schemes to meet the increase in demand for
the growing population and the city is, comparatively, better off. However, the reasons for water
shortages are distribution losses, pilferage, wasteful use etc., causing about 40%-60% loss of
water. Mumbai's Water Sources From just 32mld (million liters per day) from Vihar Lake in
1860 for Mumbai's then population of only 0.7million, the water supply from various schemes
has now reached 2,950mld for the city's 13million people. Table 1 shows how the water supply
to the island city was augmented through schemes on six water sources Vihar, Tulsi, Tansa,
Modak Sagar, Upper Vaitarna and Bhatsa. As the population is projected to grow from current
13million to 16million by 2021, future water sources have been identified in Vaitarna River
basin and Ulhas River basin that can take the total water supply to 6,382mld by 2021. The plan
for Middle Vaitarna is at an advanced stage and a dam will be constructed at a cost of Rs1,
250crore to avail 455mld water. This dam will submerge 3,473 hectares of land in Vaitarna
basin and people from eight villages will be displaced. Middle Vaitarna, Gargai and Pinjal are
gravity sources, whereas the Ulhas river basin sources will need pumping water adding to the
cost; 5,108hectares will be submerged, while people of 19 villages will be affected. Distribution
System before Independence, Tansa was the major source and these water pipelines run along
Bombay-Agra road
www.BMC.gov.ac.in/water supply

Then came the Bhatsai Scheme which also envisaged construction of pumping, treatment
and conveyance at Pise, Panjrapur and Bhandup. Bhatsai water is pumped into Vaitarna mains
and brought through tunnels to Bhandup's water treatment-cum-pumping-cum-reservoir
complex. From Bhandup's Master Balancing Reservoir I (MBR I) and MBR II at Yewai Hills,
water is supplied to the city and suburbs through 17 service reservoirs and 650km transmission
mains, 3,000km of distribution mains and 3,200km of service pipes. This, in a nutshell, is how
water is conveyed to the city from the sources located at a distance of about 100km, although
distribution is a very complex structure. The cost of production is Rs 6 per kilolitre. This cost is
low due to old assets but the cost of water from new Schemes will be much higher.
Domestic Water Consumption Table 2 shows the average requirement of water in terms of liters
per consumer per day - lpcd). Table 2 Purpose Maximum Average Minimum Drinking,
Cooking & Dishwashing 50 40 30 Bathing 50 25 15 Toilet Flushing 50 40 30 Washing
Clothes 50 20 15 Cleaning & Gardening 25 10 - Car Washing 5 - - TOTAL 230 135 90
As against average requirement of 135lpcd, Municipal Corporation of Greater Mumbai
(MCGM) actually supplies 90lpcd because of water shortage. “But in slums, it supplies
only 25litres per day per household (not person), which is very unfair”, says Kisan
Mehta a renowned environmentalist. Though 90 or 135lpcd is adequate to meet a
person's water needs, the future water sources, conveyance, treatment plants, reservoirs
and distribution network is designed for 240lpcd for the projected population to take care
of transit losses, evaporation losses, higher standard of living in future and increase in
allied services with the growth of the city. Snags in the System Though the water supply
system is successfully laid, technically, the real problem is that the system is
mismanaged and misused through un-metered and unaccounted water supply. Moreover,
low tariff rates, the policy of subsidy and low recovery rate as well as metering errors
and billing mistakes burden the system. People are yet to come out of the mindset that
water is naturally available and hence, a free commodity. But, one has to pay for the
transport of this commodity after refinement
http://www.TMC.ac.in/water demand

Do we compensate them?” When groundwater is extracted freely for commercial purpose,
like by soft drinks industry, it amounts to impinging on the local people's right over their ground
water. So, it is time people realize that the concept of free and low cost has to go and a rational
pricing will have to be accepted to balance at least income-expenditure of the system which can
be well maintained and managed. This needs a strong political will to end the political-criminal
intervention, especially in the slums. Also, incentives should be offered through rebates on
advanced payments, conservation practices such as rainwater
Mumbai: Water Tariff Structure Table 3 Category Water Charges (Rs/1,000 liters) Domestic -
Stand Post - Buildings & Chawls 2.25 3.50 Halls, Hospitals, Playgrounds, Swimming
Pools etc 10.50 Industries, Dhobi Ghats, Government Premises, etc. 18.00 Refineries,
Airports, Public Sector Undertakings, etc. 25.00 Race Courses & Star Hotels 38.00
Sewerage charges are at 60% of water charges The daily water bill for a family of five
consuming about 1,000litres of water is Rs3.50 only. The domestic consumption of water
is highly subsidized by commercial and industrial users. Woes of the Service Provider
the Water Utility Department of the MCGM too face innumerable difficulties basically
because the demand for services outstrips supply. The planned/unplanned development
and growing slums require increase in the length of distribution network, besides
carrying on regular maintenance work of pipelines and attending to frequent breakdown
on a war footing. Under the economy measures, no new recruitments are made, while
workload keeps mounting with the expansion of the services; this results in low
efficiency and poor performance of the staff. The Department is not able to handle the
complaints from the citizens. Often, materials for repairs and maintenance are lacking.
The field difficulties are even graver, especially in thickly populated slums. Often, the
number of water pipes run in bunches through narrow passages and side gutters in slums.
Under these circumstances, it is extremely difficult to locate the fault or leakage and fix
problems, especially in water contamination cases. The concretization of roads has added
its share of woes for the Maintenance Department. Though a systematic approach for
diversion of existing.
http://www.TMC.ac.in/water demand

During the action, entire labour force has to leave aside their work and attend to the
problem. MCGM officials hope that the citizens become aware of these hardships in bringing
water from 100km and distributing in complex environment so that they can lend a hand and
fulfill their duty of paying for the services and conserve scarce water resources. Alternative to
High Cost Solution While population has increased 6.5 times from 2million in 1948 to nearly
13million now, water supply increased five-fold from 541mld to 2,950mld during these five
decades. The population is projected to rise by 25%, to 16million by 2021 and potential to
augment water supply is more than double at 6,382mld by developing sources in Vaitarna and
Ulhas river basins. But these are costly propositions both in monetary as well as human and
environmental terms. For Mumbai's luxurious need of water, is it fair to displace people from
eight villages in Vaitarna and 19 villages in Ulhas river basins and submerge some
9,000hectares of fertile land as well as cause environmental degradation? Instead, can we look at
alternatives to these major water projects? These are questions each one of us should be asking.
Rain Water Harvesting & Ground Water Use Earlier, rainwater was the main source of water
supply and it was collected in tanks. People used to measure the height of collected rainwater in
the tank and accordingly decide how much to draw from it to make it last over the year, recalls
Kisan Mehta. Now, with piped water supply, this traditional way of conservation of water has
been forgotten. Mumbai was blessed with number of tanks like Mumba Devi, Manamala,
Babula, Govalia, Gilder, Banganga, etc. These tanks, wells and lakes were sources of water then.
After the pipelined water came, these traditional water sources fell into disuse and got closed
with idol emersion and land grabbing businesses. If these old methods of rainwater harvesting
are restored, perhaps, there will be no need for future water supply schemes on Vaitarna and
Ulhas river basins. There are many other benefits from rainwater harvesting. The groundwater
table will rise, water quality will improve, salinity in water will reduce, cracks in the buildings
will be minimised, etc. According to Groundwater Survey & Development Agency (GSDA), the
area occupied by phreatic aquifers (porous rock layers transmitting underground water) is
limited between the seacoast and hill ranges in Mumbai and scope for recharge from rainfall is
limited.
http://www.TMC.ac.in/water demand

Hence, it is necessary to recharge the wells from which water is drawn. Industrial effluents,
open drains and open defecation causes polluted water to seep into groundwater affecting its
quality. Rainwater recharge can improve the deteriorating water quality and reduce salinity.
Rainwater harvesting by capturing runoff from the rooftops / terraces and surrounding surface
water will not only increase ground water recharge and stop ingress of sea water but will get
Mumbai out of its monsoon floods problem. Water harvesting in Mumbai will reduce storm
water discharge as well as reduce the load of sewerage treatment, thus controlling the dreadful
monsoon floods. Rainwater can be stored in tanks or can be recharged into the groundwater.
However, there is no space in Mumbai for residential complexes to provide for tanks to store
rainwater. Hence, recharging the groundwater is the right solution.
There are many agencies that can give guidance and consultation to citizens' groups who would
like to set up the rain water harvesting system in their locality. The bore well water then
can be used for washing and flushing purposes, if the water quality is not suitable for the
drinking purpose. Some rain water harvesting agencies are: • National Water Harvesters
Network (NWHN). • Centre for Environmental Science, Delhi. • Central Ground Water
Authority, Nagpur. • Groundwater Survey & Development Agency, Thane & Pune.
Desalination Mumbai can make use of abundant availability of seawater, desalinate for
potable water and thus, augment water supply instead of going in for complex method of
constructing dams & reservoirs and supporting that system. According to Arvind
Deshmukh, Chief Engineer, BARC, investment in a desalination plant of capacity 10-20
MGD is Rs15crore compared to Rs10crore for conventional water supply system. But,
the saving in terms of environmental protection and human misery is tremendous. With
every dam, there is submergence of cultivated land and forest and the resultant
displacement of local population. The record of rehabilitation of project affected persons
is well known. Water Recycling About 80% of distributed water is discharged as
wastewater. If a part of wastewater is treated and re-used, it can cover the projected
demand deficiency. It can also prevent encroaching on a source which can be spared for
other water-scarce areas.
.http://www.TMC.ac.in/water demand

The used water is collected and treated for cleaning concrete aprons of the railway
platforms thus saving potable water. Water Conservation About 71% of the earth's surface is
covered with water but 97% of this is seawater, 2% is locked in polar ice caps and glaciers and
hardly 1% of water is available as freshwater. Hence, we need to conserve every drop of water.
We have got to develop the habit of using less water and stopping wasteful and luxurious use of
water. Given below is a checklist of Do’s and Don'ts. • Use leak proof cocks, preferably aerated
ones, with periodical replacement of washers. • Do not throw away stored water; water never
gets stale. • Use a glass to rinse after brushing of teeth. It needs only half a litre of water.
Keeping the washbasin tap open while brushing teeth wastes at least four liters of water. •
Aerate shower; low flow showerheads reduce water use by 50% or more. • Bathing needs only
20litres of water. Shower bath needs at least 80litres and tub bath 110litres of water. Remember
the average daily water need for all purposes is 135litres per day per person but availability is
hardly 90litres. • Washing clothes require 40litres of water; keeping the tap running during
washing consumes 250litres of water. • Water plants with rinse water from the washing
machine. • Sprinkling water on the ground needs 10litres of water but hosepipe watering
consumes 50litres of water. • Throwing glassful water after just few sips wastes 300ml water.
Pour only as much water, as you want, in the glass. • Use a bucket to wash the car, not a hose.
Ideally, therefore, the housing complexes should have proper rain water harvesting system and
draw groundwater for non-drinking purposes. Even if water from bore-wells is used for toilet
flushing (50lpcd) and cleaning (10lpcd), the load on the piped water supply will come down to
50%. This means that the same piped water supply will be sufficient for double the population.
Recycling of the water used for washing is possible by re-using it for watering the garden,
further bringing down the load on the overworked system. Desalination of sea water will
obliterate the need to set up newer projects that require transporting water from 100km at a high
capital cost; it will also make that resource available to other needy water scarce areas.
There are many agencies that can give guidance and consultation to citizens' groups who would
like to set up the rain water harvesting system in their locality.
Some rain water harvesting agencies are: • National Water Harvesters Network (NWHN). •
Centre for Environmental Science, Delhi. • Central Ground Water Authority, Nagpur. •
Groundwater Survey & Development Agency, Thane & Pune. Desalination Mumbai can make
use of abundant availability of seawater, desalinate for potable water and thus, augment water
supply instead of going in for complex method of constructing dams & reservoirs and
supporting that system. According to Arvind Deshmukh, Chief Engineer, BARC, investment in

a desalination plant of capacity 10-20 MGD is Rs15crore compared to Rs10crore for
conventional water supply system. But, the saving in terms of environmental protection and
human misery is tremendous. With every dam, there is submergence of cultivated land and
forest and the resultant displacement of local population. The record of rehabilitation of project
affected persons is well known. Water Recycling About 80% of distributed water is discharged
as wastewater. If a part of wastewater is treated and re-used, it can cover the projected demand
deficiency. It can also prevent encroaching on a source which can be spared for other water-
scarce areas. An example of water recycling can be seen at Chhatrapati Shivaji Terminus of the
Central Railway which set up a water recycling plant of 0.2million capacity in 1999 at a cost of
Rs24lakh. The operational cost of the 0.2million-litre water treatment plant is Rs10 per kilolitre
which is less than the commercial water charges of Rs18. The used water is collected and treated
for cleaning concrete aprons of the railway platforms thus saving potable water. Water
Conservation About 71% of the earth's surface is covered with water but 97% of this is seawater,
2% is locked in polar ice caps and glaciers and hardly 1% of water is available as freshwater.
Hence, we need to conserve every drop of water. We have got to develop the habit of using less
water and stopping wasteful and luxurious use of water. Given below is a checklist of Do’s and
Don'ts. • Use leak proof cocks, preferably aerated ones, with periodical replacement of washers.
• Do not throw away stored water; water never gets stale. • Use a glass to rinse after brushing of
teeth. It needs only half a litre of water. Keeping the washbasin tap open while brushing teeth
wastes at least four liters of water. • Aerate shower; low flow showerheads reduce water use by
50% or more. • Bathing needs only 20litres of water. Shower bath needs at least 80litres and tub
bath 110litres of water. Remember the average daily water need for all purposes is 135litres per
day per person but availability is hardly 90litres. • Washing clothes require 40litres of water;
keeping the tap running during washing consumes 250litres of water. • Water plants with rinse
water from the washing machine
http://www.TMC.ac.in/water demand

Even if water from bore-wells is used for toilet flushing (50lpcd) and cleaning (10lpcd), the
load on the piped water supply will come down to 50%. This means that the same piped water
supply will be sufficient for double the population. Recycling of the water used for washing is
possible by re-using it for watering the garden, further bringing down the load on the
overworked system. Desalination of sea water will obliterate the need to set up newer projects
that require transporting water from 100km at a high capital cost; it will also make that resource
available to other needy water scarce areas. There are many agencies that can give guidance and
consultation to citizens' groups who would like to set up the rain water harvesting system in their
locality. The bore well water then can be used for washing and flushing purposes, if the water
quality is not suitable for the drinking purpose. Some rain water harvesting agencies are: •
National Water Harvesters Network (NWHN). • Centre for Environmental Science, Delhi. •
Central Ground Water Authority, Nagpur. • Groundwater Survey & Development Agency,
Thane & Pune. Desalination Mumbai can make use of abundant availability of seawater,
desalinate for potable water and thus, augment water supply instead of going in for complex
method of constructing dams & reservoirs and supporting that system. According to Arvind
Deshmukh, Chief Engineer, BARC, investment in a desalination plant of capacity 10-20 MGD
is Rs15crore compared to Rs10crore for conventional water supply system. But, the saving in
terms of environmental protection and human misery is tremendous. With every dam, there is
submergence of cultivated land and forest and the resultant displacement of local population.
The record of rehabilitation of project affected persons is well known. Water Recycling About
80% of distributed water is discharged as wastewater. If a part of wastewater is treated and re-
used, it can cover the projected demand deficiency. It can also prevent encroaching on a source
which can be spared for other water-scarce areas. An example of water recycling can be seen at
Chhatrapati Shivaji Terminus of the Central Railway which set up a water recycling plant of
0.2million capacity in 1999 at a cost of Rs24lakh. The operational cost of the 0.2million-litre
water treatment plant is Rs10 per kilolitre which is less than the commercial water charges of
Rs18. The used water is collected and treated for cleaning concrete aprons of the railway
platforms thus saving potable water.
http://www.TMC.ac.in/water demand

Hence, we need to conserve every drop of water. We have got to develop the habit of using
less water and stopping wasteful and luxurious use of water. Given below is a checklist of Do’s
and Don'ts. • Use leak proof cocks, preferably aerated ones, with periodical replacement of
washers. • Do not throw away stored water; water never gets stale. • Use a glass to rinse after
brushing of teeth. It needs only half a litre of water. Keeping the washbasin tap open while
brushing teeth wastes at least four liters of water. • Aerate shower; low flow showerheads reduce
water use by 50% or more. • Bathing needs only 20litres of water. Shower bath needs at least
80litres and tub bath 110litres of water. Remember the average daily water need for all purposes
is 135litres per day per person but availability is hardly 90litres. • Washing clothes require
40litres of water; keeping the tap running during washing consumes 250litres of water. • Water
plants with rinse water from the washing machine. • Sprinkling water on the ground needs
10litres of water but hosepipe watering consumes 50litres of water. • Throwing glassful water
after just few sips wastes 300ml water. Pour only as much water, as you want, in the glass. • Use
a bucket to wash the car, not a hose. Ideally, therefore, the housing complexes should have
proper rain water harvesting system and draw groundwater for non-drinking purposes. Even if
water from bore-wells is used for toilet flushing (50lpcd) and cleaning (10lpcd), the load on the
piped water supply will come down to 50%. This means that the same piped water supply will
be sufficient for double the population. Recycling of the water used for washing is possible by
re-using it for watering the garden, further bringing down the load on the overworked system.
Desalination of sea water will obliterate the need to set up newer projects that require
transporting water from 100km at a high capital cost; it will also make that resource available to
other needy water scarce areas.
There are many agencies that can give guidance and consultation to citizens' groups who would
like to set up the rain water harvesting system in their locality. The bore well water then
can be used for washing and flushing purposes, if the water quality is not suitable for the
drinking purpose. Some rain water harvesting agencies are: • National Water Harvesters
Network (NWHN). • Centre for Environmental Science, Delhi. • Central Ground Water
Authority, Nagpur
http://www.TMC.ac.in/water demand

According to Arvind Deshmukh, Chief Engineer, BARC, investment in a desalination plant
of capacity 10-20 MGD is Rs15crore compared to Rs10crore for conventional water supply
system. But, the saving in terms of environmental protection and human misery is tremendous.
With every dam, there is submergence of cultivated land and forest and the resultant
displacement of local population. The record of rehabilitation of project affected persons is well
known. Water Recycling About 80% of distributed water is discharged as wastewater. If a part
of wastewater is treated and re-used, it can cover the projected demand deficiency. It can also
prevent encroaching on a source which can be spared for other water-scarce areas. An example
of water recycling can be seen at Chhatrapati Shivaji Terminus of the Central Railway which set
up a water recycling plant of 0.2million capacity in 1999 at a cost of Rs24lakh. The operational
cost of the 0.2million-litre water treatment plant is Rs10 per kilolitre which is less than the
commercial water charges of Rs18. The used water is collected and treated for cleaning concrete
aprons of the railway platforms thus saving potable water. Water Conservation About 71% of
the earth's surface is covered with water but 97% of this is seawater, 2% is locked in polar ice
caps and glaciers and hardly 1% of water is available as freshwater. Hence, we need to conserve
every drop of water. We have got to develop the habit of using less water and stopping wasteful
and luxurious use of water. Given below is a checklist of Do’s and Don'ts. • Use leak proof
cocks, preferably aerated ones, with periodical replacement of washers. • Do not throw away
stored water; water never gets stale. • Use a glass to rinse after brushing of teeth. It needs only
half a litre of water. Keeping the washbasin tap open while brushing teeth wastes at least four
liters of water. • Aerate shower; low flow showerheads reduce water use by 50% or more. •
Bathing needs only 20litres of water. Shower bath needs at least 80litres and tub bath 110litres
of water. Remember the average daily water need for all purposes is 135litres per day per person
but availability is hardly 90litres. • Washing clothes require 40litres of water; keeping the tap
running during washing consumes 250litres of water. • Water plants with rinse water from the
washing machine. • Sprinkling water on the ground needs 10litres of water but hosepipe
watering consumes 50litres of water. •
http://www.TMC.ac.in/water demand

Even if water from bore-wells is used for toilet flushing (50lpcd) and cleaning (10lpcd), the
load on the piped water supply will come down to 50%. This means that the same piped water
supply will be sufficient for double the population. Recycling of the water used for washing is
possible by re-using it for watering the garden, further bringing down the load on the
overworked system. Desalination of sea water will obliterate the need to set up newer projects
that require transporting water from 100km at a high capital cost; it will also make that resource
available to other needy water scarce areas.
There are many agencies that can give guidance and consultation to citizens' groups who
would like to set up the rain water harvesting system in their locality. The bore well water then
can be used for washing and flushing purposes, if the water quality is not suitable for the
drinking purpose. Some rain water harvesting agencies are: • National Water Harvesters
Network (NWHN). • Centre for Environmental Science, Delhi. • Central Ground Water
Authority, Nagpur. • Groundwater Survey & Development Agency, Thane & Pune. Desalination
Mumbai can make use of abundant availability of seawater, desalinate for potable water and
thus, augment water supply instead of going in for complex method of constructing dams &
reservoirs and supporting that system. According to Arvind Deshmukh, Chief Engineer, BARC,
investment in a desalination plant of capacity 10-20 MGD is Rs15crore compared to Rs10crore
for conventional water supply system. But, the saving in terms of environmental protection and
human misery is tremendous. With every dam, there is submergence of cultivated land and
forest and the resultant displacement of local population. The record of rehabilitation of project
affected persons is well known. Water Recycling About 80% of distributed water is discharged
as wastewater. If a part of wastewater is treated and re-used, it can cover the projected demand
deficiency. It can also prevent encroaching on a source which can be spared for other water-
scarce areas. An example of water recycling can be seen at Chhatrapati Shivaji Terminus of the
Central Railway which set up a water recycling plant of 0.2million capacity in 1999 at a cost of
Rs24lakh. The operational cost of the 0.2million-litre water treatment plant is Rs10 per kilolitre
which is less than the commercial water charges of Rs18. The used water is collected and treated
for cleaning concrete aprons of the railway platforms thus saving potable water.
http://www.TMC.ac.in/water demand

We have got to develop the habit of using less water and stopping wasteful and luxurious
use of water. Given below is a checklist of Do’s and Don'ts. • Use leak proof cocks, preferably
aerated ones, with periodical replacement of washers. • Do not throw away stored water; water
never gets stale. • Use a glass to rinse after brushing of teeth. It needs only half a litre of water.
Keeping the washbasin tap open while brushing teeth wastes at least four liters of water. •
Aerate shower; low flow showerheads reduce water use by 50% or more. • Bathing needs only
20litres of water. Shower bath needs at least 80litres and tub bath 110litres of water. Remember
the average daily water need for all purposes is 135litres per day per person but availability is
hardly 90litres. • Washing clothes require 40litres of water; keeping the tap running during
washing consumes 250litres of water. • Water plants with rinse water from the washing
machine. • Sprinkling water on the ground needs 10litres of water but hosepipe watering
consumes 50litres of water. • Throwing glassful water after just few sips wastes 300ml water.
Pour only as much water, as you want, in the glass. • Use a bucket to wash the car, not a hose.
Ideally, therefore, the housing complexes should have proper rain water harvesting system and
draw groundwater for non-drinking purposes. Even if water from bore-wells is used for toilet
flushing (50lpcd) and cleaning (10lpcd), the load on the piped water supply will come down to
50%. This means that the same piped water supply will be sufficient for double the population.
Recycling of the water used for washing is possible by re-using it for watering the garden,
further bringing down the load on the overworked system. Desalination of sea water will
obliterate the need to set up newer projects that require transporting water from 100km at a high
capital cost; it will also make that resource available to other needy water scarce areas.
There are many agencies that can give guidance and consultation to citizens' groups who
would like to set up the rain water harvesting system in their locality. The bore well water then
can be used for washing and flushing purposes, if the water quality is not suitable for the
drinking purpose. Some rain water harvesting agencies are: • National Water Harvesters
Network (NWHN). • Centre for Environmental Science, Delhi. • Central Ground Water
Authority, Nagpur. • Groundwater Survey & Development Agency,
http://www.TMC.ac.in/water demand

BARC, investment in a desalination plant of capacity 10-20 MGD is Rs15crore compared
to Rs10crore for conventional water supply system. But, the saving in terms of environmental
protection and human misery is tremendous. With every dam, there is submergence of cultivated
land and forest and the resultant displacement of local population. The record of rehabilitation of
project affected persons is well known. Water Recycling About 80% of distributed water is
discharged as wastewater. If a part of wastewater is treated and re-used, it can cover the
projected demand deficiency. It can also prevent encroaching on a source which can be spared
for other water-scarce areas. An example of water recycling can be seen at Chhatrapati Shivaji
Terminus of the Central Railway which set up a water recycling plant of 0.2million capacity in
1999 at a cost of Rs24lakh. The operational cost of the 0.2million-litre water treatment plant is
Rs10 per kilolitre which is less than the commercial water charges of Rs18. The used water is
collected and treated for cleaning concrete aprons of the railway platforms thus saving potable
water. Water Conservation About 71% of the earth's surface is covered with water but 97% of
this is seawater, 2% is locked in polar ice caps and glaciers and hardly 1% of water is available
as freshwater. Hence, we need to conserve every drop of water. We have got to develop the
habit of using less water and stopping wasteful and luxurious use of water. Given below is a
checklist of Do’s and Don'ts. • Use leak proof cocks, preferably aerated ones, with periodical
replacement of washers. • Do not throw away stored water; water never gets stale. • Use a glass
to rinse after brushing of teeth. It needs only half a litre of water. Keeping the washbasin tap
open while brushing teeth wastes at least four liters of water. • Aerate shower; low flow
showerheads reduce water use by 50% or more. • Bathing needs only 20litres of water. Shower
bath needs at least 80litres and tub bath 110litres of water. Remember the average daily water
need for all purposes is 135litres per day per person but availability is hardly 90litres. • Washing
clothes require 40litres of water; keeping the tap running during washing consumes 250litres of
water. • Water plants with rinse water from the washing machine. • Sprinkling water on the
ground needs 10litres of water but hosepipe watering consumes 50litres of water. • Throwing
glassful water after just few sips wastes 300ml water. Pour only as much water, as you want, in
the glass
http://www.TMC.ac.in/water demand

This means that the same piped water supply will be sufficient for double the population.
Recycling of the water used for washing is possible by re-using it for watering the garden,
further bringing down the load on the overworked system. Desalination of sea water will
obliterate the need to set up newer projects that require transporting water from 100km at a high
capital cost; it will also make that resource available to other needy water scarce areas. There are
many agencies that can give guidance and consultation to citizens' groups who would like to set
up the rain water harvesting system in their locality. The bore well water then can be used for
washing and flushing purposes, if the water quality is not suitable for the drinking purpose.
Some rain water harvesting agencies are: • National Water Harvesters Network (NWHN). •
Centre for Environmental Science, Delhi. • Central Ground Water Authority, Nagpur. •
Groundwater Survey & Development Agency, Thane & Pune. Desalination Mumbai can make
use of abundant availability of seawater, desalinate for potable water and thus, augment water
supply instead of going in for complex method of constructing dams & reservoirs and
supporting that system. According to Arvind Deshmukh, Chief Engineer, BARC, investment in
a desalination plant of capacity 10-20 MGD is Rs15crore compared to Rs10crore for
conventional water supply system. But, the saving in terms of environmental protection and
human misery is tremendous. With every dam, there is submergence of cultivated land and
forest and the resultant displacement of local population. The record of rehabilitation of project
affected persons is well known. Water Recycling About 80% of distributed water is discharged
as wastewater. If a part of wastewater is treated and re-used, it can cover the projected demand
deficiency. It can also prevent encroaching on a source which can be spared for other water-
scarce areas. An example of water recycling can be seen at Chhatrapati Shivaji Terminus of the
Central Railway which set up a water recycling plant of 0.2million capacity in 1999 at a cost of
Rs24lakh. The operational cost of the 0.2million-litre water treatment plant is Rs10 per kilolitre
which is less than the commercial water charges of Rs18. The used water is collected and treated
for cleaning concrete aprons of the railway platforms thus saving potable water
http://www.TMC.ac.in/water demand

We have got to develop the habit of using less water and stopping wasteful and luxurious
use of water. Given below is a checklist of Do’s and Don'ts. • Use leak proof cocks, preferably
aerated ones, with periodical replacement of washers. • Do not throw away stored water; water
never gets stale. • Use a glass to rinse after brushing of teeth. It needs only half a litre of water.
Keeping the washbasin tap open while brushing teeth wastes at least four liters of water. •
Aerate shower; low flow showerheads reduce water use by 50% or more. • Bathing needs only
20litres of water. Shower bath needs at least 80litres and tub bath 110litres of water. Remember
the average daily water need for all purposes is 135litres per day per person but availability is
hardly 90litres. • Washing clothes require 40litres of water; keeping the tap running during
washing consumes 250litres of water. • Water plants with rinse water from the washing
machine. • Sprinkling water on the ground needs 10litres of water but hosepipe watering
consumes 50litres of water. • Throwing glassful water after just few sips wastes 300ml water.
Pour only as much water, as you want, in the glass. • Use a bucket to wash the car, not a hose.
Ideally, therefore, the housing complexes should have proper rain water harvesting system and
draw groundwater for non-drinking purposes. Even if water from bore-wells is used for toilet
flushing (50lpcd) and cleaning (10lpcd), the load on the piped water supply will come down to
50%. This means that the same piped water supply will be sufficient for double the population.
Recycling of the water used for washing is possible by re-using it for watering the garden,
further bringing down the load on the overworked system. Desalination of sea water will
obliterate the need to set up newer projects that require transporting water from 100km at a high
capital cost; it will also make that resource available to other needy water scarce areas.
There are many agencies that can give guidance and consultation to citizens' groups who
would like to set up the rain water harvesting system in their locality. The bore well water then
can be used for washing and flushing purposes, if the water quality is not suitable for the
drinking purpose. Some rain water harvesting agencies are: • National Water Harvesters
Network (NWHN). • Centre for Environmental Science, Delhi. • Central Ground Water
Authority, Nagpur. • Groundwater Survey & Development Agency, Thane & Pune. Desalination
http://www.TMC.ac.in/water demand

BARC, investment in a desalination plant of capacity 10-20 MGD is Rs15crore compared
to Rs10crore for conventional water supply system. But, the saving in terms of environmental
protection and human misery is tremendous. With every dam, there is submergence of cultivated
land and forest and the resultant displacement of local population. The record of rehabilitation of
project affected persons is well known. Water Recycling About 80% of distributed water is
discharged as wastewater. If a part of wastewater is treated and re-used, it can cover the
projected demand deficiency. It can also prevent encroaching on a source which can be spared
for other water-scarce areas. An example of water recycling can be seen at Chhatrapati Shivaji
Terminus of the Central Railway which set up a water recycling plant of 0.2million capacity in
1999 at a cost of Rs24lakh. The operational cost of the 0.2million-litre water treatment plant is
Rs10 per kilolitre which is less than the commercial water charges of Rs18. The used water is
collected and treated for cleaning concrete aprons of the railway platforms thus saving potable
water. Water Conservation About 71% of the earth's surface is covered with water but 97% of
this is seawater, 2% is locked in polar ice caps and glaciers and hardly 1% of water is available
as freshwater. Hence, we need to conserve every drop of water. We have got to develop the
habit of using less water and stopping wasteful and luxurious use of water. Given below is a
checklist of Do’s and Don'ts. • Use leak proof cocks, preferably aerated ones, with periodical
replacement of washers. • Do not throw away stored water; water never gets stale. • Use a glass
to rinse after brushing of teeth. It needs only half a litre of water. Keeping the washbasin tap
open while brushing teeth wastes at least four liters of water. • Aerate shower; low flow
showerheads reduce water use by 50% or more. • Bathing needs only 20litres of water. Shower
bath needs at least 80litres and tub bath 110litres of water. Remember the average daily water
need for all purposes is 135litres per day per person but availability is hardly 90litres. • Washing
clothes require 40litres of water; keeping the tap running during washing consumes 250litres of
water. • Water plants with rinse water from the washing machine. • Sprinkling water on the
ground needs 10litres of water but hosepipe watering consumes 50litres of water. • Throwing
glassful water after just few sips wastes 300ml water. Pour only as much water, as you want, in
the glass.
www.timesofindia.com

This means that the same piped water supply will be sufficient for double the population.
Recycling of the water used for washing is possible by re-using it for watering the garden,
further bringing down the load on the overworked system. Desalination of sea water will
obliterate the need to set up newer projects that require transporting water from 100km at a
high capital cost; it will also make that resource available to other needy water scarce areas.
There are many agencies that can give guidance and consultation to citizens' groups who
would like to set up the rain water harvesting system in their locality. The bore well water then
can be used for washing and flushing purposes, if the water quality is not suitable for the
drinking purpose. Some rain water harvesting agencies are: • National Water Harvesters
Network (NWHN). • Centre for Environmental Science, Delhi. • Central Ground Water
Authority, Nagpur. • Groundwater Survey & Development Agency, Thane & Pune. Desalination
Mumbai can make use of abundant availability of seawater, desalinate for potable water and
thus, augment water supply instead of going in for complex method of constructing dams &
reservoirs and supporting that system. According to Arvind Deshmukh, Chief Engineer, BARC,
investment in a desalination plant of capacity 10-20 MGD is Rs15crore compared to Rs10crore
for conventional water supply system. But, the saving in terms of environmental protection and
human misery is tremendous. With every dam, there is submergence of cultivated land and
forest and the resultant displacement of local population. The record of rehabilitation of project
affected persons is well known. Water Recycling About 80% of distributed water is discharged
as wastewater. If a part of wastewater is treated and re-used, it can cover the projected demand
deficiency. It can also prevent encroaching on a source which can be spared for other water-
scarce areas. An example of water recycling can be seen at Chhatrapati Shivaji Terminus of the
Central Railway which set up a water recycling plant of 0.2million capacity in 1999 at a cost of
Rs24lakh. The operational cost of the 0.2million-litre water treatment plant is Rs10 per kilolitre
which is less than the commercial water charges of Rs18. The used water is collected and treated
for cleaning concrete aprons of the railway platforms thus saving potable water.
www.timesofindia.com

Hence, we need to conserve every drop of water. We have got to develop the habit of using
less water and stopping wasteful and luxurious use of water. Given below is a checklist of
Dos and Don'ts. • Use leak proof cocks, preferably aerated ones, with periodical replacement
of washers. • Do not throw away stored water; water never gets stale. • Use a glass to rinse
after brushing of teeth. It needs only half a litre of water. Keeping the washbasin tap open
while brushing teeth wastes at least four liters of water. • Aerate shower; low flow
showerheads reduce water use by 50% or more. • Bathing needs only 20litres of water.
Shower bath needs at least 80litres and tub bath 110litres of water. Remember the average
daily water need for all purposes is 135litres per day per person but availability is hardly
90litres. • Washing clothes require 40litres of water; keeping the tap running during washing
consumes 250litres of water. • Water plants with rinse water from the washing machine. •
Sprinkling water on the ground needs 10litres of water but hosepipe watering consumes
50litres of water. • Throwing glassful water after just few sips wastes 300ml water. Pour only
as much water, as you want, in the glass. • Use a bucket to wash the car, not a hose. Ideally,
therefore, the housing complexes should have proper rain water harvesting system and draw
groundwater for non-drinking purposes. Even if water from bore-wells is used for toilet
flushing (50lpcd) and cleaning (10lpcd), the load on the piped water supply will come down
to 50%. This means that the same piped water supply will be sufficient for double the
population. Recycling of the water used for washing is possible by re-using it for watering the
garden, further bringing down the load on the overworked system. Desalination of sea water
will obliterate the need to set up newer projects that require transporting water from 100km at
a high capital cost; it will also make that resource available to other needy water scarce areas.
There are many agencies that can give guidance and consultation to citizens' groups who would
like to set up the rain water harvesting system in their locality. The bore well water then
can be used for washing and flushing purposes, if the water quality is not suitable for the
drinking purpose. Some rain water harvesting agencies are: • National Water Harvesters
Network (NWHN). • Centre for Environmental Science, Delhi. • Central Ground Water
Authority, Nagpur.
www.timesofindia.com

According to Arvind Deshmukh, Chief Engineer, BARC, investment in a desalination
plant of capacity 10-20 MGD is Rs15crore compared to Rs10crore for conventional water
supply system. But, the saving in terms of environmental protection and human misery is
tremendous. With every dam, there is submergence of cultivated land and forest and the
resultant displacement of local population. The record of rehabilitation of project affected
persons is well known. Water Recycling About 80% of distributed water is discharged as
wastewater. If a part of wastewater is treated and re-used, it can cover the projected demand
deficiency. It can also prevent encroaching on a source which can be spared for other water-
scarce areas. An example of water recycling can be seen at Chhatrapati Shivaji Terminus of
the Central Railway which set up a water recycling plant of 0.2million capacity in 1999 at a
cost of Rs24lakh. The operational cost of the 0.2million-litre water treatment plant is Rs10
per kilolitre which is less than the commercial water charges of Rs18. The used water is
collected and treated for cleaning concrete aprons of the railway platforms thus saving
potable water. Water Conservation About 71% of the earth's surface is covered with water
but 97% of this is seawater, 2% is locked in polar ice caps and glaciers and hardly 1% of
water is available as freshwater. Hence, we need to conserve every drop of water. We have
got to develop the habit of using less water and stopping wasteful and luxurious use of water.
Given below is a checklist of Dos and Don'ts. • Use leak proof cocks, preferably aerated ones,
with periodical replacement of washers. • Do not throw away stored water; water never gets
stale. • Use a glass to rinse after brushing of teeth. It needs only half a litre of water. Keeping
the washbasin tap open while brushing teeth wastes at least four liters of water. • Aerate
shower; low flow showerheads reduce water use by 50% or more. • Bathing needs only
20litres of water. Shower bath needs at least 80litres and tub bath 110litres of water.
Remember the average daily water need for all purposes is 135litres per day per person but
availability is hardly 90litres. • Washing clothes require 40litres of water; keeping the tap
running during washing consumes 250litres of water. • Water plants with rinse water from the
washing machine. •
www.timesofindia.com

• Use a bucket to wash the car, not a hose. Ideally, therefore, the housing complexes should
have proper rain water harvesting system and draw groundwater for non-drinking purposes.
Even if water from bore-wells is used for toilet flushing (50lpcd) and cleaning (10lpcd), the
load on the piped water supply will come down to 50%. This means that the same piped
water supply will be sufficient for double the population. Recycling of the water used for
washing is possible by re-using it for watering the garden, further bringing down the load on
the overworked system. Desalination of sea water will obliterate the need to set up newer
projects that require transporting water from 100km at a high capital cost; it will also make
that resource available to other needy water scarce areas.
There are many agencies that can give guidance and consultation to citizens' groups who
would like to set up the rain water harvesting system in their locality. The bore well water then
can be used for washing and flushing purposes, if the water quality is not suitable for the
drinking purpose. Some rain water harvesting agencies are: • National Water Harvesters
Network (NWHN). • Centre for Environmental Science, Delhi. • Central Ground Water
Authority, Nagpur. • Groundwater Survey & Development Agency, Thane & Pune. Desalination
Mumbai can make use of abundant availability of seawater, desalinate for potable water and
thus, augment water supply instead of going in for complex method of constructing dams &
reservoirs and supporting that system. According to Arvind Deshmukh, Chief Engineer, BARC,
investment in a desalination plant of capacity 10-20 MGD is Rs15crore compared to Rs10crore
for conventional water supply system. But, the saving in terms of environmental protection and
human misery is tremendous. With every dam, there is submergence of cultivated land and
forest and the resultant displacement of local population. The record of rehabilitation of project
affected persons is well known. Water Recycling About 80% of distributed water is discharged
as wastewater. If a part of wastewater is treated and re-used, it can cover the projected demand
deficiency. It can also prevent encroaching on a source which can be spared for other water-
scarce areas. An example of water recycling can be seen at Chhatrapati Shivaji Terminus of the
Central Railway which set up a water recycling plant of 0.2million capacity in 1999 at a cost of
Rs24lakh
www.timesofindia.com

Water Conservation About 71% of the earth's surface is covered with water but 97% of this
is seawater, 2% is locked in polar ice caps and glaciers and hardly 1% of water is available as
freshwater. Hence, we need to conserve every drop of water. We have got to develop the habit
of using less water and stopping wasteful and luxurious use of water. Given below is a checklist
of Dos and Don'ts. • Use leak proof cocks, preferably aerated ones, with periodical replacement
of washers. • Do not throw away stored water; water never gets stale. • Use a glass to rinse after
brushing of teeth. It needs only half a litre of water. Keeping the washbasin tap open while
brushing teeth wastes at least four liters of water. • Aerate shower; low flow showerheads reduce
water use by 50% or more. • Bathing needs only 20litres of water. Shower bath needs at least
80litres and tub bath 110litres of water. Remember the average daily water need for all purposes
is 135litres per day per person but availability is hardly 90litres. • Washing clothes require
40litres of water; keeping the tap running during washing consumes 250litres of water. • Water
plants with rinse water from the washing machine. • Sprinkling water on the ground needs
10litres of water but hosepipe watering consumes 50litres of water. • Throwing glassful water
after just few sips wastes 300ml water. Pour only as much water, as you want, in the glass. • Use
a bucket to wash the car, not a hose. Ideally, therefore, the housing complexes should have
proper rain water harvesting system and draw groundwater for non-drinking purposes. Even if
water from bore-wells is used for toilet flushing (50lpcd) and cleaning (10lpcd), the load on the
piped water supply will come down to 50%. This means that the same piped water supply will
be sufficient for double the population. Recycling of the water used for washing is possible by
re-using it for watering the garden, further bringing down the load on the overworked system.
Desalination of sea water will obliterate the need to set up newer projects that require
transporting water from 100km at a high capital cost; it will also make that resource available to
other needy water scarce areas. There are many agencies that can give guidance and consultation
to citizens' groups who would like to set up the rain water harvesting system in their locality.
The bore well water then can be used for washing and flushing purposes, if the water quality is
not suitable for the drinking purpose. Some rain water harvesting agencies are: • National Water
Harvesters Network (NWHN). •
www.timesofindia.com

BARC, investment in a desalination plant of capacity 10-20 MGD is Rs15crore compared
to Rs10crore for conventional water supply system. But, the saving in terms of environmental
protection and human misery is tremendous. With every dam, there is submergence of cultivated
land and forest and the resultant displacement of local population. The record of rehabilitation of
project affected persons is well known. Water Recycling About 80% of distributed water is
discharged as wastewater. If a part of wastewater is treated and re-used, it can cover the
projected demand deficiency. It can also prevent encroaching on a source which can be spared
for other water-scarce areas. An example of water recycling can be seen at Chhatrapati Shivaji
Terminus of the Central Railway which set up a water recycling plant of 0.2million capacity in
1999 at a cost of Rs24lakh. The operational cost of the 0.2million-litre water treatment plant is
Rs10 per kilolitre which is less than the commercial water charges of Rs18. The used water is
collected and treated for cleaning concrete aprons of the railway platforms thus saving potable
water. Water Conservation About 71% of the earth's surface is covered with water but 97% of
this is seawater, 2% is locked in polar ice caps and glaciers and hardly 1% of water is available
as freshwater. Hence, we need to conserve every drop of water. We have got to develop the
habit of using less water and stopping wasteful and luxurious use of water. Given below is a
checklist of Do’s and Don'ts. • Use leak proof cocks, preferably aerated ones, with periodical
replacement of washers. • Do not throw away stored water; water never gets stale. • Use a glass
to rinse after brushing of teeth. It needs only half a litre of water. Keeping the washbasin tap
open while brushing teeth wastes at least four liters of water. • Aerate shower; low flow
showerheads reduce water use by 50% or more. • Bathing needs only 20litres of water. Shower
bath needs at least 80litres and tub bath 110litres of water. Remember the average daily water
need for all purposes is 135litres per day per person but availability is hardly 90litres. • Washing
clothes require 40litres of water; keeping the tap running during washing consumes 250litres of
water. • Water plants with rinse water from the washing machine. •
www.timesofindia.com
• Use a bucket to wash the car, not a hose. Ideally, therefore, the housing complexes
should have proper rain water harvesting system and draw groundwater for non-drinking
purposes. Even if water from bore-wells is used for toilet flushing (50lpcd) and cleaning
(10lpcd), the load on the piped water supply will come down to 50%. This means that the
same piped water supply will be sufficient for double the population. Recycling of the water
used for washing is possible by re-using it for watering the garden, further bringing down the
load on the overworked system. Desalination of sea water will obliterate the need to set up
newer projects that require transporting water from 100km at a high capital cost; it will also
make that resource available to other needy water scarce areas.
There are many agencies that can give guidance and consultation to citizens' groups who
would like to set up the rain water harvesting system in their locality. The bore well water then
can be used for washing and flushing purposes, if the water quality is not suitable for the
drinking purpose. Some rain water harvesting agencies are: • National Water Harvesters
Network (NWHN). • Centre for Environmental Science, Delhi. • Central Ground Water
Authority, Nagpur. • Groundwater Survey & Development Agency, Thane & Pune. Desalination
Mumbai can make use of abundant availability of seawater, desalinate for potable water and
thus, augment water supply instead of going in for complex method of constructing dams &
reservoirs and supporting that system. According to Arvind Deshmukh, Chief Engineer, BARC,
investment in a desalination plant of capacity 10-20 MGD is Rs15crore compared to Rs10crore
for conventional water supply system. But, the saving in terms of environmental protection and
human misery is tremendous. With every dam, there is submergence of cultivated land and
forest and the resultant displacement of local population. The record of rehabilitation of project
affected persons is well known. Water Recycling About 80% of distributed water is discharged
as wastewater. If a part of wastewater is treated and re-used, it can cover the projected demand
deficiency. It can also prevent encroaching on a source which can be spared for other water-
scarce areas.
www.timesofindia.com

The used water is collected and treated for cleaning concrete aprons of the railway
platforms thus saving potable water. Water Conservation About 71% of the earth's surface is
covered with water but 97% of this is seawater, 2% is locked in polar ice caps and glaciers and
hardly 1% of water is available as freshwater. Hence, we need to conserve every drop of water.
We have got to develop the habit of using less water and stopping wasteful and luxurious use of
water. Given below is a checklist of Do’s and Don'ts. • Use leak proof cocks, preferably aerated
ones, with periodical replacement of washers. • Do not throw away stored water; water never
gets stale. • Use a glass to rinse after brushing of teeth. It needs only half a litre of water.
Keeping the washbasin tap open while brushing teeth wastes at least four liters of water. •
Aerate shower; low flow showerheads reduce water use by 50% or more. • Bathing needs only
20litres of water. Shower bath needs at least 80litres and tub bath 110litres of water. Remember
the average daily water need for all purposes is 135litres per day per person but availability is
hardly 90litres. • Washing clothes require 40litres of water; keeping the tap running during
washing consumes 250litres of water. • Water plants with rinse water from the washing
machine. • Sprinkling water on the ground needs 10litres of water but hosepipe watering
consumes 50litres of water. • Throwing glassful water after just few sips wastes 300ml water.
Pour only as much water, as you want, in the glass. • Use a bucket to wash the car, not a hose.
Ideally, therefore, the housing complexes should have proper rain water harvesting system and
draw groundwater for non-drinking purposes. Even if water from bore-wells is used for toilet
flushing (50lpcd) and cleaning (10lpcd), the load on the piped water supply will come down to
50%. This means that the same piped water supply will be sufficient for double the population.
Recycling of the water used for washing is possible by re-using it for watering the garden,
further bringing down the load on the overworked system. Desalination of sea water will
obliterate the need to set up newer projects that require transporting water from 100km at a high
capital cost; it will also make that resource available to other needy water scarce areas.
There are many agencies that can give guidance and consultation to citizens' groups who
would like to set up the rain water harvesting system in their locality
www.timesofindia.com

(NWHN). • Centre for Environmental Science, Delhi. • Central Ground Water
Authority, Nagpur. • Groundwater Survey & Development Agency, Thane & Pune.
Desalination Mumbai can make use of abundant availability of seawater, desalinate for
potable water and thus, augment water supply instead of going in for complex method of
constructing dams & reservoirs and supporting that system. According to Arvind Deshmukh,
Chief Engineer, BARC, investment in a desalination plant of capacity 10-20 MGD is
Rs15crore compared to Rs10crore for conventional water supply system. But, the saving in
terms of environmental protection and human misery is tremendous. With every dam, there is
submergence of cultivated land and forest and the resultant displacement of local population.
The record of rehabilitation of project affected persons is well known. Water Recycling
About 80% of distributed water is discharged as wastewater. If a part of wastewater is treated
and re-used, it can cover the projected demand deficiency. It can also prevent encroaching on
a source which can be spared for other water-scarce areas. An example of water recycling can
be seen at Chhatrapati Shivaji Terminus of the Central Railway which set up a water
recycling plant of 0.2million capacity in 1999 at a cost of Rs24lakh. The operational cost of
the 0.2million-litre water treatment plant is Rs10 per kilolitre which is less than the
commercial water charges of Rs18. The used water is collected and treated for cleaning
concrete aprons of the railway platforms thus saving potable water. Water Conservation
About 71% of the earth's surface is covered with water but 97% of this is seawater, 2% is
locked in polar ice caps and glaciers and hardly 1% of water is available as freshwater.
Hence, we need to conserve every drop of water. We have got to develop the habit of using
less water and stopping wasteful and luxurious use of water. Given below is a checklist of
Do’s and Don'ts. • Use leak proof cocks, preferably aerated ones, with periodical replacement
of washers. • Do not throw away stored water; water never gets stale. • Use a glass to rinse
after brushing of teeth. It needs only half a litre of water. Keeping the washbasin tap open
while brushing teeth wastes at least four liters of water. • Aerate shower; low flow
showerheads reduce water use by 50% or more. • Bathing needs only 20litres of water.
Shower bath needs at least 80litres and tub bath 110litres of water
www.timesofindia.com

• Sprinkling water on the ground needs 10litres of water but hosepipe watering
consumes 50litres of water. • Throwing glassful water after just few sips wastes 300ml water.
Pour only as much water, as you want, in the glass. • Use a bucket to wash the car, not a hose.
Ideally, therefore, the housing complexes should have proper rain water harvesting system
and draw groundwater for non-drinking purposes. Even if water from bore-wells is used for
toilet flushing (50lpcd) and cleaning (10lpcd), the load on the piped water supply will come
down to 50%. This means that the same piped water supply will be sufficient for double the
population. Recycling of the water used for washing is possible by re-using it for watering the
garden, further bringing down the load on the overworked system. Desalination of sea water
will obliterate the need to set up newer projects that require transporting water from 100km at
a high capital cost; it will also make that resource available to other needy water scarce areas.
1. Mumbai Metropolitan Region’s water demand
Mumbai Metropolitan region includes municipal corporations of Greater Mumbai, Navi
Mumbai, Thane, Kalyan-Dombivali, Mira-Bhayandar, Vasai-Virar, Bhiwandi-Nizampur
and Ulhasnagar and an area of around 4500 sq km including MCGM area of 437.71 sq
km (the Island City spans 67.79 sq km, the Suburban district spans 370 sq km; about
165.69 sq km comprising of Defense, Mumbai Port Trust, Atomic Energy Commission
and Borivali National Park is outside the purview of MCGM). The entire region is
overseen by the Mumbai Metropolitan Regional Development Authority (MMRDA).
MMRDA is also funding a number of upcoming projects like Kalu and Shai Dams.
Population of this agglomerate is 20.9 million while that of MCGM alone (biggest
amongst the 8) is 12.47 million. (Census of India, 2011) The region is supplied drinking
water through various sources, some of which date back to the 19th century. These
include the Tansa, Bhatsa and Upper and Lower Vaitarna Dams and Tulsi and Vihar
Lakes for MCGM and some other municipal corporations; More, Hetawane and Barvi
Dams for Navi Mumbai, Kalyan Dombivali, and Ulhasnagar regions, Surya Irrigation
project for Vasai Virar regions, Shahad.
1.1 Chitale Committee Report on future water scenario of Mumbai In the past, water needs and
future scenario of the MCGM, the biggest Municipal Corporation of the MMR,
www.timesofindia.com

1.2 (following the drought in 1992), a committee under the Chairpersonship of Former Water
Resources Secretary Dr. Madhav Chitale was appointed by the State Government to work on
a perspective water plan till 2031 for Mumbai, mainly the MCGM region. The report
popularly known as the Chitale Committee Report, came out in 1993 and suggested ways to
secure water for Mumbai. While it suggested several demand management methods, and
recycling of sewage water, etc., one its pertinent suggestions was to develop new water
sources for MCGM and surrounding regions. It recommended Middle Vaitarna, Kalu, Shai,
Pinjal and Gargai projects to be taken up for supplying additional water. Chitale is known
for his pro large dam’s bias and this was clearly reflected in these suggestions. Of these,
Middle Vaitarna is completed in 2013, though water supply from the dam is not fully
commissioned as yet. Predictably, Chitale Committee report is used to justify these days till
date.
1.2 Justification for new sources based on exaggerated per capita and population projections
Chitale Committee assumed that in 2011, population of MCGM will be 13.79 million.
However, the census 2011 reveals that population of MCGM in 2011 is 12.43 million,
1.36 million less. This brings down water requirement by 326.4 MLD (compare this with
supply from Middle Vaitarna Dam at 455 MLD). The committee also based its future
predictions assuming a per capita supply of 240 lpcd. This figure is huge when we
compare it with other metros3 and is unacceptable. Chitale Committee’s projections both
in terms of per capita water needs and populations have proved wrong. BMC
Commissioner himself has said that Chitale report figures seem off the mark and that
new projections will now need to be developed.4 Water supply figures given by Mr.
Bambale, Dy Commissioner, also falsify the figures in the White paper released by the
BMC (2009).
1.3 Current MCGM has no supply shortfall According to Census 2011; population of Mumbai is
12.5 million, with a majority population, 6.5 million people, living in the slums.
According to Deputy Municipal Commissioner of Mumbai6, slum population gets 100
lpcd (liters per capita per day) and non-slum population gets 200 lpcd water to any water
from BMC.
http://articles.timesofindia.indiatimes.com/2013-06 11/India/39898514_1_population-growth

Total water supply to MCGM at source is 3520 MLD.7 According to the Deputy
Commissioner, per capita water availability currently is greater than 180 lpcd, which is still
higher than water supplied to London (150 lpcd), Singapore (160 lpcd) and Paris (150 lpcd). It is
clear that there is NO current shortfall of water in Mumbai. At the same time, if supply at source
is 3520 MLD and the use is 1983 MLD for drinking water, 260 MLD for commercial and
industrial uses8 and 120 MLD en route supply, there is an additional 1157 MLD water that is
available. That is 32.86% of the current water supplied at source is unaccounted for. It is
assumed that leakages are to the tune of 25% supply at the source (which is very high); we still
have 7.86% water supplied that is unaccounted for. This means 880 MLD of water! Nearly equal
to two large dams Mumbai is planning to build! Significantly, it is being officially stated by the
government that the demand of water for MCGM is in fact 4240 MLD9 and that there is a
current shortfall of at least 720 MLD. Where does this 4240 MLD figure come from? This is
assuming 240 lpcd water supply which is extremely high even by international standards!
Chitale Committee report has based its calculations based on this figure of 240 lpcd. This
extremely high per capita use is unnecessary, unjustified and unacceptable. Especially looking at
the fact that villages where the dams are being planned do not get even 40 lpcd currently. At the
same time, it is clear that slum dwellers and other poor in Mumbai experience severe water
problems, but the answer to this lies elsewhere and not in inadequate sources. The problem lies
closer to home: in transparent and accountable water management, water auditing,
understanding where water is exactly going, fixing leaks and thefts. More importantly, Mumbai,
with average annual rainfall of 3000 mm, needs to use that resource, which it clearly is not
doing. Mumbai also needs to reuse and recycle waste water. The interim report on Ganga River
Basin Management Plan by IIT consortium claims that it is possible to achieve tertiary treatment
of city sewage at Rs 10/KL (2010 price level), which is lower than water production cost in
Mumbai at Rs 11.15/KL. In the name of improving efficiency in water distribution, there was an
attempt (also pushed by the World Bank and Planning Commission) to introduce privatization in
water supply in Mumbai with a pilot in K Ward.
www.timesofindia.com

In Section 2, we have appended brief details about the status of the dams coming up
around Mumbai and their severe impacts as well as the status of Municipal Corporations in
MMR which are demanding water and their performance vis a vis issues like water metering,
auditing, demand management, rainwater harvesting, groundwater recharge, developing local
water sources, reuse of sewage for non-potable uses and related issues. Inescapable
conclusion is that though the Municipal Corporations are vociferously demanding for new
sources, the way they are managing the available resources does not justify such demands.
With the exception of Navi Mumbai Municipal Corporation, other corporations are not
treating even 15% of their sewage. Some Corporations are not treating their sewage at all.
Water auditing is in a dismal state in absence of functioning bulk water meters and there is no
credible account as to how much water is actually supplied to the population. At the same
time, per capita water availability of all the corporations is currently higher than the national
standard of 135 lpcd. In places like Thane Municipal Corporation, it goes as high as 251 lpcd.
As far as we can see, no efforts at demand management have been attempted with sincerity.
Local water sources are being routinely destroyed and rainwater harvesting is not being
implemented with any effectiveness
www.timesofindia.com

MMR’s calculations. Intercity inequity is also striking. While slums do not get any
assured supply of water, affluent areas get even 300-350 lpcd.12 this snapshot illustrates the
dismal water management in MMR region: Thane Municipal Corporation, only 17% sewage
generated is connected to sewer lines. Rainwater harvesting is not pushed or monitored. It
depends on multiple water supply sources. Its current water supply is 251 lpcd, which is
nearly double than the national standards of 135 lpcd. It is still pushing for Kalu Dam, which
will affect 18000 tribals and submerge 1000 hectares forest. In Bhiwandi-Nizampur
Municipal Corporation, there is no sewage treatment as STP is dysfunctional. In fact, 90%
area is not even connected to sewer lines. There is no metering of water supply. Meera
Bhayander Municipal Corporation which is demanding Susari Dam already gets water from
Surya Irrigation project, which was built by submerging tribal lands and for irrigating tribal
lands. Here too, less than 16% sewage is treated. Vasai Virar Municipal Corporation which is
also demanding Susari Dam, does not have a single sewage treatment plant and releases all its
water untreated in natural sources! It also has Zero water metering. The region has 78% no-
development zone which can be useful for rainwater harvesting and local water sources.
Ulhasnagar Municipal Corporation collects barely 16% sewage generated and has 94%
unmetered connections. Kalyan Dombivali Corporation does not collect most of the sewage it
generates and treats barely 15% of the collected sewage. It is demanding increase of height of
Barvi dam and also Poshir Dam. Navi Mumbai Municipal Corporation is relatively better off
in metering and sewage collection counts, but appears water rich already and does not justify
a new dam. It is financing Balganga Dam, which is underway in a blatantly illegal fashion. Its
current supply is 100 MLD higher than its demand and its current sources will be sufficient
for its foreseeable water needs. The data used here is from the respective City Sanitation
Plans which have been prepared by the Municipal Corporations themselves and have been
submitted to the Ministry of Urban Development in March 2012 or Environmental Status
Reports or City Development Plans of the Municipal Corporations. It is clear from the above
that Municipal Corporations in the Mumbai Metropolitan Region are misusing the available
water resources.
http://www.mcgm.ac.in

This is entirely lacking right now Mumbai and neighboring cities have no participatory
governance involving the citizens in planning, decision making and monitoring of various
components of water systems of the cities. In absence of such participatory decision making
processes, citizens also have no role in either natural resource management of the city or in
decisions regarding water sourcing for the cities. Such non transparent and non-participatory
governance invariably leads to unaccountable and unjustifiable decisions that cater to the
vested interests.
2. Dams planned around Mumbai Metropolitan Region In all, 12 dams are planned or are under
construction for supplying drinking water and industrial water to MCGM and Mumbai
Metropolitan Region. (The list is appended at Annex 2 ) These are located in the
Vaitarna, Ulhas and Damanganga Basins and most of the affected regions fall in the
Tribal Sub Plan Region and are schedule areas as per the Panchayats (Extension to the
Scheduled Areas) Act 1996. The projects are in various stages of planning and
completion: Middle Vaitarna Dam is nearly complete, while work on Dams like
Khargihill and Bhugad is yet to start. Of the 12 dams, 9 are in Thane District, 2 in Raigad
District and one in Nashik District. The affected region is a part of the Northern Western
Ghats, a relatively lesser studied region for its eco sensitivity. However, preliminary
studies indicate that the region supports very high biodiversity and most of the region
falls either in Ecologically Sensitive Zone I (ESZ1) as per the Western Ghats Expert
ecology Panel Report headed by Prof. Gadgil or Ecosensitive Area (ESA) as per High
Level Working Group Report, under Dr. Kasturirangan. Dahanu region where Susari
dam is planned falls in Ecologically Fragile Region notification. The region consists of
dry deciduous and moist deciduous forests and includes protected areas like the Tansa
Sanctuary, Reserved forests, sacred groves, community conserved fish sanctuaries,
wildlife corridors and also has notable agro diversity. Affected talukas include Murbad,
Jawhar, Vada, Mokhada, Shahapur, Pen, etc
http://www.mcgm.ac.in

Dahanu under the guise of irrigating tribal lands currently supplies most of its water to
the MMR region Malnutrition, lack of irrigation and serious problems of drinking water are
rampant in the region. Despite falling in Tribal sub plan region, the districts have not made
any notable efforts for development of the region or the tribals. In July 2013, Dr. Narendra
Jadhav, member of the Planning Commission toured villages in Thane district and noted that
Thane District Planning Development Committee (DPDC) has done nothing to improve the
lives of lakhs of tribals in the district. It has not sent any proposal for consideration of the
Planning Commission for implementation. The planned and under construction dams
submerge nearly 22000 hectares of land in this region including nearly 7000 hectares of
forests. The process will affect nearly one lakh tribals in this region. This number is a gross
underestimate as we do not have figures from some dams like Pinjal. Information on the
dams in given in the following section Above: Road to destruction: Dry deciduous forest of
the Ogade region which will be submerged for Gargai Dam. Photo: Parineeta Dandekar Left:
Gorges in Vaitarna River now submerged by Middle Vaitarna Dam Photo: Parineeta
DandekarDams in tribal belt of Western Ghats for the Mumbai Metropolitan Region:
Unjustified Projects – Better options exist __ South Asia Network on Dams, Rivers & People
December 2013 12 2.1 Details of Dams planned for Mumbai Metropolitan Region 1. Kalu
Dam, Murbad, Thane District River: Kalu River, Ulhas Basin, Notified River Water to be
supplied: 416 MCM/1140 MLD (As per MMRDA Letter to KIDC) dated July 2011
Beneficiary: MMRDA: Domestic and industrial purposes Developer: Konkan Irrigation
Development Corporation (KIDC) Total submergence: 2175.561 ha, including 999.328 ha
forests Population Affected: 3169 directly displaced, at least 18,000 affected Status of
Clearances: FAC rejected clearance in May ‘12; FAC recommended clearance in April ‘13
after letter from CM to MoEF; Stage I Forest Clearance given on May 31 ‘13. Final Forest
Clearance not secured. Ground Situation: All 18 affected villages are opposing the project.
All Gram Sabha have passed resolutions against the project. Forest Rights not yet settled.
Also see box: Rejection of Forest Clearance (FC) to Kalu Dam and the legal recourse of
villagers. Contractor: FA Constructions. Contractor started work without Forest Clearance,
which is illegal.
http://www.mcgm.ac.in

Murbad Taluka falls in ESZ I as per the WGEEP Report. Most of the affected villages
fall in ESA as per the Kasturirangan Committee Report and hence, consensus of the local
communities is needed. FAC stage I clearance letter mentions as condition that “The
recommendations of the Kasturirangan committee report will be binding on the state
government and the user agency”. J.K. Tewari, Regional Chief Conservator for Forests
(Central) in his report in Feb 2012: “The area falls in highly sensitive Western Ghats and the
significance is further increased by the fact that it is only 7 km from Kalsubal Wildlife
Sanctuary in Ahmednagar district. Additionally a large number of dams have already been
constructed in the MMR and Reservoirs have been proposed on almost all the remaining
important water courses. So far no EIA, EMP has been conducted in this regard. Therefore it
is essential that a regional EIA for cumulative impact for all existing resources is conducted
for MMR… Forest Diversion Proposal of Kalu was submitted to MoEF in Aug 2011, but
tender notice was issued in July 2009 and work order in May 2012. Responsibility of
clearance was given to contractor. This clearly shows project proponent (KIDC) has no
respect for the law of the land and permission from MoEF was taken as granted… MoEF may
consider mandatory EIA for all large reservoirs and regional EIA for cluster of reservoirs…
FRA is not completed. Social Impact Assessment is not conducted till date as required under
National Rehabilitation Policy, 2007. Starting the work in non forest area without fulfilling
the legal requirements of FRA and FC is absolutely not justified…”.
2. Shai Dam, Shahapur, Thane District River: Shai River, Ulhas Basin, Notified River Water to
be supplied: 348 MCM/ 940 MLD (@ 95% dependability, MMRDA Regional Plan)
(Will last for eastern suburbs till 2020 as per Executive Engineer, Thane) Beneficiary:
MMRDA: Domestic and industrial purposes Proponent: KIDC Total submergence: 3040
hectares Forest Land: 494.1455 ha (over 43,000 trees to be cut) Population Affected:
5124 to be directly displaced, about 25,000 people will be affected Villages Affected/ to
be submerged: 21 Status of Clearances: Does not require EIA or Environmental
Appraisal and clearance. Final Forest Clearance not secured
http://www.mcgm.ac.in

Work on the site has not resumed for last 24 months. Police are stationed at the dam
site, giving it a look of a police camp. All gram Sabhas have passed resolutions against the
project. Forest Rights as per the Forests Right Act not yet settled. Conditional Stage I Forest
clearance has asked noobjection certificate from Gram Sabha of each project affected village.
Contractor FA Constructions Ecological Sensitivity: Murbad falls in ESZ I as per WGEEP
Report which bans large dams in ESZ 1. Most of the affected villages fall in ESA as per the
Kasturirangan Committee Report, hence, an approval from local communities is needed.
Executive Engineer of Thane, in his application for Forest Clearance had written “it is not
necessary to build any new source for Mumbai till 2031”. This was false information as
within months, Kalu Dam, 20 kms from Shai applied for forest clearance.
3. Pinjal Multipurpose Project: River: Pinjal River, Vaitarna Basin Water to be supplied: 834
MCM with 392 MCM for MCGM and 442.5 MCM for Irrigation (As per Municipal
Commissioner’s Letter to MoEF). 865 MLD as per Dy. Commissioner Beneficiary:
MCGM Total submergence: 2000 hectares; total land required is 2114 ha (Municipal
Commissioners Letter to MoEF) Forest Submergence: 1188 hectares Population
Affected: not known Villages Affected/ to be submerged: Not known Status of
Clearances: Has applied for Environmental clearance as a ‘Multipurpose project” with an
irrigation component. Was supposed on agenda for the 69th Expert Appraisal Committee
(Sept 2013) meeting of the MoEF, but was not discussed. Ecological Sensitivity: The
affected region falls in ESZ I as per WGEEP report and ESA as per Kasturirangan
Committee Report Pinjal Dam is a part of the Damanganga Pinjal Link project, a
component of Interlinking of Rivers project under the National water Development
Agency (NWDA). Pinjal Dam will receive inflows from Khargihill and Bhugad dams.
This river link project will involve three massive dams and tunnels through forest area
running for 42.15 kms.
Gargai Multipurpose Project River: Gargai River, Vaitarna Basin Water to be supplied: 180
MCM/440 MLD (Dy. Commissioner) Beneficiary:
http://www.mcgm.ac.in

These include: Ogade, Ghodsakhar, Khodada, Teelmaal, Phanaspada, Pachghar and
Ambal. Status of Clearances: Has applied for Environmental clearance as a ‘Multipurpose
project” with a hydropower component. The project was supposed to be discussed in 69th
EAC meeting of the MoEF (Sept 2013), but was not considered for the meeting. Wildlife
Clearance: Project had applied for Survey and investigation Clearance from the Standing
Committee for the National Board for Wildlife in March 2013. Dr. Asad Rahmani, BNHS,
also a member of NBWL was supposed to submit a Site Inspection Report. However, the
report could not be submitted and now the term of NBWL is over. Ground situation: Locals
are opposed to the project, Forest Rights as per the Forest Rights Act have not been settled.
Locals do not have a clear idea about the project or its impacts. No information has reached
them. Ecological Sensitivity: The affected region falls in ESZ I as per WGEEP report and
ESA as per Kasturirangan Committee Report. In its submissions to the NBWL on Gargai, the
MCGM has claimed that Shai project is not for drinking water supply of Mumbai. This is
entirely false. The project is being funded by the MMRDA!
5. Balganga Dam River: Balganga River, Patal Ganga basin, Pen Taluka, Raigad District Water
to be supplied: 127.76 MCM, 350 MLD Beneficiary: Navi Mumbai Municipal
Corporation Funded by: CIDCO Total submergence: 1240 hectares Forest Submergence:
265 hectares Population Affected: about 8000 Villages Affected/ submerged: not known
Status of the project: Nearly complete. Only channel filling is to be done. No
resettlement/ rehabilitation yet. Status of Clearances: Involves 265 hectares of forest
land, but has not applied for forest clearance with the MoEF, which is illegal. Ground
situation: Strong opposition to the project, Forest Rights as per the Forest Rights Act
have not been settled. Contractor: FA Enterprises Contractor and proponent (FA
Enterprises and KIDC) are so blatant in their disregard of environmental and other laws
that they have challenged the activists that they will get all the clearances before last
10% work is completed!
6. Susari Dam, Dahanu Taluka, Thane District River: Susari River, Ulhas basin Water to be
supplied: 67.7 MCM Beneficiary: Vasai-Virar Municipal Corporation Contractor: FA
Enterprises Proponent: KIDC Total submergence: 971 hectares (Source: KIDC Tender
Document) Forest Submergence: 144 hectares Population Affected
http://www.mcgm.ac.in
Does not have a Forest Clearance. The proponent (KIDC) has asked the contractor (FA
Enterprises) to secure it! Ground situation: Very strong opposition to the project13 ,
predominantly tribal region. Forest Rights as per the Forest Rights Act have not been settled.
Ecological sensitivity: Dahanu Taluka falls in Ecologically Fragile Area, as notified by the
MoEF.14 KIDC Tender documents put 50 points of the total 200 for “experience of the
contractor in getting forest clearances!” This is shocking and illegal.
7. Khargihill Dam River: Wagh River, Damanganga Basin Water to be supplied: 420 MCM
Beneficiary: MCGM Total submergence: 1558 hectares (Source: NWDA Feasibility
Study Damanganga Pinjal Link) Forest Submergence: 734 hectares Population and
villages affected: 10 Villages & 1484 people (Feasibility Study done in 1993). It is now
estimated that the population of these 10 villages is over 5000. Status of the project:
Survey conducted. Location of the project is said to be shifted slightly in the upstream
from the original proposal Status of Clearances: No clearances are yet in place Ground
situation: Very strong opposition to the project15 from the predominantly tribal region.
Forest Rights as per the Forest Rights Act have not been settled. Survey was opposed,
but may have been done. Note: Khargihill Dam forms a part of the Damanganga-Pinjal
Link Project under the ILR, NWDA Contractor: not known Ecological sensitivity: Parts
of affected area fall in ESA according to Kasturirangan Committee (HLWG) report.
8. Barvi Dam River: Barvi River, Ulhas Basin, Badlapur, Thane District Water to be supplied:
338.84 MCM Beneficiary: Thane Municipal Corp, Kalyan Dombivali Municipal Corp,
Ulhasnagar Municipal Corporation Total submergence: 4442.03 hectares of all stages
(1,2 and 3)(Source: RTI) Forest Submergence: 513.66 hectares (only for stage 3)
Population and villages affected: 18 Villages. 12 in 1st and 2nd stage and 6 in the
ongoing 3rd stage. 200 families were affected during 1st and 2nd stages and 765 families
are being affected in the 3rd ongoing stage. Total comes to approximately 5825 people
affected. Status of the project: As per the RTI, work is supposed to be on going on the
3rd stage since 1999! Status of Clearances: MIDC says it received FC in 2000 Ground
situation
http://www.mcgm.ac.in

“We are being uprooted once again from the land we were given for rehabilitating us
then.’’ Villager who was resettled for the third time for Barvi Dam
2.2 Serious Issues concerning planned and under construction projects: 1. Exclusion from
Environmental Appraisal Process: The Environmental Impact Assessment (EIA)
Notification 2006 excludes drinking water and industrial water supply dams from its
ambit. This means all such projects will be excluded from Environment Impact
Assessment, Environment Monitoring, public hearing, and Environmental Management
Plan to mitigate their impacts on the communities and ecosystems by the MoEF. The
MoEF officials tell us that this blunder reflecting on the environmental illiteracy of the
drafters of EIA notification happened due to some “slip of pen”! But the officials have
not found it necessary to correct this. SANDRP and several other organizations have
protested from time to time about this exclusion. 16 Most of the dams around the MMR
region will hence be excluded from the environmental clearance process despite their
immense impacts. Absence of Environmental Appraisal and Public hearing takes away
the only opportunity available on paper to local communities to record their protests. We
hope that this is urgently addressed and amended. 2. No options assessment: The MMR
region has not conducted any serious options assessment study, which integrates demand
side and supply side options like rainwater harvesting, local water systems, sewage
treatment and reuse, demand management, efficient and equitable water use, zone wise
water audit, etc. Such Options assessment should form the first step before supply
augmentation. Groundwater Without any serious study, the Chitale Committee report has
opined that groundwater is not an option for MMR region due to issues of salinity and
distribution. This is clearly a wrong conclusion and this option also needs to be looked
into considering also the high rainfall in the region and implied option of groundwater
recharge wherever usable groundwater aquifers exist. Indiscriminate use of groundwater
currently by BMC itself17 and others could lead to destruction of this important source
and hence regulation of groundwater use is equally important. Rainwater Harvesting On
Rainwater harvesting too (for details see box: Rainwater harvesting is possible and
necessary)
http://www.mcgm.ac.in

However, 1500 MLD of that at Bandra only involves primary treatment of screening
and then dumping the same in sea. Another 80 MLD Power lake based bio-remediation plant
was found to be working in “Very Poor” way as per 2007 CPCB Operation and Maintenance
Inspection report.
Reuse of treated Urban Sewage Reuse of treated sewage is another little explored option in
MMR, even though there are examples that show this should be possible. Sagar Upvan, a
Botanical Garden under Mumbai Port Trust in Colaba is watered using treated sewage. This
provides a good example of grey water can be reused20 . The BMC has approved the bylaws
that grey water recycling is mandatory for every residential building spread over 2,000 sq m or
having more than 60 dwellings. However, the bylaws have not been implemented so far.21 The
12th Five Year Plan Working Group on Urban Water states that rather than focussing only on
supply management, Investments in water supply must focus on demand management, reducing
intra-city inequity and on quality of water supplied. Local Water sources: MMR has been paying
no attention to developing its local, available water osurces. Municipal Corporatons like Vasai
Virar, Kalyan Dombivali, Navi Mumbai have a wealth of local water sources by way of lakes
and tanks. These are being indiscriminately polluted and encroached. According to Dr. Mihir
Shah, Member, Planning Commission and 12th Fiver year Plan Working group on Urban and
Industrial water, ‘Each city must consider, as first source of supply its local water bodies.
Therefore, cities must only get funds for water projects, when they have accounted for the water
supply from local water bodies and have protected local water bodies and their catchments. This
precondition will force protection and will build the infrastructure, which will supply locally and
then take back sewage also locally”22 3. Unstudied Cumulative Impacts: The projects and allied
activities like displacement and resettlement, deforestation, road construction, blasting, mining
for construction materials, change in hydrology of rivers, muck disposal, workers colonies and
waste disposal, new workforce in forest and tribal areas, impacts on flora and fauna, downstream
impacts, etc., will have profound cumulative impacts on tribal communities and threatened
ecosystems.
http://www.TMC.ac.in/water demand

This condition has been carried forward in the stage I forest clearance (for 999.328 ha
forest land) letter dated May 31, 2013. However, we see no steps being taken in this Climate
Change In the context of changing climate, protection of forests, biodiversity and rivers should
be a priority considering the large dependence on these resources for livelihoods and adaptation.
The kind of destruction that Mumbai and surrounding urban areas are inviting through advocacy
for more and more such unjustifiable dams and in the process destroying these natural resources
will not only be disastrous for the local people, but even for these very cities. The July 26, 2005
flood disaster in Mumbai showed how the neglect of city’s river system multiplied the woes of
the city24 . The Mithi River (as also Oshiwara, Poisar, Ulhas and Dahisar rivers) of the city has
been destroyed first by building of dams (Vehar (1860), Tulsi (1885), Powai) and then
encroachments. According to Concerned Citizens’ Commission: An Enquiry into the Mumbai
Floods 2005, Mumbai has lost about 40 per cent of its mangroves between 1995 and 2005, some
to builders, and some to encroachments and garbage dumps. Much of the Bandra-Kurla
Complex (BKC) has been created by replacing such swamps and mangrove areas. 4. Illegalities
and Irregularities: Construction of projects like Balganga and Kalu was started without securing
Forest Clearance. This is a violation of Forest Conservation Act (1980) Rehabilitation:
Comprehensive and credible rehabilitation Plans have not been prepared for Balganga and Kalu
Dams, and work orders have been issued, in complete violation of the rights and justice for the
affected people, and violation of national and state R&R policies. 5. Unbelievable Cost
escalations: 24 Mumbai under Floods A Natural Disaster or Manifestation of an Underlying
Conflict in Mumbai City's Skewed Urban Planning? By Nidhi Jamwal in Prasad Eklavya, K. J.
Joy, Suhas Paranjape, Shruti Vispute, (Ed.), 2012, Agony of Floods: Flood Induced Water
Conflicts in India, Pune: Forum for Policy Dialogue on Water Conflicts in India.Dams in tribal
belt of Western Ghats for the Mumbai Metropolitan Region: None are justified – Better options
exist __
http://www.TMC.ac.in/water demand

Irrigation Department in collusion with each other pushed unjustified cost escalations,
causing a huge loss to the public exchequer. 6. Favoring a single contractor for multiple projects,
violating stated regulations (FA Enterprises & FA Constructions, with close ties with ruling
political parties) Kalu Dam (Thane), Shai Dam (Thane), Balganga Dam (Raigad), Susari Dam
(Thane), Chanera Dam (Raigad) among other dams have all been awarded by the Konkan
Irrigation Development Corp (KIDC) to a single contractor: FA Enterprises/ FA Constructions
(both are same companies with same registration address, telephone numbers, and several other
significant aspects). This is violation of Tender notice issued by KIDC, which states: Clause no.
18: Restriction on Awarding Number of Contract: Notwithstanding the fact that the contractor
satisfying eligibility criteria, no contractor/Joint Venture (J.V.) will be considered for the
qualification for this work if he/any partner to J.V. has been already awarded three works of
Dams within the jurisdiction of Konkan Irrigation Development Corporation after formation of
KIDC. 25 http://timesofindia.indiatimes.com/city/navi-mumbai/18-months-and-3-panels-later-
Balganga-dam-stillstalled/articleshow/22826928.cmsDams in tribal belt of Western Ghats for
the Mumbai Metropolitan Region: None are justified – Better options exist __ South Asia
Network on Dams, Rivers & People December 2013 25 3. Performance of MMR Cities: Water
supply efficiency, Sewage treatment, metering, etc., Thane Municipal
http://www.TMC.ac.in/water demand

Thane Municipal Corporation
Population (2011 Census): 1.8 million Water supply: Very high at 251 lpcd! Sources: 460
MLD water from various sources: Thane Municipal Corp sources: 200 MLD MCGM: 60 MLD
Maharashtra Industrial Development Corp: 100 MLD Shahad-Temghar Water Supply Authority:
100 MLD Sewage Treatment: Only 17% of sewage in Thane is connected to sewer systems and
is treated, rest flows untreated, into the Ulhas River. Options assessment: In 2011-12 RWH
system was fitted on just 256 buildings (Thane Environment Status Report 2012
http://www.thanecity.gov.in/uploadpdf/ESR%202012%20English.pdf) Projections: 470 MLD in
2012 and 536 MLD in 2031 May get water from Kalu Dam
www.BMC.gov.ac.in/water supply

Bhiwandi Nizampur Municipal Corporation
Population: 8, 11,000 Water Supply: 112 MLD 162.22 lpcd as per City Sanitation
Plan Estimated sewage generated: 88 MLD. Sewage Treatment: No Sewage Treatment as
Sewage Treatment Plant has been dysfunctional since 2005. 90% area not connected to
sewerage network. No Metering exists Water Sources: 35 MLD from Tansa and Vaitarna
mains of the Bombay Municipal Corporation, 3 MLD from Varhala Lake and balance 74
MLD from the Shahad Temghar water works (STEM) (Data from: City Sanitation Plan,
March 2012)
www.BMC.gov.ac.in/water supply

Meera- Bhayander Municipal Corporation
Population: 8,14,000 (Census 2011) Current Water Supply: 116 MLD Sewage treatment:
less than 16% sewage is treated Water Sources: Receives 86 MLD from Shahad Temghar water
works and 20 MLD from MIDC (City Sanitation Plan, 2012) In 2011, High Powered Committee
approved diversion of 67.18 MCM (184 MLD) water from Surya Irrigation Project to MMRDA.
Meera Bhaynder is demanding for 200 MLD (73 MCM) from Surya Irrigation Project. It is also
demanding Susari Project.
www.BMC.gov.ac.in/water supply
Navi Mumbai Municipal Corporation
Population: 11,19, 477 (Census 2011) Water Supply: 402 MLD (ESR, 2012-13) Sources:
350 MLD water is received from More dam, 52 MLD from MIDC (Barvi Dam).
(Environment Status Report of NMMC 2012-13) Reports also suggest that Navi Mumbai gets
52 MLD water from Hetawane Dam, CIDCO.) CIDCO (City and Industrial Development
Corp), which plays the role of MCGM here, says: More Dam supplies 330 MLD to NMMC,
while has the capacity to supply 450 MLD. 185 MLD of the 350 MLD from Hetawane Dam
is also utilized by CIDCO. City Sanitation Plan of the NMMC submitted to the MoUD
(March 2012) states that total water supply is 334 MLD, while the demand is 234 MLD; so
per capita supply is 195 lpcd. (As we see there is a contradiction between ESR and CCS
figures) Water requirement of NMMC is estimated to reach 500 MLD at the end of 2042 as
per various water supply forecasts carried out by NMMC. But there seems to be enough
water available! Sewage Treatment: 8 sewage treatment plants exist. Unlike most
municipalities in MMR, Most of NMMC is connected to sewerage network. However, reuse
of treated sewage here too is very low at 0.34 %. It is expected to grow to 11% by 2015-16,
which also is low. It is still demanding and funding Balganga Dam
www.BMC.gov.ac.in/water supply

METHODOLOGY

SAMPLING
Define:- The population on the people of Kalyan.
Selecting a sampling From:-
Voter ID, Aadhar Card, Residential Proof.
Sampling Method:-
Non Probability.
Sample size =120
Details of sample:-
Gender : Male and Female
Age:- Above 18 years.

Sample size:-
In order to determine sample size we are using following formula.
N=(Z s/E)*(Z s/E)
Where ,
Z= Accuracy
s = Standard Deviation
E= Tolerance limit
N= Sample size
Calculations:-
E=5%
S=0.58
Z=95%
N=(Z s/E)*(Z s/E)
N=(0.95*0.58/0.05)*(0.95*0.58/0.05 )
=120
Hence sample size is 120.

Classification of sample:
Male
Female
Vitthalwadi
10
10
Bhivandi
10
10
Thane
10
10
Ulhasnagar
10
10
Ambernath
10
10
Badlapur
10
10
Total
60
60
PRIMARY DATA COLLECTION:-
We will be collecting the data through primary data collection method.
And for that we will be using sampling and done survey.
Grand Total
120

DATA ANALYSIS
Data gathered through inferences drawn from the secondary data and the calculations
performed on the historical data will be integrated with the help of Microsoft Office-excel.
The study will also extend its scope through technical analysis with the use of graphs
of time-series, pie Graph, bar Graph, means plots to extent the research horizon and to prove
research hypothesis.

Question 1:- What is the main source of drinking water of your household?
Table No.1: Sources of drinking water.
Categories
Piped
Water
Public
Tap
Tube
Well
Bottled
Water
Tanker Total
Peoples in Numbers 44 30 25 8 13 120
Peoples in Percentage 36.67% 25% 20.8% 6.67% 10.8% 100.00%
Source: Data given from respondent from table no.1
Graph No.1:-
Source: Data taken from table no.1
Interpretation of Data:
Majority of the people said that they use the water supplied by the KDMC pipe line &
they consist 36.67% of the total sample size.25% of the people use public tap for the water.
However, 10.83% people are depending on the water provided by tanker, where 20.83%
makes use of tube well for the purpose. Moreover 6.67% people make use of bottled water
for drinking purpose.
36.67%
25.00%
20.83%
6.67%
10.83%
0.00%
5.00%
10.00%
15.00%
20.00%
25.00%
30.00%
35.00%
40.00%
Piped water Public Tap Tubewell Bottled Water tanker

Question 2:-Rate the quality of water supply at your household on the scale
(1 to 5)?
Table No.2: Rating the quality of water.
Categories 1 2 3 4 5 Total
Peoples in Numbers 16 24 42 20 18 120
Peoples in Percentage 13.3% 20% 35% 16.6% 15% 100.00%
Source: Data given from respondent from table no.2
Graph no 2:-
Source: - Data taken from table no 2
Interpretation of Data:
The survey reveals that, majority of the people i.e.35% rated the quality of the water
on the water on the scale of 3&only 13.33% people rated the quality of the quality of the
water on the scale of 1.
1
2
3
4
5
13.33%
20.00%
35.00%
16.6%
15.00%

Question 3:- Does the water of your home have different odour?
Table No.3:-Water with different odour.
Categories Yes No Total
Peoples In Numbers 32 88 120
People in Percentage 26.67% 73.33% 100.00%
Source: Data given from respondent from table no.3
Graph no 3:-
Source: data taken from table no 3
Interpretation of Data:
From the above table, we can conclude that 73.33% of the people disagreed that
the water had odour. Whereas 26.67% agreed that the water had different odour. So the
majority of the people believe that the water is odour free.
Strongly Agree
Agree
Yes,26.67%
No,73.33%

Question 4:- What is the taste of water?
Table No.4: Taste of Water.
Categories Saline Tasteless Sweet Total
People in Numbers 20 55 45 120
People in Percentage 16.67% 45.83% 37.50% 100.00%
Source: Data given from respondent from table no.4
Graph no 4 :-
Source: Data taken from table no 4
Interpretation of Data:
The survey reveals that, majority of the people i.e. 45.83% people feel that the
water is tasteless. However, 37.50% people feel that water taste sweet & only 16.67%
people feel that water taste saline.
Strongly Agree
Agree
Neutral
16.67
37.50%
45.83%

Question 5:- Do you observe muddy in water during rainy season?
Table no.5:- Supply of muddy water.
Categories Sometime Often Rarely Never total
Peoples in Numbers 10 12 40 58 120
People in Percentage 8.33% 10.00% 33.33% 48.33% 100.00%
Source: Data given from respondent from table no.5
Graph no 5:-
Source: Data taken from table no 5
Interpretation of Data:
The survey reveals that, majority of the people i.e. 48.33% people observed that
the water supplied is never muddy. On the other hand, only 10.00% people experienced
that the water supplied is often muddy.
0.00%
5.00%
10.00%
15.00%
20.00%
25.00%
30.00%
35.00%
40.00%
Strogly Agree Agree Neutral Disagree
48.33%
33.33%
10.00% 8.33%

Question 6:- Do you feel major diseases spreading in Kalyan are due to
water born disease?
Table no.6: Diseases spreading in Kalyan are due to water born disease.
Categories Strongly
Agree
Agree Neutral Disagree Strongly
Disagree
Total
People in Number 14 34 38 24 10 120
People in Percentage 11.67% 28.33% 31.67% 20.00% 8.33% 100.00%
Source: Data given from respondent from table no.6
Graph no.6:-
Source: Data taken from Table No.6
Interpretation of Data:
The survey reveals that, majority of the people i.e. 31.67% people feel neutral about the
scenario, whereas 28.33% people agreed that majority of the diseases spreading in Mumbai
are water born & only 11.67% people strongly agreed with the statement.
11.67%
28.33%
31.67%
20.00%
8.33%
Strongly Agree
Agree
Neutral
Disagree
Strongly Disagree

Question 7:- What you usually do to make water safe for drinking?
Table No.7: Methods to make the water safe for drinking.
Categories Boil Add
chlorine
Use Filter Let it stand &
settle
Total
People in Number 30 25 50 15 120
People in Percentage 25.00% 20.83% 41.67% 12.50% 100.00%
Source: Data given from respondent from table no.7
Graph no 7
Source: Data taken from table no 7
Interpretation of Data:
The survey reveals that, majority of the people i.e. 41.67% people use a filter to make the
water safe for drinking, whereas, 25% people prefer to boil the water, 20.83% prefer to add
chlorine or bleach & only 12.5% people allow the water to stand & settle.
0.00%
10.00%
20.00%
30.00%
40.00%
Strogly Agree Agree Neutral Disagree
12.50%
41.67%

Question 8:- How frequency the water storage tank is been clean in your
complex?
Table No.8: Frequency f cleaning storage tanks.
Categories Monthly Quarterly Half Yearly Yearly Total
Peoples in Numbers 30 45 25 20 120
People in Percentage 25.00% 37.50% 20.83% 16.67% 100.00%
Source: Data given from respondent from table no.8
Graph no 8:-
Source: Data taken from table no 8
Interpretation of Data:
As per the data, 25% of the people said, they do conduct cleaning work of water storage
on monthly basis. However, 37.5% People said that cleaning is done on quarterly basis.
20.83% & 16.67% people said that cleaning is done half-yearly & yearly respectively.
Piped water 41%
Public Tap 28%
Tubewell 23%
Bottled Water 8%

Question 9: Does your area conduct potable water test after cleaning the
water tank?
Table No.9:Conducting potable water test.
Categories Sometimes Often Rarely Never Total
Peoples in Numbers 32 40 26 22 120
People in Percentage 26.67% 33.33% 21.67% 18.33% 100.00%
Source: Data given from respondent from table no.9
Graph no 9:
Source: Data taken from table no 9
Interpretation Data:
The survey reveals that 33.33% of the people often carry out the portability test.
However, 18.33% of the people voted other way round i.e. they never conducted the test.
21.67% of sample size carried out the test rarely & 26.67% think that sometimes they do
conduct portability test after cleaning the water tank.
Strogly Agree
Agree
Neutral
Disagree
26.67%
33.33%
21.67%
18.33%

Question 10:-Do you feel that the water supply by the KDMC is reasonable
enough for the quality of water that tank supply?
Table No.10: Responsibility of water tariff in term of its quality.
Categories Strongly
Agree
Agree Neutral Disagree Strongly
Disagree
Total
People in Number 16 30 43 12 19 120
People in Percentage 13.33% 25.00% 35.83% 10.00% 15.83% 100.00%
Source: Data given from respondent from table no 10
Graph no 10:
Source: Data taken from table no 10
Interpretation of Data:
The survey reveal that 35.83% of the people feel neutral about the responsibility of
water tariff is responsible enough whereas 15.83% people strongly disagree terms of
water tariff.
0.00%
5.00%
10.00%
15.00%
20.00%
25.00%
30.00%
35.00%
40.00%
Strogly Agree
Agree Neutral Disagree Strongly Disagree
15.83%
10.00%
35.83%
25.00%
13.33%

HYPOTHESIS TESTING
Hypothesis Set:-1
HO: KDMC does not have impact on quality of water supply in Kalyan.
H1: KDMC have impact on quality of water supply in Kalyan.
Table No.2: Rating the quality of water.
Categories 1 2 3 4 5 Total
Peoples in Numbers 16 24 42 20 18 120
Peoples in Percentage 13.3% 20% 35% 16.6% 15% 100.00%
Source: Data given from respondent from table no 2
Graph no 2
Source: - Data taken from table no 2
Interpretation of Data:
The survey reveals that, majority of the people i.e.35% rated the quality of the water
on the water on the scale of 3&only 13.33% people rated the quality of the quality of the
water on the scale of 1.
Thus H0 is rejected and H1 is accepted.
1
2
3
4
5
13.33%
20.00%
35.00%
16.6%
15.00%

Hypothesis Set: - 2
Question 2:-Rate the quality of water supply at your household on the
scale (1 to 5)?
Table No.2: Rating the quality of water.
Categories 1 2 3 4 5 Total
Peoples in Numbers 16 24 42 20 18 120
Peoples in Percentage 13.3% 20% 35% 16.6% 15% 100.00%
Source: Data given from respondent from table no 2
Graph no 2:-
Source: - Data taken from table no 2
Interpretation of Data:
The survey reveals that, majority of the people i.e.35% rated the quality of the water on the
water on the scale of 3&only 13.33% people rated the quality of the quality of the water on
the scale of 1.
Thus H0 is rejected and H1 is accepted.
1
2
3
4
5
13.33%
20.00%
35.00%
16.6%
15.00%

Hypothesis Set:-3
Question 4:- What is the taste of water?
Table No.4: Taste of Water.
Categories Saline Tasteless Sweet Total
People in Numbers 20 55 45 120
People in Percentage 16.67% 45.83% 37.50% 100.00%
Source: Data given from respondent from table no.4
Graph no 4 :-
Source: Data taken from table no 4
Interpretation of Data:
The survey reveals that, majority of the people i.e. 45.83% people feel that the
water is tasteless. However, 37.50% people feel that water taste sweet & only 16.67%
people feel that water taste saline.
Thus H0 is rejected and H1 is accepted.
Strongly Agree
Agree
Neutral
16.67
37.50%
45.83%

FINDING
1. The number of people using piped water is more as compared to other source. So
these people are dependent on KDMC as they provide piped water.
2. As 10 % people find that the water supplied to them is muddy often. Hence
improvement is need in quality of water supply.
3. Moreover 25.83% people feel that the water tariff is unreasonable as compared to the
quality supplied by KDMC.
4. Quality of water is rated on the scale of 1-5 and 33.33% people have rated it on the
scale of 1-2 which is the lowest where as 35% people fell that the water quality is just
average.
5. Out of the total sample size 36.67% people utilized piped water, 25% use public tap,
20.83% use tube-well, 6.67% use bottled water & rest 10.83% make use of tanker as
source of water.
6. As 10% people find that the water supplied to them is muddy often. Hence
improvement is need in quality of water supply.
7. Moreover 405 people agree that the majority diseases spreading in Mumbai are due to
water borne diseases and 31.67% people feel neutral about the same.
As 10% people find that the water supplied to them is muddy often & 8.33% have observed
the phenomenon sometimes. Hence improvement is need in quality of water supply.

Limitation of surveys:
Constraints to using surveys to gather data:
Limited access to the concerned population
The lack of time to carry out a survey
The lack of funding necessary to carry out a survey
The lower priority for carrying out a survey because of competing urgent tasks.

CONCLUSION

CONCLUSION
We have interviewed and surveyed 120 samples and we concluded that from the
quality of water supply in Kalyan is good enough the residents in Kalyan are satisfied with
the quality of water which s supplied to them daily. This we are concluding by our
questionnaire survey with the residents residing in Kalyan
But few of them stated that, may be major viral disease are due to bad quality of
water supply and they want to improve that, which can be done by KALYAN DOMBIVALI
MUNCIPAL CORPORATION.
Last but not the least; we could that quality of water supply in Kalyan does not
require much improvement according to then residents here.

APPENDICES
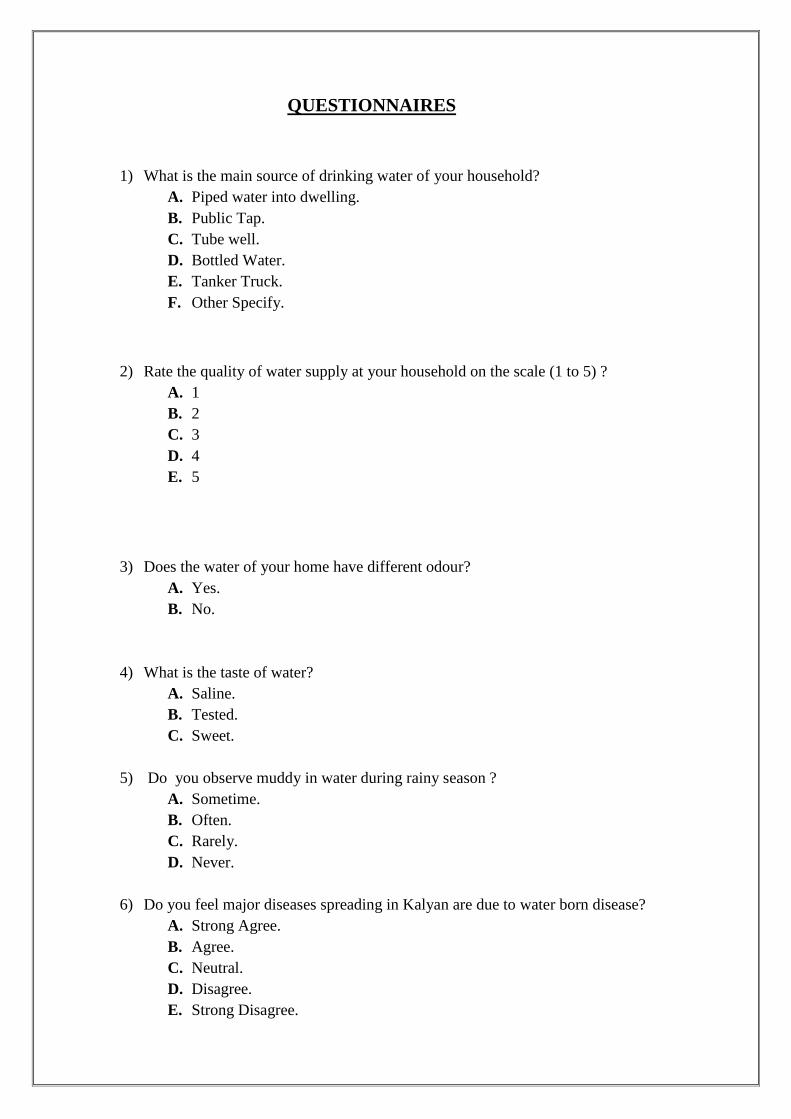
QUESTIONNAIRES
1) What is the main source of drinking water of your household?
A. Piped water into dwelling.
B. Public Tap.
C. Tube well.
D. Bottled Water.
E. Tanker Truck.
F. Other Specify.
2) Rate the quality of water supply at your household on the scale (1 to 5) ?
A. 1
B. 2
C. 3
D. 4
E. 5
3) Does the water of your home have different odour?
A. Yes.
B. No.
4) What is the taste of water?
A. Saline.
B. Tested.
C. Sweet.
5) Do you observe muddy in water during rainy season ?
A. Sometime.
B. Often.
C. Rarely.
D. Never.
6) Do you feel major diseases spreading in Kalyan are due to water born disease?
A. Strong Agree.
B. Agree.
C. Neutral.
D. Disagree.
E. Strong Disagree.

7) What you usually do to make water safe for drinking ?
A. Boil.
B. Add Chlorine.
C. Use a Water Filter.
D. Let it Stand, Settle.
E. Other.
8) How frequency the water storage tank is been clean in your complex?
A. Monthly.
B. Quartly.
C. Half Year.
D. Yearly.
9) Does your area conduct potable water test after cleaning the water tank?
A. Sometimes.
B. Often.
C. Rarely.
D. Never.
10)Do you feel that the water supply by the KDMC is reasonable enough for the quality
of water that tank supply?
A. Strong Agree.
B. Agree.
C. Neutral.
D. Disagree.
E. Strong Disagree.

EXECUTIVE SUMMARY
As Kalyan being a crowded city many disease and other health problems were occurring just to
know whether, the diseases are rising due to water supplied by the KDMC. We looked forward
to do a research on quality of water supply in Kalyan.
The sample size was 120 in our research. We used descriptive design for our research. We
mainly targeted the me most crowded areas on Kalyan and the areas on Mumbai and the areas
where population is old (living for minimum 9 years) such as Vitthalwadi, Bhivandi, Thane,
Ulhasnagar, Ambernath & Badlapur.
INTRODUCTION
Safe drinking water is essential for human existence. Hence, the right to adequate drinking
water is considered as fundamental human right (Ramachandraiah C. (2001), Kanmany J.C.
(2003)). The proportion of urban population of India is projected to increase from 28 per cent
of the total population to about 38 per cent in 2026. The higher growth of urban population
will add further pressure on provision of these services (MoF 2009).
PROBLEM STATEMENT:
To study the quality water supply in kalyan.
OBJECTIVES OF THE STUDY
To study the impact of water supply KDMC. To study the impact of water source of KDMC
To study the water distribution system of KDMC
HYPOTHESIS
Set 1 H0: KDMC does not have impact on quality of water supply Kalyan.
H1: KDMC have impact on quality of water supply Kalyan
Set 2
H0:-Water source do not have impact on quality of water supply in Kalyan.
H1:-Water source do not have impact on quality of water supply in Kalyan.

Set 3
H0:-Distribution system does not have impact on quality of water supply in
Kalyan
H1:-Distribution system has impact on quality of water supply in Kalyan.
LIMITATIONS OF THE STUDY Constraints to using surveys to gather data:
Limited access to the concerned population
The lack of time to carry out a survey
The lack of funding necessary to carry out a survey
LITERATURE REVIEW
The current literature on the paper measures the demand and supply of water in Municipal
Corporations in kalyan and dombivali. The demand for drinking water is continuously increasing due to
growth of population, industrialization and commercial units. Drinking water is not provided on a
sustainable basis in the municipal corporations. Water has price in terms of time, space, quality and
quantity. But water tariffs are not high and uniform across the municipal corporations. They do not have
funds to invest in water supply projects.
Sampling Strategy Sample size was 120 samples were selected by using probability methods
Questionnaire The questionnaire of the research was comprised of 10 questions. All questions were relevant
to the research objective and hypothesis statement.
Research Proposal Research Proposal of the research was comprised of Executive Summary , Problem
Statement, Research Objective, Hypothesis, Research Design, Importance of Study,
Literature Review Plan, Data Analysis, Time and Money Budget, Pert Chart ,Limitation And
Experience of Researcher.
Data Analysis Data Analysis of research was comprise of questions, responses to the question in the
tabulated form, appropriate graph such as bar graph, pie chart and interpretations of the
responses to the questions in the questionnaire.

RESEARCH PROPOSAL
PROBLEM STATEMENT:
To study water supply of KDMC.
RESEARCH OBJECTIVE:
To study the impact of KDMC in Kalyan.
To study the impact of water sources of Kalyan.
To study the impact of distribution system in Kalyan.
RESEARCH DESIGN:-
The following research design method will be implementing:
Descriptive Research Design
&
Exploratory Research Design
HYPOTHESIS STATEMENT:
HO: KDMC does not have impact on quality of water supply in Kalyan.
H1: KDMC have impact on quality of water supply in Kalyan.
HO: Water source of Kalyan does not have impact on quality of water supply in Kalyan.
H1: Water source of Kalyan have impact on quality of water supply in Kalyan.
HO: Distribution system does not have impact on quality of water supply in Kalyan.
H1: Distribution system has impact on quality of water supply in Kalyan.

DATA COLLECTION PLAN:
The primary and secondary data will be collected by means of:
Survey:-
Conducting Survey of 120 people residing in suburbs of Kalyan.
Questionnaires :-
Asking people to fill questionnaires from Kalyan Region & Literature review.
SAMPLING PLAN:-
The sampling plan will be implement as follows:
Target population -
People above 18years of age & irrespective of their profession
Sampling Frame:-
People who live in suburbs of Kalyan.
Sample Size –
Here sample size is 120.
Sampling Method:-
Simple Random Sampling.
STATISTICAL TOOLS USED:-
The following statistical tool will be used:
Standard deviation. (SD)
QUALIFICATION OF RESEARCHER:
All four member of our group are 2nd
Sem M.M.S Students.

LITERATURE REVIEW PLAN
Internet-
We are collecting data from various sources like article, E-Blogs & reviews
from various experts from that particular field.
SR
NO
Websites Books Journals Literatures
1 www.wikipedia.com Water quality
and treatment.-
McGraw-Hill
Water
research
journals -
Elsevier
-
2 www.KDMC.co.in Monitoring
water quality –
Elsevier
Sustainability
Of water
quality &
ecology
Elsevier
-
3 http://www.bept.org.in/webadmin/p
ublication/publicimages/watersupply
- - -
4 http://theory.tifr.res.inkalyan/amenit
ies/water/
- - -
5 http://watercommunicstion.blogspot.
in/2013/14/studies-confirm-poor-
water-quality-in.html
- - -

Historical Data-
1. Data published in Newspaper’s.
-www.timesofindia.com
-http://www.hindustantimes.com
2. Data published in articles’.
-The polytechnics of water supply in Kalyan.
Mr.Pramod Kulkarni. and Engineer water department Kalyan.
-water contamination in city touches alarming levels.
Vaishnavi C, Shekhar, TNN.

BUDJETRY & SCHEDULE
SR
NO.
ACTIVITY STARTING
DATE
ENDING
DATE
TIMING
REQUIRED
(IN DAYS)
EXPENSES
(IN Rs.)
1 Problem Discovery 4th
Jan, 2015 6th
Jan,2015 2 20
2 Selection of the
Topic
7th
Jan,2015 16th
Jan 2015 12 50
3 Problem Definition 17th
Jan,2015 24th
,2015 7 120
4 Formulating
Hypothesis
- - - -
5 Research Design 25th
,Jan 2015 31st,Jan2015 6 100
6 Secondary Data
Collection
1st,Feb2015 20
th, Feb2015 20 250
7 Sampling 21st Feb,2015 27
th Feb,2015 6 150
8 Editing &
Formatting the Data
28th
Feb,2015 3rd
Mar,2015 3 100
9 Analysis of Data 3rd
Mar,2015 6th
Mar,2015 3 100
10 Calculation of
sample
7th
Mar,2015 11th
Mar,2015 4 50
11 Forming
Questionnaire
12th
Mar,2015 16th
Mar,
2015
4 80
12 Research Proposal 17th
Mar,2015 20th
Mar 2015 3 150
13 Survey for Primary
Data
21st Mar,
2015
27th
Mar,2015 6 300
14 Interpretation &
Finding
28th
Mar,2015 31st Mar,
2015
3 100
15 Report Writing 1st Apr,2015 4
th Apr,2015 3 100
16 Project Submission 5th
Apr,2015 5th
Apr,2015 1 200
Grand Total 1870

BIBLIOGRAPHY
Websites:-
1. www.wikipedia.com
2. www.KDMC.ac.in
3. http://www.midcindia.org/watersupply scheme.aspx.
4. www.haritsolution.ac.in/water supply Kalyan
5. www.BMC.gov.ac.in/water supply
6. http://www.TMC.ac.in/water demand
7. http://www.mcgm.ac.in
8. http://www.CGE.ac.in/water harwasting
Newspapers:-
1. www.timesofindia.com
2. http://www.hindustantimes.com
Articles:-
1. The polytechnics of water supply in Kalyan.
Mr. Pramod Kulkarni Engineer water department Kalyan.
2. Water contamination in city touches alarming levels.
Vaishnavi C, Shekhar, TNN.

ASSIGNMENTS
Situation:-1 Demand of Nokia cell phone has reduced in
market.
Management Dilemma:-
Demand of Nokia cell phone has reduced in market, we don’t know why?
Management Question:-
How to increase the demand of Nokia cell phone in market.
Research question:-
To study the demand of Nokia cell phone in market.
Investigation Question:-
To study the Quality of material used for manufacturing Nokia cell
phone.
To study demand of nokia cell phone in market.
To study the substitutes of cell phone available in market.
Hypothesis:-
Set 1:-
H0:- Goodwill of the Nokia Company is not satisfying.
H1:- Goodwill of the Nokia Company is satisfying.
Set 2:-
H0:- substitute’s cell phone doesn’t affect on demand of Nokia cell
phone.
H1:- substitute’s cell phone affect on demand of Nokia cell phone.

Measurement Question:-
To study the increase number of user of cell phone.
To study the imbalance between the Nokia company and the other
company manufacturing cell phone.
Problem Statement:-
To study the demand of Nokia cell phone.
Research Objective:-
To study the demand of Nokia cell phone.
To study the quality and the goodwill of the Nokia company.

Situation 2:-Increased rate of cyber-crimes in Mumbai.
Management Dilemma:-
Increased rate of cybercrimes in Mumbai, we don’t know why?
Management question:-
How to decrease cyber-crimes in Mumbai.
Research question:-
To study cyber-crime in Mumbai.
Investigation Question:-
To study the psychology of hacker in on cyber-crime in Mumbai.
To study the impact of technology which affect the privacy of people.
Hypothesis:-
Set 1:-
H0:-Privacy and security measure aren’t adequate against cyber-crime.
H1:- Privacy and security measure are adequate against cyber-crime.
Set 2:-
H0:-Technology doesn’t affect the privacy of people.
H1:-Technology affects the privacy of people.
Measurement Question:-
To study the security measure which will help to prevent such cyber-crime
in Mumbai?
Problem Statement:-
To study the cyber-crime.
Research objective:-
To study the low related cyber-crime.
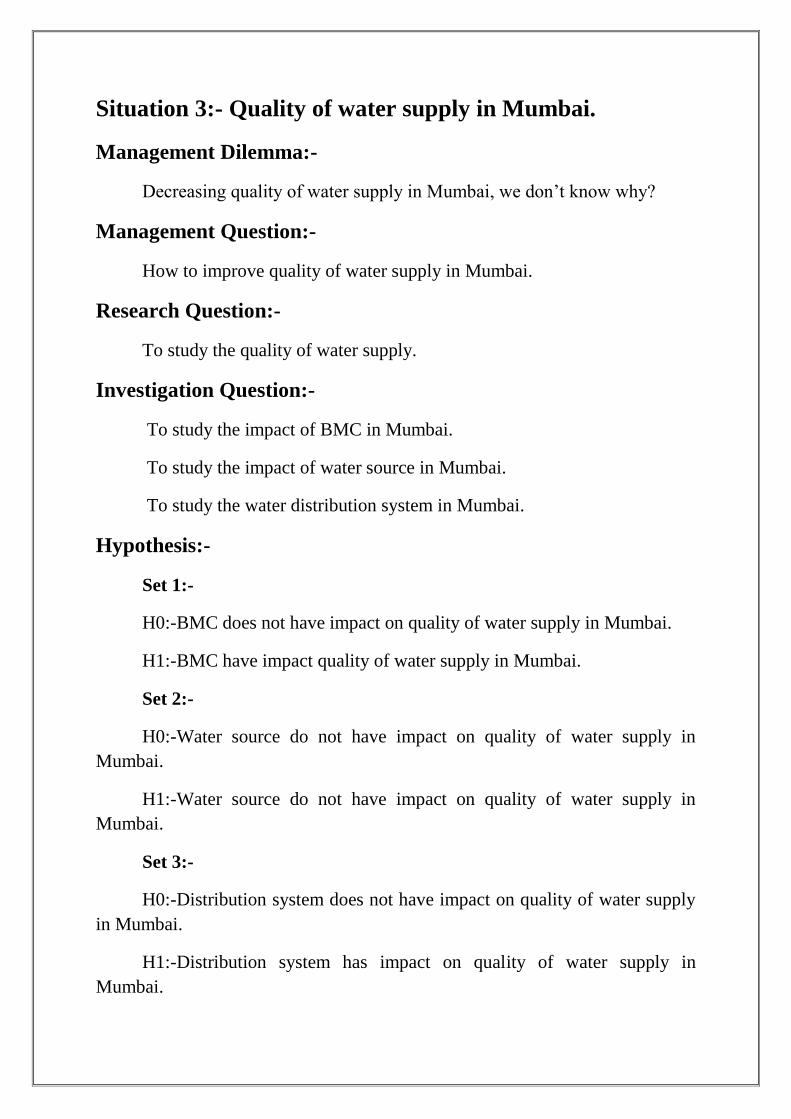
Situation 3:- Quality of water supply in Mumbai.
Management Dilemma:-
Decreasing quality of water supply in Mumbai, we don’t know why?
Management Question:-
How to improve quality of water supply in Mumbai.
Research Question:-
To study the quality of water supply.
Investigation Question:-
To study the impact of BMC in Mumbai.
To study the impact of water source in Mumbai.
To study the water distribution system in Mumbai.
Hypothesis:-
Set 1:-
H0:-BMC does not have impact on quality of water supply in Mumbai.
H1:-BMC have impact quality of water supply in Mumbai.
Set 2:-
H0:-Water source do not have impact on quality of water supply in
Mumbai.
H1:-Water source do not have impact on quality of water supply in
Mumbai.
Set 3:-
H0:-Distribution system does not have impact on quality of water supply
in Mumbai.
H1:-Distribution system has impact on quality of water supply in
Mumbai.

Measurement Question:-
To measure the impact of BMC in Mumbai.
Problem Statement:-
To study water supply in Mumbai.
Research Objective:-
To study the impact of BMC.
To study the impact of water source.
To study the water distribution system.

Situation 4:-Tourism is increased in Maharashtra.
Management Dilemma:-
Tourism is increased in Maharashtra, we don’t know why?
Management Question:-
How to increase tourism in Maharashtra even more?
Research Question:-
To study the tourism in Maharashtra.
Investigation Question:-
To study the role of hill station on tourism in Maharashtra.
To study the effect of development of amusement park on tourism in
Maharashtra.
To study the impact of hotel industry on tourism in Maharashtra.
Hypothesis:-
Set 1:-
H0:-The hill station do not affect on tourism is increased in Maharashtra.
H1:-The hill station affect on tourism is increased in Maharashtra.
Set 2:-
H0:-The development of amusement park do not affect on tourism is
increased in Maharashtra.
H1:-The development of amusement park affect on tourism is increased
in Maharashtra.
Set 3:-
H0:-The hotel industry do not affect on tourism is increased in
Maharashtra.
H1:-The hotel industry affect on tourism is increased in Maharashtra.

Measurement Question:-
To measure the impact of various hill station on the increase in the
tourism in Maharashtra.
Problem Statement:-
To study the tourism in Maharashtra.
Research objective:-
To study the role of hill station.
To study the effect of development of amusement park.
To study the impact of hotel industry.