may 22, 2016.docx edited
TRANSCRIPT
Option Queen Letter By the Option Royals
Jeanette Young, CFP®, CFTe, CMT, M.S.
4305 Pointe Gate Drive
Livingston, New Jersey 07039
www.OptnQueen.com
May 22, 2016
The steep uptrend of the major indices began in March of 2009 and ended in July of
2015. No, it was not the end of the “Bull Market” but this was the end of the steep
uptrend. Since that time, the indices have halted the upward climb and have been range
bound with no progress to the up or down sides. This range bound market apparently
emerged when the FOMC stopped fueling the markets with asset and treasury buy-backs
and, more recently, with a tiny rate hike. This past week, the FOMC minutes indicated
that another uptick in rates could come as soon as June. That said, we believe that this
group will also recognize the Brexit vote, and might hesitate because of that vote. We
also believe that if a rate hick is to occur, it will likely be seen either months prior to
the US Presidential Election or after that election.
Our markets and our economy are addicted to low interest rates. Our rates have been
un-naturally low for such a long time, that markets find it difficult to understand
anything other than low interest rates. What will they do as interest rates tick higher?
That question will be answered shortly. We have learned that higher interest rates have
a two-fold result; money flows to our shores seeking out higher returns on bonds and
the US Dollar subsequently moves higher. The higher US Dollar has a chilling effect
on exports and a deflationary effect on imports and commodities. Yes, things are
cheaper for us to buy because of the strength of the US Dollar but multination’s and
even domestically produces products for the US market will be impacted by cheaper
imports. Pair this with increasing costs of crude oil and Houston, we have a problem.
The ear-marks of this behavior are an economy that has been artificially stimulated by
low interest rates for an extended period of time, punctuated by an attempt to begin to
withdraw the stimulation. All of this is artificial and a result of a meddling FOMC.
Had the natural business cycle been allowed we would not find ourselves in this mess.
Yes, we would have had a downdraft or bust, but that would have been followed by a
boom. Perhaps, just perhaps, our perpetually gridlocked and "out to lunch" congress
would have been forced to get our fiscal books in order. Monetary policy is a powerful
tool; however, that does not make it a substitute for good fiscal policy. Today we have a
mess, neither boom nor bust, but rather face the abyss of of further deflation and
possible recession. Our range bound markets are a reflection of the times. Amid a
stagnant global economy, we have become the safest. That is just enough to prop up our

markets but not enough to move them. These range bound markets are, in a sense,
unnatural. Clearly we have learned nothing about economic cycles.
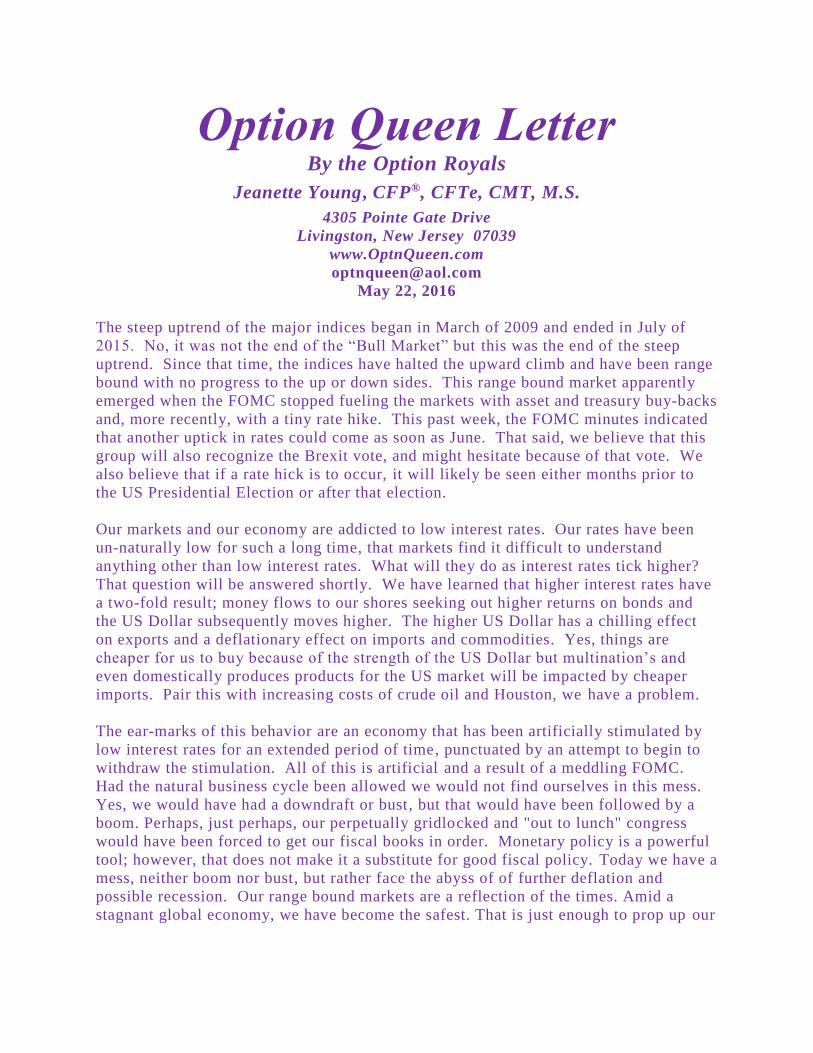
The S&P 500 rallied in the Friday session gaining 11.25 handles (points). We find that
divergences in the indicators remain alive and well. Both the stochastic indicator and the RSI
continue to point to the upside with plenty of room to run but our own indicator is pointing lower
also with plenty of room to run. Although it was an option’s expiration Friday, the volume
ticked lower showing that the rally was on lower volume than was the selloff the previous day.
The longer downtrend line is 2068.75 and the shorter downtrend line is at 2062.41. We continue
to see this index trade in a well-defined range. The most frequently traded price was 2044.50.


The NASDAQ 100 gained a hefty 46.75 handles (points) in the Friday session. We are trading
in a range and seem to be stuck, backing and filling. Notice a trend here? The stochastic
indicator and the RSI are both pointing higher but our own indicator is pointing lower. This
divergence flashes warning signals and indicates that all is not well. We need to focus on this
market before taking positions. The most frequently traded price was 4331.25. The day-session
saw higher prices with the most frequently value 4361.


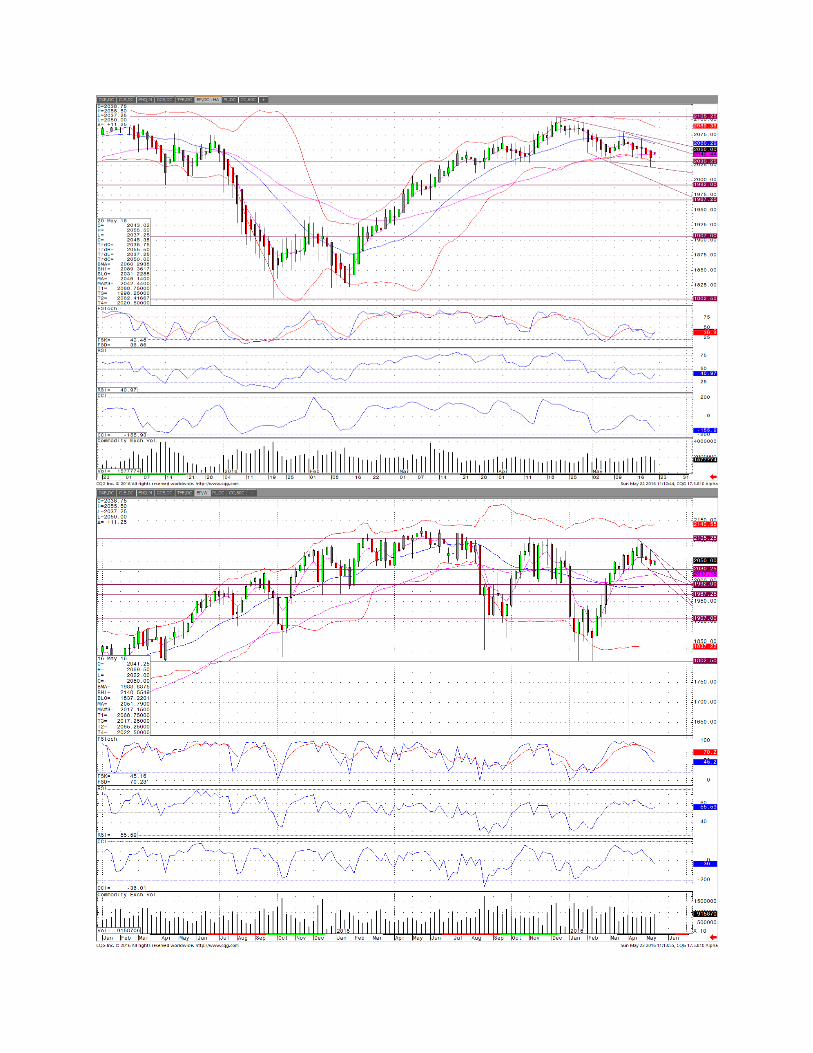
The Russell 2000 won the race for the gold in the Friday session adding 19.30 handles (points)
for the day. The downward trending channel is 1112.42 and 1080.16. The stochastic indicator
and the RSI are pointing higher, while our own indicator is pointing lower, divergence! The
Bollinger Bands appear to be contracting slightly. We see that this index is stuck in a trading
range which could continue for some time into the future. The weekly chart is interesting
showing that this index remains in a well-defined downtrend. The most frequently traded price
was 1096.50 but that was not in the day-session. The most frequently traded price in the day
session was 1107.50 but the highest volume was seen at 1108 where 7.3% of the day’s volume
was seen. The 11- 3-box point and figure chart shows a clear break to the upside with 1116.27
and 1117.60.
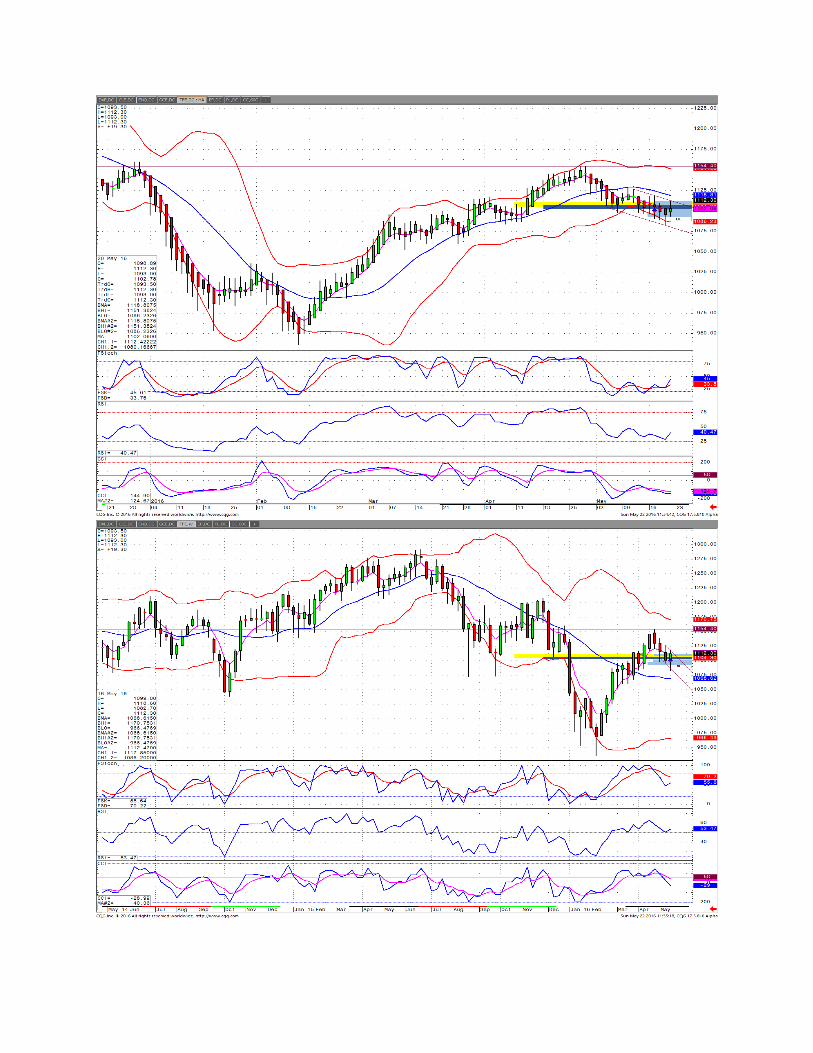


The US Dollar Index rallied through the week, closing the Friday session at 95.29. We are
always amazed by just how well trend lines work. The Dollar provided a beautiful example of
this. Looking to the daily chart, the index brook above the downtrend channel and proceeded to
rally to the next horizontal resistance line, 95.64. This index really had no choice but to rally. A
continued violation of support at 93.32, the lower level of a range in place since January 2015,
would have signaled that the index was breaking out of its current trading range, hardly likely
with talks of rate hikes. Talk about technicals and fundamentals working together! The 5 period
exponential moving average is 95, the 20 period simple moving average is 94.12 and the index is
above both. The Bollinger Bands are gently expanding with the upper band at 95.64 and the
lower band at 92.62. The RSI is beginning to turn over and our own indicator, although not
issuing a sell signal, is pulling back. The Friday session left a doji on the chart and despite the
week's rally, the index failed to hit the 95.64 resistance level. These last two points lead us to
believe that the index will likely back and fill, perhaps pulling back closer to the broken
downtrend line early in the week. Looking to the 30 minute 0.01 x 3 Point and Figure chart, we
can see multiple internal uptrend lines, part of a larger uptrend, and an activated upside target of
96.13. The weekly chart shows resistance above at 96.50 followed by 97.27. Following a pull
back, we believe the index will rally to 96.50 and, perhaps, to 97.27. The most frequently traded
price was 95.30 but the highest volume was seen at 95.27 where 17.8% of the session volume
traded.


Crude oil lost 19 cents in the Friday session leaving a doji like candlestick on the chart. This
market clearly broke above the 46.78 horizontal resistance line and seems to be headed for the
50.89 resistance area. That level should give this market a little bit of trouble. Above that level
is 62.04 where substantial resistance can be found. We are sure that the shorts in this product are
becoming very concerned and will throw in the towel and cover on a close above 50.89. All of
this will help the oil sector. It is interesting to note that the Saudi’s are raising cash at this time.
Maybe the depressed levels of crude has begun to pinch their pocket-books. Additionally, there
is continued talk of an IPO of ARAMCO. As to the threat to flood the US market with treasury
bonds, not such a big threat insomuch as their counting and our counting seem to differ
greatly….hummmm…. The upward trending channel lines are 44.37 and 49.26. All the
indicators that we follow herein continue to point higher.


Gold retreated 1.9 handles (points) in the Friday session. All the indicators that we follow
continue to point lower with plenty of room to the downside. The downward trending channel
lines are 1283.5 and 1243.59. The indicators on the weekly chart are also pointing lower. Right
now it looks like nothing more than a sideways backing and filling. It might be better to
purchase gold in another currency which is weak basis the US Dollar because gold will act more
like a currency for deflating currencies. Where the US Dollar is concerned, strength in the
currency negates the hedge of gold. When looking at the monthly chart of gold, it is easy to see
why gold is stalling at these levels. There is a lot of congestion here and it was a level from
which gold broke down.


Risk
Trading futures, options on futures and retail off-exchange foreign currency transactions involves
substantial risk of loss and is not suitable for all investors.
Past performance is not necessarily indicative of future results.
Copywrite 2016 The Option Royals