may 2019 mastercard caixin bbd china new economy indexnei.caixin.com/upload/nei201905e(1).pdf ·...
TRANSCRIPT

May 2019
Mastercard Caixin BBD China New Economy Index
Released: 10:00 am Beijing Time June-02-2019
Overview
In May 2019, the Mastercard Caixin BBD New Economy Index (NEI) reading came in at 28.0,
indicating that the New Economy accounted for 28.0% of overall economic input activities that
month, down 0.6 ppts from April (Chart 1). The declining NEI was due to the decrease of
technology input. New economy is defined as following: 1) human capital intensive, technology
intensive and capital light, 2) sustainable rapid growth, and 3) in line with the strategic new
industries defined by the government. Please refer to our previous reports (March 2016 and March
2017) for the list of NEI sectors.
Primary Inputs
The NEI includes labor, capital and technology inputs that account for 40%, 35% and 25% of the
total weights of the index, respectively. The declining in the May NEI reading came from the
decrease of technology input (Chart 2). Technology input index was on an uptrend since July 2018,
coming in at 28.3 this month, with 2.8 MoM decrease. Capital input fluctuated widely in the
recent year, rebounding to 29.1 this month, with 0.4 MoM increase. Labor input index showed a
stable trend in recent half year, remaining to 26.8 this month.

Taking the weights into account, percentage changes in labor, capital and technology inputs were
0.0, 0.1, and -0.7 ppts, respectively. The net NEI change was -0.6 ppts in total (Chart 3).
As for sectors, the New IT industry formed the largest proportion of the New Economy Index,
contributing 8.3 ppts to NEI. Advanced Equipment Manufacturing was the industry with fastest
growth in May, contributing 3.3 ppts and ranking the forth. Science Research and Hi-tech Services
came fifth from second, the biggest drop in ranking, contributing 2.9 ppts in May (Chart 4).
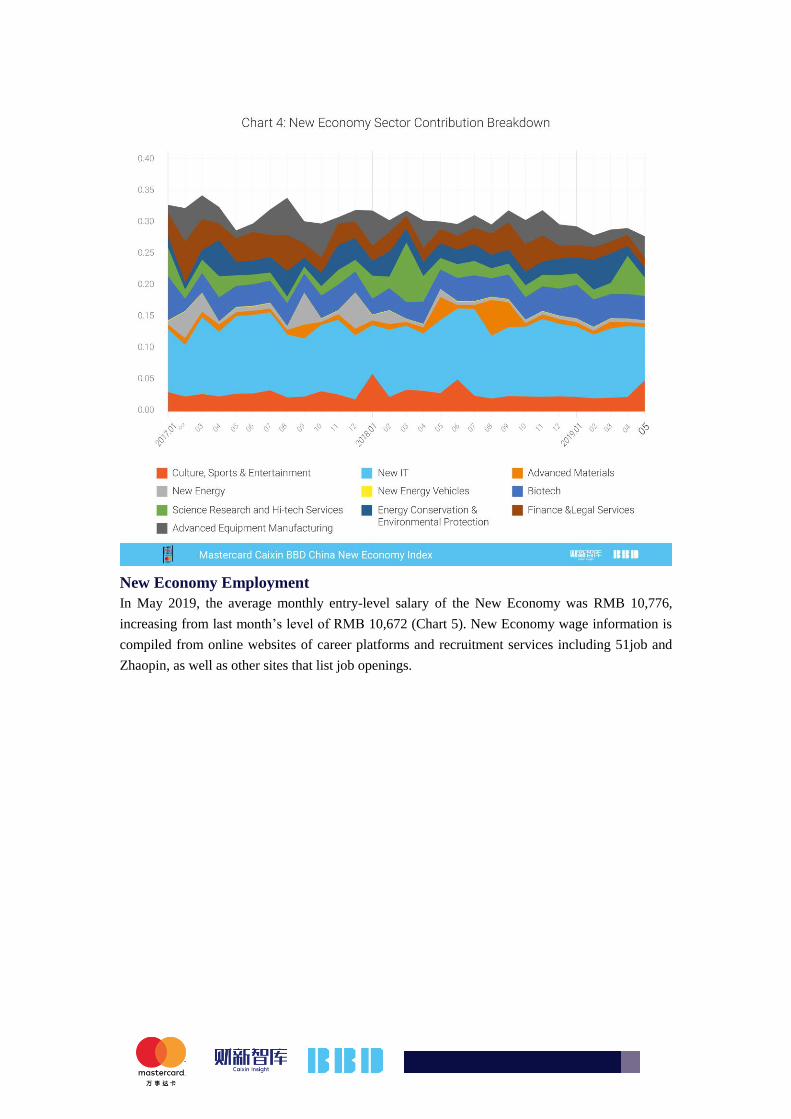
New Economy Employment
In May 2019, the average monthly entry-level salary of the New Economy was RMB 10,776,
increasing from last month’s level of RMB 10,672 (Chart 5). New Economy wage information is
compiled from online websites of career platforms and recruitment services including 51job and
Zhaopin, as well as other sites that list job openings.
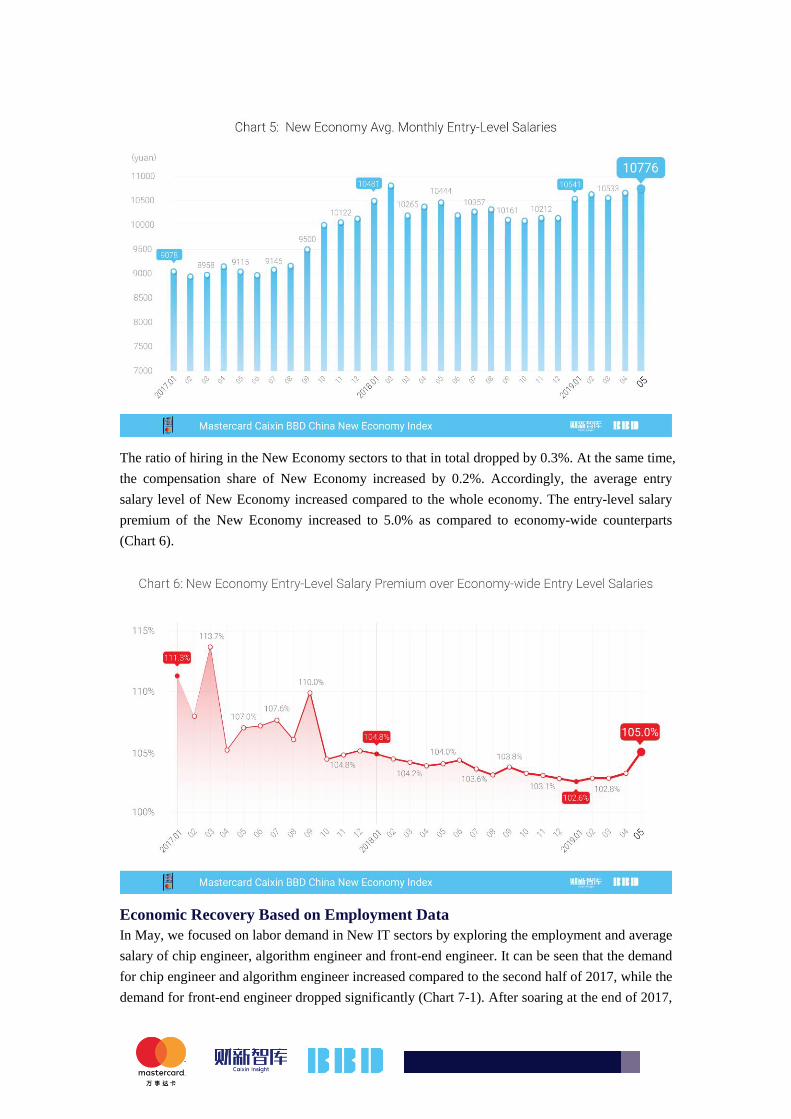
The ratio of hiring in the New Economy sectors to that in total dropped by 0.3%. At the same time,
the compensation share of New Economy increased by 0.2%. Accordingly, the average entry
salary level of New Economy increased compared to the whole economy. The entry-level salary
premium of the New Economy increased to 5.0% as compared to economy-wide counterparts
(Chart 6).
Economic Recovery Based on Employment Data
In May, we focused on labor demand in New IT sectors by exploring the employment and average
salary of chip engineer, algorithm engineer and front-end engineer. It can be seen that the demand
for chip engineer and algorithm engineer increased compared to the second half of 2017, while the
demand for front-end engineer dropped significantly (Chart 7-1). After soaring at the end of 2017,

the demand for chip engineer slumped but it was still higher than 2016. The rise of algorithm
engineer was more stable and higher. In terms of average salary (Chart 7-2), the premium of chip
engineer and algorithm engineer over front-end engineer increased as well. The salary of
algorithmic engineer was no more than double the national average salary in 2016, and now it was
nearly 2.5 times. The salary of chip engineer was almost twice that of the whole economy. The
front-end engineer faced wage stagnation for their salary stayed at less than 1.5 times of the
national average salary since 2016. These observations indicated the structural change of New IT
industry: New IT industry started to move up the value chain by shifting from sales and service
expansion.
Chart 8 showed the employment of exporting and non-exporting enterprises above designated size.
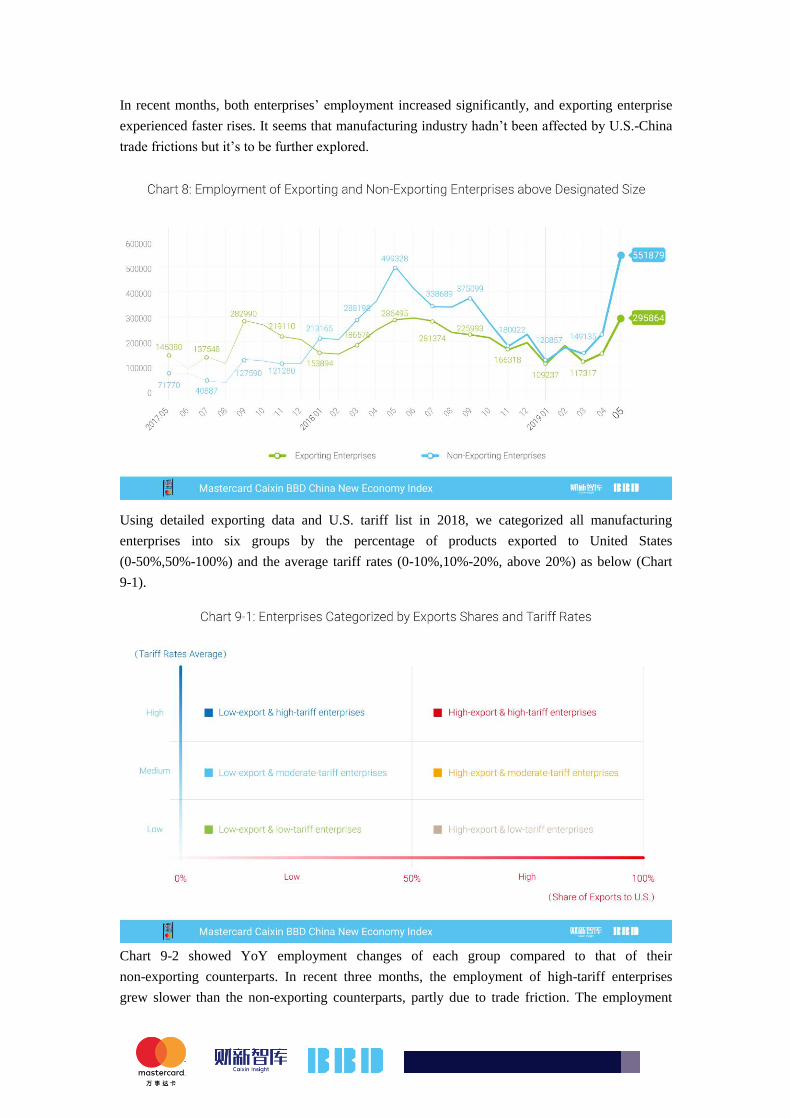
In recent months, both enterprises’ employment increased significantly, and exporting enterprise
experienced faster rises. It seems that manufacturing industry hadn’t been affected by U.S.-China
trade frictions but it’s to be further explored.
Using detailed exporting data and U.S. tariff list in 2018, we categorized all manufacturing
enterprises into six groups by the percentage of products exported to United States
(0-50%,50%-100%) and the average tariff rates (0-10%,10%-20%, above 20%) as below (Chart
9-1).
Chart 9-2 showed YoY employment changes of each group compared to that of their
non-exporting counterparts. In recent three months, the employment of high-tariff enterprises
grew slower than the non-exporting counterparts, partly due to trade friction. The employment

growth rates of other four groups were above or close to that of non-exporting ones. The
significantly negative effect of trade friction is yet to be found in employment of manufacturing
and export oriented industries but we will keep close eyes on it.
City Rankings of the New Economy
Based on overall New Economy rankings, the top twenty cities were shown in Chart 10. The top
five cities were Beijing, Shanghai, Shenzhen, Guangzhou and Hangzhou. Rankings are based on a
weighted average of the percentile ranks of indicators for the city in the past six months.

Chart 11 showed the average NEI city rankings between November 2018 and May 2019. The top
five cities were Beijing, Hangzhou, Xiamen, Hefei and Suzhou.

In addition, we showed the city rankings adjusted by living cost by taking housing price,
minimum wage and disposable income per capita into account (Chart 12). After the adjustment,
the top five cities were Beijing, Shanghai, Chengdu, Shenzhen and Chongqing, following by
Hangzhou, Nanjing and Guangzhou.


For further information please contact:
Mastercard
Mr. Wu Huanyu, Director, Communications
Tel:+86-10-8519-9304
Email:[email protected]
Caixin Insight Group
Dr. Wang Zhe, Senior Economist Ma Ling, Public Relations
Tel:+86-10-85905019 Tel:+86-10-8590-5204
Emails:[email protected] Email:[email protected]
BBD
Dr. Chen Qin, Chief Economist
Tel:+86-28-65290823
Emails:[email protected]
The Mastercard Caixin BBD China New Economy Index is the fruit of a research
partnership between Caixin Insight Group and BBD, in collaboration with the
National Development School, Peking University. The subject of a year of research,
the NEI was first publically released on March 2, 2016 and will be issued the 2nd of
every month at 10:00am China Standard Time.
About Caixin
Caixin Media is China's leading media group dedicated to providing financial and
business news through periodicals, online content, mobile applications, conferences,
books and TV/video programs. Caixin Media aims to blaze a trail that helps
traditional media prosper in the new media age through integrated multimedia
platforms. Caixin Insight Group is a high-end financial data and analysis platform.
For more information, please visitwww.caixin.com.
About Mastercard
Mastercard (NYSE: MA), www.mastercard.com, is a technology company in the
global payments industry. We operate the world’s fastest payments processing
network, connecting consumers, financial institutions, merchants, governments and
businesses in more than 210 countries and territories. Mastercard’s products and
solutions make everyday commerce activities – such as shopping, traveling, running a
business and managing finances – easier, more secure and more efficient for everyone.
Follow us on Twitter @MastercardAP and @MastercardNews, join the discussion
on the Beyond the Transaction Blog and subscribe for the latest news on the
Engagement Bureau.
About BBD (Business Big Data)
BBD is a leading Big Data and quantitative business analytics firm specializing in the
analysis of the high-growth industries emerging in Mainland China. Through dynamic
data tracking, credit analysis, risk pricing and economic index construction, BBD
provides its clients with a wide range of services at both the macro and micro level.
For more information, please visit http://www.bbdservice.com/.