may 2012 ceri commodity report natural gascubic feet of natural gas hydrates are located in the...
TRANSCRIPT

Relevant • Independent • Objective
Steven Chu compared the test to government-funded testing of shale gas production methods in prior years. Government funding of this technology could potentially turn out even better than shale gas research funding, in that the carbon dioxide could be sourced from electricity generation or oil operations and effectively sequestered in clathrate form, while producing low-carbon methane. This could not be merely carbon-neutral, but carbon-negative: in the best of worlds, carbon dioxide injection and methane recovery could actually reduce the atmospheric concentration of greenhouse gases. The potential fiscal impact of gas hydrates is illustrated in the following excerpt from the testimony of W. Coleman Jackson of EnergyNorthAmerica LLC before the United States Senate Committee on Energy and Natural Resources in May 2011:1
More than 99% of America’s 320,000 trillion cubic feet of natural gas hydrates are located in the deepwater federal offshore. If even only 1% of this resource is eventually producible, it would add 3,200 trillion cubic feet of natural gas. Production of this 1%, or 3,200 trillion cubic feet, of our natural gas hydrate resources would generate approximately $3 trillion in royalties and about $4.5 trillion in corporate income tax on this production from the lessees, for a total of approximately $7.5 trillion. When combined with the prior $4.5 trillion, a total of $12 trillion will result from production of offshore oil and natural gas, including natural gas hydrates. This sum is sufficient to pay off approximately 90% of the current national debt without raising taxes. Further, this amount could easily be 50 to 100 percent higher because it is based on decades old seismic surveys in moratoria areas which are expected to significantly underestimate recoverable resources.
History and Global Occurrence In the 1930s, a natural gas production problem in cold climates was observed in the formation of an ice-like, combustible substance clogging pipelines. The substance turned out to be methane hydrates, and this is how they
May 2012
CERI Commodity Report — Natural Gas
Methane Hydrates By Thorn Walden Introduction The amount of gas in place in the form of methane hydrates, sometimes called gas hydrates, constitutes the single largest store of energy on the planet, with total gas volume measured in multiples of 1015 m3
(quadrillions of cubic metres). The energy associated with this gas volume exceeds the combined energy content of all other hydrocarbons on Earth. Methane hydrates are clathrates – methane molecules trapped in cages of ice, existing under conditions of low temperature and high pressure. These clathrates are compact: one volume of methane hydrates on dissociation theoretically yields 163 volumes of methane. It is estimated that about 99 percent of Canada’s methane in place is in the form of methane hydrates. Developments in North America Between 2007 and 2008, a joint Canadian-American-Japanese methane hydrates test, conducted in the Mallik area of the Mackenzie Delta, produced methane using depressurizing technology. It was recognized at the time that commercial production from that area could not occur unless a natural gas pipeline from the Mackenzie Valley were constructed. Such a pipeline would carry mostly conventional natural gas. In 2012, ConocoPhillips, with American and Japanese public funding, conducted a test in Alaska in which carbon dioxide was injected into a methane hydrate formation, displacing the methane. The test was considered a success. United States Energy Secretary
CERI Commodity Report – Natural Gas Editor-in-Chief: Mellisa Mei ([email protected]) Contents Featured Article ...................................................................... 1 Natural Gas Prices .................................................................. 4 Weather ................................................................................. 6 Consumption and Production ................................................. 8 Transportation........................................................................ 10 Storage ................................................................................... 12 Liquefied Natural Gas ............................................................. 15 Drilling Activity ....................................................................... 17
CERI Commodity Report - Natural Gas
Page 2
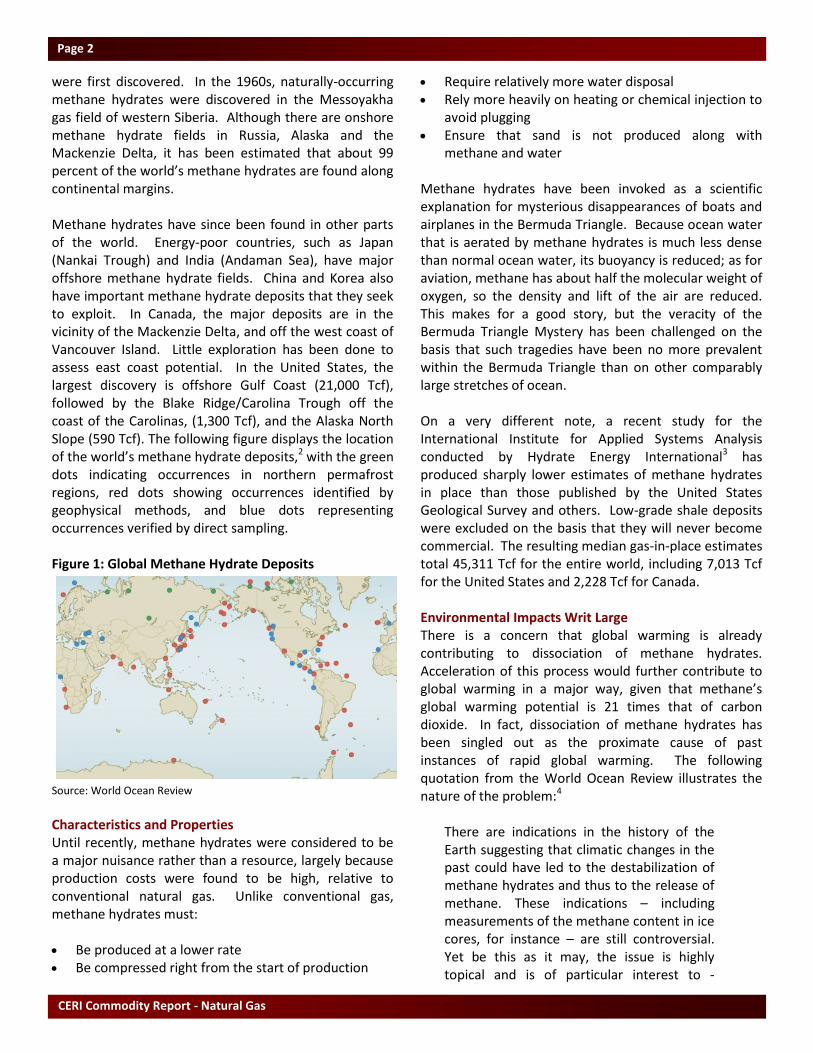
were first discovered. In the 1960s, naturally-occurring methane hydrates were discovered in the Messoyakha gas field of western Siberia. Although there are onshore methane hydrate fields in Russia, Alaska and the Mackenzie Delta, it has been estimated that about 99 percent of the world’s methane hydrates are found along continental margins. Methane hydrates have since been found in other parts of the world. Energy-poor countries, such as Japan (Nankai Trough) and India (Andaman Sea), have major offshore methane hydrate fields. China and Korea also have important methane hydrate deposits that they seek to exploit. In Canada, the major deposits are in the vicinity of the Mackenzie Delta, and off the west coast of Vancouver Island. Little exploration has been done to assess east coast potential. In the United States, the largest discovery is offshore Gulf Coast (21,000 Tcf), followed by the Blake Ridge/Carolina Trough off the coast of the Carolinas, (1,300 Tcf), and the Alaska North Slope (590 Tcf). The following figure displays the location of the world’s methane hydrate deposits,2 with the green dots indicating occurrences in northern permafrost regions, red dots showing occurrences identified by geophysical methods, and blue dots representing occurrences verified by direct sampling.
Figure 1: Global Methane Hydrate Deposits
Source: World Ocean Review
Characteristics and Properties Until recently, methane hydrates were considered to be a major nuisance rather than a resource, largely because production costs were found to be high, relative to conventional natural gas. Unlike conventional gas, methane hydrates must: Be produced at a lower rate Be compressed right from the start of production
Require relatively more water disposal Rely more heavily on heating or chemical injection to
avoid plugging Ensure that sand is not produced along with
methane and water Methane hydrates have been invoked as a scientific explanation for mysterious disappearances of boats and airplanes in the Bermuda Triangle. Because ocean water that is aerated by methane hydrates is much less dense than normal ocean water, its buoyancy is reduced; as for aviation, methane has about half the molecular weight of oxygen, so the density and lift of the air are reduced. This makes for a good story, but the veracity of the Bermuda Triangle Mystery has been challenged on the basis that such tragedies have been no more prevalent within the Bermuda Triangle than on other comparably large stretches of ocean. On a very different note, a recent study for the International Institute for Applied Systems Analysis conducted by Hydrate Energy International3 has produced sharply lower estimates of methane hydrates in place than those published by the United States Geological Survey and others. Low-grade shale deposits were excluded on the basis that they will never become commercial. The resulting median gas-in-place estimates total 45,311 Tcf for the entire world, including 7,013 Tcf for the United States and 2,228 Tcf for Canada. Environmental Impacts Writ Large There is a concern that global warming is already contributing to dissociation of methane hydrates. Acceleration of this process would further contribute to global warming in a major way, given that methane’s global warming potential is 21 times that of carbon dioxide. In fact, dissociation of methane hydrates has been singled out as the proximate cause of past instances of rapid global warming. The following quotation from the World Ocean Review illustrates the nature of the problem:4
There are indications in the history of the Earth suggesting that climatic changes in the past could have led to the destabilization of methane hydrates and thus to the release of methane. These indications – including measurements of the methane content in ice cores, for instance – are still controversial. Yet be this as it may, the issue is highly topical and is of particular interest to

Relevant • Independent • Objective
Page 3
scientists concerned with predicting the possible impacts of a temperature increase on the present deposits of methane hydrate.
Should dissociation of methane hydrates, due to global warming, become a serious problem at some future time, one could envision a herculean effort to minimize the positive feedback effect by removing as much methane as possible from hydrates before dissociation occurs. Endnotes 1“Statement of W. Jackson Coleman before the United States Senate Committee on Energy and Natural Resources Concerning S.516, S.843, and S.916”, May 17, 2011., http://www.energy.senate.gov/public/index.cfm/files/serve?File_id=fe36d378-0cef-84cd-3414-75d74e48f39b 2“Climate Change Impacts on Methane Hydrates”, World Ocean Review, http://worldoceanreview.com/en/ocean-chemistry/climate-change-and-methane-hydrates/ 3Johnson, Arthur H. “Global Resource Potential of Gas Hydrate”, National Energy Technology Laboratory, Fire in the Ice, Vol. 11, Issue 2, http://www.netl.doe.gov/technologies/oil-gas/publications/Hydrates/Newsletter/MHNews-2011-12.pdf#Page=1 4“Climate Change Impacts on Methane Hydrates”, World Ocean Review, http://worldoceanreview.com/en/ocean-chemistry/climate-change-and-methane-hydrates/

CERI Commodity Report - Natural Gas
Page 4
SOU
RC
E: C
ERI,
Pla
tts
Gas
Dai
ly P
rice
Gu
ide.
SO
UR
CE:
CER
I, P
latt
s G
as D
aily
Pri
ce G
uid
e.
SOU
RC
E: C
ERI,
Pla
tts
Gas
Dai
ly P
rice
Gu
ide.
SO
UR
CE:
CER
I, P
latt
s G
as D
aily
Pri
ce G
uid
e.
-10123456789
10
11
12
13
14
15 Jan
-03
Jan
-04
Jan
-05
Jan
-06
Jan
-07
Jan
-08
Jan
-09
Jan
-10
Jan
-11
Jan
-12
US
$/M
MB
tu
AE
CO
-C
He
nry
Hu
b
Dif
fere
nti
al
Henry H
ub/A
EC
O
Be
gin
nin
g o
f N
ex
t M
on
th
S
po
t P
ric
e
-2-1012345678910
11
12
13
14
15 Ja
n-0
3J
an
-04
Ja
n-0
5J
an
-06
Ja
n-0
7J
an
-08
Ja
n-0
9J
an
-10
Jan
-11
Jan
-12
US
$/M
MB
tu
Henry H
ub/C
hicago
Be
gin
nin
g o
f N
ex
t M
on
th
S
po
t P
ric
e
Ch
icag
o
He
nry
Hu
b
Dif
fere
nti
al
-10123456789
10
11
12
13
14
15 Jan
-03
Jan
-04
Jan
-05
Jan
-06
Jan
-07
Jan
-08
Jan
-09
Jan
-10
Jan
-11
Jan
-12
Henry H
ub/R
ockies
Be
gin
nin
g o
f N
ex
t M
on
th
S
po
t P
ric
e
Ro
ck
ies
He
nry
Hu
b
Dif
fere
nti
al
US
$/M
MB
tu
-10123456789
10
11
12
13
14
15 Jan
-03
Jan
-04
Jan
-05
Jan
-06
Jan
-07
Jan
-08
Jan
-09
Jan
-10
Jan
-11
Jan
-12
Henry H
ub/S
outhern C
alifornia
Be
gin
nin
g o
f N
ex
t M
on
th
S
po
t P
ric
e
So
uth
ern
Ca
lifo
rnia
He
nry
Hu
b
Dif
fere
nti
al
US
$/M
MB
tu
Relevant • Independent • Objective
Page 5
SOU
RC
E: C
anad
ian
Gas
Ass
oci
atio
n.
SOU
RC
E: C
ERI,
Can
adia
n G
as A
sso
ciat
ion
, Sta
tist
ics
Can
ada.
SOU
RC
E: C
anad
ian
Gas
Ass
oci
atio
n, N
OA
A.
SOU
RC
E: C
ERI,
NO
AA
, EIA
.
0
100
200
300
400
500
600
70
0
80
0
JF
MA
MJ
JA
SO
ND
5-Y
ea
r A
vg
.2
011
2012
Canadian H
eating D
egree D
ays
01234567
0
200
400
60
0
800
1,0
00
1,2
00 J
an
-07
Ju
l-0
7J
an
-08
Ju
l-08
Ja
n-0
9Ju
l-09
Ja
n-1
0Ju
l-1
0Jan
-11
Ju
l-11
Ja
n-1
2
Deg
ree D
ays
Co
nsu
mp
tio
n
Canadian H
eating D
egree D
ays vs
Residential and C
om
mercial C
onsum
ption
Deg
ree D
ays
BC
FP
D
CE
RI E
sti
mate
0
100
20
0
300
40
0
500
60
0
700
80
0
900
1,0
00
JF
MA
MJ
JA
SO
ND
5-Y
ea
r A
vg
.2
011
2012
US
H
eating D
egree D
ays
010
20
30
40
50
60
0
20
0
40
0
600
800
1,0
00
1,2
00 J
an
-07
Ju
l-07
Jan
-08
Ju
l-08
Jan
-09
Ju
l-09
Jan
-10
Ju
l-10
Jan
-11
Ju
l-11
Jan
-12
Deg
ree D
ays
Co
nsu
mp
tio
n
US
H
eating D
egree D
ays vs
Residential and C
om
mercial C
onsum
ption
Deg
ree D
ays
BC
FP
D
CE
RI E
sti
mate

CERI Commodity Report - Natural Gas
Page 6
SOU
RC
E: E
nvi
ron
men
t C
anad
a.
SOU
RC
E: E
nvi
ron
men
t C
anad
a.
SOU
RC
E: N
OA
A.
SOU
RC
E: N
OA
A.

Relevant • Independent • Objective
Page 7
SOU
RC
E: N
OA
A.
SOU
RC
E: E
nvi
ron
men
t C
anad
a.
SOU
RC
E: N
OA
A.

CERI Commodity Report - Natural Gas
Page 8
SOU
RC
E: S
tati
stic
s C
anad
a.
SOU
RC
E: S
tati
stic
s C
anad
a, N
EB.
SOU
RC
E: E
IA.
SOU
RC
E: E
IA.
02468
10
12
14
16
18
20 J
an
-07
Ju
l-07
Jan
-08
Ju
l-08
Jan
-09
Ju
l-09
Jan
-10
Ju
l-10
Jan
-11
Ju
l-11
Jan
-12
BC
, Y
uk
on
, N
WT
AB
SK
E. C
oa
st
Canadian M
arketable P
roduction
By P
ro
vin
ce/R
eg
io
n
BC
FP
D
0
20
40
60
80
100
120
140 J
an
-07
Ju
l-0
7Jan
-08
Ju
l-0
8Jan
-09
Ju
l-0
9Jan
-10
Ju
l-1
0Jan
-11
Ju
l-11
Jan
-12
Ind
us
tria
lE
lectr
ic P
ow
er
Co
mm
erc
ial
Re
sid
en
tia
l
BC
FP
D
US
C
onsum
ption
By S
ec
to
r
0
10
20
30
40
50
60
70
80 J
an
-07
Ju
l-07
Jan
-08
Ju
l-08
Jan
-09
Ju
l-09
Jan
-10
Ju
l-10
Jan
-11
Ju
l-11
Jan
-12
US
To
tal
Lo
uis
ian
aG
OM
Fe
de
ral W
ate
rsTe
xa
s
US
M
arketable P
roduction
BC
FP
D
02468
10
12
14
16 J
an
-07
Ju
l-07
Jan
-08
Ju
l-08
Jan
-09
Ju
l-09
Jan
-10
Ju
l-10
Jan
-11
Ju
l-11
Ind
us
tria
l &
Po
we
rC
om
merc
ial
Re
sid
en
tia
l
Canadian C
onsum
ption
By S
ec
to
r
BC
FP
D

Relevant • Independent • Objective
Page 9
SOU
RC
E: S
tati
stic
s C
anad
a, N
EB.
SOU
RC
E: S
tati
stic
s C
anad
a, N
EB.
SOU
RC
E: S
tati
stic
s C
anad
a, N
EB.
SOU
RC
E: S
tati
stic
s C
anad
a, N
EB.
0.0
0.5
1.0
1.5
2.0
2.5
3.0
3.5
4.0
JF
MA
MJ
JA
SO
ND
2010
20
11
2012
BC
, Y
ukon, N
WT
M
arketable P
roduction
BC
FP
D
02468
10
12
14
16
JF
MA
MJ
JA
SO
ND
2010
2011
2012
AB
M
arketable P
roduction
BC
FP
D
0.0
0.5
1.0
JF
MA
MJ
JA
SO
ND
2010
20
11
2012
SK
M
arketable P
roduction
BC
FP
D
0.0
0
0.2
5
0.5
0
JF
MA
MJ
JA
SO
ND
2010
2011
2012
East C
oast M
arketable P
roduction
BC
FP
D

CERI Commodity Report - Natural Gas
Page 10
SOU
RC
E: C
ERI.
SO
UR
CE:
CER
I.
SOU
RC
E: N
EB.
SOU
RC
E: N
EB.
02468
10
12
14
16
JF
MA
MJ
JA
SO
ND
2010
2011
2012
BC
FP
D
System
Field R
eceipts
Tra
nsC
an
ad
a +
W
estc
oast; M
on
thly A
ve
ra
ge
02468
10
12
14
16
Ma
y-1
1J
ul-
11
Sep
-11
No
v-1
1Jan
-12
Ma
r-12
Ma
y-1
2
Em
pre
ss
Mc
Ne
ilA
B-B
CA
llia
nc
e
BC
FP
D
Alberta S
ystem
D
eliveries
0123456789
10
Ap
r-11
Ju
n-1
1A
ug
-11
Oct-
11
Dec
-11
Feb
-12
Ap
r-12
Kin
gs
ga
teM
on
ch
yE
lmo
reH
un
tin
gd
on
Canadian G
as E
xports to the U
S
By E
xp
ort P
oin
t -W
est
BC
FP
D
0123456789
10
Ap
r-11
Ju
n-1
1A
ug
-11
Oct-
11
De
c-1
1F
eb
-12
Ap
r-1
2
Em
ers
on
Iro
qu
ois
Oth
ers
Nia
gara
Canadian G
as E
xports to the U
S
By E
xp
ort P
oin
t -E
ast
BC
FP
D
Relevant • Independent • Objective
Page 11
SOU
RC
E: N
EB.
SOU
RC
E: N
EB.
SOU
RC
E: N
EB, E
IA.
SOU
RC
E: N
EB.
02468
10
12
14 M
ar-
11
May-1
1Ju
l-11
Sep
-11
No
v-1
1J
an
-12
Mar-
12
Ca
nad
aM
ex
ico
Total U
S P
ipeline G
as Im
ports
BC
FP
D
01234
Ap
r-11
Ju
n-1
1A
ug
-11
Oct-
11
Dec
-11
Feb
-12
Ap
r-12
Co
urt
rig
ht
Sarn
iaS
t. C
lair
Oth
er
BC
FP
D
Canadian G
as Im
ports
By Im
port P
oin
t
02468
10
12
14
Ap
r-11
Ju
n-1
1A
ug
-11
Oct-
11
Dec-1
1F
eb
-12
Ap
r-12
West
Mid
West
East
US
Im
ports of C
anadian G
as
By U
S R
eg
io
n
BC
FP
D
02468
10
12
14
Ap
r-11
Ju
n-1
1A
ug
-11
Oct-
11
Dec
-11
Feb
-12
Ap
r-12
West
Mid
West
East
Average C
anadian E
xport P
rice
By U
S R
eg
io
n
C$/G
J

CERI Commodity Report - Natural Gas
Page 12
SOU
RC
E: C
ERI,
Pla
tts
Gas
Dai
ly.
SOU
RC
E: C
ERI,
Pla
tts
Gas
Dai
ly.
SOU
RC
E: C
ERI,
Pla
tts
Gas
Dai
ly.
SOU
RC
E: C
ERI,
Pla
tts
Gas
Dai
ly.
0
100
200
300
40
0
50
0
600
700
800
JF
MA
MJ
JA
SO
ND
5-Y
ea
r A
vg
.2
011
2012
BC
F, M
on
th E
nd
Canadian W
orking G
as S
torage
0
10
0
20
0
300
400
500
600
700
Ma
y-1
1J
ul-
11
Sep
-11
No
v-1
1Jan
-12
Ma
r-12
Ma
y-1
2
We
st
Ea
st
Canadian S
torage by R
egion
BC
F, M
on
th E
nd
0
500
1,0
00
1,5
00
2,0
00
2,5
00
3,0
00
3,5
00
4,0
00
4,5
00
JF
MA
MJ
JA
SO
ND
5-Y
ea
r A
vg
.2
011
2012
BC
F, M
on
th E
nd
US
Low
er-48 W
orking G
as S
torage
0
50
0
1,0
00
1,5
00
2,0
00
2,5
00
3,0
00
3,5
00
4,0
00
4,5
00
Ma
y-1
1J
ul-
11
Sep
-11
No
v-1
1Jan
-12
Ma
r-12
Ma
y-1
2
Ea
st
We
st
Pro
du
cin
g R
eg
ion
BC
F, M
on
th E
nd
US
S
torage by R
egion

Relevant • Independent • Objective
Page 13
SOU
RC
E: C
ERI,
Pla
tts
Gas
Dai
ly.
SOU
RC
E: C
ERI,
Pla
tts
Gas
Dai
ly.
SOU
RC
E: C
ERI,
Pla
tts
Gas
Dai
ly.
-100
-80
-60
-40
-200
20
40
60
80
JF
MA
MJ
JA
SO
ND
WC
_IJ
_W
D
5-Y
ear A
vg
.2
011
2012
BC
F, M
on
th E
ndW
estern C
anada S
torage
Injections/W
ithdraw
als
-80
-60
-40
-200
20
40
60
80
JF
MA
MJ
JA
SO
ND
5-Y
ear A
vg
.2011
2012
Eastern C
anadian S
torage
Injections/W
ithdraw
als
BC
F, M
on
th E
nd
-150
-100
-500
50
10
0
15
0
JF
MA
MJ
JA
SO
ND
5-Y
ear A
vg
.2
011
2012
Canadian S
torage
Injections/W
ithdraw
als
BC
F, M
on
th E
nd

CERI Commodity Report - Natural Gas
Page 14
SOU
RC
E: C
ERI,
Pla
tts
Gas
Dai
ly.
SOU
RC
E: C
ERI,
Pla
tts
Gas
Dai
ly.
SOU
RC
E: C
ERI,
Pla
tts
Gas
Dai
ly.
SOU
RC
E: C
ERI,
Pla
tts
Gas
Dai
ly.
-10
0
-80
-60
-40
-200
20
40
60
80
100
JF
MA
MJ
JA
SO
ND
5-Y
ea
r A
vg
.2
011
2012
US
W
estern C
onsum
ing R
egion S
torage
Injections/W
ithdraw
als
BC
F, M
on
th E
nd
-500
-400
-300
-200
-1000
10
0
200
300
40
0
500
JF
MA
MJ
JA
SO
ND
5-Y
ea
r A
vg
.2
011
2012
US
E
astern S
torage
Injections/W
ithdraw
als
BC
F, M
on
th E
nd
-25
0
-200
-150
-100
-500
50
100
150
200
JF
MA
MJ
JA
SO
ND
5-Y
ear A
vg
.2
011
2012
US
P
roducing R
egion S
torage
Injections/W
ithdraw
als
BC
F, M
on
th E
nd
-800
-600
-400
-2000
20
0
40
0
60
0
800
JF
MA
MJ
JA
SO
ND
5-Y
ear A
vg
.2
011
2012
US
S
torage
Injections/W
ithdrw
als
BC
F, M
on
th E
nd
Relevant • Independent • Objective
Page 15
SOU
RC
E: U
S D
OE.
SO
UR
CE:
US
DO
E.
SOU
RC
E: U
S D
OE.
SO
UR
CE:
US
DO
E.
02468
10
12
14
16
18
20
22
24
Ap
r-11
Ju
n-1
1A
ug
-11
Oct-
11
De
c-1
1F
eb
-12
Ap
r-12
Co
ve
Po
int
Elb
a Is
lan
dE
ve
rett
NE
Ga
tew
ay
Ne
ptu
ne
Eastern U
S LN
G Im
ports B
y Facility
BC
F
02468
10
12
14
16
18
20
22
24
Ap
r-11
Ju
n-1
1A
ug
-11
Oct-
11
Dec-1
1F
eb
-12
Ap
r-12
Fre
ep
ort
Lake C
harl
es
Sab
ine P
ass
Cam
ero
nG
old
en
Pass
Gu
lf L
NG
US
G
OM
LN
G Im
ports B
y Facility
BC
F
05
10
15
20
25
30
35
40
Ap
r-11
Ju
n-1
1A
ug
-11
Oc
t-11
Dec
-11
Feb
-12
Ap
r-12
Eg
yp
tN
igeri
aT
rin
idad
No
rway
Qata
rY
em
en
Peru
BC
F
US
LN
G Im
ports B
y O
rigin
01234567
JF
MA
MJ
JA
SO
ND
2010
2011
2012
Volum
e-W
eighted A
verage LN
G P
rice
US
$/M
MB
tu

CERI Commodity Report - Natural Gas
Page 16
SOU
RC
E: U
S D
OE,
NEB
. SO
UR
CE:
US
DO
E.
SOU
RC
E: E
IA, U
S D
OE.
SO
UR
CE:
US
DO
E.
01234567
Ap
r-11
Ju
n-1
1A
ug
-11
Oct-
11
Dec
-11
Feb
-12
Ap
r-1
2
US
LN
G E
xports
BC
F
Ja
pa
nC
hin
a
01234567
Ap
r-11
Ju
n-1
1A
ug
-11
Oct-
11
Dec
-11
Feb
-12
Ap
r-12
Co
no
co
Ph
illip
sM
ara
tho
n
US
LN
G E
xports
By E
xp
orte
r
BC
F

Relevant • Independent • Objective
Page 17
SOU
RC
E: C
ERI,
CA
OD
C, B
aker
Hu
ghes
. SO
UR
CE:
CER
I, C
AO
DC
.
SOU
RC
E: C
ERI,
CA
OD
C.
SOU
RC
E: C
ERI,
CA
OD
C.
0
500
1,0
00
1,5
00
2,0
00
2,5
00
3,0
00 Ja
n-0
3J
an
-04
Jan
-05
Jan
-06
Ja
n-0
7J
an
-08
Jan
-09
Jan
-10
Ja
n-1
1J
an
-12
US
WC
SB
North A
merican A
ctive R
igs
Rig
s
0
100
200
30
0
400
500
600
700
80
0
900
1,0
00 Jan
-03
Jan
-04
Jan
-05
Jan
-06
Jan
-07
Jan
-08
Jan
-09
Jan
-10
Jan
-11
Jan
-12
Acti
ve R
igs
To
tal R
ig D
rill
ing
Fle
et
Canadian R
ig Fleet U
tilization
We
ek
ly A
ve
ra
ge
A
ctive
R
ig
s
Rig
s
0
100
200
300
40
0
50
0
600
700 Jan
-09
Ju
l-09
Jan
-10
Ju
l-10
Jan
-11
Ju
l-11
Jan
-12
SK
AB
BC
WC
SB
A
ctive R
igs by P
rovince
We
ek
ly A
ve
ra
ge
Rig
s
-
100
20
0
300
400
500
60
0
700
800
15
913
17
21
25
29
33
37
41
45
49
5-Y
ear A
vg
.2011
2012
Western C
anada A
ctive R
igs
We
ek
ly A
ve
ra
ge
Rig
s
Week N
um
ber

CERI Commodity Report - Natural Gas
Page 18
SOU
RC
E: C
ERI,
Bak
er H
ugh
es.
SO
UR
CE:
CER
I, B
aker
Hu
ghe
s.
SOU
RC
E: C
ERI,
Bak
er H
ugh
es.
0%
10
%
20%
30%
40%
50
%
60%
70%
80
%
90%
100%
0
200
400
60
0
80
0
1,0
00
1,2
00
1,4
00
1,6
00
1,8
00
2,0
00
2,2
00
2,4
00 Jan
-03
Jan
-04
Jan
-05
Jan
-06
Jan
-07
Jan
-08
Jan
-09
Jan
-10
Jan
-11
Jan
-12
Oil
-Dir
ecte
dG
as-D
ire
cte
dG
as-D
ire
cte
d %
US
T
otal A
ctive R
igs
Rig
s
0
500
1,0
00
1,5
00
2,0
00
2,5
00 Jan
-03
Jan
-04
Jan
-05
Jan
-06
Jan
-07
Jan
-08
Jan
-09
Jan
-10
Jan
-11
Jan
-12
To
tal O
il-D
irec
ted
GO
M G
as
-Dir
ecte
dO
ns
ho
re G
as
-Dir
ecte
d
Rig
s
US
T
otal A
ctive R
igs
0
20
40
60
80
10
0
12
0
Jan
-03
Jan
-04
Jan
-05
Jan
-06
Jan
-07
Jan
-08
Jan
-09
Jan
-10
Jan
-11
Jan
-12
Oil
-Dir
ecte
dG
as
-Dir
ecte
d
US
G
ulf of M
exico A
ctive R
igs
Rig
s