maximum power point tracking control techniques applied to
TRANSCRIPT

1
Maximum power point tracking control Maximum power point tracking control techniques applied to photovoltaic systems techniques applied to photovoltaic systems
Carles JaénElectronic Engineering Department
Technical University of Catalonia, UPC, Terrassa, SpainNovember the 13th 2008
JCEE’08

2
� Introduction
� Overview of MPPT control techniques
� Perturb & Observe technique
� Simulation and experimental results
� Conclusion and future work
2JCEE’08

3
Berlin Declaration 2007Berlin Declaration 2007 was adopted at the end of The European Forum for Renewable Energy Sources
(EUROFORES) in its 7th Interparliamentary Meeting on Renewable Energy which took place on October 2007
Regarding the use of renewable energies that declaration expects that in 2020 the 20% of total energy consumption
in the EU will be based on renewable energies.
3JCEE’08

44
Wind power installed in the EU at the end of 2005 (in MW)
JCEE’08

55
Electricity production fromwind power
in the European Union(in TWh)
JCEE’08

66
Installed photovoltaic capacities in the EU (in MWp)
JCEE’08

77
� Strong dependence on country policies�Massively investing in new production capacities�Research on new materials
2010 2010 targettarget: 6000 : 6000 MWpMWp
The prospects of growth in the photovoltaic The prospects of growth in the photovoltaic marketmarket
JCEE’08
88
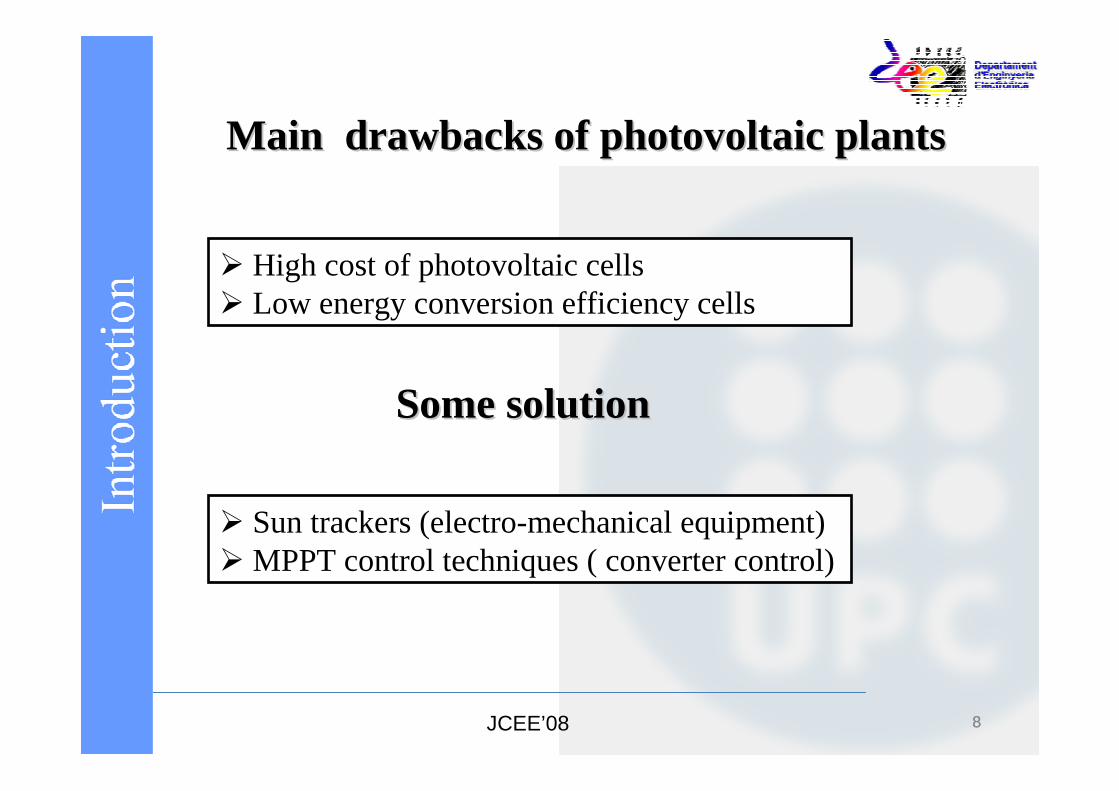
� High cost of photovoltaic cells� Low energy conversion efficiency cells
Main drawbacks of photovoltaic plantsMain drawbacks of photovoltaic plants
� Sun trackers (electro-mechanical equipment) � MPPT control techniques ( converter control)
Some solution Some solution
JCEE’08

99
MPPT control block diagramMPPT control block diagram
Photovoltaic Array
Switching converter
Load
MPPT controller
The converter control forces the PV module to work atMaximum Power Point
JCEE’08

1010
Main MPPT control techniquesMain MPPT control techniques
� Voltage control (VMMPT)� Current control (CMMPT)� Hill climbing (HC)� Perturbation and Observation (P&O) � Incremental conductance method (InC)� Others
JCEE’08
1111
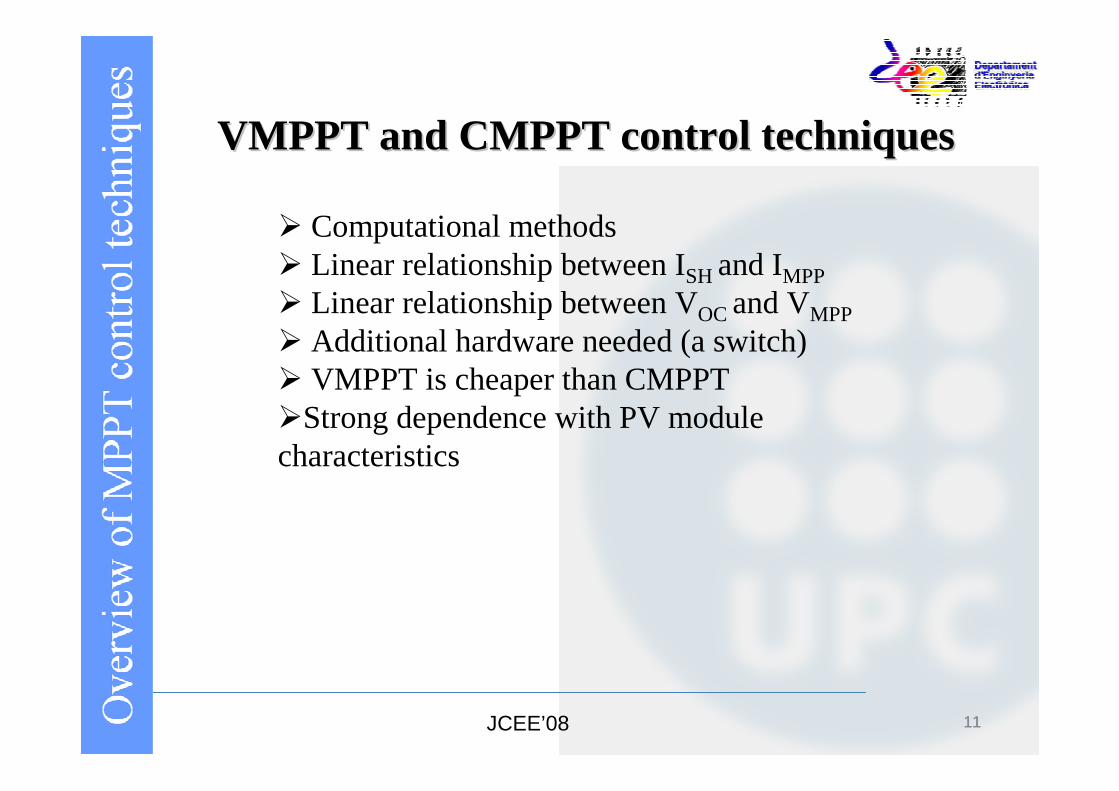
VMPPT and CMPPT control techniquesVMPPT and CMPPT control techniques
� Computational methods� Linear relationship between ISH and IMPP
� Linear relationship between VOC and VMPP
� Additional hardware needed (a switch)� VMPPT is cheaper than CMPPT �Strong dependence with PV module characteristics
JCEE’08

1212
HC control techniqueHC control technique
� Power feedback method� P(δ) follows a hill shape � Maximum power point can be achieved if the expression dP/dδ is zero� Pk is compared with Pk-1
� Simplicity ↑�Deviation in case of changing weather ↓
� Difficult balance between good performances and increment of δ ↓
JCEE’08

1313
P&O control techniqueP&O control technique
� Power feedback method� Maximum power point can be achieved if the expression dP/dV is zero� Condition independent of solar radiation and temperature� Simplicity ↑�Deviation in case of changing weather ↓
� Could oscillate around MPP ↓
JCEE’08

1414
InCInC control techniquecontrol technique
� Power feedback method
�Maximum power point can be achieved if
� Condition independent of solar radiation
and temperature
� Medium complexity
v
i
v
i −=∆∆
dv
divi
dv
vid
dv
dp +== )(
JCEE’08

1515
Other control techniquesOther control techniques
� Fuzzy logic control
� Neural network
� Ripple correlation control (RCC)
� Current sweep
JCEE’08
1616
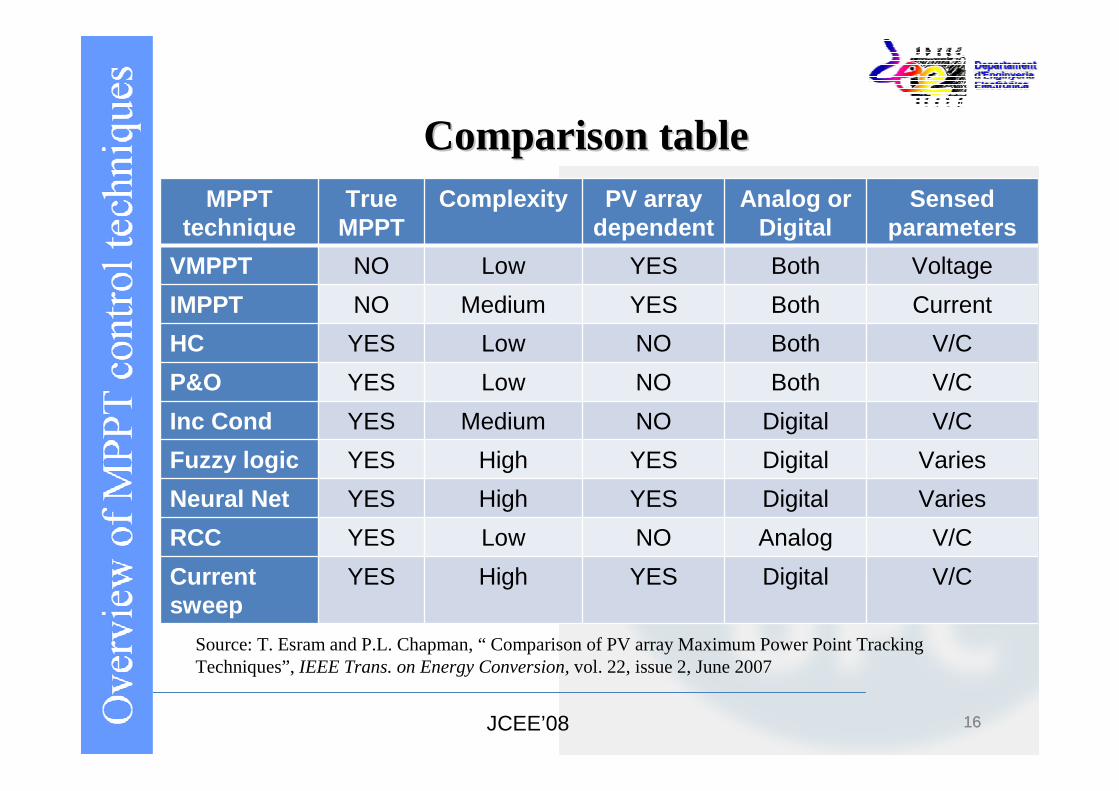
Comparison tableComparison tableMPPT
techniqueTrue
MPPTComplexity PV array
dependentAnalog or
DigitalSensed
parameters
VMPPT NO Low YES Both Voltage
IMPPT NO Medium YES Both Current
HC YES Low NO Both V/C
P&O YES Low NO Both V/C
Inc Cond YES Medium NO Digital V/C
Fuzzy logic YES High YES Digital Varies
Neural Net YES High YES Digital Varies
RCC YES Low NO Analog V/C
Currentsweep
YES High YES Digital V/C
Source: T. Esram and P.L. Chapman, “ Comparison of PV array Maximum Power Point TrackingTechniques”, IEEE Trans. on Energy Conversion, vol. 22, issue 2, June 2007
JCEE’08

1717
P&O applicationP&O application
0 5 10 15 20 250
5
10
15
20
25
30
35
40
45
50
55
PV voltage (V)
PV
Cur
rent
*10
(A)
(Blu
e) -
P
V P
ower
(W
) (R
ed)
1000 W/m2
750 W/m2
500 W/m2
250 W/m2
Tc = 25 ºC �Low complexity�Easy to implement� Easy to improve� Boost converter
JCEE’08

1818
P&O flow chartP&O flow chart
p(k)-p(k-1)=0
Start
Sense v(k) and i(k)
Calculate p(k)
p(k)-p(k-1)>0
v(k)-v(k-1)>0 v(k)-v(k-1)<0
Return
∆vvv refref −= ∆vvv refref +=∆vvv refref −=∆vvv refref +=
JCEE’08

1919
P&O study casesP&O study casesCase Conditions Position Control action
1 ∆pK>0, ∆vK>0 Left of MPP Increase δ
2 ∆pK>0, ∆vK<0 Right of MPP Decrease δ
3 ∆pK<0, ∆vK>0 Right of MPP Decrease δ
4 ∆pK<0, ∆vK<0 Left of MPP Increase δ
00
Voltage (V)
Po
wer
(W)
MPP
Case 1:v(k)>v(k-1) and p(k)>p(k-1)
p(k)
p(k-1)
v(k)v(k-1)
Case 1
JCEE’08

2020
Simulation resultsSimulation results
0 5 10 15 20 250
5
10
15
20
25
30
35
40
45
50
55
PV voltage (V)
PV
Cur
rent
*10
(A)
(Blu
e) -
P
V P
ower
(W
) (R
ed)
1000 W/m2
750 W/m2
500 W/m2
250 W/m2
Tc = 25 ºC
Simulation of Power – voltage (red) and current – voltage (blue) characteristics of a PV module BP350U for different radiation
levels at constant cell temperature
Technical dataMax. Power 50 WVoltage at Pmax 17,5 VCurrent at Pmax 2,9 AISC 3,17 AVOC 21,8 A
Rated power 50 WNom. voltage 12 VLimited warranty25years
Source: BP solar data sheet
JCEE’08

2121
Experimental resultsExperimental results
Photovoltaic Array
Switching converter
Load
MPPT controller
Module BP350U
(Sun tracker optional)
δ
MicrocontrollerADµC 812
Boost
iv
JCEE’08

2222
Experimental resultsExperimental results
JCEE’08

2323
Experimental resultsExperimental results
JCEE’08

2424
Experimental resultsExperimental results
Power comparison between Sun tracker (blue) and fixed oriented (red) systems
JCEE’08

2525
Experimental resultsExperimental results
Radiation comparison between Sun tracker (blue) and fixed oriented (red) systems
JCEE’08

2626
Experimental resultsExperimental results
Cells temperature comparison between Sun tracker (blue) and fixed oriented (red) systems
JCEE’08

2727
ConclusionConclusion
� Development of renevables energies is strongly dependant onEU policies and industrial capabilities� EU target for 2020 is to achieve 20% of total energy consumption based on renewable energies. � EU target for 2010: 6000 MWp ( PV systems only)
� MPPT control and sun trucker improve efficiency of PV systems� Different techniques to achieve MPPT have presented� A P&O control technique has been developped� Simulation and experimental results show good behavior� Sun tracker tecnique improve MPPT control technique
JCEE’08

2828
Future workFuture work
� Improve the algorith used in previous P&O application� Improve sun tracker application�Complete the experimental comparison with other MPPT control techniques using the actual PV system�Asssembly of a new PV plant of 20 modules (3.400 Wp)� Application of MPPT control techniques and sun truckers tothe new plant
JCEE’08