maximum element temperature for kanthal super 1800s in - diva
TRANSCRIPT

UPTEC Q10002
Examensarbete 30 hpMars 2010
Maximum element temperature for Kanthal Super 1800S in flowing nitrogen atmosphere with low content of oxygen Kanthal AB, Hallstahammar
Petter Persson
Teknisk- naturvetenskaplig fakultet UTH-enheten Besöksadress: Ångströmlaboratoriet Lägerhyddsvägen 1 Hus 4, Plan 0 Postadress: Box 536 751 21 Uppsala Telefon: 018 – 471 30 03 Telefax: 018 – 471 30 00 Hemsida: http://www.teknat.uu.se/student
Abstract
Maximum element temperature for Kanthal Super1800S in flowing nitrogen atmosphere with lowcontent of oxygenPetter Persson
Abstract
The behavior for MoSi2 based high temperature heating elements for resistive heatinghas been examined in elevated temperature and low oxygen content environment.MoSi2 spontaneously forms a protective SiO2 scale at high temperature if the amountof oxygen in the ambient atmosphere is sufficient according to the following reaction:
5MoSi2 + 7O2(g) -> 7SiO2 + Mo5Si3
If the oxygen content at a specific temperature is too low, SiO(g) is more stable thanSiO2 and the following reaction will occur instead:
2SiO2 -> 2SiO(g) + O2(g)
Then surface will be Si-deplated and finally, the base material will be exposed. Si andMo will oxidize and degas from the surface as SiO and MoO3 with severe diameterreduction of the heating element as a result. It is therefore of high interest to find therelationship between the maximum element temperature and the oxygen content inthe ambient atmosphere to be able to fully exploit the potential of the heatingelements and also to aid and help diagnose customer complaints.
After 14 full scale tests in a custom made atmospheric furnace, the following equationcould be calculated:
p(O2) = 1.748·10^(0.01677·T·log(e)-10)
The equation gives the minimum oxygen content at a specified temperature. Theequation is based on 100 hours tests at atmospheric pressure, gas flow rate of 4 literper minute, varying temperature and varying oxygen content. Nitrogen has been usedas carrier gas for the oxygen.
Sponsor: Kanthal ABISSN: 1401-5773, UPTEC Q10002Examinator: Åsa KasmanÄmnesgranskare: Urban WiklundHandledare: Mats Sundberg

Maximal elementtemperatur för Kanthal Super 1800S
i flödande kväveatmosfär med låg syrehalt
Petter Persson
Kanthal Super 1800S är ett keramiskt material baserat på MoSi2 samt ca 10% bindemedel. Materialet används för att tillverka värmeelement för resistiv uppvärmning av ugnar vid höga temperaturer, upp till 1800°C. Vid höga temperaturer och med tillräckligt mycket syre i omgivande atmosfär oxiderar Si till SiO2 varvid ett amorft glas bildas och passiverar ytan. Oxidskikttillväxthastighet sker paraboliskt och går alltså långsammare med ökad skikttjocklek. Om syrehalten i den omgivande atmosfären är för låg för den aktuella elementtemperaturen är SiO(g) mer stabil än SiO2 vilket innebär att Si kommer att avges från ytan. Nära ytan omvandlas då MoSi2 till en fas med lägre Si-halt, Mo5Si3 för att oxidations-processen ska kunna fortgå. Denna fas har sämre oxidationsegenskaper än MoSi2 och är icke önskvärd. Får reaktionen fortgå kommer grundmaterialet utarmas än mer och tillslut finns bara Mo kvar. Mo oxiderar väldigt lätt med kraftig materialförlust av grundmaterialet som följd. Syftet med arbetet är att finna denna gräns mellan passiverande skiktbildning och Si-avgasning från ytan för att bäst kunna utnyttja värmeelementens potential.
Utförande
En specialbyggd atmosfärsugn, figur 1, med tillhörande gasblandnings och analysutrustning för fullskaleförsök fanns att tillgå. Isolering till ugnen och värmeelement tillverkades efter önskemål. Värmeelementens glödzon var U-formad, 3 mm i diameter och 145 mm hög, se figur 2. Elementen föroxiderades i luft eftersom konen som förbinder tilledaren med glödzonen slipas fram under elementtillverkningen och då försvinner den skyddande oxiden. Atmosfärsugnen förslöts sedan med silikonpackning och lock. Därefter sköljdes Figur 1, atmosfärsugn.atmosfärsugnen med kvävgas till önskad syrehalt kunde mätas på utgången. Då kopplades gasblandaren in och ren syrgas fördes in i önskad mängd för att få rätt syrehalt i den färdiga gasblandningen. Försöken utfördes under atmosfärstryck och med ett gasflöde på 4 liter per minut. Temperaturen mättes med en IR-pyrometer genom siktglas i ugnen. Elementen undersöktes sedan visuellt för att se eventuella ytdefekter, SEM för att studera skikttjocklek och Si-utarmning av grundmaterialet samt XRD för att fastställa vilka ytnära faser som existerade.
Figur 2, Värmeelement.

Resultat
14 stycken 100-timmarsförsök vid fem olika syrehalter utfördes och resultaten finns sammanfattade i figur 3a. För att ett försök ska anses vara godkänt ska elementen vara i väl fungerande skick och SiO2-skiket ska vara intakt, se exempel i figur 3b(vänster). Vid den högsta temperaturen skedde elementbrott och vid den näst högsta splittrades elementet under svalningsprocessen på grund av höga interna spänningar mellan substrat och skikt. Vid båda dessa försök fanns alltså oxid kvar på ytan. De övriga fyra försök som falerat har helt eller delvis förlorat sin skyddande oxid, detta på grund av för hög temperatur jämfört med aktuell syrehalt, se exempel i figur 3b(höger).
Figur 3a, resultat av de 14 testerna. Rund markering svarar Figur 3b, heltäckande oxidskiktmot uppmätt temperatur och kvadratisk kantställd mot samt gränsen mellan Mo5Si3emissivitetskorrigerad temperatur. Försök som klarat sig och oxid.är markerade med grönt och de som falerat med rött.
p(O2) = 1.748·100.01677·T·log(e)-10
Ekvationen ovan ger en syrehalt som inte får underskridas för aktuell temperatur och baseras på de element som klarat provning 100 timmar vid atmosfärstryck, flödeshastighet på 4 liter per minut samt konstant temperatur och syrehalt utan att fallera.
Diskussion
Många felkällor, så som rätt värde på emissivitet, temperaturgradienter i ugnen, turbulent gasflöde osv. gör det svårt att få ett absolut värde för temperaturen i ugnen att lita på. Det högsta värdet på den korrigerade temperaturen var dock 1787°C, väldigt nära, men under de 1800°C materialet ska klara. Det är därför högst troligt att den verkliga temperaturen har varit något högre än den uppmätta vilket gör att resultaten är användbara. Denna skillnad mot verkliga temperaturen kan tolkas som en säkerhetsfaktor.
Slutsats
Syftet med arbetet är uppfyllt och Kanthal Super 1800S ska användas i miljöer med en syrehalt överstigande p(O2) = 1.748·100.01677·T·log(e)-10 där T är temperaturen i °C och p(O2) i ppm i atmosfärstryck.
Examensarbete 30 hp på civilingenjörsprogrammet
Teknisk fysik med materialvetenskap
Uppsala universitet, februari 2010

Table of contents
1 Introduction...............................................................................................................................1 1.1 Background ............................................................................................................................1 1.2 Aim of this thesis....................................................................................................................1
2 Theory.........................................................................................................................................1 2.1 Material ..................................................................................................................................1 2.2 Material properties .................................................................................................................2 2.3 Previous work.........................................................................................................................2 2.4 Thermodynamic calculations .................................................................................................3
3 Equipment and analysis instruments...................................................................................4 3.1 Atmospheric furnace ..............................................................................................................4 3.2 Scanning Electron Microscope (SEM)...................................................................................5 3.3 X-Ray Diffraction (XRD) ......................................................................................................7 3.4 Oxygen measurements ...........................................................................................................8 3.5.1 Temperature measurements.................................................................................................8 3.5.2 The emission factor .............................................................................................................9 3.6.1 Heating elements ...............................................................................................................10 3.6.2 Cross section diameter and silica scale thickness measurements .....................................10
4 Experimental...........................................................................................................................11 5 Results.......................................................................................................................................12
5.1 Test 1.1 .................................................................................................................................12 5.2 Test 1.2 .................................................................................................................................14 5.3 Test 1.3 .................................................................................................................................17 5.4 Test 2.1 .................................................................................................................................21 5.5 Test 2.2 .................................................................................................................................23 5.6 Test 3.1 .................................................................................................................................27 5.7 Test 3.2 .................................................................................................................................29 5.8 Test 3.3 .................................................................................................................................31 5.9 Test 3.4 .................................................................................................................................33 5.10 Test 4.1 ...............................................................................................................................36 5.11 Test 4.2 ...............................................................................................................................38 5.12 Test 4.3 ...............................................................................................................................40 5.13 Test 5.1 ...............................................................................................................................42 5.14 Test 5.2 ...............................................................................................................................44
6 Result summary......................................................................................................................46 7 Discussion................................................................................................................................49 8 Conclusion...............................................................................................................................53 9 References................................................................................................................................54

1
1 Introduction 1.1 Background
Kanthal Super 1800S high temperature electric heating elements are used in many types of atmospheres. Some times customers use Kanthal Super 1800S in atmospheres almost absent of oxygen and the heating elements have failed. This report will bring clarity to what will happen under such condition and to aid technical support. The bulk material molybdenum disilicide, MoSi2, requires oxygen to form the protective silica (amorphous SiO2) scale at elevated temperatures and thus the maximum operating temperature will depend on the oxygen partial pressure. If the oxygen content is sufficient, the following reaction will be favored
5MoSi2 + 7O2(g) � 7SiO2 + Mo5Si3 (1)
If the oxygen partial pressure is too low and the temperature low enough not to cause melting of the heating element the silica scale will evaporate due to reaction (1) [1]
2SiO2 � 2SiO(g) + O2(g) (2)
1.2 Aim of this thesis
This thesis aims to find the relationship between the oxygen partial pressure and maximum operating element temperature. The heating elements shall be in working condition after 100 hours in flowing nitrogen ambient atmosphere with deficit of oxygen and the grade tested shall be Kanthal Super 1800S. 2 Theory 2.1 Material
Kanthal Super 1800S is an intermetallic compound mainly made of MoSi2, about 10 % bond material (XAlySiOz) and a protective silica scale which is spontaneously formed at elevated temperatures in an O2 rich atmosphere [KS Handbook page 9], see schematic sketch in figure 1. Due to the fast diffusion rate of Si from the bulk material MoSi2 through the Mo5Si3 layer, the oxidation will primarily occur at the Mo5Si3/SiO2 interface and the oxidation rate will be determined by the inward diffusion of oxygen through the SiO2 scale.[2]
Figure 1, schematic sketch of the composition of Kanthal Super 1800S.
2
2.2 Material properties
Tensile strength at 1550°C 100MPa ± 25% Bending strength at 20°C 450MPa ± 10% Compression strength at 20°C 1400-1500 MPa Fracture toughness, KIC, at 20°C 3-4 Mpam1/2
Hardness, HV at 20°C 9 GPa Density 5.6 g/cm3
Thermal conductivity 20-600°C approx. 30 Wm-1K-1 600-1200°C approx. 15 Wm-1K-1
Coefficient of linear expansion 7-8·10-6 K-6
Specific heat capacity at 20°C 4.42 kJkgK-1
Emissivity 0.7-0.8 Resistivity Temperature dependent,
see figure 2 Table 1, resistivity vs. temperature. Since KS1800S is an Figure 2, resistivity vs. intermetallic compound, its resistivity will increase with temperature for KS1800S. due to electron-phonon-interactions. [3] 2.3 Previous work
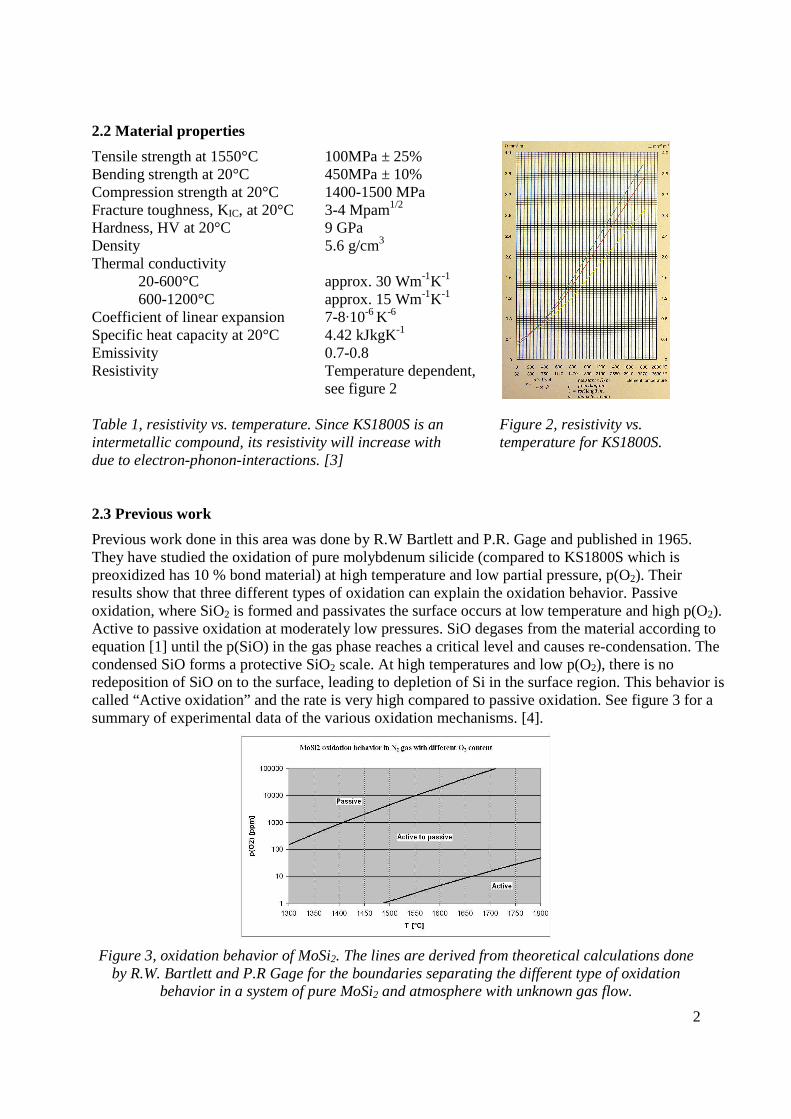
Previous work done in this area was done by R.W Bartlett and P.R. Gage and published in 1965. They have studied the oxidation of pure molybdenum silicide (compared to KS1800S which is preoxidized has 10 % bond material) at high temperature and low partial pressure, p(O2). Their results show that three different types of oxidation can explain the oxidation behavior. Passive oxidation, where SiO2 is formed and passivates the surface occurs at low temperature and high p(O2). Active to passive oxidation at moderately low pressures. SiO degases from the material according to equation [1] until the p(SiO) in the gas phase reaches a critical level and causes re-condensation. The condensed SiO forms a protective SiO2 scale. At high temperatures and low p(O2), there is no redeposition of SiO on to the surface, leading to depletion of Si in the surface region. This behavior is called “Active oxidation” and the rate is very high compared to passive oxidation. See figure 3 for a summary of experimental data of the various oxidation mechanisms. [4].
Figure 3, oxidation behavior of MoSi2. The lines are derived from theoretical calculations done by R.W. Bartlett and P.R Gage for the boundaries separating the different type of oxidation
behavior in a system of pure MoSi2 and atmosphere with unknown gas flow.
3
The material used in this thesis for testing in the atmospheric furnace, was KS1800S and it had already a protective silica scale. This silica scale and the known flow rate of ambient atmosphere is what differ between this thesis and the work done by R.W. Bartlett and P.R Gage. Criteria for the heating elements tested in the atmospheric furnace to pass are that the elements shall be in well working condition after 100 hours. 2.4 Thermodynamic calculations
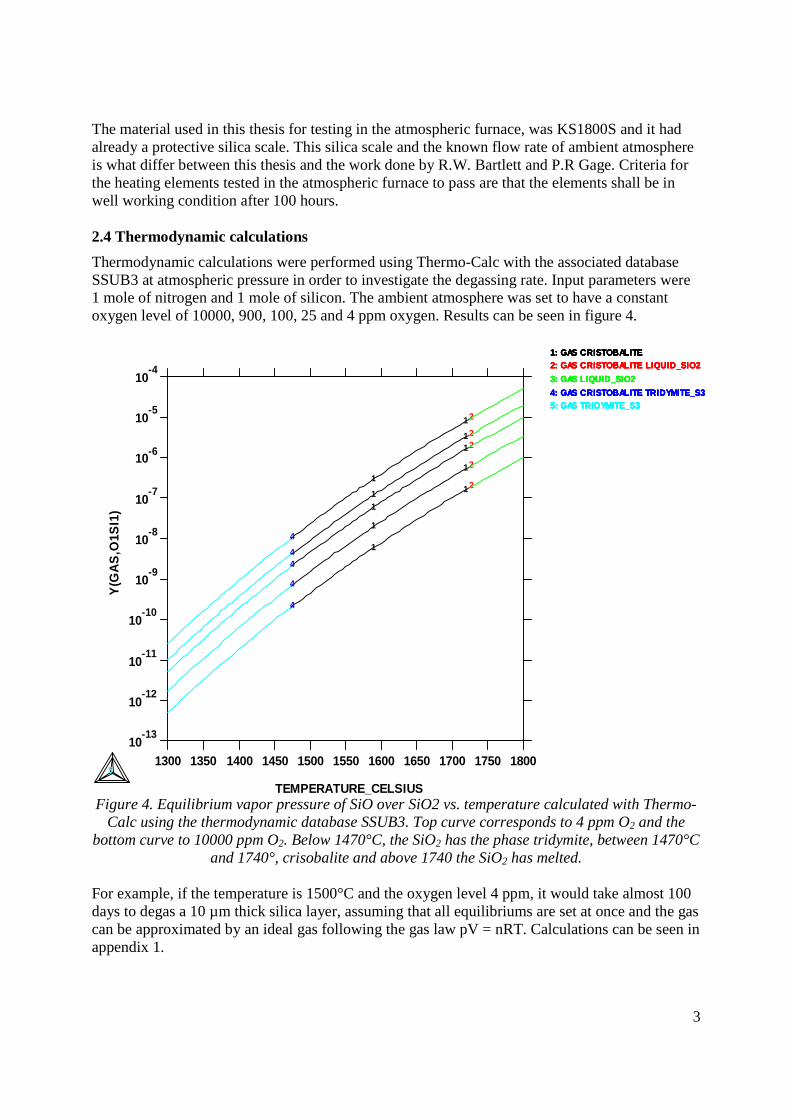
Thermodynamic calculations were performed using Thermo-Calc with the associated database SSUB3 at atmospheric pressure in order to investigate the degassing rate. Input parameters were 1 mole of nitrogen and 1 mole of silicon. The ambient atmosphere was set to have a constant oxygen level of 10000, 900, 100, 25 and 4 ppm oxygen. Results can be seen in figure 4.
10-13
10-12
10-11
10-10
10-9
10-8
10-7
10-6
10-5
10-4
Y
(GA
S,O
1SI1
)
1300 1350 1400 1450 1500 1550 1600 1650 1700 1750 1800
TEMPERATURE_CELSIUS
1
1: GAS CRISTOBALITE
2
2: GAS CRISTOBALITE LIQUID_SIO2
3: GAS LIQUID_SIO2
1
4
4: GAS CRISTOBALITE TRIDYMITE_S3 5: GAS TRIDYMITE_S3
1
1: GAS CRISTOBALITE
2
2: GAS CRISTOBALITE LIQUID_SIO2
3: GAS LIQUID_SIO2
1
4
4: GAS CRISTOBALITE TRIDYMITE_S3 5: GAS TRIDYMITE_S3
1
1: GAS CRISTOBALITE
2
2: GAS CRISTOBALITE LIQUID_SIO2
3: GAS LIQUID_SIO2
1
4
4: GAS CRISTOBALITE TRIDYMITE_S3 5: GAS TRIDYMITE_S3
1
1: GAS CRISTOBALITE
2
2: GAS CRISTOBALITE LIQUID_SIO2
3: GAS LIQUID_SIO2
1
4
4: GAS CRISTOBALITE TRIDYMITE_S3 5: GAS TRIDYMITE_S3
1
1: GAS CRISTOBALITE
2
2: GAS CRISTOBALITE LIQUID_SIO2
3: GAS LIQUID_SIO2
1
4
4: GAS CRISTOBALITE TRIDYMITE_S3
5
5: GAS TRIDYMITE_S3
Figure 4. Equilibrium vapor pressure of SiO over SiO2 vs. temperature calculated with Thermo-
Calc using the thermodynamic database SSUB3. Top curve corresponds to 4 ppm O2 and the bottom curve to 10000 ppm O2. Below 1470°C, the SiO2 has the phase tridymite, between 1470°C
and 1740°, crisobalite and above 1740 the SiO2 has melted. For example, if the temperature is 1500°C and the oxygen level 4 ppm, it would take almost 100 days to degas a 10 µm thick silica layer, assuming that all equilibriums are set at once and the gas can be approximated by an ideal gas following the gas law pV = nRT. Calculations can be seen in appendix 1.

4
3 Equipment and analysis instruments
3.1 Atmospheric furnace
The atmospheric furnace enables testing in controlled atmospheres. The chamber is made of stainless steel, the internal insulation fiber of Cell lite’s Cellaris A2 (50 mm) and the outer insulation of RAT 144400 (70 mm), see figure 5. Both types of insulation are Al2O3-based. In this thesis, pure N2 with residual oxygen content of 4 ppm was mixed manually with pure oxygen to achieve the desired oxygen content, see figure 6. The N2 Flow rate was 4 liter/minute and the O2 flow rate was varied between 0 ml/minute (4 ppm residual oxygen content) and 40 ml/minute (about 10000 ppm O2) The gas has its inlet in the center of the bottom of the furnace and its outlet at the center of the top. The gas is then led through the oxygen analyzer and out to the ambient air, see figure 6 for details. There is a hole in the insulation fiber at the top for gas outlet and one on the side to enable element temperature measurement via a pyrometer, as described in sector 3.5.1. Schematic drawings of the atmospheric furnace and the insulation fiber can be found in appendix 2. The lid fits onto the top of the chamber and is mounted by several bolts. Between the chamber and lid there is a silicon rubber gasket.
Figure 5, The atmospheric furnace without its lid. Note the hole in the insulation for temperature
measurements.

5
Figure 6, flow chart. The thick lines represent gas flow and the thin lines electric communication between the units. If the N2 gas flow is to low, the pressure in the atmospheric furnace too high or if the O2-flow controller fails, the control box will tell the control cabinet to shut the power down to protect the heating elements. All tests were performed at atmospheric pressure, just a slight
overpressure due to the incoming gas flow. 3.2 Scanning Electron Microscope (SEM)
The SEM used in this thesis was Zeiss Supra VP55 and it was primarily used for to study the oxide thickness and silica depletion. This SEM basically consists of a FEG (Field Emission Gun) electron source which emits electrons which are accelerated by the anode, see figure 7a, and then focused and swept on the sample by an electromagnetic lens system, see figure 7b. A vacuum system keeps the sample chamber at high vacuum, 10-6-10-7 mbar and the filament chamber is always under ultra high vacuum, better than 9·10-9 mbar.
Figure 7a, schematic figure of the beginning Figure 7b, magnetic lens system of the electron path. Zeiss Supra VP55.

6
Once the electrons hit the sample, several different types of electrons and X-rays are created, see figure 8. The SEM uses the backscattered and secondary electrons to generate an image. In this thesis, two types of detectors were used, AsB and SE2. The AsB detector gave the best contrast between the MoSi2 and Mo5Si3 phase due to its ability to detect widely dispersed backscattered electrons. The AsB detector also gives some information of the samples’ crystal orientation. Unfortunately the AsB detector broke down and therefore the SE2 detector has been used instead since it gave the second best contrast between the two important phases MoSi2 and Mo5Si3. The SE2 detector is mounted on the chamber wall and detects both secondary- and back-scattered electrons while the AsB detector primarily detects only back-scattered electros. [5]
Figure 8, the different type of electrons and X-rays
generated in the sample by the incident beam.

7
3.3 X-Ray Diffraction (XRD)
The sample was irradiated by an incident Kα,β-beam. Kβ is filtered before reaching the detector, see figure 10 from five different fixed angles, 10°, 8°, 6°, 4°, 2°, 1° and a detector is swept with 0,020° steps between 0° and 30° along the focusing circle. The low incident XRD has been used in this thesis to determine the phases present at and close to the surface. The different crystal planes in the sample will diffract the incoming X-rays according to Bragg’s law, creating a spectra of intensity as function of diffraction angle. The diffraction pattern is unique for each phase and can be identified by comparing the diffraction pattern to a database of known structures. The instrument used was a Bruker D8 Advance, see figure 9 for schematic setup. [6]
Figure 9, schematic setup for XRD-analysis.
8
3.4 Oxygen measurements
Oxygen measurements were conducted with a METEK® Thermox® CG1000 Oxygen Analyzer. The sensor is made of zirconium oxide, zirconia, and has an operating temperature of 615°C due to the low mobility of oxygen ions at low temperature and the poor low temperature electrical conductivity. At operating temperature, a voltage that is logarithmically proportional to the oxygen concentration at the reference side (usually ambient air, 20.9%) and inverse logarithmically proportional to the oxygen concentration at the sample gas side as follows: E = AT·log(O2ref/O2sample) (3) Where E = voltage over the zirconia cell A = 0,067692 V/°C T = 615°C O2ref = usually 20.9 % O2sample is unknown. 3.5.1 Temperature measurements
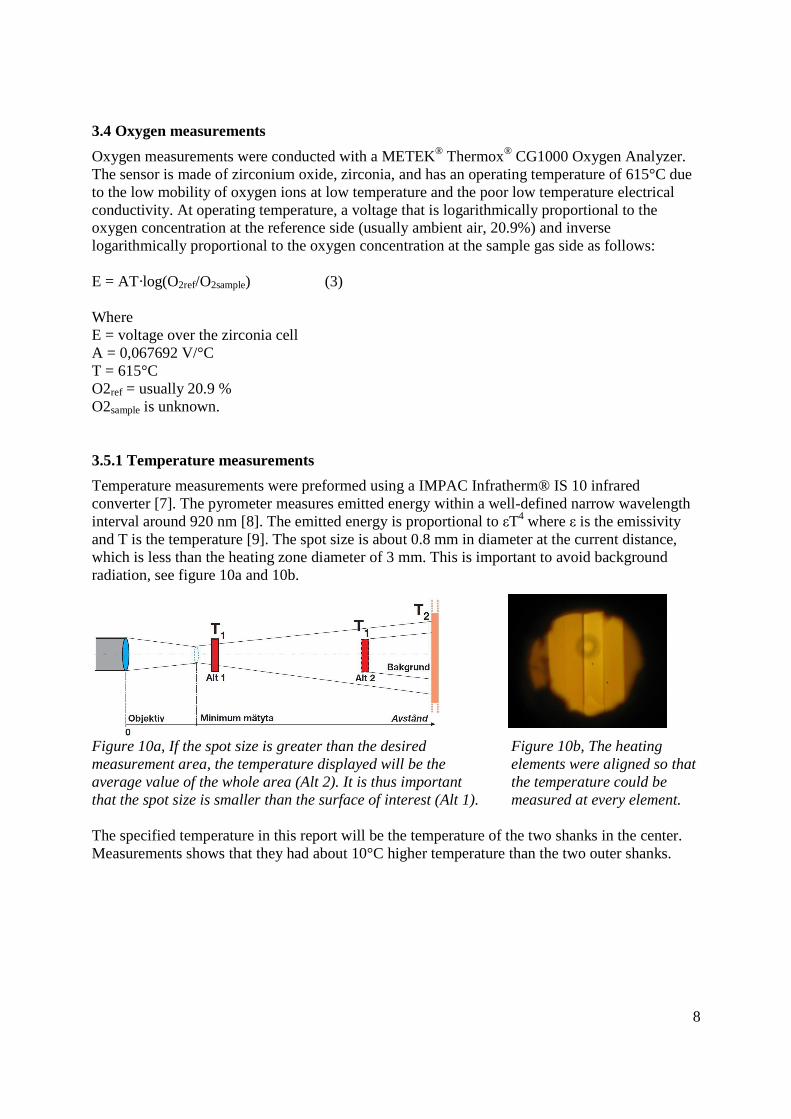
Temperature measurements were preformed using a IMPAC Infratherm® IS 10 infrared converter [7]. The pyrometer measures emitted energy within a well-defined narrow wavelength interval around 920 nm [8]. The emitted energy is proportional to εT4 where ε is the emissivity and T is the temperature [9]. The spot size is about 0.8 mm in diameter at the current distance, which is less than the heating zone diameter of 3 mm. This is important to avoid background radiation, see figure 10a and 10b.
Figure 10a, If the spot size is greater than the desired Figure 10b, The heating measurement area, the temperature displayed will be the elements were aligned so that average value of the whole area (Alt 2). It is thus important the temperature could be that the spot size is smaller than the surface of interest (Alt 1). measured at every element. The specified temperature in this report will be the temperature of the two shanks in the center. Measurements shows that they had about 10°C higher temperature than the two outer shanks.
9
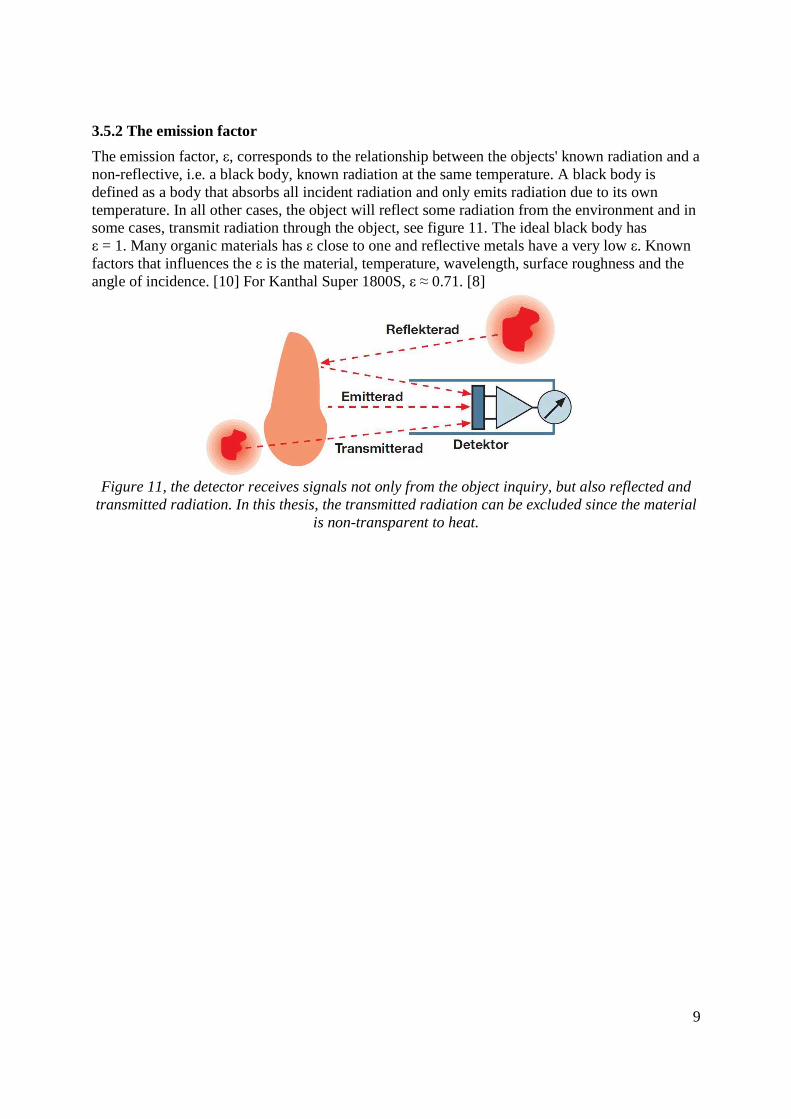
3.5.2 The emission factor
The emission factor, ε, corresponds to the relationship between the objects' known radiation and a non-reflective, i.e. a black body, known radiation at the same temperature. A black body is defined as a body that absorbs all incident radiation and only emits radiation due to its own temperature. In all other cases, the object will reflect some radiation from the environment and in some cases, transmit radiation through the object, see figure 11. The ideal black body has ε = 1. Many organic materials has ε close to one and reflective metals have a very low ε. Known factors that influences the ε is the material, temperature, wavelength, surface roughness and the angle of incidence. [10] For Kanthal Super 1800S, ε ≈ 0.71. [8]
Figure 11, the detector receives signals not only from the object inquiry, but also reflected and transmitted radiation. In this thesis, the transmitted radiation can be excluded since the material
is non-transparent to heat.

10
3.6.1 Heating elements
The element consists of three different sections, the terminal, cone and the heating zone. The terminal is usually made from the same material as the heating zone and at the rear of the terminal is where the AC power is applied. The cone is ground from the terminal and offers a smooth transition from the thick terminal to the thin heating zone. The heating zone is bent in hot condition and then welded on to the cone. See appendix 3 for drawing. The numbers on the heating zone are help to localize where defects occur and images taken. Figures below will be referred to this figure, for example “position 9” means center of element 1 closest to the center of the furnace, see figure 12.
Figure 12, Heating element position map.
3.6.2 Cross section diameter and silica scale thickness measurements
The sintered surface of the heating elements has a relatively rough surface, which makes it impossible to determine a well-defined diameter and scale thickness for thin scales. Scale thickness also varies macroscopically around the sample. The diameter and silica scale thickness are therefore taken systematically at different positions for good statistics. Diameter measurements were preformed using a micrometer and the diameter was measured at six different places on each sample, position 1, 3, 5, 7, 9 and 11. Scale thickness was measured in SEM at the same positions as for the cross section measurements and also at the bottom of the kink. Four measurements with 90° separation at every cross section were preformed.

11
4 Experimental In each test, two elements were tested simultaneously, as can be seen in figure 5 and 14. A total of 14 tests conducted at five different oxygen levels. The aim was to perform tests at 1, 10, 100, 1000 and 10000 ppm oxygen. Due to practical reasons, some of the desired oxygen levels were changed and tests occurred at 4, 25, 100, 900 and 10000 ppm oxygen. 4 ppm was the residual oxygen content in the N2 gas, 25 ppm was between 4 and 100 ppm. 100 ppm and 900 ppm was set to match the calibration gas for an other oxygen sensor used at Kanthal. This calibration gas was also aimed to be used for thermogravimetric analysis (TG), but unfortunately the TG equipment suffered from severe leakage and could not be used during the time of this master thesis. The temperatures were chosen to match or relate to the curve separating the passive and active to passive areas in figure 3. The first test series had a 100 ppm oxygen content and the first test was conducted at 1278°C, coincident with the curve. The second test temperature was chosen to correspond to a tenfold of oxygen content increment, following the same curve, thus 1409°C. Before test 3.4, the oxygen flow controller had to be sent for recalibration and another flow controller was used. This flow controller was very sensitive to small adjustments at low oxygen partial pressures. Thus, when 110 ppm equilibrium was reached, it was considered to be close enough 100 ppm and not to be changed to risk the gas composition. Since every test lasted for 100 hours, there was no time for a complete matrix test series and thus, the temperatures at each oxygen level was chosen based on previous results during the test period along with the curve separating the passive and active to passive transition. For pedagogic reasons, the test series will not be presented in the order they were conducted, but starting with the lowest oxygen level and lowest temperature, see table 2.
Table 2, temperature and oxygen level of the five test series.
Ramping time was dependent of the desired element temperature. The transformer gave 75A and this maximum current was adapted to the heating elements until the wanted temperature was reached. The current was then controlled manually so the element temperature does not exceed the desired value. First of all, a preoxidation was performed to form a protective silica scale on the cones since they are ground from the terminal and thus loses their silica scale. Typical ramping time for the preoxidation was about 30 minutes. After preoxidation in air for 15 minutes
12
in 1620°C, the elements cooled down to room temperature. The lid was then adapted on to the atmospheric furnace and the chamber was flushed with N2 until the desired O2 level was reached. The temperature was chosen to match the sintering temperature in production and the time to ensure a sufficient silica scale thickness on the cones of about 4 µm. The silica scale thickness of the heating zone increased from 4 µm to 10 µm approximately. The oxygen flow controller was then set at the correct value for the gas mixture and the chamber was flushed for several hours to ensure a homogeneous atmosphere. The oxygen analyzer was checked to ensure that the oxygen level was correct and when the oxygen level had been constant for a couple of hours, the heating begun. 5 Results
5.1 Test 1.1
Oxygen content 4 ppm, N2 balance. Element temperature (Te) 1355°C Duration 100 hours Flow rate 4 liter per minute Average change in diameter 4 µm Average silica scale thickness after test 10 µm 5.1.1 Visual inspection
Terminals
No visible defects. Cone
No visible defects. Heating zone
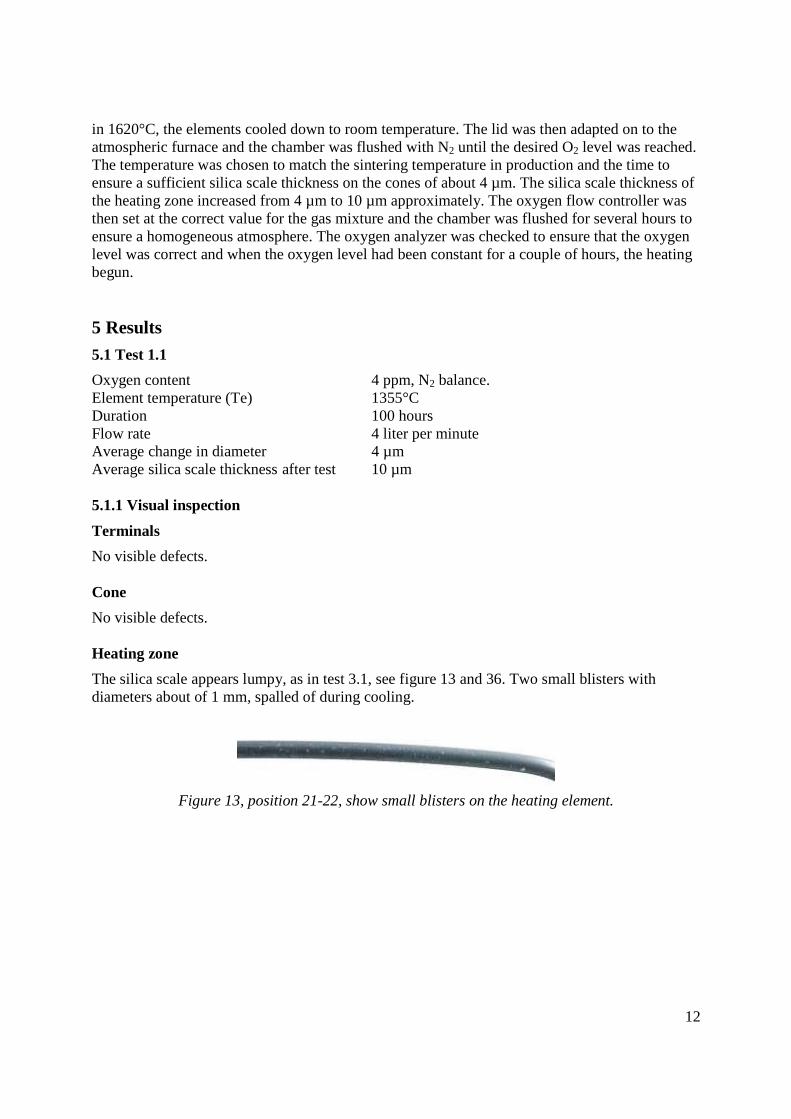
The silica scale appears lumpy, as in test 3.1, see figure 13 and 36. Two small blisters with diameters about of 1 mm, spalled of during cooling.
Figure 13, position 21-22, show small blisters on the heating element.
13
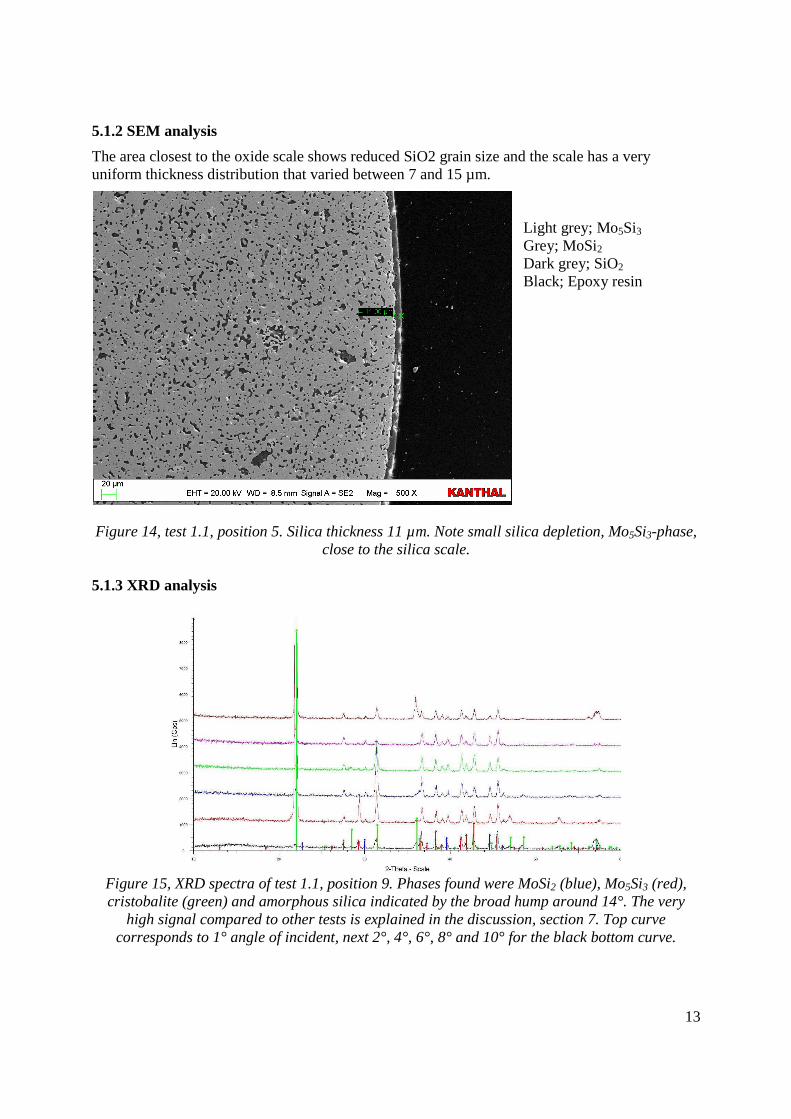
5.1.2 SEM analysis
The area closest to the oxide scale shows reduced SiO2 grain size and the scale has a very uniform thickness distribution that varied between 7 and 15 µm.
Light grey; Mo5Si3 Grey; MoSi2 Dark grey; SiO2 Black; Epoxy resin
Figure 14, test 1.1, position 5. Silica thickness 11 µm. Note small silica depletion, Mo5Si3-phase, close to the silica scale.
5.1.3 XRD analysis
Figure 15, XRD spectra of test 1.1, position 9. Phases found were MoSi2 (blue), Mo5Si3 (red), cristobalite (green) and amorphous silica indicated by the broad hump around 14°. The very
high signal compared to other tests is explained in the discussion, section 7. Top curve corresponds to 1° angle of incident, next 2°, 4°, 6°, 8° and 10° for the black bottom curve.

14
5.2 Test 1.2
Oxygen content 4 ppm, N2 balance. Element temperature (Te) 1425°C Duration 100 hours Flow rate 4 liter per minute Average change in diameter -0,033 mm, due to the loss of silica, the diameter
changes are large. Position 12, 14, 16 did not change in diameter in average.
Average silica scale thickness after test 22 µm Average Mo5Si3 thickness after test 20 µm
5.2.1 Visual inspection
Terminal
Spallation of the silica close to the cone just above position 1. Cone
Some spallation of silica at the border between the cone and terminal above position 1. Heating zone
About half of element 1 and one third of element 2 suffered from severe silica loss, see figure 16.
Figure 16, Heating element 1 to the right and 2 to the left. Both elements’ silica was vaporized at the bend. Element 1 did also suffer silica loss at position 1 and 2. Position 2 (right image),
transition from silica to Mo5Si3.

15
5.2.2 SEM analysis Images below show the two different areas, where the silica scale is still intact and where it has vaporized, as in test 1.3.
Figure 17, test 1.2, position 10. 27 µm thin silica scale and a 200 µm thick
Mo5Si3 enriched area subjacent the silica.
Figure 18, test 1.2, position 5. A 19 µm Mo5Si3 layer at the surface and
underneath, a 190 µm thick Mo5Si3 enriched MoSi2 layer.

16
5.2.3 XRD Analysis
Figure 19, XRD spectra of test 1.2, position 6, the oxidized part. Phases present
were Mo5Si3 (red) and cristobalite (green).
Figure 20, XRD spectra of test 1.2 position 8, the degassed part. Phases present
were Mo5Si3 (red), magnesium calcium carbonate (Mg0.06Ca0.96)(CO3), clay (green) and amorphous silica indicated by the hump around 15°.

17
5.3 Test 1.3
Oxygen content 4 ppm, N2 balance. Element temperature (Te) 1494°C Duration 100 hours Flow rate 4 liter per minute Average change in diameter -72 µm Average silica scale thickness after test 25 µm Average Mo5Si3 thickness after test 29 µm 5.3.1 Visual inspection
Terminals
The silica had reacted with the insulation fiber and caused discoloration. Some fiber also got stuck in the terminals, see figure 21. Cone
Half of the cone oxide was vaporized and the subjacent MoSi2 turned into Mo5Si3, see figure 21.
Figure 21, vaporization of the cone oxide and fiber contamination.

18
Heating zone
Almost the entire heating zone silica was degassed and the subjacent MoSi2 was converted into Mo5Si3. Only fragments of the original oxide remains, see figure 22.
Figure 22, heating element 2 and 1, shows that almost all silica is vaporized. Close up at position 13-14 and 8-9, severe blister formation and vaporization of the silica.

19
5.3.2 SEM analysis
Images below show the two different areas, where the silica scale is still intact and where it has vaporized.
Figure 23, test 1.3, position 3. Oxide scale thickness 27 µm and a thin Si depleted Mo5Si3 zone.
The area of approximately 50 µm closest to the oxide has slightly less SiO2 than the bulk material.
Figure 24a, test 1.3, position 2. Worst Si- Figure 24b, test 1.3, position 2. 45µm thin depleted area had a thickness of 200 µm. Mo5Si3 area. Almost all SiO2 is vanished from the Mo5Si3, though the subjacent MoSi2 show no indications of Si depletion. Black contrast in the substrate close to the surface indicates voids from silica depletion.
20
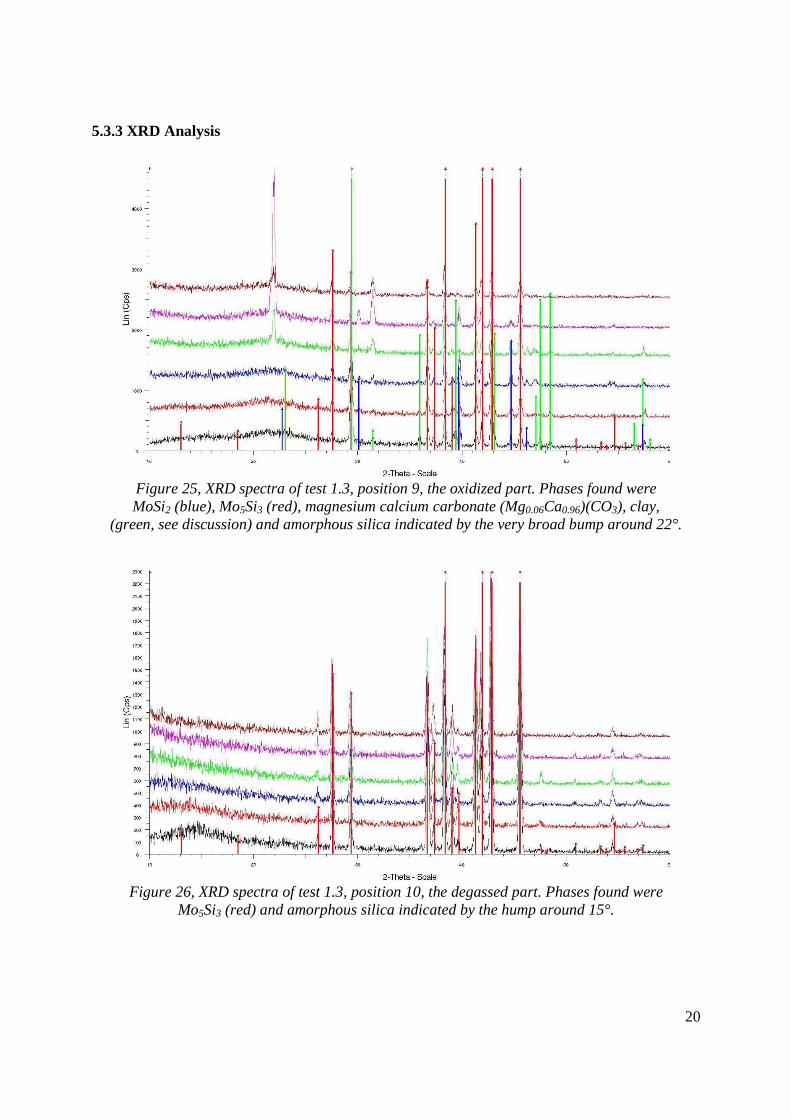
5.3.3 XRD Analysis
Figure 25, XRD spectra of test 1.3, position 9, the oxidized part. Phases found were MoSi2 (blue), Mo5Si3 (red), magnesium calcium carbonate (Mg0.06Ca0.96)(CO3), clay,
(green, see discussion) and amorphous silica indicated by the very broad bump around 22°.
Figure 26, XRD spectra of test 1.3, position 10, the degassed part. Phases found were
Mo5Si3 (red) and amorphous silica indicated by the hump around 15°.

21
5.4 Test 2.1
Oxygen content 25 ppm, N2 balance. Element temperature (Te) 1486°C Duration 100 hours Flow rate 4 liter per minute Average change in diameter 3 µm Average silica scale thickness after test 14 µm 5.4.1 Visual inspection
Terminal
No visible defects. Cone
No visible defects. Heating zone
Smooth glossy homogeneous silica, see figure 27.
Figure 27, test 2.1, Heating element 1 to the left and 2 to the right. Homogeneous silica and no visible cone or terminal defects.
22
5.4.2 SEM Analysis
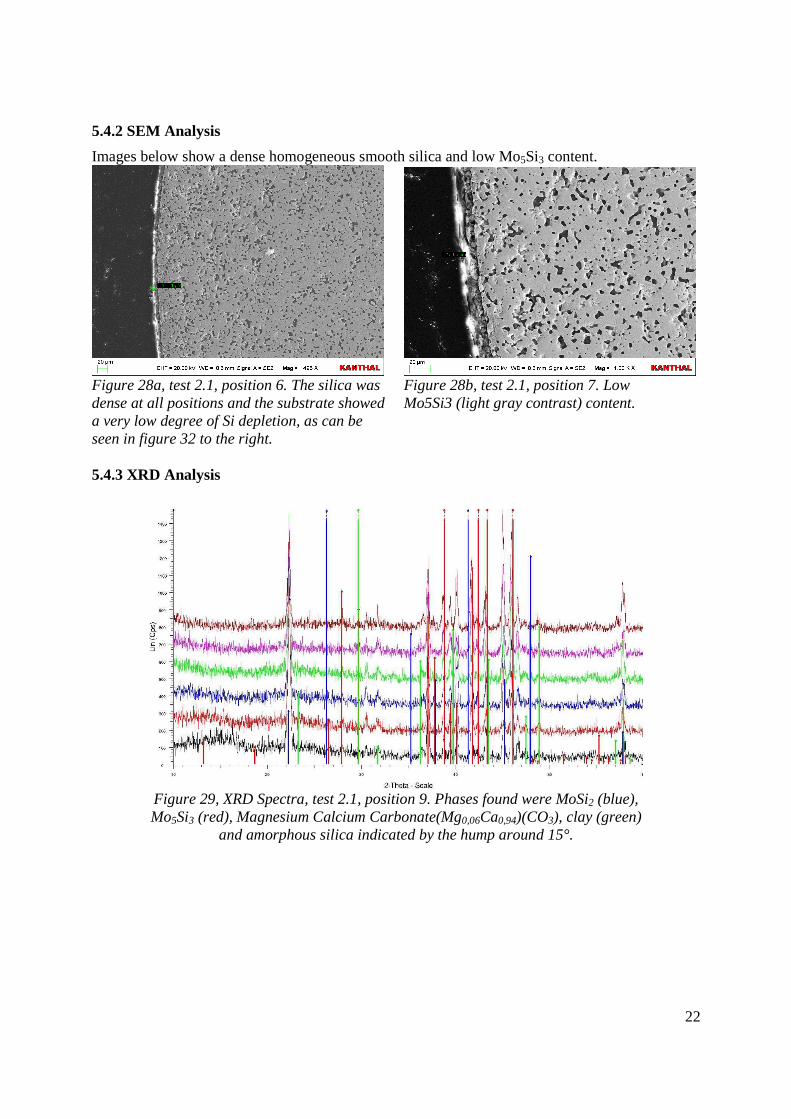
Images below show a dense homogeneous smooth silica and low Mo5Si3 content.
Figure 28a, test 2.1, position 6. The silica was Figure 28b, test 2.1, position 7. Low dense at all positions and the substrate showed Mo5Si3 (light gray contrast) content. a very low degree of Si depletion, as can be seen in figure 32 to the right. 5.4.3 XRD Analysis
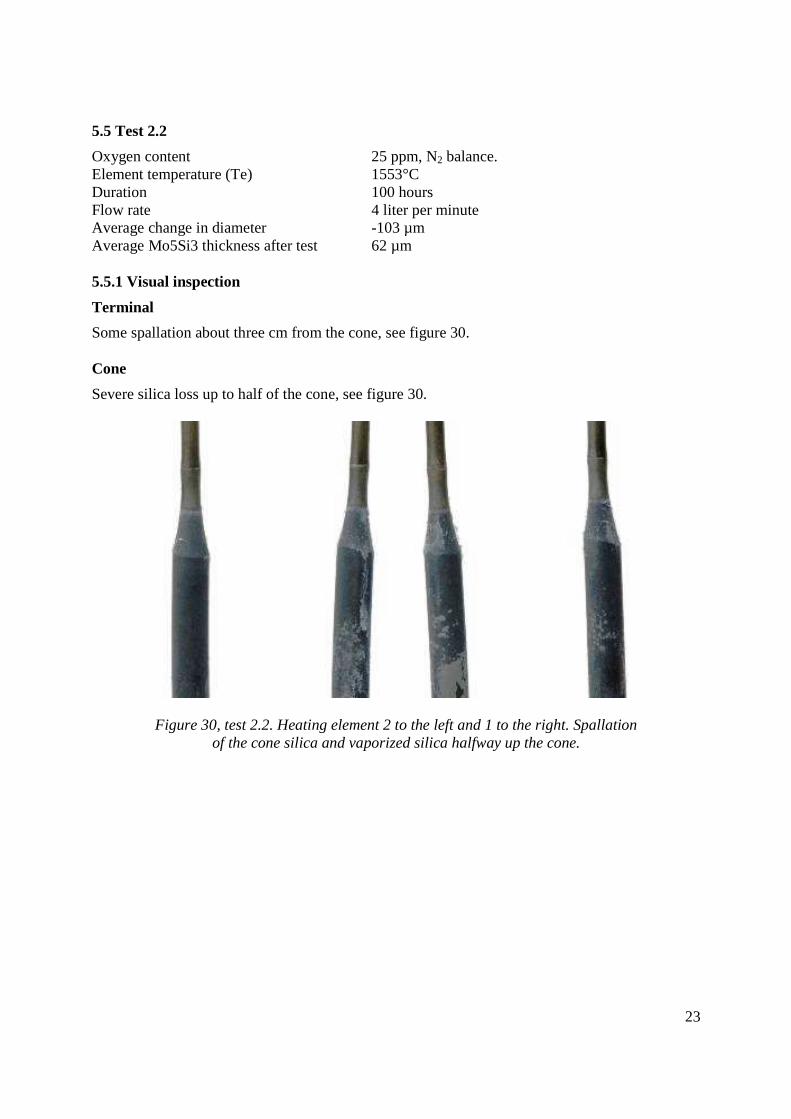
Figure 29, XRD Spectra, test 2.1, position 9. Phases found were MoSi2 (blue), Mo5Si3 (red), Magnesium Calcium Carbonate(Mg0,06Ca0,94)(CO3), clay (green)
and amorphous silica indicated by the hump around 15°.
23
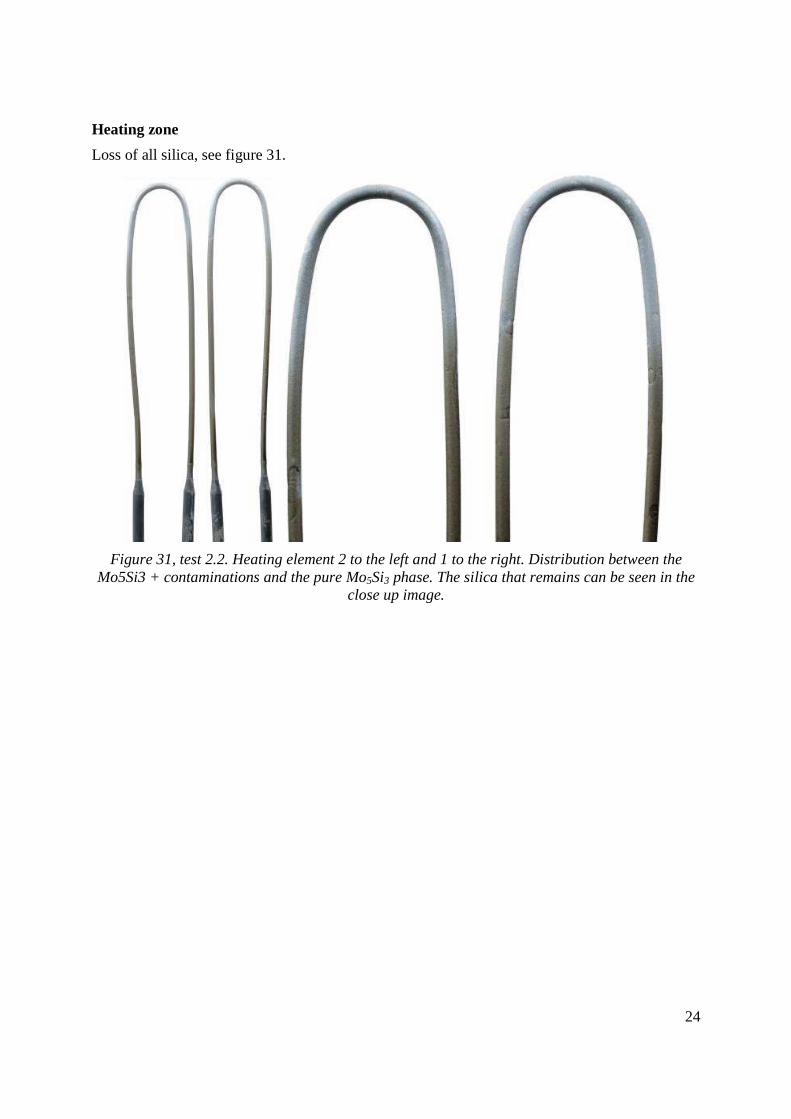
5.5 Test 2.2
Oxygen content 25 ppm, N2 balance. Element temperature (Te) 1553°C Duration 100 hours Flow rate 4 liter per minute Average change in diameter -103 µm Average Mo5Si3 thickness after test 62 µm 5.5.1 Visual inspection
Terminal
Some spallation about three cm from the cone, see figure 30. Cone
Severe silica loss up to half of the cone, see figure 30.
Figure 30, test 2.2. Heating element 2 to the left and 1 to the right. Spallation of the cone silica and vaporized silica halfway up the cone.
24
Heating zone
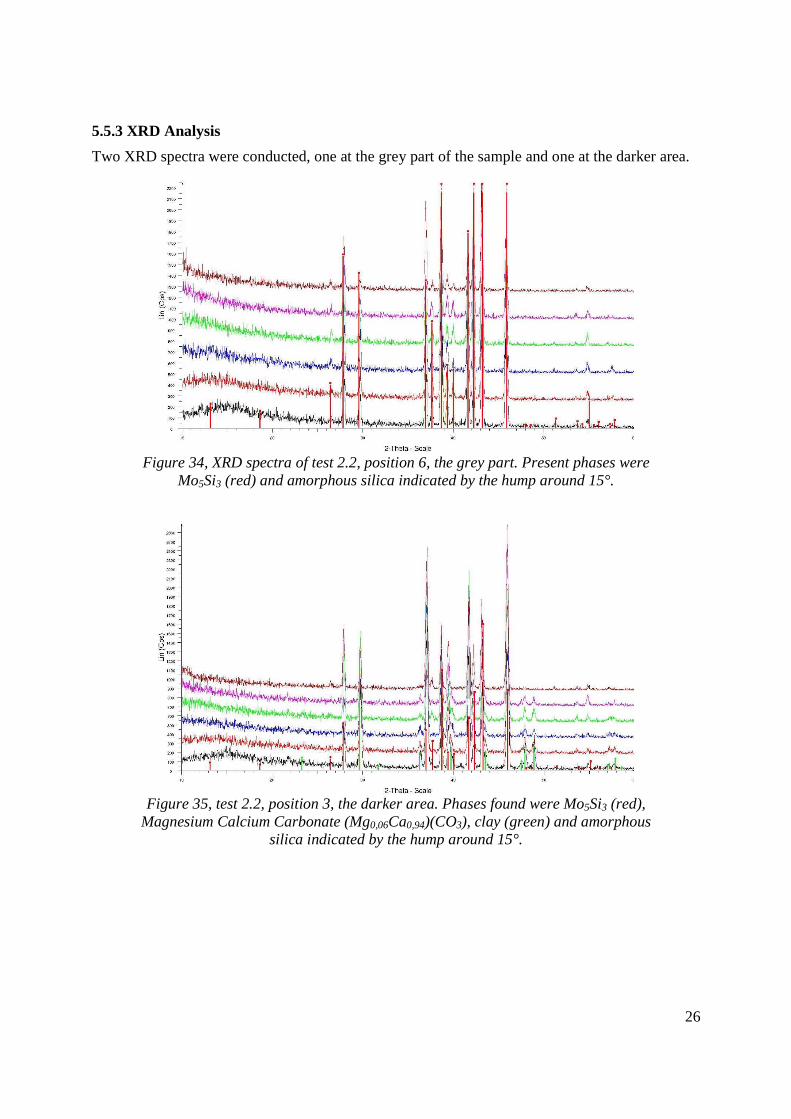
Loss of all silica, see figure 31.
Figure 31, test 2.2. Heating element 2 to the left and 1 to the right. Distribution between the Mo5Si3 + contaminations and the pure Mo5Si3 phase. The silica that remains can be seen in the
close up image.

25
5.5.2 SEM Analysis
Figure 32, test 2.2, position 2. A 45 µm thick Mo5Si3 layer and no silica depletion of the substrate can be seen.
Figure 33, test 2.2, position 5. The Mo5Si3 layer was 95 µm thick and depletion of silica in the MoSi2 phase can be observed.
26
5.5.3 XRD Analysis
Two XRD spectra were conducted, one at the grey part of the sample and one at the darker area.
Figure 34, XRD spectra of test 2.2, position 6, the grey part. Present phases were
Mo5Si3 (red) and amorphous silica indicated by the hump around 15°.
Figure 35, test 2.2, position 3, the darker area. Phases found were Mo5Si3 (red),
Magnesium Calcium Carbonate (Mg0,06Ca0,94)(CO3), clay (green) and amorphous silica indicated by the hump around 15°.

27
5.6 Test 3.1
Oxygen content 100 ppm, N2 balance. Element temperature (Te) 1278°C Duration 100 hours Flow rate 4 liter per minute Average change in diameter -23 µm Average silica scale thickness after test 13 µm 5.6.1 Visual inspection
Terminal
No visible defects. Cone
No visible defects. Heating zone
The oxide scale was homogeneous and glossy but a bit lumpy, see fig. 36.
Figure 36, position 2, show the worst part of the surface.

28
5.6.2 SEM analysis
The thickness varied between 4.4 µm and 24.5µm with an average of 12.1 µm. A SEM image showing an average scale thickness can be seen below in figure 37.
Figure 37, test 3.1, position 3, silica scale thickness of an average part of the sample. 5.6.3 XRD analysis
Phases represented were MoSi2, Mo5Si3 and cristobalite.
Figure 38, XRD spectra of test 3.1, position 9. Phases found were MoSi2 (blue),
Mo5Si3 (red) and cristobalite (green).

29
5.7 Test 3.2
Oxygen content 100 ppm, N2 balance Element temperature (Te) 1409°C Duration 100 hours Flow rate 4 liter per minute Average change in diameter -15 µm Average silica scale thickness after test 9.6 µm 5.7.1 Visual inspection
Terminals
No visible defects though the surface which has been in contact with insulating fibers was a bit rough. Cone
Close to the heating zone, the cone has darkened due to material impurities. Oxide scale is though still glossy and homogeneous. Heating zone
The oxide scale had blister formation on the inside of the heating zone. On the outer side, large discolored dark areas were observed. Spallation during cooling also occurred on the outer side, see fig. 39.
Figure 39, position 4-6 (left) and 5-11 (right), discoloration and spallation of the outer side of the heating element. Blister formation on the inside of the element.

30
5.7.2 SEM analysis
SEM analysis shows that the scale thickness varied a lot but was normally between 5 µm and 15 µm, see figure 40a. The blisters had very poor adhesion and voids between 1 µm and 10 µm in diameter was observed in the very thick oxide, typically 25-50 µm, see figure 40b.
Figure 40a, test 3.2 position 3, average part of Figure 40b, test 3.2 position 9. Blister and the sample. Note the thin white Mo5Si3 layer crack formation of the 41 µm thick silica. between the scale and the grey MoSi2. A 50 µm wide area closest to the scale contains grain size reduced silica. 5.7.3 XRD analysis
Figure 41, test 3.2, position 19. Phases found were MoSi2 (blue), Mo5Si3 (red)
and cristobalite (green).

31
5.8 Test 3.3
Oxygen content 100 ppm, N2 balance Element temperature (Te) 1553°C Duration 100 hours Flow rate 4 liter per minute Average change in diameter, element 1 -206 µm, without the burned part in figure 48 Average change in diameter, element 2 -11 µm Average silica scale thickness after test 36 µm 5.8.1Visual inspection
Terminals
Severe silica degassing of the terminal attached to the burned shank, see figure 42 (top). The other three terminals appeared unaffected. Cone
No visible defects except on the cone at position 7. Heating zone
A five cm long part at one element has clear indications that it has been very hot, see figure 42 (top). At other places on the two samples, the oxide has evaporated and left open wounds see figure 42 (bottom).
Figure 42, position 7-8 (top image), seriously reduced in diameter due to high local temperature.
Position 16 (bottom left) and 6-11 (bottom right), shows that the silica scale does not have the ability to heal after being damaged.
32
5.8.2 SEM analysis
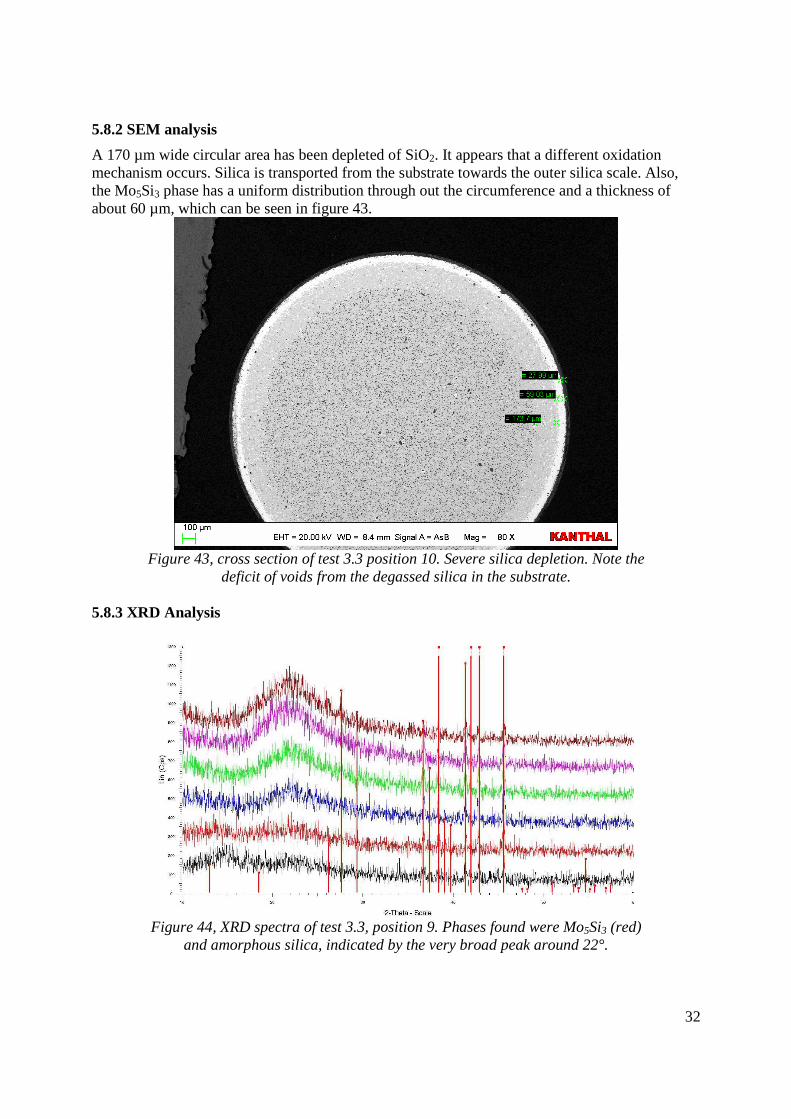
A 170 µm wide circular area has been depleted of SiO2. It appears that a different oxidation mechanism occurs. Silica is transported from the substrate towards the outer silica scale. Also, the Mo5Si3 phase has a uniform distribution through out the circumference and a thickness of about 60 µm, which can be seen in figure 43.
Figure 43, cross section of test 3.3 position 10. Severe silica depletion. Note the
deficit of voids from the degassed silica in the substrate. 5.8.3 XRD Analysis
Figure 44, XRD spectra of test 3.3, position 9. Phases found were Mo5Si3 (red)
and amorphous silica, indicated by the very broad peak around 22°.

33
5.9 Test 3.4
Oxygen content 110 ppm, N2 balance Element temperature (Te) 1662°C Duration 100 hours Flow rate 4 liter per minute Average change in diameter -114 µm Average Mo5Si3 thickness after test 91 µm 5.9.1 Visual inspection
Terminal
Spallation and Mo5Si3 close to the cone, see figure 45. Cone
Severe silica loss and Mo5Si3 formation, see figure 45.
Figure 45, test 3.4. Heating element 1 to the left and 2 to the right. Both the terminal and cone suffered from silica loss and Mo5Si3 formation
Heating zone
All of the protective silica scale had vaporized and of the remaining can be seen in figure 46.
Figure 46, test 3.4, Heating element 1 to the left and 2 to the right.
Some remaining silica can be seen in the close up image.

34
5.9.2 SEM Analysis
The grey part of the heating elements had a thinner Mo5Si3 layer than the darker area, as can be seen in figure 47 and 48.
Figure 47, test 3.4, position 5. A 47 µm thick Mo5Si3 layer. No silica
depletion of the substrate.
Figure 48, test 3.4, position 1. A 110 µm thick Mo5Si3 layer, some void
formation due to silica depletion to the upper left.

35
5.9.3 XRD Analysis
Figure 49, XRD spectra of test 3.4, position 5, the grey part. Phases found were Mo5Si3 (red), magnesium calcium carbonate (Mg0.06Ca0.96)(CO3), clay (green)
and amorphous silica, indicated by the hump around 16°. In this case, the silica is solved in the substrate, which can be seen in figure 47 and 48.
Figure 50, XRD spectra of test 3.4, position 3, the darker part. Phases found were Mo5Si3 (red) and amorphous silica indicated by the hump around 15°. As in the
above spectra, figure 49, the silica is solved in the substrate.

36
5.10 Test 4.1
Oxygen content 900 ppm, N2 balance. Element temperature (Te) 1546°C Duration 100 hours Flow rate 4 liter per minute Average change in diameter 24 µm Average silica scale thickness after test 48 µm 5.8.1 Visual inspection
Terminal
Small blisters, Ø ≈ 1 mm, close to the cone, see figure 57. Cone
No visible defects other than a slight discoloration close to the terminals, see figure 51.
Figure 51, test 4.1, element 1 to the left and element 2
to the right. Blister formation and discoloration. Heating zone
Smooth, homogeneous glossy silica, see figure 52.
Figure 52, test 4.1, element 1 to the left and element 2 to the right, close up to the right. Smooth and glossy silica covers the entire heating zone.

37
5.10.2 SEM Analysis
The thick silica caused flaws in the MoSi2, this can be seen in figure 53a. The silica layer is and the Mo5Si3 layer is thin, see figure 53b.
Figure 53a, test 8, position 3. Crack Figure 53b, SiO2 depletion subjacent the formation, 75 µm deep. homogeneous 48 µm silica scale. The content of Mo5Si3 increases close to the silica but does not form a continuous layer. 5.10.3 XRD Analysis
Figure 54, XRD spectra of test 4.1, position 9. Phases found were magnesium calcium carbonate (Mg0.06Ca0.96)(CO3), clay (green) and amorphous silica,
indicated by the broad hump at low angels.

38
5.11 Test 4.2
Oxygen content 900 ppm, N2 balance. Element temperature (Te) 1662°C Duration 100 hours Flow rate 4 liter per minute Average change in diameter 12 µm Average silica scale thickness after test 54 µm 5.11.1 Visual inspection
Terminal
Spallation close to the cone, see figure 55. Cone
No visible defects see figure 55.
Figure 55, test 4.2, element 2 to the left and element 1
to the right. Spallation of the terminal silica. Heating zone
Smooth, homogeneous and glossy surface, see figure 56.
Figure 56, test 4.2. The only defects appeared at the terminals or the heating zone.
Smooth and glossy silica.
39
5.11.2 SEM Analysis
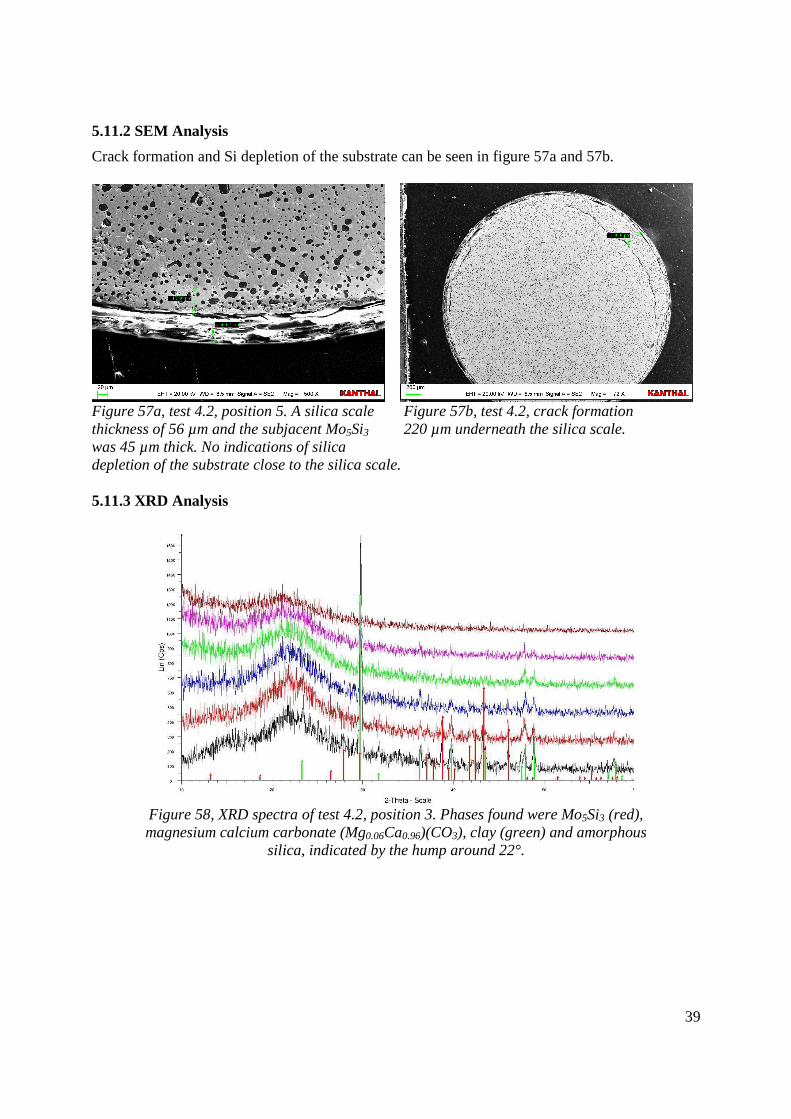
Crack formation and Si depletion of the substrate can be seen in figure 57a and 57b.
Figure 57a, test 4.2, position 5. A silica scale Figure 57b, test 4.2, crack formation thickness of 56 µm and the subjacent Mo5Si3 220 µm underneath the silica scale. was 45 µm thick. No indications of silica depletion of the substrate close to the silica scale. 5.11.3 XRD Analysis
Figure 58, XRD spectra of test 4.2, position 3. Phases found were Mo5Si3 (red), magnesium calcium carbonate (Mg0.06Ca0.96)(CO3), clay (green) and amorphous
silica, indicated by the hump around 22°.
40
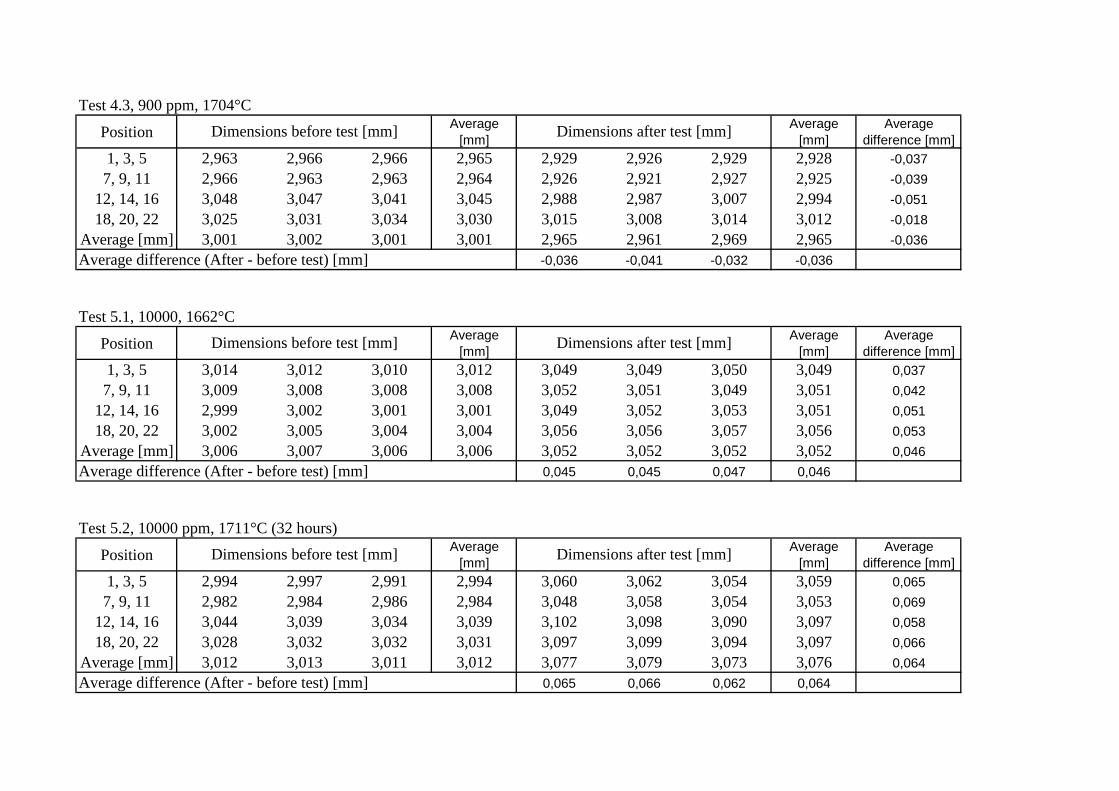
5.12 Test 4.3
Oxygen content 900 ppm, N2 balance. Element temperature (Te) 1704°C Duration 100 hours Flow rate 4 liter per minute Average change in diameter after test -36 µm Average silica scale thickness after test 51 µm 5.12.1 Visual inspection
Terminal
No visible defects. Cone
No visible defects. Heating zone
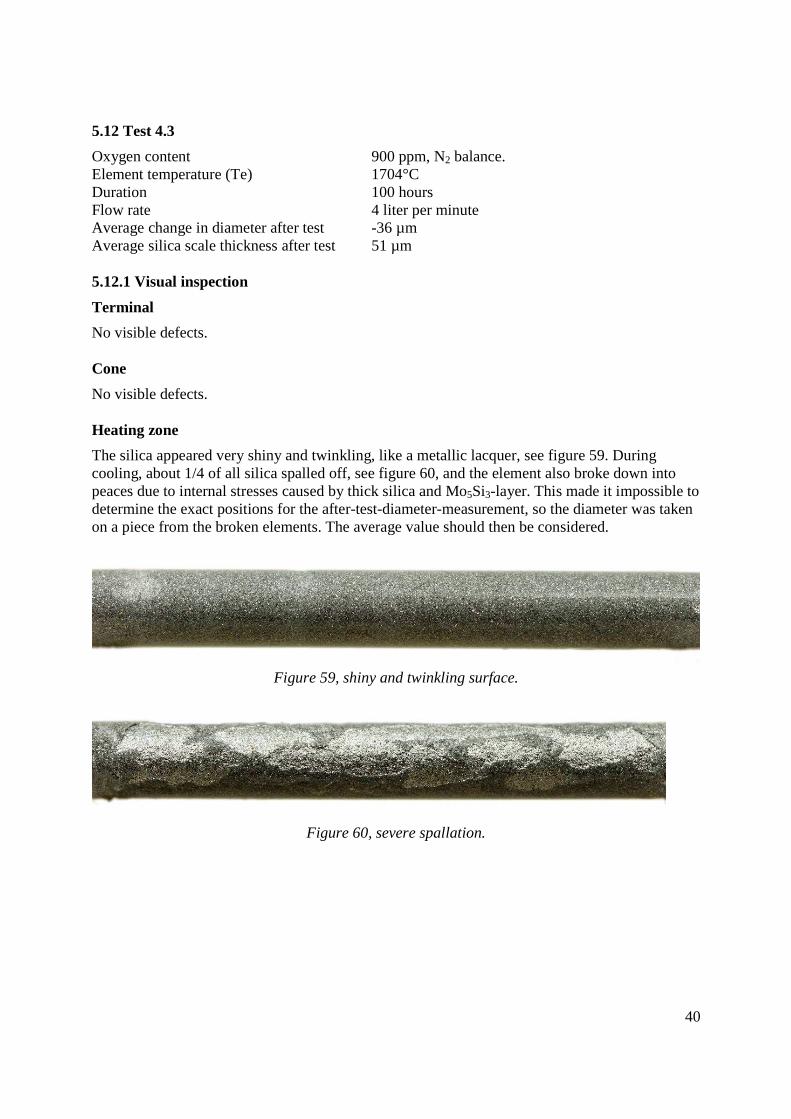
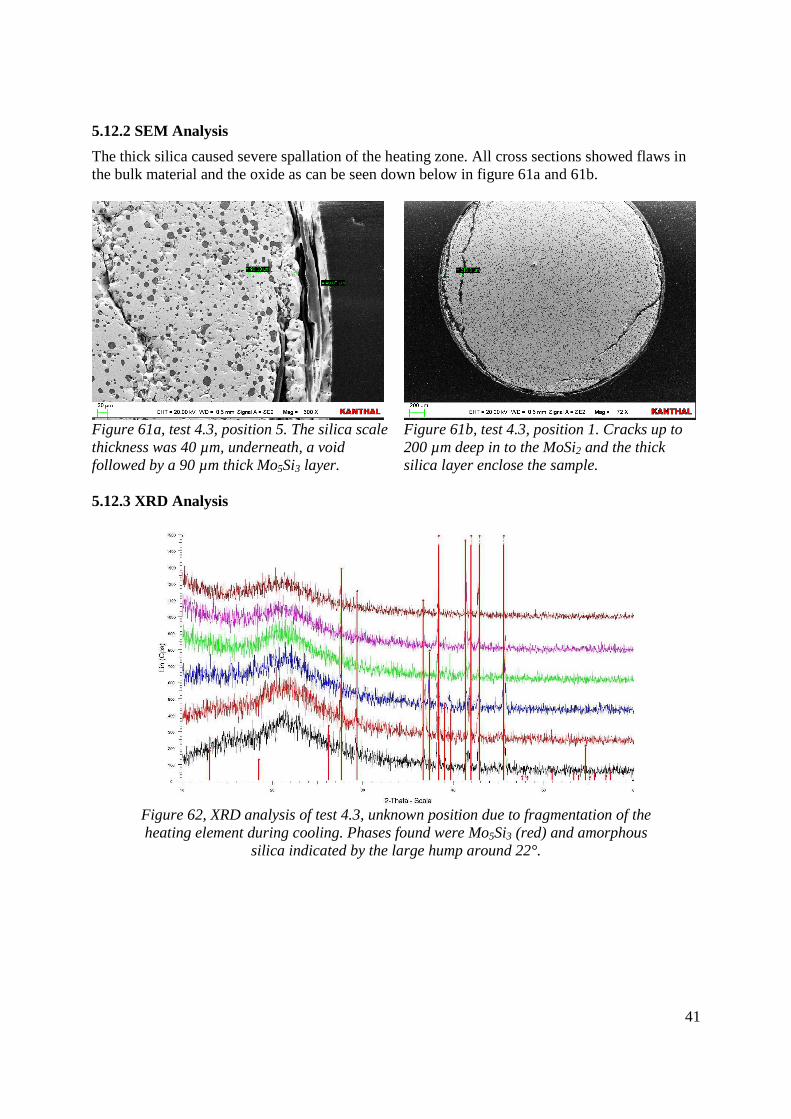
The silica appeared very shiny and twinkling, like a metallic lacquer, see figure 59. During cooling, about 1/4 of all silica spalled off, see figure 60, and the element also broke down into peaces due to internal stresses caused by thick silica and Mo5Si3-layer. This made it impossible to determine the exact positions for the after-test-diameter-measurement, so the diameter was taken on a piece from the broken elements. The average value should then be considered.
Figure 59, shiny and twinkling surface.
Figure 60, severe spallation.
41
5.12.2 SEM Analysis
The thick silica caused severe spallation of the heating zone. All cross sections showed flaws in the bulk material and the oxide as can be seen down below in figure 61a and 61b.
Figure 61a, test 4.3, position 5. The silica scale Figure 61b, test 4.3, position 1. Cracks up to thickness was 40 µm, underneath, a void 200 µm deep in to the MoSi2 and the thick followed by a 90 µm thick Mo5Si3 layer. silica layer enclose the sample. 5.12.3 XRD Analysis
Figure 62, XRD analysis of test 4.3, unknown position due to fragmentation of the heating element during cooling. Phases found were Mo5Si3 (red) and amorphous
silica indicated by the large hump around 22°.

42
5.13 Test 5.1
Oxygen content 10000 ppm, N2 balance. Element temperature (Te) 1662°C Duration 100 hours Flow rate 4 liter per minute Average change in diameter 46 µm Average silica scale thickness after test 68 µm 5.13.1 Visual inspection
Terminal
Spallation close to the cone, see figure 63. Cone
No visible defects, see figure 63.
Figure 63, test 5.1, element 2 to the left and element 1
to the right. Spallation of the terminal silica. Heating zone
Smooth, homogeneous glossy silica, see figure 64.
Figure 64, test 5.1, element 2 to the left and element 1 to the right.
Smooth homogeneous silica.

43
5.13.2 SEM Analysis
The high temperature and high oxygen content has depleted the MoSi2 of Si and created an intermediate Mo5Si3 layer in between the thick silica scale and the subjacent MoSi2, see figure 65a. The thick silica scale also caused the substrate to crack, see figure 65b.
Figure 65a, test 5.1, 77 µm thick silica adjacent Figure 65b, test 5.1, severe crack formation a 40 µm thick Mo5Si3 layer. 330 µm underneath the 65 µm thick silica scale. 5.13.3 XRD Analysis
Figure 66, XRD spectra of test 5.1, position 3. Phases found were magnesium
calcium carbonate (Mg0.06Ca0.96)(CO3), clay (green) and amorphous silica, indicated by the hump around 15° (black curve) and at lower angels for the above curves.

44
5.14 Test 5.2
Oxygen content 10000 ppm, N2 balance. Element temperature (Te) 1711°C Duration 32 hours due to element failure Flow rate 4 liter per minute Average change in diameter 64 µm Average silica scale thickness after test 32 µm 5.14.1 Visual inspection
Terminal
No visible defects. Cone
Loss of silica spot wise around the cone at its narrowest part, see figure 67.
Figure 67, test 5.2, loss of silica from the cone. The phenomenon was repeated at all four cones.
Heating zone
Smooth glossy homogeneous twinkling silica, see figure 68 that also shows break point.
Figure 68, test 5.2, element failure due to elevated local temperature, caused by material defects.

45
5.14.2 SEM Analysis
Element failure after 32 hours caused the relatively thin oxide. The spherodized silica, which can be seen in figure 69a and 69b, indicates high element temperature.
Figure 69a, test 5.2, position 3. Spherodized Figure 69b, test 5.2, position 5. A 50µm thick silica due to high temperature and 33 µm thick piece from the substrate has come of due to silica scale. high internal stresses formed by the 37µm thick oxide and the substrate. 5.14.3 XRD Analysis
Figure 70, XRD spectra of test 5.2, position 5. Phases found were MoSi2 and
amorphous silica indicated by the massive hump around 22°.

46
6 Result summary A summary of the results can be found below in table 3.
Table 3, summary of the diameter and scale thickness results. For test 3.3, an average change in diameter of the two elements was taken. Detailed data for each test can be found in appendix 4
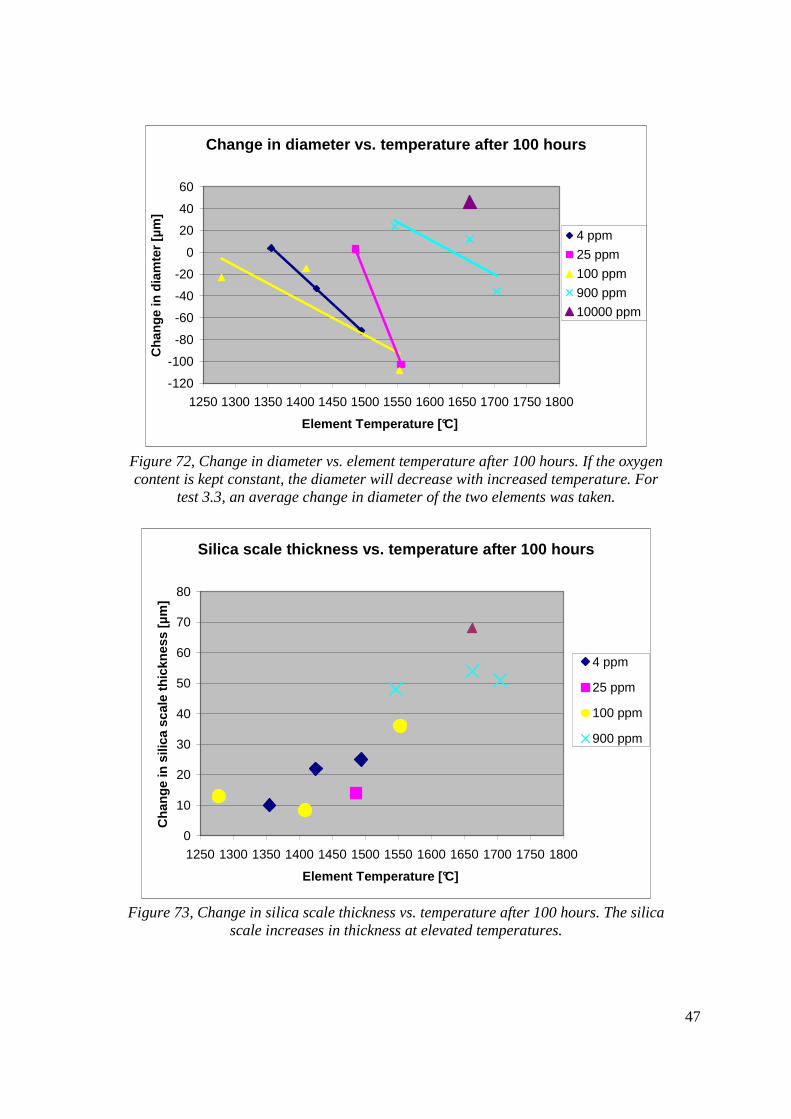
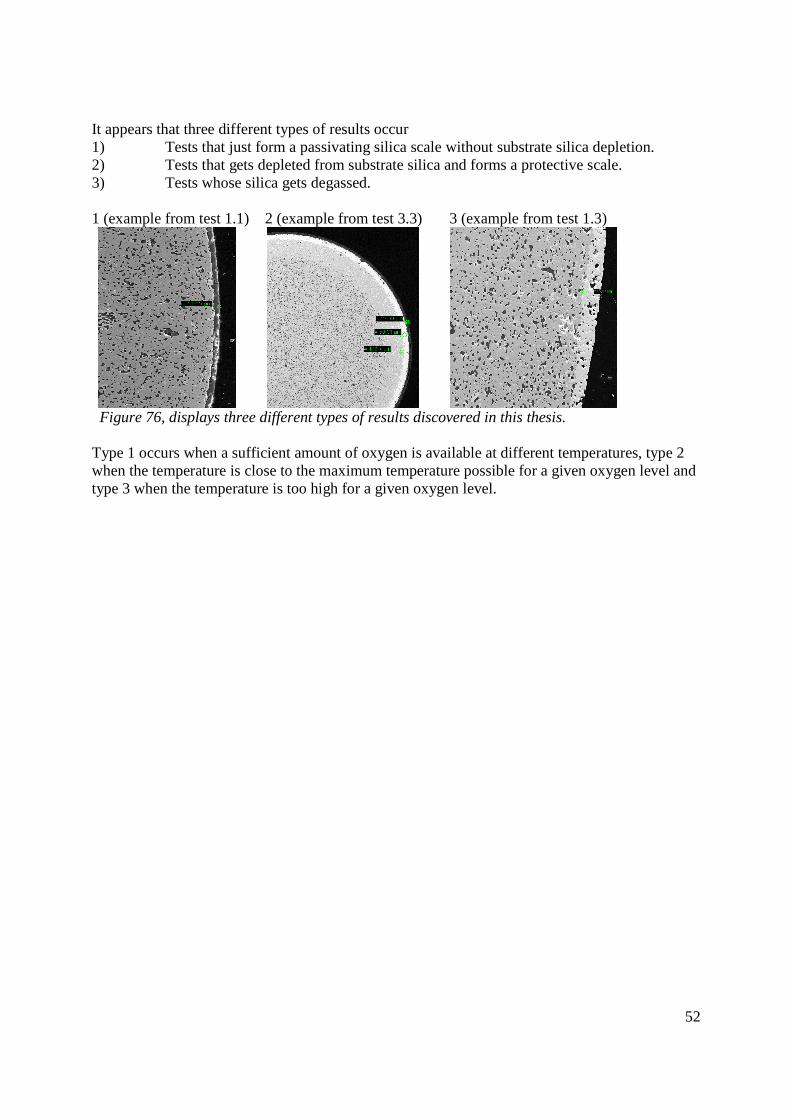
(Change in diameter) and appendix 5 (Silica scale/Mo5Si3 thickness) In general, as temperature increases the diameter reduces and the silica scale thickness increases. These results are also presented in figure 71, 72 and figure 73.
Silica scale and Mo5Si3 thickness [µm] vs. change i n diameter [µm]
0
10
20
30
40
50
60
70
80
90
100
-120 -100 -80 -60 -40 -20 0 20 40
Change in diameter [µm]
Sili
ca s
cale
and
Mo5
Si3
thic
knes
s [µ
m]
Mo5Si3 thickness [µm]
Silica scale thickness [µm], 4 ppm O2
Silica scale thickness [µm], 100 ppm O2
Silica scale thickness [µm], 900 ppm O2
Figure 71, A greater reduction in diameter gives a thicker Mo5Si3 layer. Data collected from
heating elements whose silica scale had degassed. There is a minor connection between change in diameter and the silica scale thickness, as the change in diameter decreases, the silica scale thickness increases. For test 3.3, an average change in diameter of the two elements was taken.
47
Change in diameter vs. temperature after 100 hours
-120
-100
-80
-60
-40
-20
0
20
40
60
1250 1300 1350 1400 1450 1500 1550 1600 1650 1700 1750 1800
Element Temperature [°C]
Cha
nge
in d
iam
ter
[µm
]
4 ppm
25 ppm
100 ppm
900 ppm
10000 ppm
Figure 72, Change in diameter vs. element temperature after 100 hours. If the oxygen content is kept constant, the diameter will decrease with increased temperature. For
test 3.3, an average change in diameter of the two elements was taken.
Silica scale thickness vs. temperature after 100 ho urs
0
10
20
30
40
50
60
70
80
1250 1300 1350 1400 1450 1500 1550 1600 1650 1700 1750 1800
Element Temperature [°C]
Cha
nge
in s
ilica
sca
le th
ickn
ess
[µm
]
4 ppm
25 ppm
100 ppm
900 ppm
Figure 73, Change in silica scale thickness vs. temperature after 100 hours. The silica
scale increases in thickness at elevated temperatures.

48
The aim of this thesis was to investigate the behavior of KS1800S at different temperatures and oxygen contents. This is summarized in figure 74. The gradients of the green and red lines are very similar to the two (black) lines described in figure 3. The criteria to pass is that the element shall have a comprehensive silica layer (test 1.2, 1.3, 2.2 and 3.4 failed) and it shall not spontaneously break down to pieces when cooled down to room temperature (test 4.3 and 5.2 failed)
MoSi2 oxidation behavior in N2 gas with different O2 content
1
10
100
1000
10000
100000
1250 1300 1350 1400 1450 1500 1550 1600 1650 1700 1750 1800
T [°C]
p(O
2) [p
pm]
Fail
Pass
Figure 74, summary of all tests. Green mark represents the tests that passed and red mark the
ones that fails. Equations of the trendlines can be seen below in equation (4) (pass) and (5) (fail). The trendline equation for the tests that passed:
p(O2) =1.267·100.01770·T·log(e)-10 (4)
and failed:
p(O2) = 8.868·100.01398·T·log(e)-9 (5)
The truth lies somewhere between these two lines but a safety factor should be added in any case to protect the elements from unexpected changes in temperature or oxygen content.

49
7 Discussion At elevated temperatures and low oxygen levels the heating elements looses their ability to form the protective silica if injured or contaminated from the environment. It is of high importance that the elements used in these harsh environments are cleaned after installation and preoxidized in air to form silica on the cone and increase thickness of the heating zone silica to extend the life. Test 3.3 is a good example of contamination problem. Test 3.1, 3.2 and 3.3 were not preoxidized. It was after test 3.3 the problem with unoxidized cones was discovered. This could be the reason for the severe damage in test 3.3. Test 3.1-3.3 was the first three tests and all heating elements afterwards were preoxidized. This way of testing was chosen to simulate the reality these heating elements experience in industry. One major weakness in the method is for example lack of statistics, even though two elements were used at the same time, one test was conducted at each temperature and oxygen content. Defects, material inhomogeneities and bad welding may cause local temperature deviations. This is what may have caused the major failure of test 3.3 close to the cone. Tests 1.2 and 1.3 indicate that the degassing process of the silica starts in the kink, closest to furnace bottom and gas inlet. Tests 1.2 and 1.3 must also have had initiation points close to the cones due to the remaining silica at the center of the heating elements. Since hot air rises, it would be intuitive to believe that the heating elements would suffer worst at the upper part of the furnace. This behavior of test 1.2 indicates inhomogeneous temperature and/or oxygen content distribution in the furnace. The temperature was measured 65 mm (position 10 and 15) up from the kink, thus 75 mm from the cone, at the two shanks in the middle. The two outer shanks were approximately 10°C cooler. The small possible change in vertical angle for the pyrometer made vertical temperature distribution impossible to measure. The temperature was measured to differ 4°C along a 10 mm vertical axis on the heating element. If this change in temperature is assumed to be linear, the temperature difference is 56°C along the heating zone of the element. The top of the element should then be 30°C warmer than measured and the kink 26°C cooler. This still does not explain why the silica has degassed from the bottom of the furnace. One possible reason could be increased turbulence around the gas inlet. The emissivity factor has been set to 1 at all tests. This because it represents the worst-case scenario, i.e. it is certain that the temperature does not exceed the value displayed by the pyrometer. Previous work done by Anders Magnusson at Kanthal AB shows that the emissivity factor is 0.71±0.2 for the material inquiry up to 1600°C. The temperature was measured with the same pyrometer as in this thesis. A linear regression between measured results and results corrected with the correct emissivity factor leads to Tecorrected = 1.056·Temeasured – 19.4 [°C] where Te is the element temperature, see table 3.

50
Table 4, the difference between measured and corrected temperature.
Figure 74 can now be updated as follows:
MoSi2 oxidation behavior in N2 gas with different O2 content
1
10
100
1000
10000
100000
1250 1300 1350 1400 1450 1500 1550 1600 1650 1700 1750 1800
T [°C]
p(O
2) [p
pm]
Pass
Fail
Pass corrected
Fail corrected
Figure 75, same as figure 74 but with recalculated temperatures based on change in the emissivity factor. The solid trendlines and circles correspond to, as in figure 74, the measured temperatures and the squares and dashed lines correspond to the corrected temperature. The lines that separates passive, active to passive and active oxidation are upper and lower black
curve, as in figure 3.

51
The trend line equations for the corrected temperature are as follows:
Pass corrected
p(O2) = 1.748·100.01677·T·log(e)-10 [6]
and failed corrected
p(O2) = 1.128·100.01326·T·log(e)-8 [7]
The four-digit accuracy is necessary since the equations are exponential. It is better to round the result afterwards the calculation than before. The electronics in the pyrometer it self is known to has a maximum of 3 % margin of error. At 1700°C, this corresponds to a fault of 50°C. Although, KS1800S shall have a maximum operating temperature of 1800°C in air, both test 4.3 (1780°C) and test 5.2 (1787°C) (corrected temperatures) failed due to high element temperatures. They are both very close to 1800°C and therefore it is likely that the pyrometer does not display a too high temperature value. In both tests where spallation occurred (test 3.2, 1409°C and 1.1, 1355°C), cristobalite was found in the XRD spectra. The heating zone was also discolored. For the tests that were performed at elevated temperatures, many suffered from terminal spallation. It is known that cristobalite is formed and enhance spallation in the temperature range of 1400°C ± 100°C. Impurities as Ca, Mg, Fe among others and contact with the insulating fiber accelerates the cristobalite formation and spallation. In many test, the phase magnesium calcium carbonate (Mg0.06Ca0.96)(CO3), clay, was found. This is because the XRD rotates the sample holder before measurement and some times the sample does not end up in center, causing the X-rays to hit both the sample and the clay that holds the sample. The XRD spectra database is based on powder diffraction and samples in this thesis are solid rods with ~3 mm diameter. This difference in measurement condition makes the peak height indicated by the database differs from the measured value. Test 4.3, 1704°, 900 ppm O2 showed a very brittle behavior and broke into pieces during cooling leaving cracks in the base material as can be seen in figure 59. The thick silica scale causes high internal stresses due to differences in coefficient of linear expansion. This would probably also have happened to test 5.2 if it had lasted the 100 h test period. Thermodynamic calculations show that the primary degassing mechanism is not degassing directly from the surface, as assumed in equation [1]. It would take too long time to degas the silica scale compared to the results in this thesis. Other, unknown oxidation mechanism must then be present. It is possible that material inhomogenates or defects such as particles acts like catalysts for the oxidation process and that the degassing front is then gradually advanced from there. The heating zone may also have been subjected from high forces when bended, introducing micro-cracks and dislocations. This could have made the kink more sensitive to the harsh environment. See test 1.2 and 1.3.
52
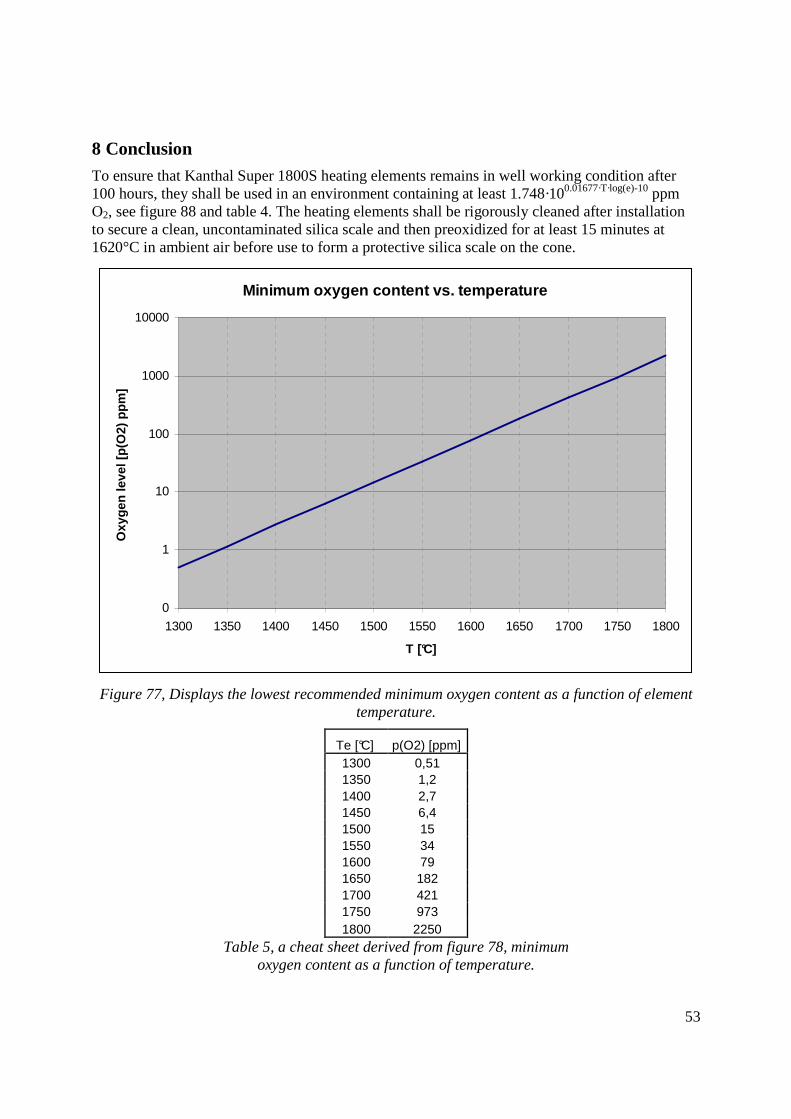
It appears that three different types of results occur 1) Tests that just form a passivating silica scale without substrate silica depletion. 2) Tests that gets depleted from substrate silica and forms a protective scale. 3) Tests whose silica gets degassed. 1 (example from test 1.1) 2 (example from test 3.3) 3 (example from test 1.3)
Figure 76, displays three different types of results discovered in this thesis. Type 1 occurs when a sufficient amount of oxygen is available at different temperatures, type 2 when the temperature is close to the maximum temperature possible for a given oxygen level and type 3 when the temperature is too high for a given oxygen level.
53
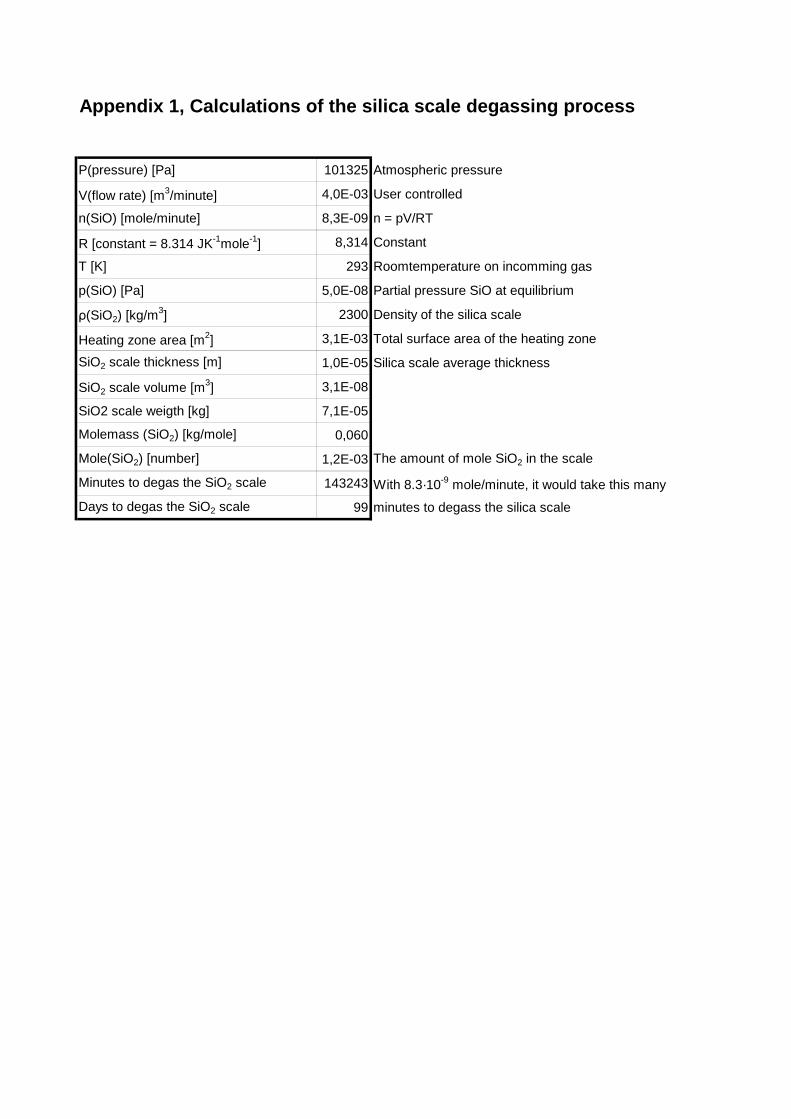
8 Conclusion To ensure that Kanthal Super 1800S heating elements remains in well working condition after 100 hours, they shall be used in an environment containing at least 1.748·100.01677·T·log(e)-10 ppm O2, see figure 88 and table 4. The heating elements shall be rigorously cleaned after installation to secure a clean, uncontaminated silica scale and then preoxidized for at least 15 minutes at 1620°C in ambient air before use to form a protective silica scale on the cone.
Minimum oxygen content vs. temperature
0
1
10
100
1000
10000
1300 1350 1400 1450 1500 1550 1600 1650 1700 1750 1800
T [°C]
Oxy
gen
leve
l [p(
O2)
ppm
]
Figure 77, Displays the lowest recommended minimum oxygen content as a function of element temperature.
Te [°C] p(O2) [ppm] 1300 0,51 1350 1,2 1400 2,7 1450 6,4 1500 15 1550 34 1600 79 1650 182 1700 421 1750 973 1800 2250
Table 5, a cheat sheet derived from figure 78, minimum oxygen content as a function of temperature.

54
9 References
Literature references
[1] C. Wagner; Journal of Applied Physics; 1958, vol 29, no. 9, pp. 1295-97
[2] G.H Meier; Fundamentals of the oxidation of High-Temperature Intermetallics; Department of Material Science and Engineering University of Pittsburgh; 1989, page 4
[3] Kanthal Super Handbook
[4] R.W. Bartlett and P.R Gage; Oxidation of Molybdenum Silicides at High Temperatures and Low Pressures; Published in Transactions of the metallurgical society of aime, p. 968-974 vol. 233, may 1965
[5] J. Ackermann; Kurzanleitung zur Softwareansteuerung des LEO 15xx, 2007
[6] D8 X-ray Diffractometer Users Manual Vol.1; order no. DOC-M88-EXX036 V5-03.2005
[7] IMPAC Infratherm IS10/IGA Data sheet
[8] Tekniskt meddelande U03-04; Emissivitetsmätning Kanthal Super, 2006-11-09
[9] C. Nordling, J. Österman; Physics Handbook; page 347
Internet reference
[10] Pentronic; StoPextra no. 3, 2001; http://www.pentronic.se/Portals/0/PDF/Sv/StoPextra/SE-2001/SE2001-3.pdf, 2010-01-22
Figure references
Figure 2 Kanthal Super Handbook
Figure 7,8,9 J. Ackermann; Kurzanleitung zur Softwareansteuerung des LEO 15xx, 2007
Figure 10 D8 X-ray Diffractometer Users Manual Vol.1; order no. DOC-M88-EXX036 V5-03.2005
Figure 11,13 Pentronic; StoPextra no. 3, 2001; http://www.pentronic.se/Portals/0/PDF/Sv/StoPextra/SE-2001/SE2001-3.pdf, 2010-01-22
Appendix 1, Calculations of the silica scale degassing process
P(pressure) [Pa] 101325 Atmospheric pressure
V(flow rate) [m3/minute] 4,0E-03 User controlled
n(SiO) [mole/minute] 8,3E-09 n = pV/RT
R [constant = 8.314 JK-1mole-1] 8,314 Constant
T [K] 293 Roomtemperature on incomming gas
p(SiO) [Pa] 5,0E-08 Partial pressure SiO at equilibrium
ρ(SiO2) [kg/m3] 2300 Density of the silica scale
Heating zone area [m2] 3,1E-03 Total surface area of the heating zone
SiO2 scale thickness [m] 1,0E-05 Silica scale average thickness
SiO2 scale volume [m3] 3,1E-08
SiO2 scale weigth [kg] 7,1E-05
Molemass (SiO2) [kg/mole] 0,060
Mole(SiO2) [number] 1,2E-03 The amount of mole SiO2 in the scale
Minutes to degas the SiO2 scale 143243 With 8.3·10-9 mole/minute, it would take this many
Days to degas the SiO2 scale 99 minutes to degass the silica scale

Appendix 2, Atmospheric furnace [mm]

Appendix 3, Heating element [mm]

Appendix 4, Change in diameter after 100 hours.
Test 1.1, 4 ppm, 1355°C
PositionAverage
[mm]Average
[mm]Average
difference [mm]1, 3, 5 2,977 2,971 2,975 2,974 2,976 2,976 2,977 2,976 0,002
7, 9, 11 2,973 2,974 2,977 2,975 2,973 2,973 2,973 2,973 -0,002
12, 14, 16 2,994 2,995 3,003 2,997 3,003 3,013 2,999 3,005 0,008
18, 20, 22 2,997 2,997 2,996 2,997 3,012 3,004 2,994 3,003 0,007
Average [mm] 2,985 2,984 2,988 2,986 2,991 2,992 2,986 2,989 0,004
Average difference (After - before test) [mm] 0,006 0,007 -0,002 0,004
Test 1.2, 4 ppm, 1425°C
PositionAverage
[mm]Average
[mm]Average
difference [mm]1, 3, 5 2,996 2,992 2,985 2,991 2,918 2,995 2,882 2,932 -0,059
7, 9, 11 2,978 2,979 2,986 2,981 2,978 2,923 2,875 2,925 -0,056
12, 14, 16 2,977 2,971 2,974 2,974 2,985 2,987 2,975 2,982 0,008
18, 20, 22 2,969 2,972 2,973 2,971 2,965 2,976 2,892 2,944 -0,027
Average [mm] 2,980 2,979 2,980 2,979 2,962 2,970 2,906 2,946 -0,033
Average difference (After - before test) [mm] -0,019 -0,008 -0,074 -0,033
Dimensions before test [mm] Dimensions after test [mm]
Dimensions before test [mm] Dimensions after test [mm]

Test 1.3, 4 ppm, 1494°C
PositionAverage
[mm]Average
[mm]Average
difference [mm]1, 3, 5 3,004 3,007 3,010 3,007 2,962 2,962 2,958 2,961 -0,046
7, 9, 11 3,014 3,009 3,017 3,013 2,971 2,951 2,947 2,956 -0,057
12, 14, 16 2,989 2,989 2,991 2,990 2,904 2,918 2,882 2,901 -0,088
18, 20, 22 2,995 2,994 2,992 2,994 2,912 2,924 2,859 2,898 -0,095
Average [mm] 3,001 3,000 3,003 3,001 2,937 2,939 2,912 2,929 -0,072
Average difference (After - before test) [mm] -0,063 -0,061 -0,091 -0,072
Test 2.1, 25 ppm, 1486°C
PositionAverage
[mm]Average
[mm]Average
difference [mm]1, 3, 5 3,014 3,012 3,011 3,012 3,018 3,014 3,012 3,015 0,002
7, 9, 11 3,004 3,009 3,009 3,007 3,006 3,011 3,012 3,010 0,002
12, 14, 16 3,004 3,004 3,001 3,003 3,008 3,006 3,004 3,006 0,003
18, 20, 22 3,005 3,005 3,005 3,005 3,012 3,008 3,013 3,011 0,006
Average [mm] 3,007 3,008 3,007 3,007 3,011 3,010 3,010 3,010 0,003
Average difference (After - before test) [mm] 0,004 0,002 0,004 0,003
Test 2.2, 25 ppm, 1556°C
PositionAverage
[mm]Average
[mm]Average
difference [mm]1, 3, 5 2,996 2,996 2,998 2,997 2,931 2,908 2,861 2,900 -0,097
7, 9, 11 3,005 3,001 2,997 3,001 2,944 2,925 2,904 2,924 -0,077
12, 14, 16 2,996 2,993 2,995 2,995 2,896 2,889 2,815 2,867 -0,128
18, 20, 22 2,996 3,002 2,996 2,998 2,892 2,888 2,879 2,886 -0,112
Average [mm] 2,998 2,998 2,997 2,998 2,916 2,903 2,865 2,894 -0,103
Average difference (After - before test) [mm] -0,083 -0,096 -0,132 -0,103
Dimensions before test [mm] Dimensions after test [mm]
Dimensions before test [mm] Dimensions after test [mm]
Dimensions before test [mm] Dimensions after test [mm]

Test 3.1, 100 ppm, 1278C
PositionAverage
[mm]Average
[mm]Average
difference [mm]1, 3, 5 3,020 3,018 3,024 3,021 3,001 3,000 3,003 3,001 -0,019
7, 9, 11 3,016 3,018 3,012 3,015 2,995 2,990 2,992 2,992 -0,023
12, 14, 16 2,999 3,003 3,005 3,002 2,978 2,988 2,980 2,982 -0,020
18, 20, 22 3,014 3,015 3,016 3,015 2,982 2,980 2,990 2,984 -0,031
Average [mm] 3,012 3,014 3,014 3,013 2,989 2,990 2,991 2,990 -0,023
Average difference (After - before test) [mm] -0,023 -0,024 -0,023 -0,023
Test 3.2, 100 ppm, 1409°C
PositionAverage
[mm]Average
[mm]Average
difference [mm]1, 3, 5 3,003 2,995 3,000 2,999 2,974 2,965 2,971 2,970 -0,029
7, 9, 11 2,986 2,999 2,995 2,993 2,983 2,985 2,991 2,986 -0,007
12, 14, 16 3,009 3,004 2,998 3,004 2,997 2,991 3,000 2,996 -0,008
18, 20, 22 3,004 3,015 3,014 3,011 3,013 2,983 2,994 2,997 -0,014
Average [mm] 3,001 3,003 3,002 3,002 2,992 2,981 2,989 2,987 -0,015
Average difference (After - before test) [mm] -0,009 -0,022 -0,013 -0,015
Test 3.3, 100 ppm, 1553°C
PositionAverage
[mm]Average
[mm]Average
difference [mm]1, 3, 5 3,001 3,005 3,004 3,003 Burned 2,789 2,819 2,804 -0,199
7, 9, 11 2,998 2,997 3,001 2,999 2,766 2,791 2,804 2,787 -0,212
12, 14, 16 3,012 3,012 3,013 3,012 2,919 3,055 3,040 3,005 -0,008
18, 20, 22 3,012 3,011 3,012 3,012 2,863 3,101 3,030 2,998 -0,014
Average [mm] 3,006 3,006 3,008 3,007 2,849 2,934 2,923 2,898 -0,108
Average difference (After - before test) [mm] -0,156 -0,072 -0,084 -0,108
Dimensions before test [mm] Dimensions after test [mm]
Dimensions before test [mm] Dimensions after test [mm]
Dimensions before test [mm] Dimensions after test [mm]

Test 3.4, 110 ppm, 1662°C
PositionAverage
[mm]Average
[mm]Average
difference [mm]1, 3, 5 2,991 2,992 2,993 2,992 2,867 2,855 2,891 2,871 -0,121
7, 9, 11 2,988 2,987 2,994 2,990 2,854 2,866 2,873 2,864 -0,125
12, 14, 16 2,982 2,981 2,989 2,984 2,883 2,872 2,887 2,881 -0,103
18, 20, 22 2,988 2,985 2,990 2,988 2,877 2,873 2,896 2,882 -0,106
Average [mm] 2,987 2,986 2,992 2,988 2,870 2,867 2,887 2,875 -0,114
Average difference (After - before test) [mm] -0,117 -0,120 -0,105 -0,114
Test 4.1, 900 ppm, 1546°C
PositionAverage
[mm]Average
[mm]Average
difference [mm]1, 3, 5 3,004 3,002 2,998 3,001 3,027 3,023 3,018 3,023 0,021
7, 9, 11 2,994 2,997 2,997 2,996 3,023 3,020 3,021 3,021 0,025
12, 14, 16 3,006 2,997 2,992 2,998 3,028 3,020 3,014 3,021 0,022
18, 20, 22 2,986 2,990 2,988 2,988 3,008 3,020 3,014 3,014 0,026
Average [mm] 2,998 2,997 2,994 2,996 3,022 3,021 3,017 3,020 0,024
Average difference (After - before test) [mm] 0,024 0,024 0,023 0,024
Test 4.2, 900 ppm, 1662°C
PositionAverage
[mm]Average
[mm]Average
difference [mm]1, 3, 5 3,026 3,023 3,022 3,024 3,038 3,032 3,039 3,036 0,013
7, 9, 11 3,017 3,018 3,018 3,018 3,030 3,027 3,032 3,030 0,012
12, 14, 16 3,030 3,026 3,028 3,028 3,039 3,035 3,038 3,037 0,009
18, 20, 22 3,020 3,017 3,022 3,020 3,029 3,030 3,038 3,032 0,013
Average [mm] 3,023 3,021 3,023 3,022 3,034 3,031 3,037 3,034 0,012
Average difference (After - before test) [mm] 0,011 0,010 0,014 0,012
Dimensions before test [mm] Dimensions after test [mm]
Dimensions before test [mm] Dimensions after test [mm]
Dimensions before test [mm] Dimensions after test [mm]
Test 4.3, 900 ppm, 1704°C
PositionAverage
[mm]Average
[mm]Average
difference [mm]1, 3, 5 2,963 2,966 2,966 2,965 2,929 2,926 2,929 2,928 -0,037
7, 9, 11 2,966 2,963 2,963 2,964 2,926 2,921 2,927 2,925 -0,039
12, 14, 16 3,048 3,047 3,041 3,045 2,988 2,987 3,007 2,994 -0,051
18, 20, 22 3,025 3,031 3,034 3,030 3,015 3,008 3,014 3,012 -0,018
Average [mm] 3,001 3,002 3,001 3,001 2,965 2,961 2,969 2,965 -0,036
Average difference (After - before test) [mm] -0,036 -0,041 -0,032 -0,036
Test 5.1, 10000, 1662°C
PositionAverage
[mm]Average
[mm]Average
difference [mm]1, 3, 5 3,014 3,012 3,010 3,012 3,049 3,049 3,050 3,049 0,037
7, 9, 11 3,009 3,008 3,008 3,008 3,052 3,051 3,049 3,051 0,042
12, 14, 16 2,999 3,002 3,001 3,001 3,049 3,052 3,053 3,051 0,051
18, 20, 22 3,002 3,005 3,004 3,004 3,056 3,056 3,057 3,056 0,053
Average [mm] 3,006 3,007 3,006 3,006 3,052 3,052 3,052 3,052 0,046
Average difference (After - before test) [mm] 0,045 0,045 0,047 0,046
Test 5.2, 10000 ppm, 1711°C (32 hours)
PositionAverage
[mm]Average
[mm]Average
difference [mm]1, 3, 5 2,994 2,997 2,991 2,994 3,060 3,062 3,054 3,059 0,065
7, 9, 11 2,982 2,984 2,986 2,984 3,048 3,058 3,054 3,053 0,069
12, 14, 16 3,044 3,039 3,034 3,039 3,102 3,098 3,090 3,097 0,058
18, 20, 22 3,028 3,032 3,032 3,031 3,097 3,099 3,094 3,097 0,066
Average [mm] 3,012 3,013 3,011 3,012 3,077 3,079 3,073 3,076 0,064
Average difference (After - before test) [mm] 0,065 0,066 0,062 0,064
Dimensions before test [mm] Dimensions after test [mm]
Dimensions before test [mm] Dimensions after test [mm]
Dimensions before test [mm] Dimensions after test [mm]

Appendix 5, Measured silica scale thickness in SEM
Silica scale cross section measurement, positions 1-4 are separated by 90°
Sample PositionPosition 1
[µm]Position 2
[µm]Position 3
[µm]Position 4
[µm]Average /
position [µm]Average / test
[µm]1.1 1 1 10 9 9 14 10,51.1 2 3 12 8 9 11 101.1 3 5 11 9 12 11 10,751.1 4 6 9 7 10 15 10,251.1 5 11 9 10 11 12 10,51.1 6 9 9 12 12 10 10,751.1 7 7 11 9 9 9 9,5 10,31.2 1 3 16 20 22 21 19,75 Oxide1.2 2 5 24 20 18 19 20,25 Mo5Si31.2 3 9 22 20 24 27 23,25 21,5 Oxide1.2 4 11 20 13 22 22 19,25 19,8 Mo5Si31.3 1 3 16 27 31 27 25,25 Oxide1.3 2 5 23 72 17 27 34,75 Mo5Si31.3 3 9 23 30 20 26 24,75 25,0 Oxide1.3 4 11 26 36 17 16 23,75 29,3 Mo5Si32.1 1 1 15,2 15,3 14,2 14,8 14,8752.1 2 3 16,8 16,8 10,8 13,2 14,42.1 3 5 14,8 10 12,9 13,4 12,7752.1 4 6 14,5 14,9 10,2 9,6 12,32.1 5 11 17 11,8 11,1 16,7 14,152.1 6 9 15,8 13,3 14,4 16,5 152.1 7 7 19,6 12,6 14,4 13,8 15,1 14,12.2 1 5 60 72 68 62 65,5 Grey part2.2 2 3 42 41 36 42 40,25 Dark part2.2 3 11 95 83 127 92 99,25 Grey part2.2 4 9 40 42 42 41 41,25 61,6 Dark part

Sample PositionPosition 1
[µm]Position 2
[µm]Position 3
[µm]Position 4
[µm]Average /
position [µm]Average / test
[µm]3.1 1 1 20 8,7 8,3 19 14,03.1 2 3 12 21 13 8,7 13,73.1 3 5 14,8 19,9 10,6 7,3 13,23.1 4 6 9,5 9,2 9,7 12,7 10,33.1 5 11 19,1 8,5 8 14 12,43.1 6 9 17,3 17,8 6,3 10 12,93.1 7 7 10 21 12,5 8,7 13,1 12,83.2 1 1 5 16 12,2 7,2 10,13.2 2 3 9,7 14 6,3 13,3 10,83.2 3 5 7,4 7,7 6,6 7,9 7,43.2 4 6 6 8,1 7,5 7,8 7,43.2 5 11 6,4 6,7 6,4 12,7 8,13.2 6 9 7,9 8 6,8 7,6 40,5 µm blister3.2 7 7 9,7 6,6 6,5 7,6 7,6 8,43.3 1 1 20 23,5 33 25,6 25,53.3 2 3 30,5 30 62 36 39,63.3 3 5 40 32 37 35 36,03.3 4 6 43 33 87 30 48,33.3 5 11 Burned Burned Burned Burned3.3 6 9 35 32 26 28 30,33.3 7 7 26 42 34 43 36,3 36,03.4 1 5 49 82 70 160 90,25 Grey part3.4 2 2 111 86 89 93 94,75 Dark part3.4 3 11 66 67 65 67 66,25 Grey part3.4 4 8 152 110 90 97 112,25 90,9 Dark part4.1 1 1 50 50 49 42 47,754.1 2 3 42 47 49 55 48,254.1 3 5 49 51 43 52 48,754.1 4 6 49 50 32 44 43,754.1 5 11 45 59 42 48 48,54.1 6 9 54 52 42 46 48,54.1 7 7 50 49 54 52 51,25 48,1

Sample PositionPosition 1
[µm]Position 2
[µm]Position 3
[µm]Position 4
[µm]Average /
position [µm]Average / test
[µm]4.2 1 1 61 55 56 65 59,254.2 2 3 62 58 45 41 51,54.2 3 5 47 56 58 51 534.2 4 6 56 51 45 48 504.2 5 11 53 54 46 55 524.2 6 9 53 56 66 54 57,254.2 7 7 59 54 46 52 52,75 53,74.3 1 Unknown 84 42 35 44 51,254.3 2 Unknown 47 48 59 47 50,254.3 3 Unknown 52 52 - - 52 51,25.1 1 1 62 71 75 77 71,255.1 2 3 67 78 66 68 69,755.1 3 5 61 75 65 65 66,55.1 4 6 69 78 62 63 685.1 5 11 65 67 77 60 67,255.1 6 9 55 75 66 76 685.1 7 7 62 65 72 70 67,25 68,35.2 1 1 30,4 28,5 32,1 41,2 33,15.2 2 3 33,3 33,5 28,3 28,4 30,95.2 3 5 33,1 28,3 35,2 22,5 29,85.2 4 6 27,7 30 38,6 30,3 31,75.2 5 11 31 27 31,5 26,1 28,95.2 6 9 34,8 39,5 33,3 37 36,25.2 7 7 41 28,5 28,4 33,8 32,9 31,9