maximizing safety on the (slow) road to … maximizing safety on the (slow) road to autonomous...
TRANSCRIPT
iihs.org
Maximizing Safety on the (Slow) Road to Autonomous Vehicles
Automotive Safety Council Annual MeetingTucson, ArizonaMarch 18, 2016
Adrian LundPresident, IIHS and HLDI

Motor vehicle crash deaths and deaths per billion vehicle miles traveled
1950-2013
30,000
35,000
40,000
45,000
50,000
55,000
60,000
1950 1960 1970 1980 1990 2000 20100
10
20
30
40
50
60
70
80
Motor vehiclecrash deaths
Crash deaths perbillion vehicle miles traveled
201311.0 per billion
32,719 deaths


US motor vehicle crash deaths and unemployment rate1950-2013
0
5
10
15
20
30,000
35,000
40,000
45,000
50,000
55,000
60,000
1950 55 60 65 70 75 80 85 90 95 2000 05 10
Motor vehicle crash deaths
Unemployment rate
7 percent
32,719

Motor vehicle crash deaths per billion vehicle miles traveled and unemployment rate1950-2013
0
10
20
30
40
50
60
70
80
0
5
10
15
20
1950 1960 1970 1980 1990 2000 2010
Unemployment rate
Crash deaths perbillion vehicle miles traveled
11.0 per billion
7 percent

Year-to-year percent changes in US motor vehicle crash deaths per billion vehicle miles traveled and unemployment rate1951-2013
-80
-40
0
40
80
-20
-15
-10
-5
0
5
10
15
20
1950 55 60 65 70 75 80 85 90 95 2000 05 10
Crash deaths perbillion vehicle miles traveled
Unemployment rate

Much of the improved highway safety picture is due to vehicle designs

Vehicle and non-vehicle factors and highway safetyPassenger vehicle driver deaths per million vehicles,
actual vs. expected for 1985 fleet
40
60
80
100
120
140
160
180
1985 1987 1989 1991 1993 1995 1997 1999 2001 2003 2005 2007 2009 2011
calendar year
actual rates
expected rates

What’s next for vehicle safety?
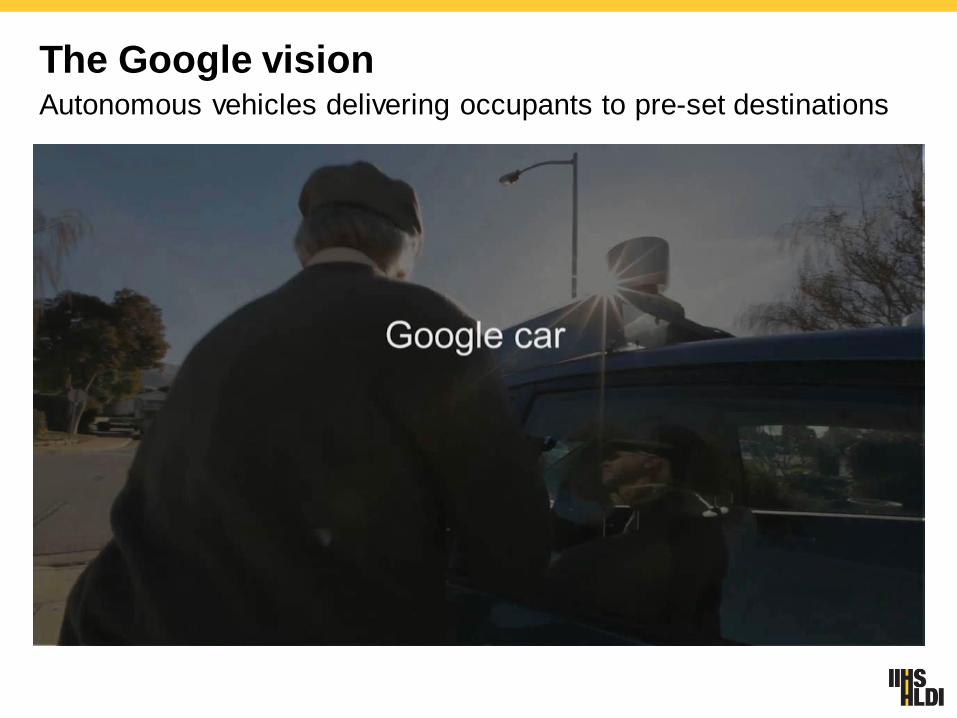
The Google visionAutonomous vehicles delivering occupants to pre-set destinations


14
How fast are autonomous vehicles coming?

Jeremy Carlson – IHS
3.5 million units of “self-driving” vehicles by 2025
– “driverless vehicles appearing but lagging far behind
4.5 million units of “driverless” vehicles by 2030
– Catching up with “self-driving” vehicles
Note: this does not necessarily mean fully autonomous from and
point A to point B
– Rather, these are vehicles that will be able to operate autonomously
under certain conditions
Geographic areas
Roadway types


USA TodayMay 31, 2013

March 11, 2016 NHTSA news release
“U.S. DOT to host public meetings on safe operation of automated
vehicles”
“Operational guidelines” “that clearly outline how we expect
automated vehicles to function – not only safely, but more safely –
on our roads.” Transportation Secretary Anthony Foxx.
Other initiatives reiterated:
– Budget proposal for 10-year, $3.9 billion investment in advancing
autonomous vehicle technology
– Working with states on model policy
– Regulatory effort to accommodate autonomous vehicles
– Determine if new regulatory tools are needed

Volpe review of FMVSS for automated vehiclesMarch 2016
“…there are few barriers...as long as the vehicle does not diverge
from a conventional vehicle design.”
“...alternative cabin layouts, omission of manual controls...would be
constrained....”

Which states regulate testing on public roads?November 2015
KYMD
DE
DC
MA
OR
RI
NJ
NH
ME
PA
WV
NC
SC
GA
FL
OH
MI
INIL
WI
IA
MO
LA
NM
CO
SDID
CA
WA
TN
VT
MS
MT ND
NV
AZ
UT
WY
NE
KS
OK
TX
AR
MN
AL
VA
NY
CT
AKHI
Prohibits local governments from
banning AV use
Silent on testing
Authorizes testing; requirements
are basic or undefined
Various requirements; testing up
to Level 3; prohibits equivalentof Level 4

Which states regulate public operation on public roads?November 2015
KYMD
DE
DC
MA
OR
RI
NJ
NH
ME
PA
WV
NC
SC
GA
FL
OH
MI
INIL
WI
IA
MO
LA
NM
CO
SDID
CA
WA
TN
VT
MS
MT ND
NV
AZ
UT
WY
NE
KS
OK
TX
AR
MN
AL
VA
NY
CT
AKHI
Authorizes operation with basic
requirements; levels unclear
Silent on operation
Public operation up to Level 2
Public operation up to Level 2;
pending for Levels 3 and 4

Crashworthiness ratings
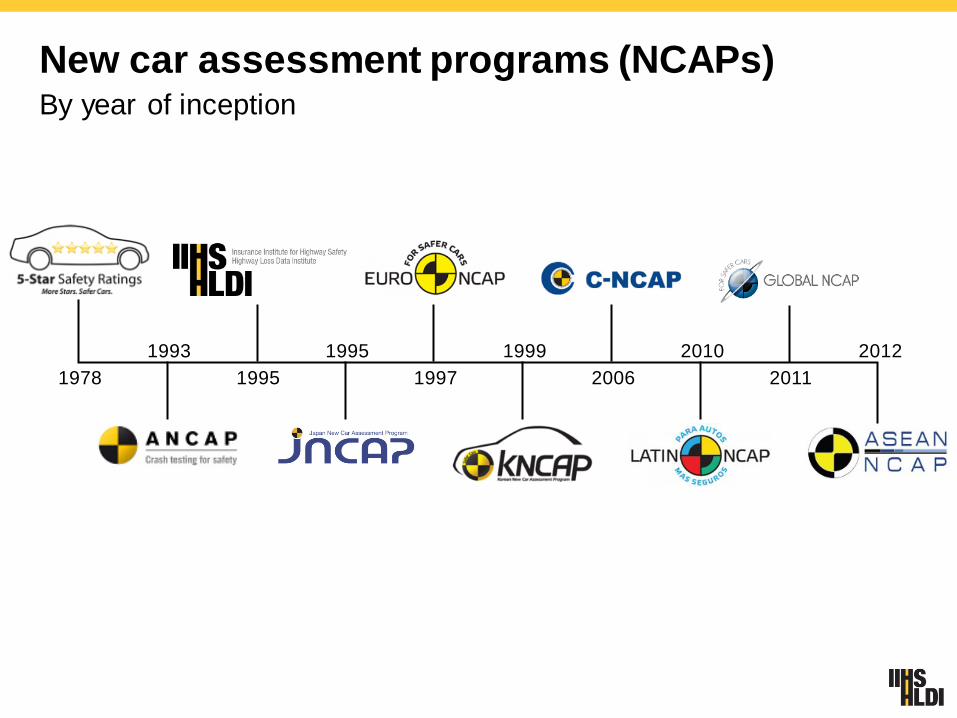
New car assessment programs (NCAPs)By year of inception
1978 1995 1997 2006 2011
1993 1995 1999 2010 2012
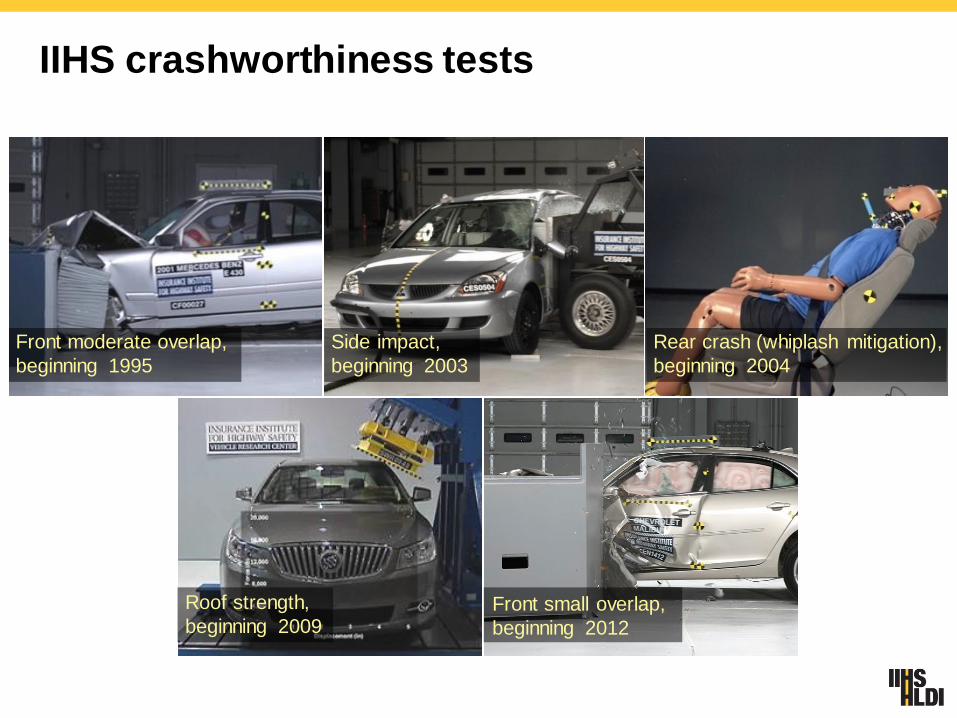
IIHS crashworthiness tests
Front small overlap,
beginning 2012
Front moderate overlap,
beginning 1995
Side impact,
beginning 2003
Rear crash (whiplash mitigation),
beginning 2004
Roof strength,
beginning 2009

Crash protection ratings by model yearImprovements beginning in 1995
0%
20%
40%
60%
80%
100%
1995 1997 1999 2001 2003 2005 2007 2009 2011 2013 2015
0%
20%
40%
60%
80%
100%
1995 1997 1999 2001 2003 2005 2007 2009 2011 2013 2015
0%
20%
40%
60%
80%
100%
1995 1997 1999 2001 2003 2005 2007 2009 2011 2013 2015
0%
20%
40%
60%
80%
100%
1995 1997 1999 2001 2003 2005 2007 2009 2011 2013 2015
0%
20%
40%
60%
80%
100%
1995 1997 1999 2001 2003 2005 2007 2009 2011 2013 2015
moderate overlap front
roof strength small overlap front
side impact head restraints and seats
poor
marginal
acceptable
good

Death and injury reductionsGood versus poor in IIHS tests
Front offset with moderate overlap test
– Fatality risk in head-on crashes is 46 percent lower
Side impact crash test
– Fatality risk in side impact crashes 70 percent lower
– In addition to the benefit of adding side airbag protection for the head
Rear impact test (seat only)
– Neck injury risk in rear crashes is 15 percent lower
– Risk of neck injury requiring 3+ months treatment is 35 percent lower

Registered vehicle moderate overlap frontal offset crash test ratings by calendar yearAll registered vehicles
0%
20%
40%
60%
80%
100%
1995 1997 1999 2001 2003 2005 2007 2009 2011
unrated poor marginal acceptable good

Registered vehicle side impact crash test ratingsby calendar yearAll registered vehicles
0%
20%
40%
60%
80%
100%
2003 2004 2005 2006 2007 2008 2009 2010 2011 2012
unrated poor marginal acceptable good

Crash avoidance technologies

Crashes relevant to 4 crash avoidance systemsFARS and GES, 2004-08
all injury fatal
front crash prevention 1,165,000 66,000 879
lane departure prevention 179,000 37,000 7,529
side view assist 395,000 20,000 393
adaptive headlights 142,000 29,000 2,484
total unique crashes 1,866,000 149,000 10,238

insurance claims
reductions in percent
Collision PDL BIL
front crash prevention
2A 9A 15A
2B 14B 19B
adaptive headlights 1 5 8
lane departure prevention 1C (1)C 3D
side view assist (blind spot) 2 10 16
Insurance claim frequency reduction for 4 crash avoidance technologiesPooled estimates across vehicle models
C = Mercedes & Mazda LDW onlyD = Mercedes only
A = FCW without autobrake
B = FCW with autobrake

Percent of vehicles with lane departure warning or forward collision warning activatedObservations at Honda Dealers - 2015
percent with
FCW on
percent with
LDW on
Accord99
(n = 98)
40
(n = 139)
CR-V100
(n = 6)
33
(n = 6)
Odyssey100
(n = 77)
25
(n = 120)
total99.5
(n = 182)
32
(n = 265)

Effects of systems on rear-end strikesPercent difference in police-reported crash rates
-80%
-60%
-40%
-20%
0%
20%
40%
60%
Honda
Accord
camera(w/LDW)
Honda
Accord
radar(w/LDW+ACC)
Mercedes-
Benz
Volvo warning
only
pooled
Acura Mercedes-
Benz
Subaru
(w/LDW)
Volvo
(w/LDW)
autobrake
pooled
warning onlywarning with
autobrake

Front crash prevention systems are preventing crashes reported to insurersSystems intended to prevent front to rear crashes
10 percent reduction, on average, in property damage liability
claims for vehicles with forward collision warning
14 percent reduction, on average, in PDL claims when FCW
includes emergency autobrake
19 percent reduction in bodily injury claims for vehicles with FCW
and autobrake
If every vehicle had had FCW with autobrake in 2014, we estimate
there would have been more than 700 thousand fewer PDL claims
and more than 200 thousand fewer injury claims.

Front crash prevention ratings2013-16 models (as of March 2016)
134
40
11 10
111
51
28
19
81
56
4034
45
52
38
51
0
20
40
60
80
100
120
140
160
Not qualified/notavailable
Basic Advanced Superior
2013 2014 2015 2016

Twenty automakers have committed to make AEB a standard feature by September 2022Represent > 99 percent of U.S. market

Characteristics of AEB conforming to the commitment for standard fitment Based on U.S. NCAP and IIHS consumer information programs
Forward collision warning systems that meet a subset of NCAP
requirements from warning timing
– Subject encounters a slower moving lead vehicle
– Subject encounters a decelerating lead vehicle
Automated braking that meets IIHS requirements for a rating of
‘advanced’
– Speed reduction of 10 mph in either 12 or 24 mph test with stationary
lead vehicle; or
– Speed reduction of 5 mph in both 12 and 24 mph tests
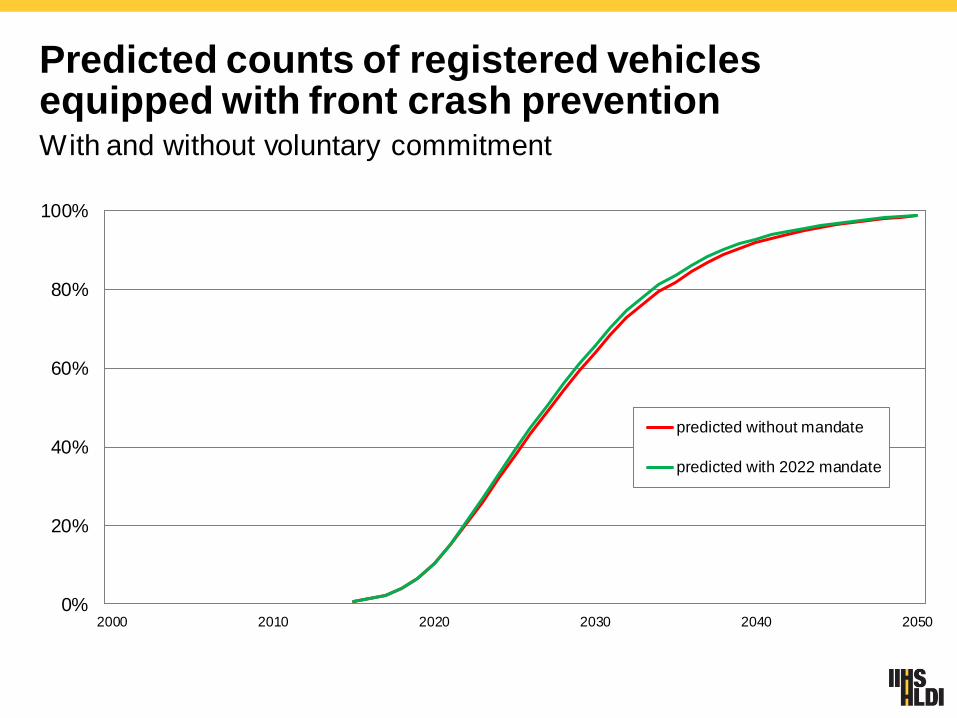
0%
20%
40%
60%
80%
100%
2000 2010 2020 2030 2040 2050
predicted without mandate
predicted with 2022 mandate
Predicted counts of registered vehicles equipped with front crash preventionWith and without voluntary commitment

27 OCTOBER 2016
VIRGINIA, USA
GLOBAL NCAP FLEET SAFETY OPEN DAY

Headlight rating system

Vehicle approaches:
– 500 ft. radius left and right curves at 40 mph
– 800 ft. radius left and right curves at 50 mph
– Straightaway at 40 mph
Record illuminance readings for:
– Visibility – edges of road at 10 in. above ground
– Glare – center of oncoming lane (3 ft. 7 in.)
Dynamic headlight test setup
800 ft. radius
500 ft. radius
straightaway
direction of travel
Light sensorarray

Low beam illumination on straight roadh
alo
gen
ha
loge
n
ha
loge
n
ha
loge
n
ha
loge
n
ha
loge
n
ha
loge
n
LED
HID
ha
loge
n LED
ha
loge
n
ha
loge
n
ha
loge
n
ha
loge
n
ha
loge
n
LED
LED HID
LED
HID
ha
loge
n
HID
HID h
alo
gen
LED
LED
LED
LED
HID
HID
0
100
200
300
400
500
600
2016Nissan
Maxima
2015Cadillac
ATS
2016HondaAccord
2016Subaru
Outback
2015NissanAltima
2016Mazda 6
2016Lincoln
MKZ
2016Mercedes
C300
2015Infiniti
Q50
2016SubaruLegacy
2015Chrysler
200
2016AcuraTLX
2015Chevrolet
Malibu
2016Buick
Verano
2016Ford
Fusion
2016VolvoS60
2016Mercedes
CLA250
5 lu
x di
stan
ce (
ft.)
not curve-adaptive system
curve-adaptive system

Differences in headlight illuminationDeer is 270 feet from front of car; approximate reach of Accord’s 5 lux
Honda Accord Mercedes C300

Translating test results to ratings
Rating based on:
– Straightaway and curve visibility (weighting roughly 60/40)
– Low and high beams (weighting roughly 75/25)
– Acceptable glare
Bonus given for automatic high beams (“high beam assist”)
Results of all tests will be combined into an overall demerit score
with rating boundaries applied
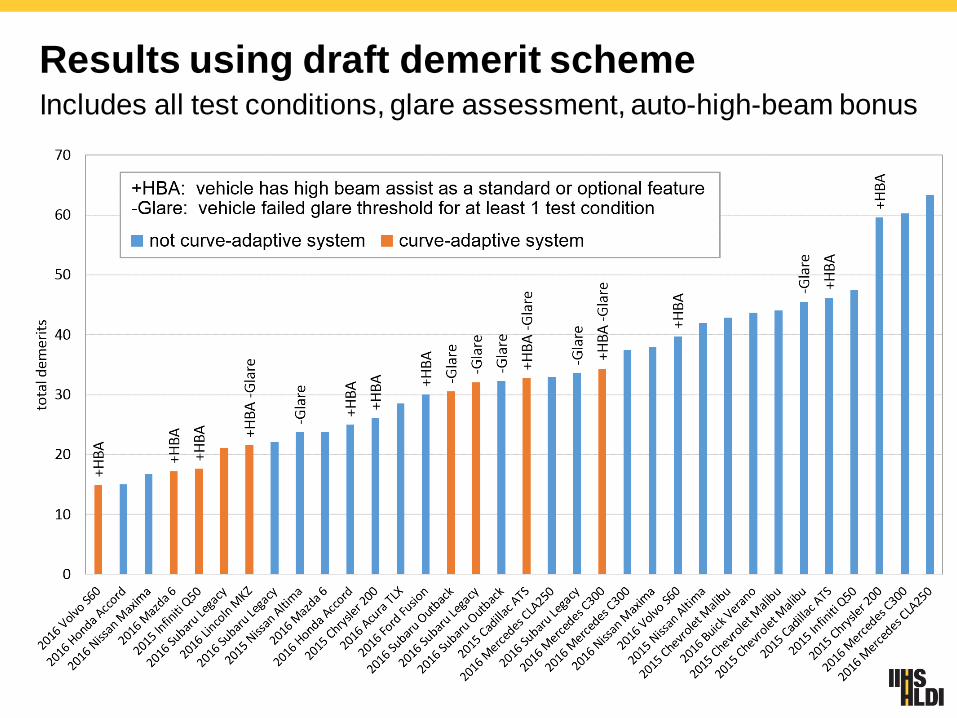
Results using draft demerit schemeIncludes all test conditions, glare assessment, auto-high-beam bonus

TOP SAFETY PICKs

Requirements for 2016 TOP SAFETY PICK awards
Good rating in moderate overlap front, small overlap front,
side, roof strength and head restraint tests
Basic rating for front crash prevention
meet TOP SAFETY PICK criteria
&Advanced or Superior rating for front crash prevention
&

Requirements for 2017TOP SAFETY PICK awardsProposed
Good rating in moderate overlap front, small overlap front,
side, roof strength and head restraint tests
Advanced or Superior rating for front crash prevention
meet TOP SAFETY PICK criteria
&Acceptable rating for front headlamp illumination
&

iihs.org
More information and links to our YouTube channeland Twitter feed at iihs.org