maturation of biomass-to-biofuels conversion … · steven o. peterson, lexidyne llc, west lebanon,...
TRANSCRIPT
Correspondence to: Laura J. Vimmerstedt, National Renewable Energy Laboratory, Strategic Energy Analysis Center,
Golden, CO, USA. E-mail: [email protected]
158Published 2014. This article is a U.S. Government work and is in the public domain in the USA. Biofuels, Bioproducts, Biorefining published by John Wiley & Sons, Ltd on behalf of Society of Chemical Industry.This is an open access article under the terms of the Creative Commons Attribution License, which permits use, distribution and reproduction in any medium, provided the original work is properly cited.
Modeling and Analysis
Maturation of biomass-to-biofuels conversion technology pathways for rapid expansion of biofuels production: a system dynamics perspectiveLaura J. Vimmerstedt, National Renewable Energy Laboratory, Strategic Energy Analysis Center, Golden, CO, USABrian W. Bush, National Renewable Energy Laboratory, Strategic Energy Analysis Center, Golden, CO, USADave D. Hsu, Kilpatrick Townsend & Stockton LLP, Denver, CO, USA Daniel Inman, National Renewable Energy Laboratory, Strategic Energy Analysis Center, Golden, CO, USASteven O. Peterson, Lexidyne LLC, West Lebanon, NH, USA
Received February 3, 2014; revised July 3, 2014; accepted July 4, 2014View online August 12, 2014 at Wiley Online Library (wileyonlinelibrary.com); DOI: 10.1002/bbb.1515; Biofuels, Bioprod. Bioref. 9:158–176 (2015)
Abstract: The Biomass Scenario Model (BSM) is a system-dynamics simulation model intended to explore the potential for rapid expansion of the biofuels industry. The model is not predictive — it uses scenario assumptions based on various types of data to simulate industry development, emphasizing how incen-tives and technological learning-by-doing might accelerate industry growth. The BSM simulates major sectors of the biofuels industry, including feedstock production and logistics, conversion, distribution, and end uses, as well as interactions among sectors. The model represents conversion of biomass to biofuels as a set of technology pathways, each of which has allowable feedstocks, capital and operating costs, allowable products, and other defi ned characteristics. This study and the BSM address bioenergy modeling analytic needs that were identifi ed in recent literature reviews. Simulations indicate that invest-ments are most effective at expanding biofuels production through learning-by-doing when they are coordinated with respect to timing, pathway, and target sector within the biofuels industry. Effectiveness metrics include timing and magnitude of increased production, incentive cost and cost effectiveness, and avoidance of windfall profi ts. Investment costs and optimal investment targets have inherent risks and uncertainties, such as the relative value of investment in more-mature versus less mature pathways. These can be explored through scenarios, but cannot be precisely predicted. Dynamic competition, including competition for cellulosic feedstocks and ethanol market shares, intensifi es during times of rapid growth. Ethanol production increases rapidly, even up to Renewable Fuel Standards-targeted volumes of biofuel, in simulations that allow higher blending proportions of ethanol in gasoline-fueled vehicles. Published 2014. This article is a U.S. Government work and is in the public domain in the USA. Biofuels, Bioproducts and Biorefi ning published by John Wiley & Sons, Ltd on behalf of Society of Chemical Industry.
Keywords: biomass; biofuel; renewable fuels standard; system dynamics; learning; policy
Published 2014. This article is a U.S. Government work and is in the public domain in the USA. Biofuels, Bioproducts, Biorefining published by John Wiley & Sons, Ltd on behalf of Society of Chemical Industry | Biofuels, Bioprod. Bioref. 9:158–176 (2015); DOI: 10.1002/bbb 159
Modeling and Analysis: Maturation of Biomass-to-Biofuels Conversion Technology Pathways LJ Vimmerstedt et al.
3. Dynamics of rapid growth: If the biofuels industry grows rapidly, what barriers and system behaviors might emerge?
Improved answers to these questions could support faster growth in the biofuels industry and increase the eff ectiveness of the federal government’s investment in policies to promote renewable fuels. Th is study uses the Biomass Scenario Model (BSM) to explore these ques-tions and identify key incentives, bottlenecks, and points of leverage that may, given particular scenarios, facilitate industry development.
Recent literature reviews of bioenergy modeling identi-fi ed numerous analytic needs, some of which the BSM addresses. Four of these are summarized here.
1. Some reviews6,7 noted a need to address bioenergy risks and challenges ‒ such as variability in policies, feed-stock supply, and demand or competition for land ‒ in a way that accounts for the multiple complex interactions between bioenergy and other sectors. Th ey suggest that this need can be met by using holistic models, includ-ing system dynamics models, that provide an overall framework for simulating bioenergy supply chain development over time. Th ese include bioenergy end use, distribution, biomass-to-bioenergy conversion, and resource production and transportation, as well as clear and consistent accounting for linkages with other sec-tors. Sharma7 recommended greater use of simulation optimization modeling as a way to address uncertainty through exploration of large numbers of scenarios. Some surveys of the scope of model-based analyses8,9
Introduction
US public policy promotes biofuels to reduce dependence on imported energy and to decrease greenhouse gas (GHG) emissions.1 Th e Energy
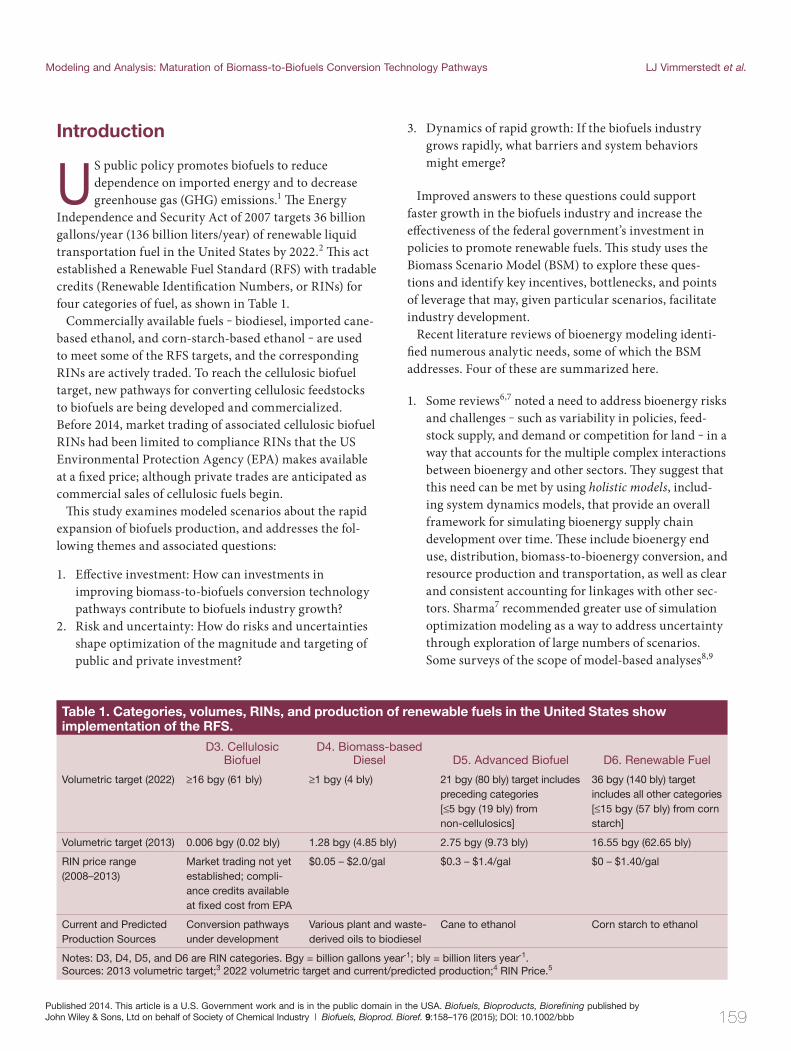
Independence and Security Act of 2007 targets 36 billion gallons/year (136 billion liters/year) of renewable liquid transportation fuel in the United States by 2022.2 Th is act established a Renewable Fuel Standard (RFS) with tradable credits (Renewable Identifi cation Numbers, or RINs) for four categories of fuel, as shown in Table 1.
Commercially available fuels ‒ biodiesel, imported cane-based ethanol, and corn-starch-based ethanol ‒ are used to meet some of the RFS targets, and the corresponding RINs are actively traded. To reach the cellulosic biofuel target, new pathways for converting cellulosic feedstocks to biofuels are being developed and commercialized. Before 2014, market trading of associated cellulosic biofuel RINs had been limited to compliance RINs that the US Environmental Protection Agency (EPA) makes available at a fi xed price; although private trades are anticipated as commercial sales of cellulosic fuels begin.
Th is study examines modeled scenarios about the rapid expansion of biofuels production, and addresses the fol-lowing themes and associated questions:
1. Eff ective investment: How can investments in improving biomass-to-biofuels conversion technology pathways contribute to biofuels industry growth?
2. Risk and uncertainty: How do risks and uncertainties shape optimization of the magnitude and targeting of public and private investment?
Table 1. Categories, volumes, RINs, and production of renewable fuels in the United States show implementation of the RFS.
D3. Cellulosic Biofuel
D4. Biomass-based Diesel D5. Advanced Biofuel D6. Renewable Fuel
Volumetric target (2022) ≥16 bgy (61 bly) ≥1 bgy (4 bly) 21 bgy (80 bly) target includes preceding categories[≤5 bgy (19 bly) from non-cellulosics]
36 bgy (140 bly) target includes all other categories[≤15 bgy (57 bly) from corn starch]
Volumetric target (2013) 0.006 bgy (0.02 bly) 1.28 bgy (4.85 bly) 2.75 bgy (9.73 bly) 16.55 bgy (62.65 bly)
RIN price range(2008–2013)
Market trading not yet established; compli-ance credits available at fi xed cost from EPA
$0.05 – $2.0/gal $0.3 – $1.4/gal $0 – $1.40/gal
Current and Predicted Production Sources
Conversion pathways under development
Various plant and waste-derived oils to biodiesel
Cane to ethanol Corn starch to ethanol
Notes: D3, D4, D5, and D6 are RIN categories. Bgy = billion gallons year-1; bly = billion liters year-1.Sources: 2013 volumetric target;3 2022 volumetric target and current/predicted production;4 RIN Price.5
160Published 2014. This article is a U.S. Government work and is in the public domain in the USA. Biofuels, Bioproducts, Biorefining published by John Wiley & Sons, Ltd on behalf of Society of Chemical Industry | Biofuels, Bioprod. Bioref. 9:158–176 (2015); DOI: 10.1002/bbb
LJ Vimmerstedt et al. Modeling and Analysis: Maturation of Biomass-to-Biofuels Conversion Technology Pathways
literature review identifi ed a need for such models:6,7
holistic models, including models using system dynam-ics, that enable simulation and strategic analysis of the development of a bioenergy supply chain. Th e BSM is a holistic system-dynamics model for biofuels in the United States. In contrast to most of the bioenergy supply chain models reviewed in the literature, which tend to focus on shorter-term operational issues for specifi c processes and places,8 the BSM represents the supply chain from end use to resource and can support longer-term, national analysis that may address strategic issues, such as incentive eff ects. Th is paper serves as one example of such analysis with an emphasis on conversion. Some of the literature on sustain-ability is holistic but less comprehensive of the bioenergy supply chain;9,10,16,17 the BSM accounts for land use by crop in the United States and has a companion global land-use change model18 that complements and poten-tially links to sustainability analysis. High-level system models such as the BSM are designed to estimate pos-sibilities rather than to provide precise quantitative fore-casts;19 thus, the BSM is best suited for (i) analyzing and evaluating alternate policies; (ii) generating scenarios; (iii) identifying high-impact levers and bottlenecks to system evolution; and (iv) seeding focused discussion between policymakers, analysts, and stakeholders.
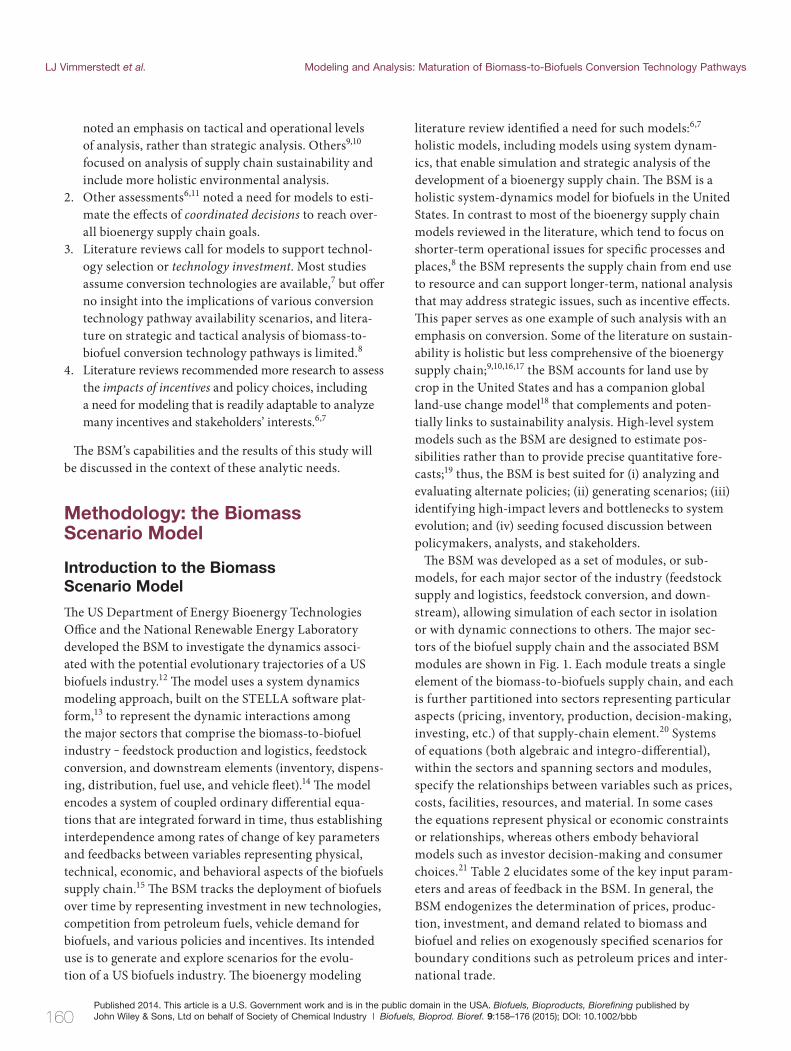
Th e BSM was developed as a set of modules, or sub-models, for each major sector of the industry (feedstock supply and logistics, feedstock conversion, and down-stream), allowing simulation of each sector in isolation or with dynamic connections to others. Th e major sec-tors of the biofuel supply chain and the associated BSM modules are shown in Fig. 1. Each module treats a single element of the biomass-to-biofuels supply chain, and each is further partitioned into sectors representing particular aspects (pricing, inventory, production, decision-making, investing, etc.) of that supply-chain element.20 Systems of equations (both algebraic and integro-diff erential), within the sectors and spanning sectors and modules, specify the relationships between variables such as prices, costs, facilities, resources, and material. In some cases the equations represent physical or economic constraints or relationships, whereas others embody behavioral models such as investor decision-making and consumer choices.21 Table 2 elucidates some of the key input param-eters and areas of feedback in the BSM. In general, the BSM endogenizes the determination of prices, produc-tion, investment, and demand related to biomass and biofuel and relies on exogenously specifi ed scenarios for boundary conditions such as petroleum prices and inter-national trade.
noted an emphasis on tactical and operational levels of analysis, rather than strategic analysis. Others9,10 focused on analysis of supply chain sustainability and include more holistic environmental analysis.
2. Other assessments6,11 noted a need for models to esti-mate the eff ects of coordinated decisions to reach over-all bioenergy supply chain goals.
3. Literature reviews call for models to support technol-ogy selection or technology investment. Most studies assume conversion technologies are available,7 but off er no insight into the implications of various conversion technology pathway availability scenarios, and litera-ture on strategic and tactical analysis of biomass-to-biofuel conversion technology pathways is limited.8
4. Literature reviews recommended more research to assess the impacts of incentives and policy choices, including a need for modeling that is readily adaptable to analyze many incentives and stakeholders’ interests.6,7
Th e BSM’s capabilities and the results of this study will be discussed in the context of these analytic needs.
Methodology: the Biomass Scenario Model
Introduction to the Biomass Scenario Model
Th e US Department of Energy Bioenergy Technologies Offi ce and the National Renewable Energy Laboratory developed the BSM to investigate the dynamics associ-ated with the potential evolutionary trajectories of a US biofuels industry.12 Th e model uses a system dynamics modeling approach, built on the STELLA soft ware plat-form,13 to represent the dynamic interactions among the major sectors that comprise the biomass-to-biofuel industry ‒ feedstock production and logistics, feedstock conversion, and downstream elements (inventory, dispens-ing, distribution, fuel use, and vehicle fl eet).14 Th e model encodes a system of coupled ordinary diff erential equa-tions that are integrated forward in time, thus establishing interdependence among rates of change of key parameters and feedbacks between variables representing physical, technical, economic, and behavioral aspects of the biofuels supply chain.15 Th e BSM tracks the deployment of biofuels over time by representing investment in new technologies, competition from petroleum fuels, vehicle demand for biofuels, and various policies and incentives. Its intended use is to generate and explore scenarios for the evolu-tion of a US biofuels industry. Th e bioenergy modeling
Published 2014. This article is a U.S. Government work and is in the public domain in the USA. Biofuels, Bioproducts, Biorefining published by John Wiley & Sons, Ltd on behalf of Society of Chemical Industry | Biofuels, Bioprod. Bioref. 9:158–176 (2015); DOI: 10.1002/bbb 161
Modeling and Analysis: Maturation of Biomass-to-Biofuels Conversion Technology Pathways LJ Vimmerstedt et al.
Figure 1 . Major modules in the BSM represent major sectors of the biofuels industry.22
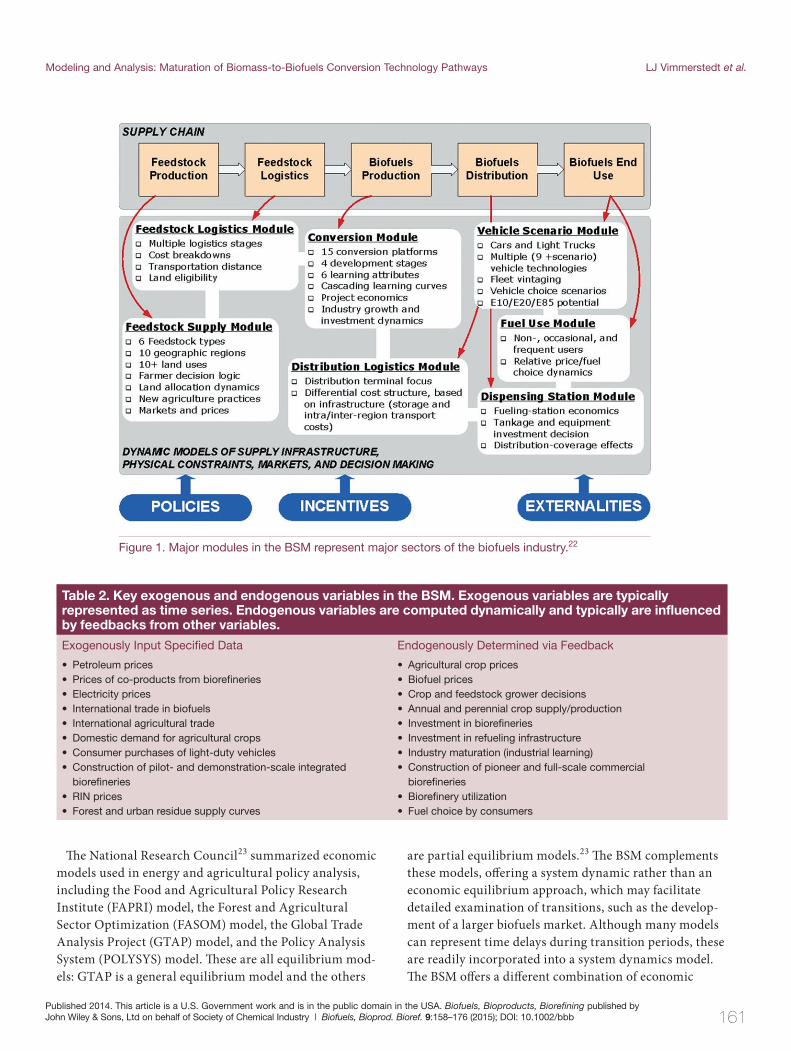
Table 2. Key exogenous and endogenous variables in the BSM. Exogenous variables are typically represented as time series. Endogenous variables are computed dynamically and typically are influenced by feedbacks from other variables.
Exogenously Input Specifi ed Data Endogenously Determined via Feedback
• Petroleum prices• Prices of co-products from biorefi neries• Electricity prices• International trade in biofuels• International agricultural trade• Domestic demand for agricultural crops• Consumer purchases of light-duty vehicles• Construction of pilot- and demonstration-scale integrated
biorefi neries• RIN prices• Forest and urban residue supply curves
• Agricultural crop prices• Biofuel prices• Crop and feedstock grower decisions• Annual and perennial crop supply/production• Investment in biorefi neries• Investment in refueling infrastructure• Industry maturation (industrial learning)• Construction of pioneer and full-scale commercial
biorefi neries• Biorefi nery utilization• Fuel choice by consumers
Th e National Research Council23 summarized economic models used in energy and agricultural policy analysis, including the Food and Agricultural Policy Research Institute (FAPRI) model, the Forest and Agricultural Sector Optimization (FASOM) model, the Global Trade Analysis Project (GTAP) model, and the Policy Analysis System (POLYSYS) model. Th ese are all equilibrium mod-els: GTAP is a general equilibrium model and the others
are partial equilibrium models.23 Th e BSM complements these models, off ering a system dynamic rather than an economic equilibrium approach, which may facilitate detailed examination of transitions, such as the develop-ment of a larger biofuels market. Although many models can represent time delays during transition periods, these are readily incorporated into a system dynamics model. Th e BSM off ers a diff erent combination of economic

162Published 2014. This article is a U.S. Government work and is in the public domain in the USA. Biofuels, Bioproducts, Biorefining published by John Wiley & Sons, Ltd on behalf of Society of Chemical Industry | Biofuels, Bioprod. Bioref. 9:158–176 (2015); DOI: 10.1002/bbb
LJ Vimmerstedt et al. Modeling and Analysis: Maturation of Biomass-to-Biofuels Conversion Technology Pathways
production,25* and the BSM explicitly represents learning-by-doing (distinguishing it from economies of scale and from background, economy-wide learning). Learning-by-doing is assumed to result in improved performance ‒ from current to ultimate performance of each conversion path-way ‒ as a function of process development through pilot- and demonstration-scale production and as a function of commercial production of biofuels. In general, learning-by-doing may be partially confi ned within fi rms, but in the BSM it is represented as occurring within a conversion pathway. Th is study explores the eff ects of diff erent rates of learning transfer among related conversion pathways (spill-over learning, measured as a percent of learning that is shared). Learning modes may include transfer of personnel, exchanges at professional meetings and conferences, formal sharing agreements,26 and published research fi ndings.
Th e major dynamic feature of the BSM that involves the conversion module is shown in Fig. 3. Industrial expansion is tracked at four operational scales (pilot, demonstration, pioneer-commercial,† and commercial) in terms of fi ve
sector and geographic coverage relative to these and other models: some other models include more details on specifi c parts of the supply chain ‒ notably agriculture; some off er more global coverage with more robust repre-sentation of trade; and general equilibrium models cover more economic sectors. Some BSM inputs use results of models that provide more detail for specifi c sectors, such as POLYSYS inputs for agricultural residue resources. Th e BSM can also use results of models that have broader scope, such as general equilibrium models, as scenarios to set boundary conditions.
Biomass conversion to biofuels
Th e conversion sector ‒ as it contributes to biofuels indus-try growth ‒ is the focus of this study. For a more detailed discussion of other aspects of the BSM, such as its geo-graphic stratifi cation, other sectors, BSM logic, and data sources, see other BSM publications. Peterson et al.21 and Newes et al.24 provide overviews of the model, and Lin et al.20 document model inputs. Th e feedstocks, intermedi-ates, blendstocks, or fuels, and biomass-to-biofuels conver-sion technology pathways that are represented in BSM are shown in Fig. 2.
Learning-by-doing, also called learning from experience or experiential learning, is an observable feature of techno-logical transitions from early development to commercial
Figure 2 . The BSM represents multiple biomass-to-biofuel conversion technology pathways.22
Gasoline
Diesel
Jet
Lignocellulosic
Biomass
Energy crops (herbaceous and
woody)
Residues (herbaceous,
woody, urban)
Catalytic synthesis
Fischer - Tropsch synthesis
Hydro-processing
Catalytic Upgrading
Fermentation
Bio-Oils
Syn Gas
Sugars
Fermentation
Fermentation
Hydrodeoxygenation Oils
Natural Oils
( Oilseeds and Algae)
Corn
Butanol
Ethanol
Ethanol and Mixed Alcohols
Diesel and Jet
Methanol Synthesis, Methanol -to-Gasoline
Gasoline
Gasification
Extraction
Pyrolysis
Pretreatment & Hydrolysis
Hydrolysis
Processing at biorefinery
Optional processing
Biorefinery Processing
Biomass Feedstocks
Petrochemical Refining
Blending at Refinery
Finished F uels
“Drop In” points for infrastructure- compatible fuels:
Sugars
Ethanol
* Considering the biomass-to-biofuels conversion technology path-ways, corn-starch-to-ethanol and biodiesel are well established; cellulose-to-ethanol and biomass-to-hydrocarbons pathways face early market challenges such as financing.† ‘Pioneer-commercial’ is a category for early commercial-scale biorefineries within a pathway.

Published 2014. This article is a U.S. Government work and is in the public domain in the USA. Biofuels, Bioproducts, Biorefining published by John Wiley & Sons, Ltd on behalf of Society of Chemical Industry | Biofuels, Bioprod. Bioref. 9:158–176 (2015); DOI: 10.1002/bbb 163
Modeling and Analysis: Maturation of Biomass-to-Biofuels Conversion Technology Pathways LJ Vimmerstedt et al.
of the available investment under certain circumstances; it also shapes the timing and rates of capacity expansion.
Th is reinforcing feedback is implemented within the BSM through connections that include information exchange between its modules, as shown in Table 3.
Investment in biorefi neries
Th e BSM calculates the expected net present value (NPV) of investment in a new pioneer-commercial or commer-cial biorefi nery to approximate the fi nancial decision-making of investors. (Opinions diff er about actual investor behavior: some literature supports the view that inves-tors tend to assume current prices will persist. Th e BSM, for the purposes of this study, uses this assumption.**)
types of performance improvement (conversion-process yield, feedstock-input capacity, capital cost, investor risk premium,‡ and access to debt fi nancing). Reinforcing feedback§ occurs as industrial development improves the fi nancial performance of pioneer-commercial and commercial-scale biorefi neries, attracting investment in capacity expansion. Calculations of expected economic value of investment, learning-by-doing, and utilization are used to estimate production capacity development and production volume. Th is reinforcing feedback may enable technologies with higher initial maturity to receive most
Figure 3 . The BSM includes reinforcing feedbacks around industrial development, fi nancial performance, and industrial production and capacity.22
Industry Development
Multiple Technologies/Multiple Regions
Multiple Scales
Pilot
Demo
Pioneer
Commercial
Learning Curve Dynamics
Fuel Production
Pioneer Scale Financials
Multiple Technologies/Multiple Regions
Pro Forma Financials
Net Present Value of “Next” Plant
Commercial Scale Financials
Multiple Technologies/Multiple Regions
Pro Forma Financials
Net Present Value of “Next” Plant
Industry Production and Capacity
Multiple Technologies/Multiple Regions
Pioneer and Commercial Scale
Allocation of Plant Construction Capacity
Initiation of Construction of Discrete
Plants
Process Yield
Input Capacity
Capital Cost Growth
Investor Risk Premium
Debt Financing Access
Net Present Value of “Next” Plant
Capacity Additions
Maturity in terms of…
(+) Reinforcing feedback
Tabl e 3. Information is exchanged to and from the conversion module and other modules of the BSM.
Module Name …Feedstock Supply and Logistics
…Oil Industry …Downstream
to Conversion from… Feedstock consumptionFeedstock price(plant gate)
Module-specifi c price input Ethanol point of production priceButanol point of production price
from Conversion to… Feedstock demandCost to price ratiosOutput capacity
Infrastructure-compatible fuel production by pathway
Ethanol ProductionButanol Production
‡ Investor risk premium is the additional return that investors require to compensate for additional risk.§ Reinforcing, or positive, feedback encourages a trend in one direction (growth or decline) in contrast to balancing feedback, which encourages stability.
** Prevailing prices persist and are discounted in the NPV calculation at the specified discount rate.
164Published 2014. This article is a U.S. Government work and is in the public domain in the USA. Biofuels, Bioproducts, Biorefining published by John Wiley & Sons, Ltd on behalf of Society of Chemical Industry | Biofuels, Bioprod. Bioref. 9:158–176 (2015); DOI: 10.1002/bbb
LJ Vimmerstedt et al. Modeling and Analysis: Maturation of Biomass-to-Biofuels Conversion Technology Pathways
biomass via thermochemical conversion (‘thermochemical ethanol’),24 methanol-to-gasoline (MTG), Fischer-Tropsch synthesis, fast pyrolysis followed by hydroprocessing, aque-ous phase reforming), sugar fermentation to hydrocarbons, butanol synthesis through a fermentation pathway, and hydrodeoxygenation of oils (‘green diesel’) (Fig. 2).
Th e BSM representation of each conversion pathway includes a set of assumptions about the fi ve types of per-formance improvements identifi ed in Fig. 3. Th e level of performance is tied to the maturity of the pathway, which is characterized as initial, state-of-technology, or mature. Performance levels for initial and mature industry condi-tions are externally specifi ed inputs. Th e model estimates a state-of-technology based on its learning algorithm, which accounts for learning within each operational scale (pilot, demonstration, pioneer commercial, and full-scale com-mercial). As learning increases, performance approaches mature industry conditions. Th e learning rate and progress ratio†† govern the rate of this approach, and progress ratios of 65%, 75%, and 85% were explored in this study.
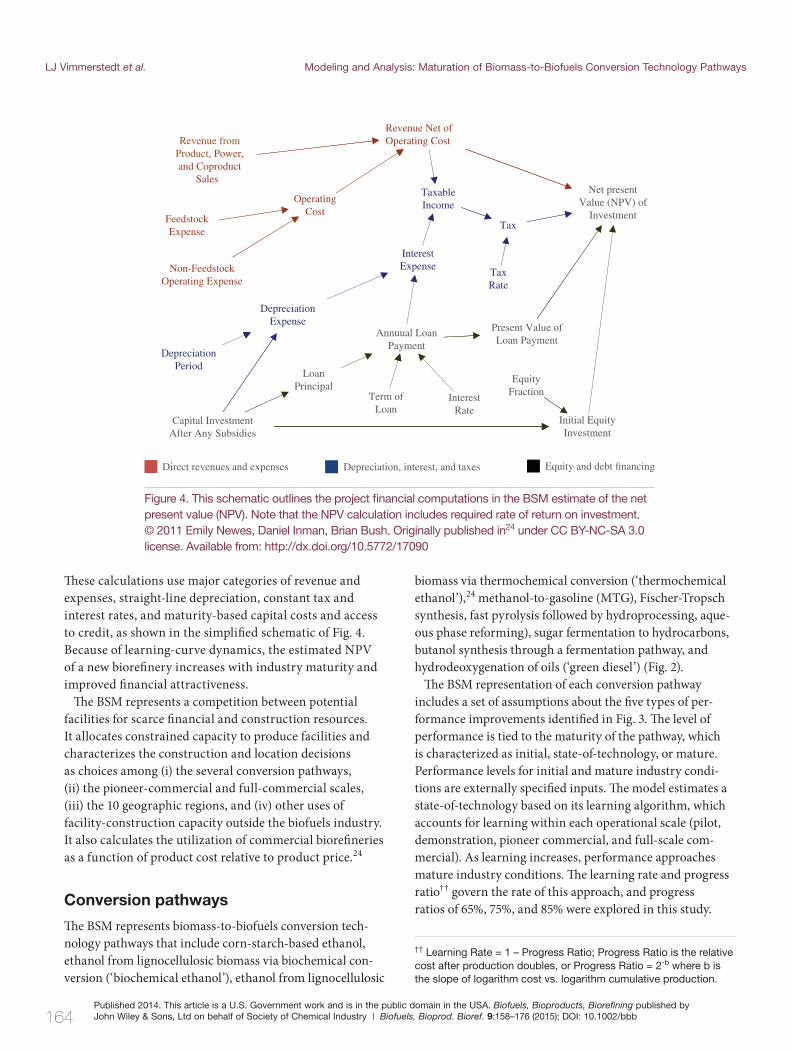
Th ese calculations use major categories of revenue and expenses, straight-line depreciation, constant tax and interest rates, and maturity-based capital costs and access to credit, as shown in the simplifi ed schematic of Fig. 4. Because of learning-curve dynamics, the estimated NPV of a new biorefi nery increases with industry maturity and improved fi nancial attractiveness.
Th e BSM represents a competition between potential facilities for scarce fi nancial and construction resources. It allocates constrained capacity to produce facilities and characterizes the construction and location decisions as choices among (i) the several conversion pathways, (ii) the pioneer-commercial and full-commercial scales, (iii) the 10 geographic regions, and (iv) other uses of facility-construction capacity outside the biofuels industry. It also calculates the utilization of commercial biorefi neries as a function of product cost relative to product price.24
Conversion pathways
Th e BSM represents biomass-to-biofuels conversion tech-nology pathways that include corn-starch-based ethanol, ethanol from lignocellulosic biomass via biochemical con-version (‘biochemical ethanol’), ethanol from lignocellulosic
Figure 4 . This schematic outlines the project fi nancial computations in the BSM estimate of the net present value (NPV). Note that the NPV calculation includes required rate of return on investment. © 2011 Emily Newes, Daniel Inman, Brian Bush. Originally published in24 under CC BY-NC-SA 3.0 license. Available from: http://dx.doi.org/10.5772/17090
Revenue from
Product, Power,
and Coproduct
Sales
Revenue Net of
Operating Cost
Tax
Operating
CostFeedstock
Expense
Non-Feedstock
Operating Expense
Depreciation
Period
Depreciation
Expense
Loan
Principal
Capital Investment
After Any Subsidies
Taxable
Income
Tax
Rate
Interest
Expense
Term of
LoanInterest
Rate
Equity
Fraction
Initial Equity
Investment
Present Value of
Loan Payment
Net present
Value (NPV) of
Investment
Equity and debt financingDepreciation, interest, and taxesDirect revenues and expenses
Annuual Loan
Payment
†† Learning Rate = 1 – Progress Ratio; Progress Ratio is the relative cost after production doubles, or Progress Ratio = 2-b where b is the slope of logarithm cost vs. logarithm cumulative production.
Published 2014. This article is a U.S. Government work and is in the public domain in the USA. Biofuels, Bioproducts, Biorefining published by John Wiley & Sons, Ltd on behalf of Society of Chemical Industry | Biofuels, Bioprod. Bioref. 9:158–176 (2015); DOI: 10.1002/bbb 165
Modeling and Analysis: Maturation of Biomass-to-Biofuels Conversion Technology Pathways LJ Vimmerstedt et al.
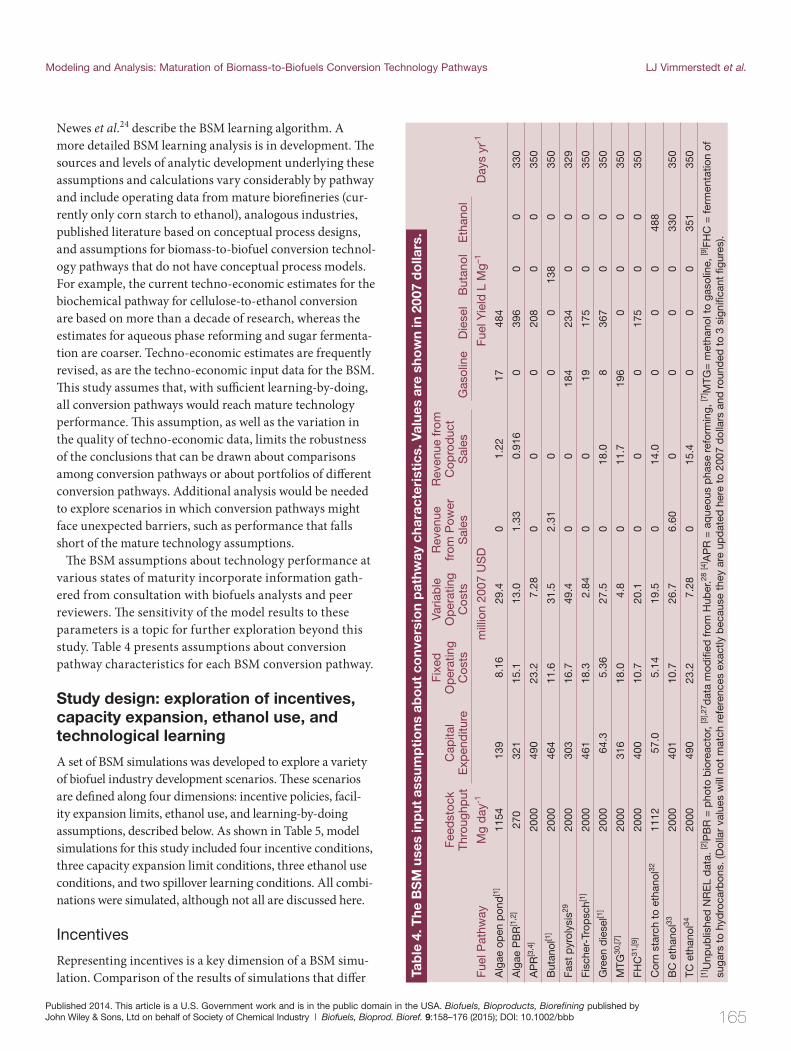
Newes et al.24 describe the BSM learning algorithm. A more detailed BSM learning analysis is in development. Th e sources and levels of analytic development underlying these assumptions and calculations vary considerably by pathway and include operating data from mature biorefi neries (cur-rently only corn starch to ethanol), analogous industries, published literature based on conceptual process designs, and assumptions for biomass-to-biofuel conversion technol-ogy pathways that do not have conceptual process models. For example, the current techno-economic estimates for the biochemical pathway for cellulose-to-ethanol conversion are based on more than a decade of research, whereas the estimates for aqueous phase reforming and sugar fermenta-tion are coarser. Techno-economic estimates are frequently revised, as are the techno-economic input data for the BSM. Th is study assumes that, with suffi cient learning-by-doing, all conversion pathways would reach mature technology performance. Th is assumption, as well as the variation in the quality of techno-economic data, limits the robustness of the conclusions that can be drawn about comparisons among conversion pathways or about portfolios of diff erent conversion pathways. Additional analysis would be needed to explore scenarios in which conversion pathways might face unexpected barriers, such as performance that falls short of the mature technology assumptions.
Th e BSM assumptions about technology performance at various states of maturity incorporate information gath-ered from consultation with biofuels analysts and peer reviewers. Th e sensitivity of the model results to these parameters is a topic for further exploration beyond this study. Table 4 presents assumptions about convers ion pathway characteristics for each BSM conversion pathway.
Study design: exploration of incentives, capacity expansion, ethanol use, and technological learning
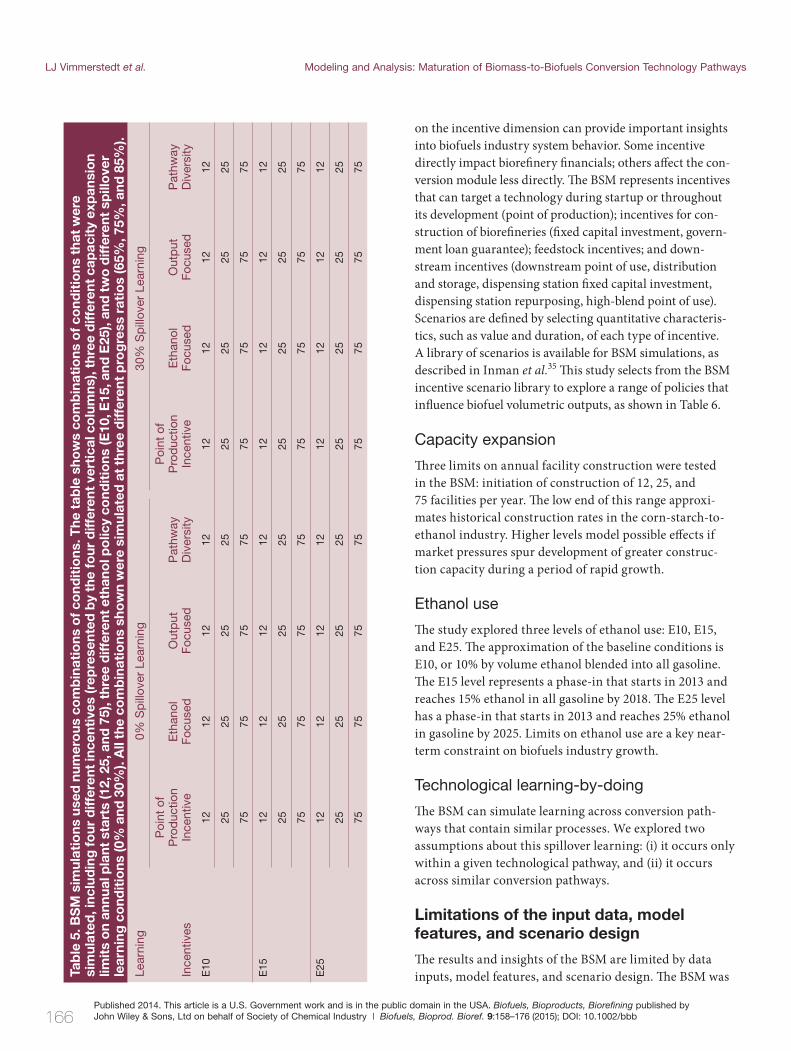
A set of BSM simulations was developed to explore a variety of biofuel industry development scenarios. Th ese scenarios are defi ned along four dimensions: incentive policies, facil-ity expansion limits, ethanol use, and learning-by-doing assumptions, described below. As shown in Table 5, model simulations for this study included four incentive conditions, three capacity expansion limit conditions, three ethanol use conditions, and two spillover learning conditions. All combi-nations were simulated, although not all are discussed here.
Incentives
Representing incentives is a key dimension of a BSM simu-lation. Comparison of the results of simulations that diff er Ta
ble
4. T
he B
SM
use
s in
put
ass
ump
tio
ns a
bo
ut c
onv
ersi
on
pat
hway
cha
ract
eris
tics
. Val
ues
are
sho
wn
in 2
007
do
llars
.
Fe
edst
ock
Thro
ughp
utC
apita
l E
xpen
ditu
re
Fixe
d
Op
erat
ing
Cos
ts
Varia
ble
O
per
atin
g C
osts
Rev
enue
fr
om P
ower
S
ales
Rev
enue
from
C
opro
duc
t S
ales
Gas
olin
eD
iese
lB
utan
olE
than
ol
Fuel
Pat
hway
Mg
day
-1m
illio
n 20
07 U
SD
Fu
el Y
ield
L M
g–1
Day
s yr
-1
Alg
ae o
pen
pon
d[1
]11
5413
98.
1629
.40
1.22
1748
4
Alg
ae P
BR
[1,2
]27
032
115
.113
.01.
330.
916
039
60
033
0
AP
R[3
,4]
2000
490
23.2
7.28
00
020
80
035
0
But
anol
[1]
2000
464
11.6
31.5
2.31
00
013
80
350
Fast
pyr
olys
is29
2000
303
16.7
49.4
00
184
234
00
329
Fisc
her-
Trop
sch[1
]20
0046
118
.3 2
.84
00
1917
50
035
0
Gre
en d
iese
l[1]
2000
64.3
5.36
27.5
018
.08
367
00
350
MTG
30,[7
]20
0031
618
.04.
80
11.7
196
00
035
0
FHC
31,[9
]20
0040
010
.720
.10
00
175
00
350
Cor
n st
arch
to
etha
nol32
1112
57.0
5.14
19.5
014
.00
00
488
BC
eth
anol
3320
0040
110
.7
26.7
6.60
00
00
330
350
TC e
than
ol34
2000
490
23.2
7.
280
15.4
00
035
135
0[1
] Unp
ublis
hed
NR
EL
dat
a. [2
] PB
R =
pho
to b
iore
acto
r, [3
],27 d
ata
mod
ifi ed
from
Hub
er.28
[4] A
PR
= a
que
ous
pha
se r
efor
min
g, [7
] MTG
= m
etha
nol t
o ga
solin
e, [9
] FHC
= fe
rmen
tatio
n of
su
gars
to
hyd
roca
rbon
s. (D
olla
r va
lues
will
not
mat
ch r
efer
ence
s ex
actly
bec
ause
the
y ar
e up
dat
ed h
ere
to 2
007
dol
lars
and
rou
nded
to
3 si
gnifi
cant
fi gu
res)
.
166Published 2014. This article is a U.S. Government work and is in the public domain in the USA. Biofuels, Bioproducts, Biorefining published by John Wiley & Sons, Ltd on behalf of Society of Chemical Industry | Biofuels, Bioprod. Bioref. 9:158–176 (2015); DOI: 10.1002/bbb
LJ Vimmerstedt et al. Modeling and Analysis: Maturation of Biomass-to-Biofuels Conversion Technology Pathways
on the incentive dimension can provide important insights into biofuels industry system behavior. Some incentive directly impact biorefi nery fi nancials; others aff ect the con-version module less directly. Th e BSM represents incentives that can target a technology during startup or throughout its development (point of production); incentives for con-struction of biorefi neries (fi xed capital investment, govern-ment loan guarantee); feedstock incentives; and down-stream incentives (downstream point of use, distribution and storage, dispensing station fi xed capital investment, dispensing station repurposing, high-blend point of use). Scenarios are defi ned by selecting quantitative characteris-tics, such as value and duration, of each type of incentive. A library of scenarios is available for BSM simulations, as described in Inman et al.35 Th is study selects from the BSM incentive scenario library to explore a range of policies that infl uence biofuel volumetric outputs, as shown in Table 6.
Capacity expansion
Th ree limits on annual facility construction were tested in the BSM: initiation of construction of 12, 25, and 75 facilities per year. Th e low end of this range approxi-mates historical construction rates in the corn-starch-to-ethanol industry. Higher levels model possible eff ects if market pressures spur development of greater construc-tion capacity during a period of rapid growth.
Ethanol use
Th e study explored three levels of ethanol use: E10, E15, and E25. Th e approximation of the baseline conditions is E10, or 10% by volume ethanol blended into all gasoline. Th e E15 level represents a phase-in that starts in 2013 and reaches 15% ethanol in all gasoline by 2018. Th e E25 level has a phase-in that starts in 2013 and reaches 25% ethanol in gasoline by 2025. Limits on ethanol use are a key near-term constraint on biofuels industry growth.
Technological learning-by-doing
Th e BSM can simulate learning across conversion path-ways that contain similar processes. We explored two assumptions about this spillover learning: (i) it occurs only within a given technological pathway, and (ii) it occurs across similar conversion pathways.
Limitations of the input data, model features, and scenario design
Th e results and insights of the BSM are limited by data inputs, model features, and scenario design. Th e BSM was Ta
ble
5. B
SM
sim
ulat
ions
use
d n
umer
ous
co
mb
inat
ions
of c
ond
itio
ns. T
he t
able
sho
ws
com
bin
atio
ns o
f co
ndit
ions
tha
t w
ere
sim
ulat
ed, i
nclu
din
g fo
ur d
iffer
ent
ince
ntiv
es (r
epre
sent
ed b
y th
e fo
ur d
iffer
ent
vert
ical
co
lum
ns),
thre
e d
iffer
ent
cap
acit
y ex
pan
sio
n lim
its
on
annu
al p
lant
sta
rts
(12,
25,
and
75)
, thr
ee d
iffer
ent
etha
nol p
olic
y co
ndit
ions
(E10
, E15
, and
E25
), an
d t
wo
diff
eren
t sp
illo
ver
lear
ning
co
ndit
ions
(0%
and
30%
). A
ll th
e co
mb
inat
ions
sho
wn
wer
e si
mul
ated
at
thre
e d
iffer
ent
pro
gre
ss r
atio
s (6
5%, 7
5%, a
nd 8
5%).
Lear
ning
0% S
pill
over
Lea
rnin
g 30
% S
pill
over
Lea
rnin
g
Ince
ntiv
es
Poi
nt o
f P
rod
uctio
n In
cent
ive
Eth
anol
Fo
cuse
dO
utp
ut
Focu
sed
Pat
hway
D
iver
sity
Poi
nt o
f P
rod
uctio
n In
cent
ive
Eth
anol
Fo
cuse
dO
utp
ut
Focu
sed
Pat
hway
D
iver
sity
E10
1212
1212
1212
1212
2525
2525
2525
2525
7575
7575
7575
7575
E15
1212
1212
1212
1212
2525
2525
2525
2525
7575
7575
7575
7575
E25
1212
1212
1212
1212
2525
2525
2525
2525
7575
7575
7575
7575
Published 2014. This article is a U.S. Government work and is in the public domain in the USA. Biofuels, Bioproducts, Biorefining published by John Wiley & Sons, Ltd on behalf of Society of Chemical Industry | Biofuels, Bioprod. Bioref. 9:158–176 (2015); DOI: 10.1002/bbb 167
Modeling and Analysis: Maturation of Biomass-to-Biofuels Conversion Technology Pathways LJ Vimmerstedt et al.
conversion pathways through publicly funded incentives and private investments.
Coordination of investments with respect to timing, pathway, and targeted biofuels industry sector promotes biofuels industry development
Th e biofuels industry is an interdependent system; its overall growth requires coordinated expansion of various parts of the system from feedstock production to vehicle consumption of biomass-based fuels.
Overall industry growth is the greatest when (i) the least amount of eff ort is wasted in removing any single bar-rier, and (ii) when barriers across the entire system are removed in an orchestrated manner that considers tim-ing, pathway, and sector. Waste metrics include delays in reaching production targets, total incentive cost, windfall profi ts, and cost-eff ectiveness metrics such as cost per volume of installed production capacity. Investment in incentives in any single part of the system will infl uence overall industry growth only under certain conditions, such as when that part is the constraint. BSM results show that investments in incentives that remove barriers across the entire system are more eff ective than investments that target some parts of the system and neglect others. Previous studies24 use BSM results to illustrate the value of balanced incentives in reaching RFS levels of biofuels production. Th ese results illustrate the application of the BSM to the second analytic need: the need for coordinated supply chain decisions, which was identifi ed in the bioen-ergy modeling review. Although much of the literature on supply chain emphasizes tactical or operational coordina-tion, as might occur among fi rms through contracts,6,11 the BSM estimate of eff ects of coordination of incentives across the supply chain highlights the value of coordina-tion at a strategic, national level, as might be achieved through coordinated or linked policies. Th e BSM analysis
developed to provide insights about the possible evolution of the biomass-based fuels system. It is not intended to be a precise forecasting tool or a predictive model. All the limitations identifi ed here could be addressed; some are being addressed in ongoing development eff orts.
While the BSM results depend on many input data assump-tions, the techno-economic input data are particularly important for the conversion module. Earlier we noted the issue of variation in techno-economic data sources. Th e BSM compensates somewhat for these variations by assigning dif-ferent technology maturity levels to diff erent pathways. Th e BSM results should thus not be interpreted to support strong conclusions about specifi c pathways, such as relative market prospects or the number of pathways to pursue initially to ensure eventual achievement of particular goals.
Th e BSM conversion module features specifi c technol-ogy pathways and neglects others. In particular, potential feedstock inputs from various waste streams, such as municipal solid wastes or waste oils, are not represented, nor are products such as sugar, biopolymers, and other bioproducts. Exploring these pathways would require a diff erent set of assumptions and diff erent data.
Th e scenario design used in this study could be expanded to include additional key sensitivity analyses such as techno-economics or investment decision calculations.
Results
Th e BSM results, based on the selected scenarios, illustrate the crucial role of coordinated investment, management of risk and uncertainty, and conversion sector barriers during periods of rapid growth in scenarios that approach RFS-level volumes of biofuels sales.
Coordination of investment
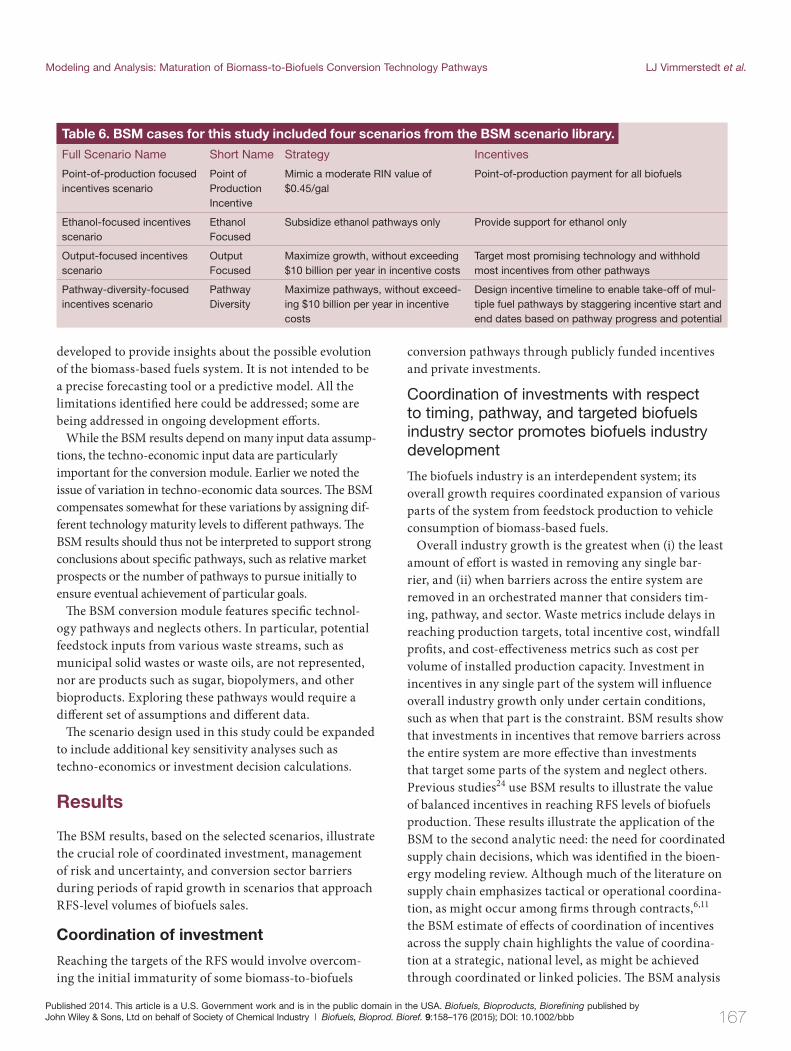
Reaching the targets of the RFS would involve overcom-ing the initial immaturity of some biomass-to-biofuels
Table 6 . BSM cases for this study included four scenarios from the BSM scenario library.
Full Scenario Name Short Name Strategy Incentives
Point-of-production focused incentives scenario
Point of Production Incentive
Mimic a moderate RIN value of $0.45/gal
Point-of-production payment for all biofuels
Ethanol-focused incentives scenario
Ethanol Focused
Subsidize ethanol pathways only Provide support for ethanol only
Output-focused incentives scenario
Output Focused
Maximize growth, without exceeding $10 billion per year in incentive costs
Target most promising technology and withhold most incentives from other pathways
Pathway-diversity-focused incentives scenario
Pathway Diversity
Maximize pathways, without exceed-ing $10 billion per year in incentive costs
Design incentive timeline to enable take-off of mul-tiple fuel pathways by staggering incentive start and end dates based on pathway progress and potential
168Published 2014. This article is a U.S. Government work and is in the public domain in the USA. Biofuels, Bioproducts, Biorefining published by John Wiley & Sons, Ltd on behalf of Society of Chemical Industry | Biofuels, Bioprod. Bioref. 9:158–176 (2015); DOI: 10.1002/bbb
LJ Vimmerstedt et al. Modeling and Analysis: Maturation of Biomass-to-Biofuels Conversion Technology Pathways
Th e BSM includes assumptions about the initial matu-rity of each conversion pathway, as shown in Table 4. Assumptions about maturity and costs are such that Fischer-Tropsch has the highest initial NPV of the bio-mass-based hydrocarbon pathways; its initial settings for pilot- and demonstration-scale maturity are at least equal to all other pathways, except those for corn starch and cel-lulosic ethanol. Th e pathway with the best NPV attracts more investment, increasing its maturity and invest-ment attractiveness in the reinforcing feedback (Fig. 3). However, in these assumptions the fi nancial performance of a mature commercial biorefi nery is better for fast pyrol-ysis than for Fischer-Tropsch, based on the cited process design publications. Actual long-term performance is, of course, uncertain.
In the model, a more mature conversion pathway that is more expensive in the long run can lock out a less-mature conversion pathway that is less expensive in the long run, due to investment and learning dynamics.25 Signifi cant uncertainty also remains about the ultimate cost and per-formance of many pathways. In the Point of Production Incentive scenario, Fischer-Tropsch tends to lock out other biomass-based hydrocarbon pathways. To counteract the risk of lockout and to diversify pathways for technology risk management, policies could be designed to over-come the low initial maturity of promising pathways, as in the Output Focused scenario, or promote even greater pathway diversity, as in the Pathway Diversity scenario. Figure 5 illustrates this trade-off between pathway diver-sity and incentive costs (not adjusted for risk).
Model results suggest greater cost eff ectiveness for the Output Focused scenario than for the Pathway Diversity scenario. For example, in the Output Focused scenario in 2026, a cumulative $20 billion investment in incentives for the biomass-to-hydrocarbons pathway has an estab-lished production capacity of about 7 billion gallons per year. Th e Pathway Diversity scenario reaches this level of cumulative cost in 2027, with a 4-billion gallon per year industry. However, these do not include the cost of tech-nology risk or the value of the option to use more path-ways. Instead, model results indicate that encouraging more diversity may have a higher cost (the diff erence in estimated cost eff ectiveness between the Output Focused and Pathway Diversity scenarios). Th ese scenarios are not fully optimized, so the costs are approximate, but this kind of relative scenario cost could be compared with estimates of the expected benefi ts of additional technol-ogy options. For example, estimates of probabilities of reaching mature conversion technology pathway per-formance could be used to compare risk-adjusted costs
locates bottlenecks in the supply chain and identifi es the magnitude of incentives required to overcome these bot-tlenecks under modeled assumptions.
Risk and uncertainty
Th e maturation and techno-economics of conversion path-ways are uncertain; thus, the size of the public and private investment needed to develop a self-sustaining industry is diffi cult to estimate. Public incentives for the biofuels industry can support diverse conversion pathways as an explicit goal, and may mitigate the risk that a technol-ogy will not perform as expected. Alternatively, they can target a narrower set of conversion pathways, by design or by default, and possibly reduce the cost, and increase the probability of success of the selected pathways by concentrating resources. Th is comes at a higher risk that technology performance issues would have overall nega-tive impacts on timing and magnitude of production. Ease of learning within pathways and sharing of learning across pathways are major uncertainties in modeling these issues, and these assumptions shape simulation results.
Potential trade-offs exist between pathway diversity (risk mitigation) and direct incentive cost because of uncertainty in maturation and techno-economics
Incentives allocate resources towards biomass-to-biofuels conversion technology pathways that are at diff erent stages of development. A pathway could have relatively attrac-tive fi nancial performance in the nearer term, but could someday be surpassed by pathways that are now at earlier stages of development. Th e design choices about allocation of incentives to more-mature or less-mature pathways are important because (i) future development is uncertain; (ii) less attractive but early-maturing technology pathways can lock out others, making their market entry all but impos-sible; and (iii) incentives can infl uence conversion tech-nology development. Th e results from the BSM illustrate these insights. Th e Pathway Diversity scenario features deliberate allocation of incentives to encourage matura-tion of multiple conversion pathways. Th is approach places greater value on fostering diversity to reduce technology risk. Th e Output Focused scenario allocates incentives to encourage rapid expansion of commercial-scale biofuel-production capacity. Th e Output Focused scenario favors the pathway with the most competitive performance under mature technology assumptions, and the Pathway Diversity scenario favors the development of multiple pathways.

Published 2014. This article is a U.S. Government work and is in the public domain in the USA. Biofuels, Bioproducts, Biorefining published by John Wiley & Sons, Ltd on behalf of Society of Chemical Industry | Biofuels, Bioprod. Bioref. 9:158–176 (2015); DOI: 10.1002/bbb 169
Modeling and Analysis: Maturation of Biomass-to-Biofuels Conversion Technology Pathways LJ Vimmerstedt et al.
Figure 5 . Assuming mature technology performance will be reached with suffi cient learning, the Output Focused scenario reaches higher production levels than the Pathway Diversity scenario, with a similar annual limit on incentive cost.
Figure 6 . Maturity levels by technology in the Output Focused and Pathway Diversity scenarios.
170Published 2014. This article is a U.S. Government work and is in the public domain in the USA. Biofuels, Bioproducts, Biorefining published by John Wiley & Sons, Ltd on behalf of Society of Chemical Industry | Biofuels, Bioprod. Bioref. 9:158–176 (2015); DOI: 10.1002/bbb
LJ Vimmerstedt et al. Modeling and Analysis: Maturation of Biomass-to-Biofuels Conversion Technology Pathways
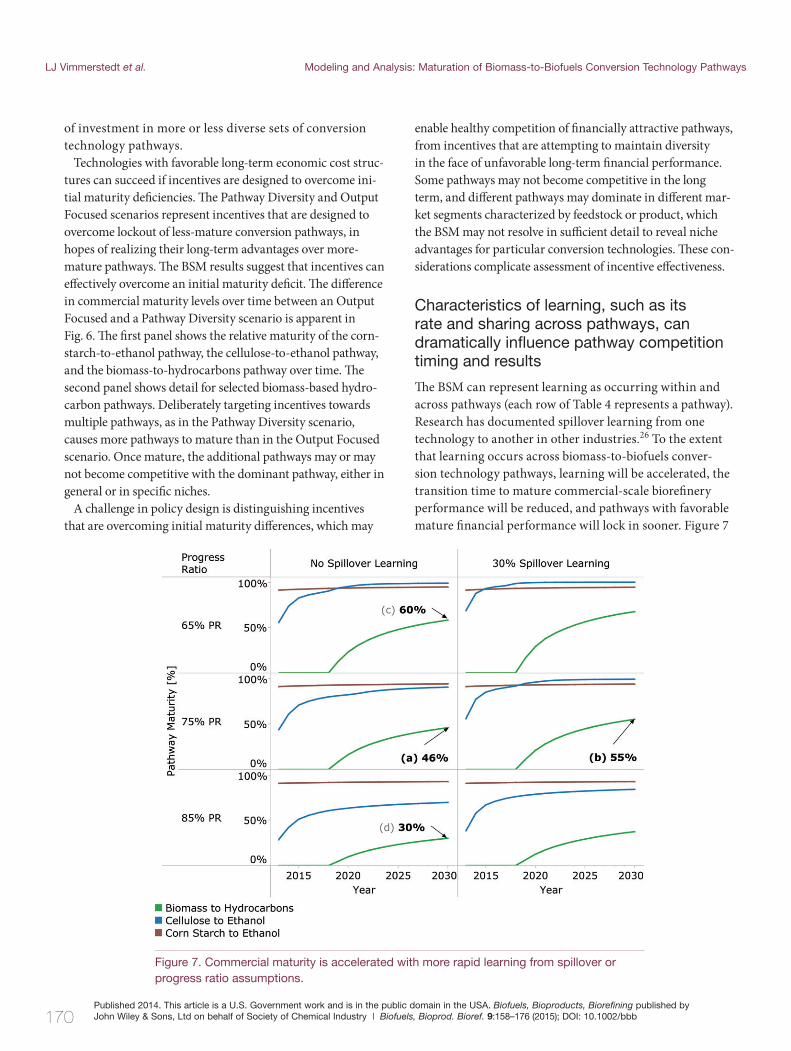
Figure 7. Commercial maturity is accelerated with more rapid learning from spillover or progress ratio assumptions.
of investment in more or less diverse sets of conversion technology pathways.
Technologies with favorable long-term economic cost struc-tures can succeed if incentives are designed to overcome ini-tial maturity defi ciencies. Th e Pathway Diversity and Output Focused scenarios represent incentives that are designed to overcome lockout of less-mature conversion pathways, in hopes of realizing their long-term advantages over more-mature pathways. Th e BSM results suggest that incentives can eff ectively overcome an initial maturity defi cit. Th e diff erence in commercial maturity levels over time between an Output Focused and a Pathway Diversity scenario is apparent in Fig. 6. Th e fi rst panel shows the relative maturity of the corn-starch-to-ethanol pathway, the cellulose-to-ethanol pathway, and the biomass-to-hydrocarbons pathway over time. Th e second panel shows detail for selected biomass-based hydro-carbon pathways. Deliberately targeting incentives towards multiple pathways, as in the Pathway Diversity scenario, causes more pathways to mature than in the Output Focused scenario. Once mature, the additional pathways may or may not become competitive with the dominant pathway, either in general or in specifi c niches.
A challenge in policy design is distinguishing incentives that are overcoming initial maturity diff erences, which may
enable healthy competition of fi nancially attractive pathways, from incentives that are attempting to maintain diversity in the face of unfavorable long-term fi nancial performance. Some pathways may not become competitive in the long term, and diff erent pathways may dominate in diff erent mar-ket segments characterized by feedstock or product, which the BSM may not resolve in suffi cient detail to reveal niche advantages for particular conversion technologies. Th ese con-siderations complicate assessment of incentive eff ectiveness.
Characteristics of learning, such as its rate and sharing across pathways, can dramatically infl uence pathway competition timing and results
Th e BSM can represent learning as occurring within and across pathways (each row of Table 4 represents a pathway). Research has documented spillover learning from one technology to another in other industries.26 To the extent that learning occurs across biomass-to-biofuels conver-sion technology pathways, learning will be accelerated, the transition time to mature commercial-scale biorefi nery performance will be reduced, and pathways with favorable mature fi nancial performance will lock in sooner. Figure 7

Published 2014. This article is a U.S. Government work and is in the public domain in the USA. Biofuels, Bioproducts, Biorefining published by John Wiley & Sons, Ltd on behalf of Society of Chemical Industry | Biofuels, Bioprod. Bioref. 9:158–176 (2015); DOI: 10.1002/bbb 171
Modeling and Analysis: Maturation of Biomass-to-Biofuels Conversion Technology Pathways LJ Vimmerstedt et al.
shows that learning increases with greater shared learning among pathways with the same product; that is, learning is shared across ethanol pathways and across hydrocarbon pathways, but not between ethanol and hydrocarbon path-ways. Maturity increases with 30% spillover learning (right column) relative to 0% (left column), and increases with the more rapid learning that occurs at a 65% progress ratio (top row) relative to the slower learning at 85% progress ratio (bottom row). For example, at a 75% progress ratio, without spillover learning, maturity of biomass-to-hydrocarbons pathways rises from 0% in 2014 to only 46% in 2030 (a), versus 55% in 2030 with 30% spillover learning across all these pathways (b). Considering the eff ect of progress ratio without spillover learning, maturity for these pathways in 2028 was 60% under rapid learning assumptions with a 65% progress ratio (c) versus 30% under slower learning assumptions with an 85% progress ratio (d).
Th e ease of learning has implications for incentive cost eff ectiveness. For example, in the Point of Production Incentive scenario results of these simulations, a $500-million cumulative incentive investment in the cellulose-to-ethanol pathway brings production to a 2-bil-lion liter per year (600-million gallon per year) produc-tion level by 2030 if learning-by-doing is more eff ective (65% progress ratio), but the same $500-million level of investment would bring production to only 0.9 billion lit-ers per year (250 million gallons per year) by 2030 with less eff ective learning-by-doing (75% progress ratio). Th e fi gure also shows that spillover learning and progress ratio exhibit little synergy.
Th e BSM results characterize design trade-off s between pathway diversity and direct incentive cost and character-izing implications of technology learning. Th ey illustrate the application of the BSM to explore specifi c issues related to technology investment (the third need from the literature review) and to understand the impacts of incen-tives (the fourth need). Regarding technology investment, the BSM explicitly represents conversion technology selection, and can compare the relative market penetra-tion of various biomass-to-biofuels conversion technology pathways under a wide range of resource, technological, incentive, regulatory, and other assumptions. Regarding the impact of incentives, the BSM can estimate the eff ects of various types of incentives along the biomass-to- biofuels supply chain, on market development, market share by technology, resource, and fuel, and fi nancial performance. Th is article applies BSM capabilities on technology investment and on incentives to compare scenarios with and without incentives for conversion technology diversity.
Dynamics of rapid growth
Conditions could favor rapid industry growth with ‒ or even without ‒ incentives. If the industry grows rapidly, resources for constructing new biorefi neries may become scarce, and resource allocation then becomes a powerful force shaping the overall growth trajectory and relative shares of conversion pathways; at more moderate growth levels these constraints are less infl uential. During rapid growth, competition between conversion pathways for investment, feedstocks, and markets intensifi es and may slow overall growth, especially that of less-competitive pathways. If demand for ethanol increases, ethanol production ‒ an established commercial process ‒ can respond rapidly.
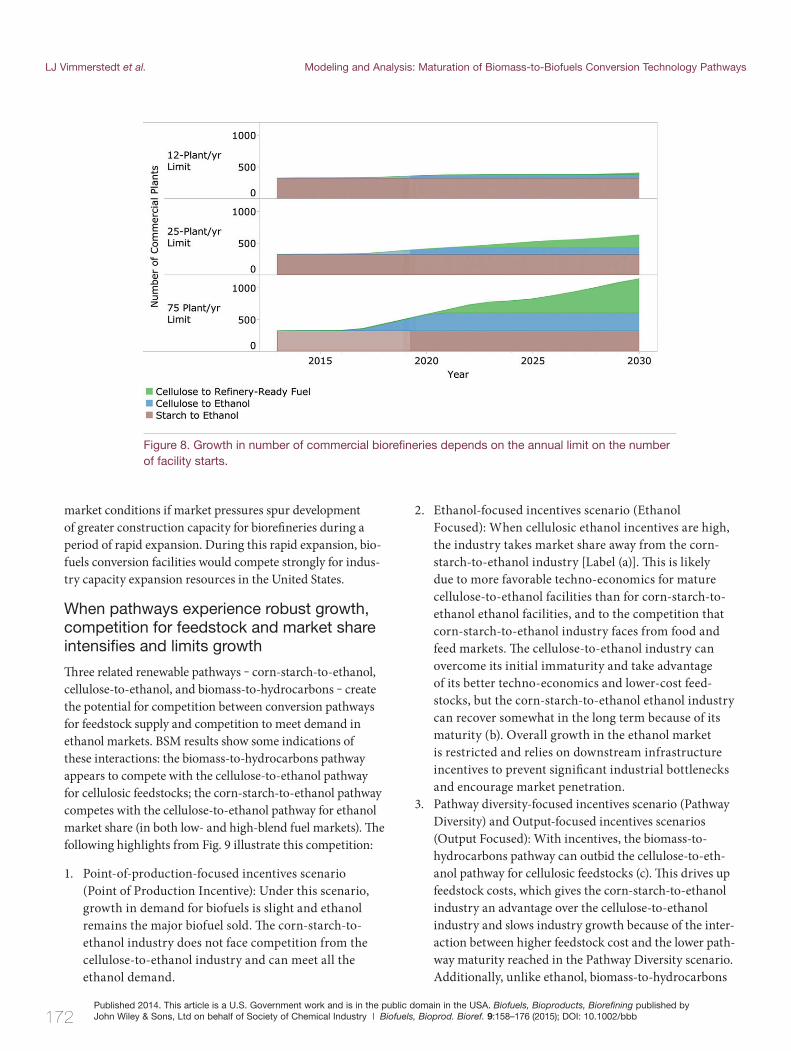
During rapid growth, scarcity of resources for constructing new biorefi neries shapes the biofuel industry’s growth trajectory and infl uences pathway shares
Construction of new biorefi neries involves specialized resources, such as skilled labor, machinery, materials, and fi nancial expertise. Th e BSM estimates the allocation of these resources among conversion pathways, scales, regions, and other uses. Th e BSM represents an overall constraint on these resources by setting an annual limit on the number of commercial facilities that can start being constructed in the biorefi ning industry and in industries that directly compete with biorefi ning for construction resources. Figure 8 shows the importance of this limit on capacity for construction of commercial-scale biorefi neries when industry growth accel-erates. Th e three panels represent numbers of biorefi neries of diff erent types when the annual limit on facility construc-tion starts is 12, 25, or 75.‡‡ Th is limit aff ects both overall biofuels industry growth and the share of biorefi neries of a given type. Th e low end of this range of 12 facilities per year approximates typical historical construction rates in the corn-starch-to-ethanol industry, and 25 facilities per year is close to the maximum number of corn-starch-to-ethanol conversion facility starts seen in that industry.4 Th e upper end of this range is close to the historical maximum number of ethanol conversion facilities under construction in any given year.36 Facility construction starts in the 25–75 range would be consistent with strongly favorable and sustained
‡‡ This constraint on annual plant starts implies a constraint on additional new production capacity in terms of production volume that varies by time (due to learning) and by technology. Annual production volume for a mature commercial plant may be cal-culated from data in Table 3, where Annual Production Volume = Feedstock Throughput (Mg day-1) × Fuel Yield (L Mg-1) × Operating Days (Days yr-1).
172Published 2014. This article is a U.S. Government work and is in the public domain in the USA. Biofuels, Bioproducts, Biorefining published by John Wiley & Sons, Ltd on behalf of Society of Chemical Industry | Biofuels, Bioprod. Bioref. 9:158–176 (2015); DOI: 10.1002/bbb
LJ Vimmerstedt et al. Modeling and Analysis: Maturation of Biomass-to-Biofuels Conversion Technology Pathways
market conditions if market pressures spur development of greater construction capacity for biorefi neries during a period of rapid expansion. During this rapid expansion, bio-fuels conversion facilities would compete strongly for indus-try capacity expansion resources in the United States.
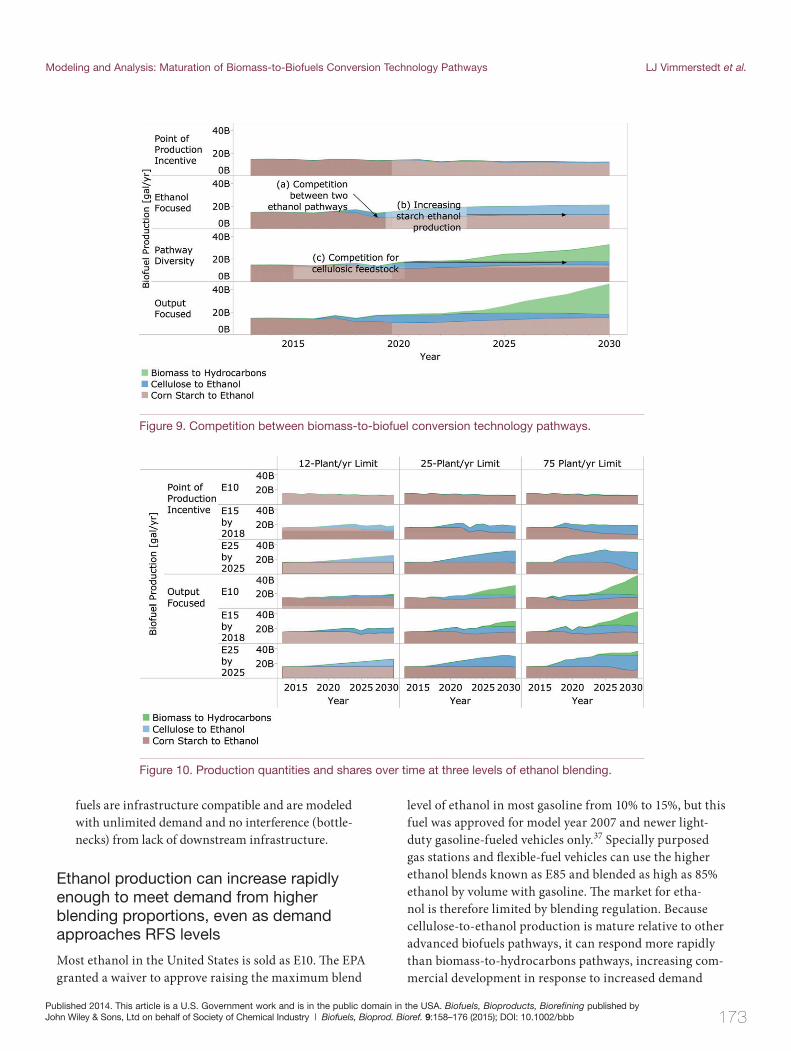
When pathways experience robust growth, competition for feedstock and market share intensifi es and limits growth
Th ree related renewable pathways ‒ corn-starch-to-ethanol, cellulose-to-ethanol, and biomass-to-hydrocarbons ‒ create the potential for competition between conversion pathways for feedstock supply and competition to meet demand in ethanol markets. BSM results show some indications of these interactions: the biomass-to-hydrocarbons pathway appears to compete with the cellulose-to-ethanol pathway for cellulosic feedstocks; the corn-starch-to-ethanol pathway competes with the cellulose-to-ethanol pathway for ethanol market share (in both low- and high-blend fuel markets). Th e following highlights from Fig. 9 illustrate this competition:
1. Point-of-production-focused incentives scenario (Point of Production Incentive): Under this scenario, growth in demand for biofuels is slight and ethanol remains the major biofuel sold. Th e corn-starch- to-ethanol industry does not face competition from the cellulose-to-ethanol industry and can meet all the ethanol demand.
2. Ethanol-focused incentives scenario (Ethanol Focused): When cellulosic ethanol incentives are high, the industry takes market share away from the corn-starch-to-ethanol industry [Label (a)]. Th is is likely due to more favorable techno-economics for mature cellulose-to-ethanol facilities than for corn-starch-to-ethanol ethanol facilities, and to the competition that corn-starch-to-ethanol industry faces from food and feed markets. Th e cellulose-to-ethanol industry can overcome its initial immaturity and take advantage of its better techno-economics and lower-cost feed-stocks, but the corn-starch-to-ethanol ethanol industry can recover somewhat in the long term because of its maturity (b). Overall growth in the ethanol market is restricted and relies on downstream infrastructure incentives to prevent signifi cant industrial bottlenecks and encourage market penetration.
3. Pathway diversity-focused incentives scenario (Pathway Diversity) and Output-focused incentives scenarios (Output Focused): With incentives, the biomass-to-hydrocarbons pathway can outbid the cellulose-to-eth-anol pathway for cellulosic feedstocks (c). Th is drives up feedstock costs, which gives the corn-starch-to-ethanol industry an advantage over the cellulose-to-ethanol industry and slows industry growth because of the inter-action between higher feedstock cost and the lower path-way maturity reached in the Pathway Diversity scenario. Additionally, unlike ethanol, biomass-to- hydrocarbons
Figure 8 . Growth in number of commercial biorefi neries depends on the annual limit on the number of facility starts.
Published 2014. This article is a U.S. Government work and is in the public domain in the USA. Biofuels, Bioproducts, Biorefining published by John Wiley & Sons, Ltd on behalf of Society of Chemical Industry | Biofuels, Bioprod. Bioref. 9:158–176 (2015); DOI: 10.1002/bbb 173
Modeling and Analysis: Maturation of Biomass-to-Biofuels Conversion Technology Pathways LJ Vimmerstedt et al.
Figure 1 0. Production quantities and shares over time at three levels of ethanol blending.
Figure 9 . Competition between biomass-to-biofuel conversion technology pathways.
level of ethanol in most gasoline from 10% to 15%, but this fuel was approved for model year 2007 and newer light-duty gasoline-fueled vehicles only.37 Specially purposed gas stations and fl exible-fuel vehicles can use the higher ethanol blends known as E85 and blended as high as 85% ethanol by volume with gasoline. Th e market for etha-nol is therefore limited by blending regulation. Because cellulose-to-ethanol production is mature relative to other advanced biofuels pathways, it can respond more rapidly than biomass-to-hydrocarbons pathways, increasing com-mercial development in response to increased demand
fuels are infrastructure compatible and are modeled with unlimited demand and no interference (bottle-necks) from lack of downstream infrastructure.
Ethanol production can increase rapidly enough to meet demand from higher blending proportions, even as demand approaches RFS levels
Most ethanol in the United States is sold as E10. Th e EPA granted a waiver to approve raising the maximum blend

174Published 2014. This article is a U.S. Government work and is in the public domain in the USA. Biofuels, Bioproducts, Biorefining published by John Wiley & Sons, Ltd on behalf of Society of Chemical Industry | Biofuels, Bioprod. Bioref. 9:158–176 (2015); DOI: 10.1002/bbb
LJ Vimmerstedt et al. Modeling and Analysis: Maturation of Biomass-to-Biofuels Conversion Technology Pathways
from a change to a higher blending proportion, as shown in the BSM results in Fig. 10, under diff erent conditions of incentives and annual construction limits.
Incentives could contribute signifi cantly to rapid indus-try growth. Th e results in this article explore such scenar-ios, providing an example of the application of the BSM to the need identifi ed in the modeling review to assess the impacts of incentives.6,7 Th ese results also illustrate the potential for competition between technologies and blend-ing constraints on ethanol production, potentially inform-ing technology investment decisions, the third need from the modeling review.
Conclusions
Th is study illustrates the application of the BSM to four bioenergy modeling analytic needs that were identifi ed in a recent literature review: the need for holistic models that can simulate bioenergy development over time, the need to understand the value of coordinated decisions for bioenergy development, the need to support technology investment decisions, and the need to assess the impacts of incentives.
Reaching RFS levels of biofuels production would require rapid growth in the biofuels industry, including overcoming the current immaturity of some biomass-to-biofuels conversion technology pathways. Rapid industrial growth and maturation of the industry relate through a reinforcing feedback relationship. BSM exploration of this dynamic demonstrated the critical importance of coordinating investments with respect to timing, path-way, and target sector in the biofuels industry. Metrics of incentive eff ectiveness include timing and magnitude of increased production, incentive cost and cost eff ectiveness, and avoidance of windfall profi ts, all of which improve if incentives catalyze learning-by-doing and associated mat-uration of the biofuels industry. Th e BSM analysis locates bottlenecks in the supply chain and identifi es the magni-tude of incentives required to overcome these bottlenecks as modeled.
Potential trade-off s exist between pathway diver-sity (risk mitigation) and direct incentive cost because of uncertainty in maturation and techno-economics. Characteristics of learning, such as its rate and sharing across pathways, can dramatically infl uence pathway com-petition timing and outcomes.
Th e maturation and techno-economics of conversion pathways are uncertain; thus, the magnitudes of pub-lic and private investments that would develop a self- sustaining industry are diffi cult to estimate. It is unknown
how rapidly the industry will mature in response to a given investment, or how eff ective learning-by-doing will be. Th e ultimate possible techno-economic performance is also uncertain. In BSM simulation results, incentives infl uence the maturation of conversion pathways, and can be selected to simulate maturation of a single biomass-to-hydrocarbons pathway or of multiple biomass-to-hydro-carbons pathways. Further analysis would be needed to evaluate the relative risk-adjusted cost of investment in a single pathway versus multiple pathways.
If the biofuels industry grows rapidly, simulation results suggest that the scarcity of biorefi nery construction resources and competition between pathways for feedstock and market share may shape ‒ and sometimes limit ‒ that growth. As modeled and considering current maturity levels, biomass-to-hydrocarbons pathways are less able to respond to rapidly increasing demand in the near-term than are the more-mature cellulose-to-ethanol pathways.
Th e BSM is a detailed system dynamics model of the bio-fuels industry; as such, its simulations document possible system behaviors and ranges of values of incentive cost and production under scenarios that target RFS levels of biofuel use. Th ey also provide insights into system behav-iors that could aid or challenge eff orts to reach these levels of biofuel production.
References 1. US Department of Energy, Bioenergy Technologies Offi ce
Multi-Year Program Plan. [Online] (2013). Available at: http://www1.eere.energy.gov/bioenergy/pdfs/mypp_may_2013.pdf [March 21, 2014].
2. US Congress, Energy Policy Act of 2005. HR 6 EH. U.S. Government Printing Offi ce, Washington, DC (2005).
3. US Environmental Protection Agency, Regulation of Fuels and Fuel Additives: 2013 Renewable Fuel Standards; Final Rule [Online]. Federal Register 78(158):49794–49830. Available at: http://www.gpo.gov/fdsys/pkg/FR-2013-08-15/pdf/2013-19557.pdf [May 14, 2014].
4. US Environmental Protection Agency, “Renewable Fuel Standard Program (RFS2) Regulatory Impact Analysis (EPA-420-R-10-006, February 2010)” - 420r10006.pdf. [Online]. Available at: http://www.epa.gov/otaq/renewablefuels/420r10006.pdf [May 14, 2014].
5. Hanson C, RIN prices climb to new heights. [Online]. Ethanol Producer Magazine – The Latest News and Data About Ethanol Production. Available at: http:// ethanolproducer.com/articles/10083/rin-prices-climb-to-new-heights [September 9, 2013].
6. Mafakheri F and Nasiri F, Modeling of biomass-to-energy sup-ply chain operations: Applications, challenges and research directions. Energ Policy 67:116–126 (2014).
7. Sharma B, Ingalls RG, Jones CL and Khanchi A, Biomass supply chain design and analysis: Basis, overview, modeling, challenges, and future. Renew Sust Energ Rev 24:608–627 (2013).
Published 2014. This article is a U.S. Government work and is in the public domain in the USA. Biofuels, Bioproducts, Biorefining published by John Wiley & Sons, Ltd on behalf of Society of Chemical Industry | Biofuels, Bioprod. Bioref. 9:158–176 (2015); DOI: 10.1002/bbb 175
Modeling and Analysis: Maturation of Biomass-to-Biofuels Conversion Technology Pathways LJ Vimmerstedt et al.
environmental effects of U.S. Biofuel Policy (2011). National Academies Press, Washington, DC, pp. 1 (2011).
24. Newes E, Inman D and Bush B, Understanding the develop-ing cellulosic biofuels industry through dynamic modeling, in Economic Effects of Biofuel Production, ed by Dos Santos Bernardes MA. [Online]. InTech (2011). Available at:
http://www.intechopen.com/books/economic-effects-of-biofuel-production/understanding-the-developing- cellulosic-biofuels-industry-through-dynamic-modeling [September 23, 2013].
25. Junginger M, Sark W, Faaij A eds., Technological Learning in the Energy Sector: Lessons for Policy, Industry and Science. Edward Elgar, Cheltenham, UK and Northampton, MA, pp. 332 (2010).
26. Irwin DA and Klenow PJ, Learning-by-doing spillovers in the semiconductor industry. J Polit Econ 102(6):1200–1227 (1994).
27. Biddy M and Jones S, Catalytic Upgrading of Sugars to Hydrocarbons Technology Pathway. Report No: PNNL-22319, NREL/TP-5100-58055, 1076627. [Online]. National Renewable Energy Laboratory (NREL), Golden, CO (2013). Available at: http://www.osti.gov/servlets/purl/1076627/ [November 13, 2013].
28. Huber GW, Production of liquid alkanes by aqueous-phase processing of biomass-derived carbohydrates. Science 308(5727):1446–1450 (2005).
29. Jones S, Valkenburg C, Walton C, Elliott D, Holladay J, Stevens D et al., Production of Gasoline and Diesel from Biomass Via Fast Pyrolysis, Hydrotreating and Hydrocracking: A Design Case, Report No: PNNL-18284. [Online]. Pacifi c Northwest National Laboratory (PNNL), Richland, WA (2009). Available at: http://www.osti.gov/scitech/biblio/949907 [September 27, 2013].
30. Phillips SD, Tarud JK, Biddy MJ and Dutta A, Gasoline from Wood Via Integrated Gasifi cation, Synthesis, and Methanol-to-Gasoline Technologies. Report No: NREL/TP-5100-47594. [Online]. NREL, Golden, CO (2011). Available at: http://www.osti.gov/scitech/biblio/1004790 [September 27, 2013].
31. Davis R, Biddy MJ, Tan E, Tao L and Jones SB, Biological Conversion of Sugars to Hydrocarbons Technology Pathway, Report No: PNNL-22318. [Online]. Pacifi c Northwest National Laboratory (PNNL), Richland, WA (2013). Available at: http://www.osti.gov/scitech/biblio/1073586 [December 2, 2013].
32. McAloon A, Taylor F, Yee W, Ibsen K and Wooley R, Determining the Cost of Producing Ethanol from Corn Starch and Lignocellulosic Feedstocks. Report No: NREL/TP-580-28893. NREL, Golden, CO, pp. 43 [Online]. (2000). Available at: http://www.nrel.gov/docs/fy01osti/28893.pdf [August 5, 2014].
33. Humbird D, Davis R, Tao L, Kinchin C, Hsu D, Aden A et al., Process Design and Economics for Biochemical Conversion of Lignocellulosic Biomass to Ethanol: Dilute-Acid Pretreatment and Enzymatic Hydrolysis of Corn Stover. Report No: NREL/TP-5100-47764. [Online]. NREL, Golden, CO (2011). Available at: http://www.osti.gov/scitech/biblio/1013269 [September 27, 2013].
34. Dutta A, Talmadge M, Hensley J, Worley M, Dudgeon D, Barton D et al., Process Design and Economics for Conversion of Lignocellulosic Biomass to Ethanol: Thermochemical Pathway by Indirect Gasifi cation and Mixed Alcohol Synthesis. Report No: NREL/TP-5100-51400. [Online ]. NREL, Golden, CO (2011). Available at: http://www.osti.gov/scitech/bib-lio/1015885 [September 27, 2013].
8. An H, Wilhelm WE and Searcy SW, Biofuel and petroleum-based fuel supply chain research: A literature review. Biomass Bioenerg 35(9):3763–3774 (2011).
9. Awudu I and Zhang J, Uncertainties and sustainability concepts in biofuel supply chain management: A review. Renew Sust Energ Rev 16(2):1359–1368 (2012).
10. Berndes G, Hoogwijk M and van den Broek R, The contribu-tion of biomass in the future global energy supply: A review of 17 studies. Biomass Bioenerg 25(1):1–28 (2003).
11. Kouvelis P, Chambers C and Wang H, Supply chain management research and production and operations management: Review, trends, and opportunities. Prod Oper Manage 15(3):449–469 (2006).
12. Bush B, Biomass Scenario Model (BSM) Development & Analysis. [Online]. Annapolis, Maryland (2011). Available at: http://www.obpreview2011.govtools.us/presenters/public/InsecureDownload.aspx?fi lename=WBS_6.2.1.2d_PNNL%20Algae%20Resource%20Assessment%20April%204%202011%20DOE_V8.pdf [June 28, 2013].
13. isee systems, STELLA: Systems thinking for education and research software. [Online]. Available at: http://www. iseesystems.com/softwares/Education/StellaSoftware.aspx [March 21, 2014].
14. Vimmerstedt LJ, Bush B and Peterson S, Ethanol distribution, dispensing, and use: Analysis of a portion of the biomass-to-biofuels supply chain using system dynamics. PLoS ONE 7(5):e35082 (2012).
15. Ruth M, Modeling Dynamic Economic Systems. [Online]. Springer (1997). Available at: http://books.google.com/books?id=gJ2XpTK9pDMC&hl=&source=gbs_api [April 22, 2014].
16. Seuring S and Müller M, From a literature review to a concep-tual framework for sustainable supply chain management. J Clean Prod 16(15):1699–710 (2008).
17. Gold S and Seuring S, Supply chain and logistics issues of bio-energy production. J Clean Prod 19(1):32–42 (2011).
18. Warner E, Inman D, Kunstman B, Bush B, Vimmerstedt L, Peterson S et al., Modeling biofuel expansion effects on land use change dynamics. Environ Res Lett 8 (1):015003 (2013).
19. Bush B, Analysis and Sustainability Review. [Online]. Biomass Scenario Model (BSM) Development & Analysis. Annapolis, MD (2011). Available at: http://www.obpre-view2011.govtools.us/presenters/public/AgendaFullScreen.aspx?conferenceID=2287 [June 28, 2013].
20. Lin Y, Newes E, Bush B, Peterson S and Stright D, Biomass Scenario Model v2.0 Documenation: Data and References. National Renewable Energy Laboratory (NREL), Golden, CO [Online] (2013). Available at: http://www.nrel.gov/docs/fy13osti/57831.pdf [June 26, 2013].
21. Peterson S, Newes E, Inman D, Vimmerstedt L, Hsu D, Peck C, Stright D and Bush B, An Overview of the Biomass Scenario Model. Cambridge, Massachusetts. [Online] (2013). Available at: http://www.systemdynamics.org/confer-ences/2013/proceed/papers/P1352.pdf [July 30, 2014].
22. Vimmerstedt LJ and Bush BW, Effects of Deployment Investment on the Growth of the Biofuels Industry. National Renewable Energy Laboratory; 2013. Report No.: NREL/TP-6A20-60802. [Online]. Available from: http://www.osti.gov/scitech/biblio/1118095 [December 5, 2013].
23. Committee on Economic and Environmental Impacts of Increasing Biofuels Production, National Research Council (US), Renewable fuel standard potential economic and

176Published 2014. This article is a U.S. Government work and is in the public domain in the USA. Biofuels, Bioproducts, Biorefining published by John Wiley & Sons, Ltd on behalf of Society of Chemical Industry | Biofuels, Bioprod. Bioref. 9:158–176 (2015); DOI: 10.1002/bbb
LJ Vimmerstedt et al. Modeling and Analysis: Maturation of Biomass-to-Biofuels Conversion Technology Pathways
Brian W. Bush
Dr. Bush has worked at the National Renewable Energy Laboratory since 2008. His expertise includes energy and infrastructure modeling, simula-tion, and software architecture and de-sign. He has a B.Sc from the California Institute of Technology and a Ph.D. in physics from Yale University.
David Hsu
Dr. Hsu was a senior engineer at the National Renewable Energy Labora-tory from 2007 to 2012. He has a B.Sc in chemical engineering from MIT, a Ph.D. in chemical engineering from the University of California at Berke-ley, and a J.D. from the University of Colorado. He is now a patent attorney
at Kilpatrick Townsend & Stockton.
Daniel Inman
Dr. Inman has worked at the National Renewable Energy Laboratory since 2008. His expertise includes life-cycle modeling of renewable fuels, feedstock production, and biofuel sustainability. He has a B.Sc in environmental science and a M.Sc in soils from the University of Tennessee, and a Ph.D. in soil and
crop science from Colorado State University.
Steven Peterson
Steve Peterson is a principal at Lexidyne, LLC, and lecturer at Thayer School of Engineering, Dartmouth Col-lege. His expertise includes applica-tions of system dynamics principles to complex organizational problems and model development. He has a B.A. in economics from Colorado College
and a M.Sc in resource systems from Thayer School of Engineering.
Laura Vimmerstedt
Laura Vimmerstedt has worked at the National Renewable Energy Labora-tory since 1994. Her areas of expertise include climate change policy analy-sis, energy modeling, and air-quality regulatory analysis. She has a B.A. in chemistry from Oberlin College and a M.Sc in environmental studies from
the University of Wisconsin-Madison.
35. Inman D, Vimmerstedt L, Bush B and Peterson S, Biomass scenario model scenario library: Defi nitions, construction, and description. [Online]. National Renewable Energy Laboratory (NREL), Golden, CO (2014). Available at: http://www.osti.gov/scitech/biblio/1129277 [August 5, 2014].
36. Renewable Fuel Association, Ethanol Industry Overview [Online]. Available at: http://www.ethanolrfa.org/pages/statis-tics [November 13, 2013].
37. US Environmental Protection Agency, E15 (a blend of gaso-line and ethanol) Fuels and Fuel Additives. 21:55:56. [Online]. Available at: http://www.epa.gov/otaq/regs/fuels/additive/e15/index.htm [September 9, 2011].
38. Environmental Protection Agency, Regulation of Fuels and Fuel Additives: 2011 Renewable Fuel Standards; Final Rule. EPA, Washington, DC (2010).