matthias dischinger; nadine riedel: corporate taxes ... · matthias dischinger; nadine riedel:...
TRANSCRIPT

Matthias Dischinger; Nadine Riedel:
Corporate Taxes, Profit Shifting and the Location ofIntangibles within Multinational Firms
Munich Discussion Paper No. 2008-11
Department of EconomicsUniversity of Munich
Volkswirtschaftliche FakultätLudwig-Maximilians-Universität München
Online at http://epub.ub.uni-muenchen.de/4450/
Corporate Taxes, Profit Shifting and the Location of
Intangibles within Multinational Firms
Matthias Dischinger∗
University of Munich
Nadine Riedel†
University of Munich
Version: June 17, 2008
Abstract
Intangible assets are one major source of profit shifting opportunities due
to a highly intransparent transfer pricing process. Our paper argues that
multinational enterprises (MNEs) optimize their profit shifting strategy by
locating shifting–relevant intangible property at affiliates with a low statutory
corporate tax rate. Using panel data for European MNEs and controlling for
unobserved time–constant heterogeneity between affiliates, we find that the
lower a subsidiary’s tax rate relative to other affiliates of the multinational group
the higher is its level of intangible asset investment. This effect is statistically
and economically significant, even after controlling for subsidiary size and
accounting for a dynamic intangible investment pattern.
JEL classification: H25, F23, H26, C33
Keywords: corporate taxation, multinational enterprise, profit shifting, intan-
gible assets, micro level data
∗Seminar for Economic Policy, Department of Economics, University of Munich, Akademiestr. 1/II,
80799 Munich, Germany, phone: +49-89-2180 2279, e-mail: [email protected].
†Department of Economics, University of Munich, Ludwigstr. 28/Vgb./III, 80539 Munich, Ger-
many, phone: +49-89-2180 2874, e-mail: [email protected].
We are grateful to Andreas Haufler and Johannes Rincke for helpful and constructive comments. Fur-
thermore, we would like to thank participants of the Public Economics Seminar and the Research
Workshop Empirical Economics at the University of Munich as well as participants of the 2008 Sum-
mer Symposium of the Oxford University Centre for Business Taxation at the Said Business School.
Financial support by the German Research Foundation (DFG) is gratefully acknowledged.
1
1 Introduction
In recent years, intangible assets have gained increasing importance in the corporate
production process (e.g. Hall, 2001). Since access to financial capital has been sub-
stantially improved, key physical assets are less scarce (Zingales, 2000) and intangible
factors related to product innovation and marketing are increasingly seen as the key
to competitive success (Edmans, 2007). Hence, intangibles like patents, trademarks,
customer lists and copyrights have become major determinants of firm value. This de-
velopment is especially significant in multinational enterprises (MNEs).1 While until
the early 1990ies, MNEs commonly raised little or no fee from their corporate affili-
ates for the use of patents or trademarks, owners of these intangibles have – in line
with updated legal regulations and accounting standards – started to charge for their
immaterial goods and, thus, intangibles–related intra–firm trade has surged.
Since then, an increasing number of anecdotes has reported that MNEs transfer
their valuable intangible property to low–tax jurisdictions. Famous examples are Pfizer,
Bristol–Myers Squibb and Microsoft which have relocated a considerable part of their
research and development (R&D) investments and patents from their home countries to
Ireland (see e.g. Simpson, 2005, on Microsoft’s R&D transfer). Others founded trade-
mark holding companies in tax havens that own and administer the group’s brands
and licenses. E.g. Vodafone’s intangible properties are held by an Irish subsidiary, and
Shell’s central brand management is located at a Swiss affiliate from where it charges
royalties to operating subsidiaries worldwide. Moreover, an increasing number of fi-
nancial consultancies advocates multinational tax planning strategies that imply the
relocation of intangible property to low–tax affiliates.2
Governments and tax authorities have raised increasing concerns about these relo-
cation examples (Hejazi, 2006). Since arm’s length prices for firm–specific intangible
goods are hard to determine (see e.g. Grubert, 2003; Desai et al., 2006), they fear
that MNEs may shift profits from production affiliates in high–tax countries to the
1Empirical evidence links the presence of intangible property to the emergence of MNEs. Intan-
gibles are perceived to foster FDI since they can be easily transferred back and forth and [...] enjoy
a public good nature which makes them available to additional production facilities at relatively low
costs (Markusen, 1995; Gattai, 2005).
2Examples are the British brand valuation consultancy Brand Finance plc whose client list includes
world–wide operating MNEs like British American Tabacco, Danone, Shell or Foster’s (Brand Finance
plc, 2008) and the renowned US law firm Morgan, Lewis & Bockius LLP (Morgan Lewis & Bockius
LLP, 2007).
2

intangibles–holding low–tax affiliate by overstating the true transfer price. Surpris-
ingly though, it has, to the best of our knowledge, not yet been clarified within an
empirical framework whether these relocation examples are individual cases or repre-
sent a systematic multinational investment pattern. We investigate this question using
panel data on European MNEs and find evidence for a statistically significant and
quantitatively relevant bias of intangible property holdings towards affiliates with a
low corporate tax rate.
To receive guidance for the specification of our estimation model, the paper starts out
with a short section on theoretical considerations. Conditional on the assumption that
intra–firm trade of intellectual property rights establishes transfer pricing opportuni-
ties between the intangibles owner and the group’s production affiliates, MNEs have
an incentive to locate their intangibles at a low–tax affiliate since they may thereby
establish transfer pricing channels between this tax haven and all other affiliates lo-
cated in countries with a higher corporate tax rate. In contrast, intangibles location at
one of the group’s high–tax affiliates generates shifting possibilities solely between the
tax haven and the intangibles–holding firm whereas other high–tax affiliates remain
without shifting link to a low–tax country. Moreover, the incentive to shift profits be-
tween affiliates increases in the gains from shifting activities which are reflected by the
statutory corporate tax rate differential between the intangibles–holding subsidiary
and other group locations. The larger these tax rate differentials the larger are the
potential shifting gains. Following this argumentation, we expect that group affiliates
which exhibit a low corporate tax rate relative to other group locations observe a high
level of intangible assets.
We test this hypothesis using a large panel dataset of multinational affiliates within
the EU–25 which is available for the years 1995 to 2005. Our data is drawn from
the micro database AMADEUS that provides detailed accounting information at the
affiliate level and allows identification of a multinational group’s ownership structure.
Following our theoretical considerations, we determine the effect of an affiliate’s average
statutory corporate tax rate difference to other group members on its level of intangi-
ble asset investment. Controlling for unobserved time–constant heterogeneity between
subsidiaries, year effects, country characteristics and affiliate size, the results confirm
our expectations and point to a robust inverse relation between the subsidiary’s statu-
tory tax rate relative to other group affiliates and its intangibles holdings. The effect
is statistically and economically significant and appears across a range of specification
and estimation choices that address endogeneity issues and the dynamic nature of the
intangible asset investment. Quantitatively, the estimations suggest that a decrease
3

in the average tax differential to other group affiliates by 1 percentage point raises a
subsidiary’s intangible property investment by around 1% on average.
This location pattern of intangible assets can moreover be linked to multinational
profit shifting activities. Our theoretical rationalization for the correlation between cor-
porate taxes and intangibles investment implies profit shifting activities to take place
within the whole multinational group. Since most previous empirical studies on multi-
national shifting behavior investigate shifting activities between subsidiaries and their
parent firms only, we study whether pre–tax earnings are equally relocated between
multinational subsidiaries to save tax payments. The results point to significant profit
shifting effects whereas shifting activities between subsidiaries quantitatively even tend
to outweigh shifting activities between parent firms and subsidiaries. In a companion
paper (Dischinger and Riedel, 2007), we moreover employ the same database to pro-
vide empirical evidence that profit shifting activities of MNEs are significantly larger
if shifting–relevant assets are located at low–tax affiliates of the multinational group.
Both aspects support our interpretation that the location of intangible assets is driven
by profit shifting considerations.
The paper adds to the literature on multinational profit shifting and the investment
pattern of MNEs. While the economic literature has brought forward strong evidence
for quantitatively substantial profit shifting activities of MNEs (see e.g. Clausing, 2003;
Devereux, 2006; Huizinga and Laeven, 2008), not much is known yet about which MNEs
actually engage in profit shifting and on the dimension to which MNEs distort their
internal organization and real investments in order to optimize their intra–group profit
shifting possibilities. There are a few exceptions though. Grubert and Slemrod (1998)
and Desai et al. (2006) for example find that parent firms with high intangible asset
investments and henceforth good opportunities to engage in profit shifting activities
via transfer price manipulations are most likely to invest in tax havens. Analogously,
Grubert (2003) shows that R&D intensive MNEs engage in significantly larger volumes
of intra–group transactions and thus create more opportunities for income shifting.
Moreover, Grubert and Mutti (2007) demonstrate that after recent US corporate tax
and accounting reforms, US parents’ R&D investment become a weak predictor for
royalty payments from foreign subsidiaries to the US parent but simultaneously strongly
enlarge the earnings of group affiliates located in tax havens. They interpret their
results to reflect the parents’ incentive to found hybrid entities in tax havens and to
reach favorable cost sharing agreements on R&D investment with them. The hybrids
then sell patent licenses to high–tax production affiliates and receive the corresponding
royalty payments as earnings which are then taxed at the low–tax location.
4

Thus, several existing studies indicate that multinational profit shifting activities are
related to the presence of intangible property holdings. For example, capital investment
in low–tax countries and the dimension of intra–group transactions are linked to an
MNE’s ownership of immaterial assets. Our paper goes one step further and argues
that the location of these intangibles across the subsidiaries of a multinational group
is itself a choice variable of the MNE. To the best of our knowledge, we are the first
to show in a systematic econometric approach that MNEs distort the location of their
shifting–relevant intangibles towards low–tax affiliates in the multinational group to
optimize their profit shifting opportunities.
The remainder of the paper is structured as follows. Section 2 presents a short motiva-
tion of the hypothesis tested in our empirical model. In Section 3, we describe our data
base and the sample construction. Section 4 states the basic estimation methodology.
The estimation results are presented in Section 5. Finally, Section 6 concludes.
2 Profit Shifting and Intangible Asset Location
Our paper’s purpose is to empirically investigate whether corporate taxation distorts
the location of intangible assets within a corporate group to facilitate profit shifting
activities as suggested by growing anecdotic evidence (see Introduction). For a better
understanding, we will in the following shortly sketch the rationale behind the reloca-
tion of intangible property to low–tax countries.
It is widely acknowledged that a large fraction of MNEs in industrialized economies
is horizontally organized with production locations in several countries (e.g. Markusen,
2002). The manufacturing of the final output good thereby often requires a set of
intangible inputs (e.g. patents, brands or management services). For simplicity reasons,
consider a MNE which uses one intangible input good only. The intangible intermediate
is thereby usually created and administered by only one of the multinational affiliates
(cf. footnote 1). Since the intermediate good is traded within the multinational group,
it enables the MNE to shift profits between the intermediate holding affiliate and all
other (production) locations by distorting the intangible good’s intra–firm transfer
price. In line with this argumentation, recent empirical evidence indicates that profit
shifting activities are related to the existence of intangible assets within an MNE (e.g.
Grubert, 2003) since arm’s length prices for firm–specific intellectual property rights
are especially hard to determine for national tax authorities.
Thus, immaterial goods enhance the MNE’s profit shifting possibilities. In addition,
5

the location of these intangibles across affiliates is itself a choice variable for the MNE
and can further improve the group’s shifting opportunities. Therefore, the MNE can
decide at which of the corporate affiliates intangible investments should be located.
Among others, corporate taxes and profit shifting considerations plausibly matter for
this decision. Intuitively, holding intangibles at a low–tax affiliate generates a profit
shifting link between the intangibles–holding tax haven affiliate and all other group
members. Thus, profit may be shifted from each high–tax affiliate to the intangibles–
holding company in the low–tax country. In contrast, if the intangibles were located
at one of the high–tax affiliates, the MNE would gain only one profit shifting link to
the tax haven affiliate while all other affiliates in high–tax countries would lack shifting
opportunities to a low–tax country. Obviously, this provides a strong incentive to locate
intangible assets at affiliates with a relatively low corporate tax rate.3
In addition, it is well known that the gains from shifting profits between affiliates of a
multinational group are determined by the difference between their statutory corporate
tax rates. The larger this difference the more the MNE profits from relocating one unit
of earnings from the high–tax to the low–tax affiliate. This implies that the location of
intangible assets becomes more attractive the lower an affiliate’s tax rate compared to
other locations of the same multinational group.
Following these considerations, MNEs thus have an incentive to locate intangible
property at affiliates with a relatively small corporate tax rate compared to other group
locations which is in line with recent examples of multinational intangibles relocations
to low–tax countries.
3In the simultaneous case of an extreme earnings distribution across affiliates and several sub-
sidiaries being located in low–tax countries, scenarios can be constructed in which it might pay for the
MNE to locate its intangibles at a high–tax affiliate (with large earnings) and shift profits from there
to several low–tax locations. However, even under this specific scenario we do not consider intangibles
location at a high–tax country to be a very likely outcome. Tax authorities’ screening intensity in
most OECD countries depends on an affiliate’s declared pre–tax profit (most authorities employ the
so–called transaction based net margin method which compares the net margin of a respective affiliate
to the net margin of similar (non–affiliated) firms of the same branch). Formally, this is captured by
tax evasion models in the tradition of Reinganum and Wilde (1985). Shifting larger amounts of profit
via several channels to low–tax affiliates would imply a drastic reduction in the intangibles–holding
affiliate’s declared profit. This would surge the MNE’s detection risk for the shifting activities and tend
to make enhanced shifting volumes and consequently the intangibles location at a high–tax affiliate
unattractive.
6

3 Data Set
Our empirical analysis employs the commercial database AMADEUS which is com-
piled by Bureau van Dijk. The version of the database available to us contains detailed
information on firm structure and accounting of 1.6 million national and multinational
corporations in 38 European countries from 1993 to 2006, but is unbalanced in struc-
ture.4 We focus on the EU–25 and on the time period of 1995 – 2005 as these coun-
tries and years are sufficiently represented by the database. The observational units
of our analysis are multinational subsidiaries within the EU–25.5 Since our analysis
also requires data on the subsidiary’s parent company (e.g. the number and location of
the parent’s subsidiaries), we investigate only subsidiaries whose parents are likewise
located within the EU–25 and on which information is available in the AMADEUS
database.
Moreover, our analysis accounts only for subsidiaries whose foreign parent is an
industrial corporation and owns at least three subsidiaries (by more than 90% of the
ownership shares). The latter assumption ensures that the MNEs in our sample exhibit
a sufficient size so that strategical allocation of intangibles for profit shifting purposes
may emerge. In addition, we restrict the sample to multinational groups that actually
own immaterial assets, i.e. either the parent or at least one of its subsidiaries has to
hold intangibles. Last, we drop MNEs which observe a negative profit at all group
affiliates throughout the sample period since they are then not subject to positive tax
payments and profit shifting considerations are henceforth irrelevant.
Our sample contains firms from all EU–25 countries despite Cyprus and Malta. The
country statistics are presented in Table 1 of the Appendix. The intangibles measure
is the balance sheet item intangible fixed assets.6 Since many firms in the database
report no information on this variable, our panel data consists of 45,575 observations
from 6,732 multinational subsidiaries for the years 1995 – 2005. Hence, we observe each
4Note that tax authorities (e.g. Germany and France) and tax consultants (e.g. Deloitte Touche
Tohmatsu) are equally known to rely on the AMADEUS database to apply the transaction based net
margin method (cf. footnote 3).
5Our criteria of being a multinational enterprise is the existence of a foreign immediate shareholder
(parent) which holds at least 90% of the affiliate’s ownership shares. The data restriction to firms
which are owned by 90% or more ensures that the potential location of profit and intangibles at this
subsidiary is relevant for the multinational group.
6All balance sheet and profit & loss account items in our analysis are exported from AMADEUS
in unconsolidated values.
7

affiliate for 6.8 years on average.
The AMADEUS data has the drawback that information on the ownership structure
is available for the last reported date only which is the year 2004 for most observations
in our sample. Thus, in the context of our panel study, there exists some scope for
misclassifications of parent–subsidiary–connections since the ownership structure may
have changed over the sample period. However, in line with previous studies, we are not
too concerned about this issue since the described misclassifications introduce noise to
our estimations that will bias our results towards zero (see e.g. Budd et al., 2005).
Table 2 in the appendix displays the sample statistics. The mean of the intangible
asset variable is calculated with 3.4 million US dollars at the subsidiary level (however
with a huge standard deviation of 117 million) and with 64.8 million at the parent level
(again with a large standard deviation of 785 million). We moreover define a variable
binary intangible assets which takes on the value 1 if a subsidiary owns intangible assets
and 0 otherwise. The sample average is measured to be 0.5519 and hence 55.2% of the
subsidiaries in our sample hold intangible property. In addition, the affiliates in our data
belong to multinational groups with on average 81.4 subsidiaries that are owned by at
least 90% of the ownership shares. This rather high mean value is thereby driven by a
few very large MNEs, as the median of the subsidiary number distribution is calculated
with 26. Furthermore, on average, a subsidiary holds total assets amounting to 105.2
million US dollars and fixed assets of 62.5 million, employs 220 workers, observes an
operating revenue of 82.2 million US dollars and earns a profit/loss before taxation of
3.5 million US dollars.
We additionally merge data on the statutory corporate tax rate at the subsidiary
and parent location, as well as basic country characteristics like GDP per capita (as
a proxy for the degree of development), population (as a proxy for the market size)
and the unemployment rate (as a proxy for the economic situation of a country).7 For
the affiliates in our sample, the statutory corporate tax rate spreads from 10.0% to
56.8% whereas the mean is calculated with 33.3% on the subsidiary level and with
36.2% on the parent level. Our theoretical considerations presuppose that the level of
intangible assets is inversely related to an affiliate’s corporate tax rate relative to other
group members. We therefore define the average tax difference to all other affiliates
7The statutory tax rate data for the EU–25 is taken from the European Commission (2006). Our
analysis will moreover rely on tax rates for group affiliates outside the EU as will be explained below.
This data is obtained from the tax consultancy firm KPMG International (2006). Country data for
GDP per capita, population size and unemployment rate are taken from the European Statistical
Office (Eurostat).
8
which is the unweighted average statutory corporate tax rate difference between a
subsidiary and all other affiliates of the corporate group (including the parent) that
are owned by at least 90% of the ownership shares. This tax difference spreads from
-38.2% to 28.7% with a mean of -0.7%. Although our subsidiary sample comprises
European firms only, the calculation of the average tax difference to all other affiliates
accounts for information on the worldwide structure of the corporate group which is
generally available with the AMADEUS data. However, for non–European subsidiaries,
mostly this information comprises only the subsidiaries’ names, hosting countries and
ownership shares but no accounting information. Therefore, an appropriate weighting
procedure for our tax difference variable is not feasible and we employ an unweighted
average tax measure.8
Last, the descriptive statistics strongly confirm the increasing importance of intan-
gible property in corporate production over the last decade. Figures 1 and 2 in the
Appendix report the average level of intangible asset investment at subsidiaries and
parents in our sample between 1995 and 2005. While the average parent firm owns
substantially more intangible property than the average subsidiary, the mean value
steeply rises for all affiliates which is in line with previous findings in the literature
(e.g. Hall, 2001).
4 Econometric Approach
We employ different methodological approaches to test the hypothesis formulated in
Section 2. The following paragraphs present our baseline model as well as various
robustness checks that account for alternative specifications, endogeneity issues and a
dynamic model of intangible asset investment.
8We experimented with size–weighted equivalents of this average tax difference variable. Since the
application of a weighting scheme is only sensible if we observe information on the subsidiaries’ size
variable for all or at least the vast majority of the group affiliates, this leads to a drastic reduction
in sample size as the information on affiliate accounts is often not available for as sufficient number
of group subsidiaries. Nevertheless, we found the application of weighted tax measures to lead to
qualitatively comparable results which are available from the authors upon request.
9

4.1 Baseline Model
In our baseline regression, we estimate an OLS model of the following form
log(yit) = β1 + β2τit + β3Xit + ρt + φi + εit (1)
with yit =(intangible assets +1). Since the distribution of intangible asset investment
of subsidiary i at time t is considerably skewed, we employ the logarithm of intangible
assets as dependent variable. Furthermore, a considerable fraction (44.8%) of the sub-
sidiaries in our dataset does not hold any intangible assets at all and thus, we follow
previous studies (e.g. Plassmann and Tideman, 2001; Alesina et al., 2002; Hilary and
Lennox, 2005; Weichenrieder, 2008) and add a small constant (= 1) to our intangi-
bles variable to avoid that zero–observations are excluded from the estimation. The
explanatory variable of central interest is τit which stands for the average tax difference
to all other affiliates of subsidiary i at time t, as defined in Section 3. According to
our considerations in Section 2, we expect that the investment in intangible property
decreases in the subsidiary’s tax rate relative to other group affiliates and thus β2 < 0.
Moreover, Xit comprises a vector of time–varying country control characteristics like
GDP per capita, population size and the unemployment rate. These macro controls
are included to ensure that the results are not driven by an unobserved correlation be-
tween a country’s wealth, market size and economic situation (as proxied by the above
variables) with corporate taxes and intangible investment. The variables will enter in
logarithmic form although this is neither qualitatively nor quantitatively decisive for
our results. Furthermore, a full set of year dummies ρt is included to capture shocks
over time common to all subsidiaries. εit describes the error term. We add subsidiary
fixed effects to control for non–observable, time–constant firm–specific characteristics
φi. Using fixed–effects is reasonable and necessary in our analysis since a firm’s sta-
tus of holding intangible assets vs. non–holding intangibles is likely to be driven by
internal firm–specific factors which are impossible to be captured by observable con-
trol variables available in our data set. The fixed–effects model is also preferred to a
random–effects approach by a Hausman–Test.
Starting from this baseline approach, we investigate the sensitivity of our results to
alternative model specifications.
10
4.2 Robustness Check I: Binary Dependent Variable
In a first sensitivity check, we take into account that 44.8% of the subsidiaries in
our data do not exhibit any intangible property holdings at all. This data structure
indicates it to be a relevant multinational choice whether or not to locate intangible
property at an affiliate at all and that a binary choice model might fit the data well.
Thus, the sensitivity check comprises a model of the following form
bit = γ1 + γ2τit + γ3Xit + ρt + φi + vit (2)
whereas bit represents the binary intangible assets variable that takes on the value
1 if a subsidiary owns intangible property and the value 0 otherwise. The explana-
tory variables are specified analogously to equation (1). Again the regression includes
time–constant affiliate fixed effects and year dummies. In a first step, we determine
the coefficient estimates for equation (2) based on maximum–likelihood techniques by
estimating a fixed–effect logit model. The model thereby critically relies on the as-
sumption that the error term vit follows a logistic distribution. As an additional check
to our results, we thus reestimate equation (2) in a linear probability framework based
on the standard OLS assumptions.
4.3 Robustness Check II: Size Control
In a second sensitivity check, we extend our baseline estimation and additionally con-
trol for affiliate size. Conditioning intangible asset investments on affiliate size may
be decisive since otherwise our tax measure might reflect the widely–tested negative
impact of corporate taxation on subsidiary size only. It is well–known that low cor-
porate tax rates foster affiliate investment and vice versa. If large affiliates also tend
to hold high investments in intangible property, the corporate tax effect determined
in our baseline estimation may be contaminated by the underlying negative relation
between corporate taxes and affiliate size.
To circumvent this issue, we include the subsidiary’s total capital investment as con-
trol variable.9 This may, however, give rise to obvious reverse causality problems since
intangible assets may well determine an affiliate’s volume of total capital investment.
We therefore employ the levels estimator proposed by Anderson and Hsiao (1982) which
suggests to control for time constant affiliate effects by taking the first differences of
9Our results are robust against the use of alternative proxies for subsidiary size, e.g. the subsidiaries’
operating revenue.
11
the estimation equation and to instrument for the difference in the endogenous vari-
able (here: total assets) by employing lagged levels of this variable.10 Thus, we use a
two-stage instrumental variables approach (2SLS) to estimate the following model
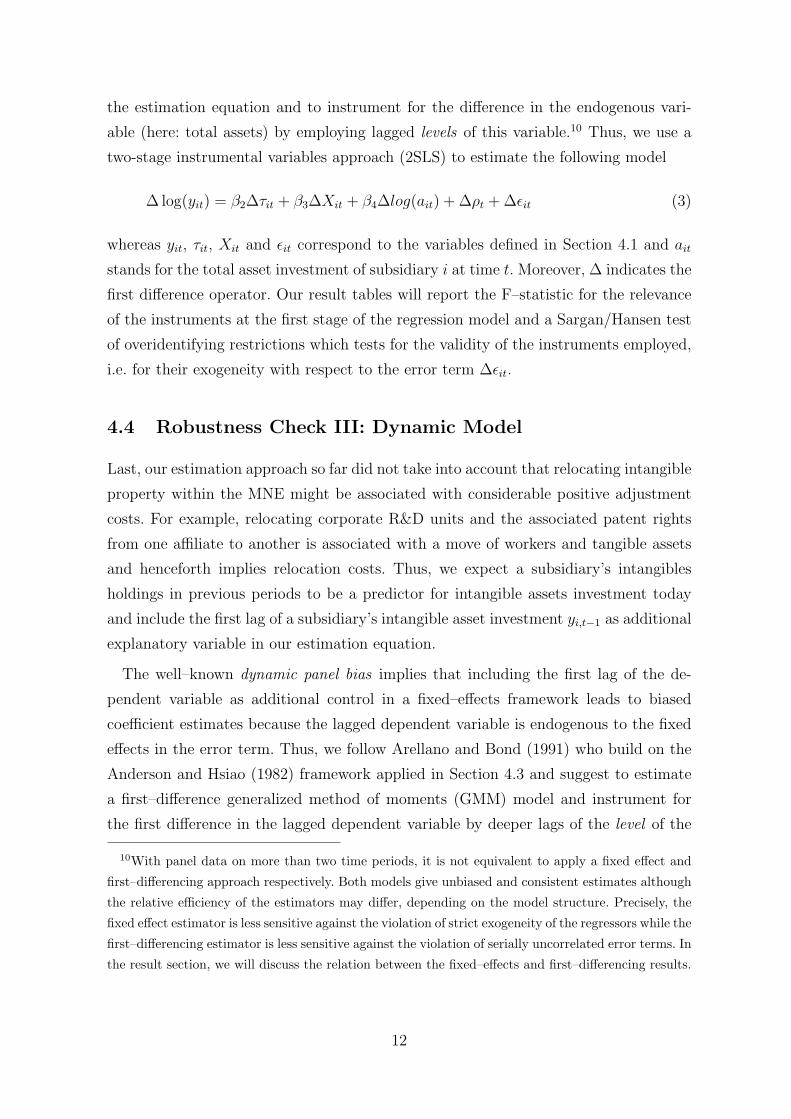
∆ log(yit) = β2∆τit + β3∆Xit + β4∆log(ait) + ∆ρt + ∆εit (3)
whereas yit, τit, Xit and εit correspond to the variables defined in Section 4.1 and ait
stands for the total asset investment of subsidiary i at time t. Moreover, ∆ indicates the
first difference operator. Our result tables will report the F–statistic for the relevance
of the instruments at the first stage of the regression model and a Sargan/Hansen test
of overidentifying restrictions which tests for the validity of the instruments employed,
i.e. for their exogeneity with respect to the error term ∆εit.
4.4 Robustness Check III: Dynamic Model
Last, our estimation approach so far did not take into account that relocating intangible
property within the MNE might be associated with considerable positive adjustment
costs. For example, relocating corporate R&D units and the associated patent rights
from one affiliate to another is associated with a move of workers and tangible assets
and henceforth implies relocation costs. Thus, we expect a subsidiary’s intangibles
holdings in previous periods to be a predictor for intangible assets investment today
and include the first lag of a subsidiary’s intangible asset investment yi,t−1 as additional
explanatory variable in our estimation equation.
The well–known dynamic panel bias implies that including the first lag of the de-
pendent variable as additional control in a fixed–effects framework leads to biased
coefficient estimates because the lagged dependent variable is endogenous to the fixed
effects in the error term. Thus, we follow Arellano and Bond (1991) who build on the
Anderson and Hsiao (1982) framework applied in Section 4.3 and suggest to estimate
a first–difference generalized method of moments (GMM) model and instrument for
the first difference in the lagged dependent variable by deeper lags of the level of the
10With panel data on more than two time periods, it is not equivalent to apply a fixed effect and
first–differencing approach respectively. Both models give unbiased and consistent estimates although
the relative efficiency of the estimators may differ, depending on the model structure. Precisely, the
fixed effect estimator is less sensitive against the violation of strict exogeneity of the regressors while the
first–differencing estimator is less sensitive against the violation of serially uncorrelated error terms. In
the result section, we will discuss the relation between the fixed–effects and first–differencing results.
12

dependent variable.11 The estimation equation then takes on the following form
∆ log(yit) = β1∆ log(yi,t−1) + β2∆τit + β3∆Xit + β4∆log(ait) + ∆ρt + ∆εit. (4)
The variable definitions correspond to the ones in previous sections. Because the model
is estimated in first–differences, the equation will be characterized by the presence of
first–order serial correlation. However, the validity of the GMM estimator relies on
the absence of second–order serial correlation. The Arellano and Bond (1991) tests
for second–order serial correlation will be reported at the bottom of the result tables.
Again, we check for the exogeneity of the instrument set by employing a Sargan/Hansen
test.
5 Empirical Results
This section presents our empirical results. Throughout all regressions, the observa-
tional units of our analysis are the multinational subsidiaries as explained in Sections
3 and 4. Additionally, in all upcoming estimations, a full set of year dummy variables
is included and heteroscedasticity robust standard errors adjusted for firm clusters are
calculated and displayed in the tables in parentheses. Section 4.1 presents our baseline
results. Section 5.2 displays the results to our robustness checks. Finally, Section 5.3
discusses the link between our evidence and profit shifting activities within MNEs.
5.1 Baseline Estimation
Table 3 in the appendix presents our baseline estimation. Following the methodology
described in Section 4, specification (1) regresses the logarithm of a subsidiary’s in-
tangible asset investment on the firm’s statutory corporate tax rate, while controlling
for fixed firm and year effects. In line with our theoretical considerations, we find a
statistically significant negative influence that suggests high corporate tax rates at an
affiliate to be associated with low intangible asset investment and vice versa. The ef-
fect is robust against the inclusion of time–varying country control characteristics in
specification (2).
However, the subsidiaries’ statutory tax rate may be an imprecise measure for tax
incentives on intangible asset location since our hypothesis predicts intangibles to be
11Note that the difference in the lagged dependent variable correlates with the differenced error
term. However, deeper lags (starting from the second lag) of the dependent variable (in levels) are
available as valid instruments as they are orthogonal to the error term.
13
located in countries with a low tax rate relative to all other affiliates of the corporate
group. This is accounted for in specifications (3) and (4) which regress the level of in-
tangible assets on the average tax difference to all other affiliates. The results indicate
that the average statutory corporate tax rate difference between a subsidiary and other
group members exerts a highly significant negative impact on the subsidiary’s intan-
gibles holdings. Quantitatively, the estimations suggest that a decrease in the average
tax difference to all other affiliates by 1 percentage point raises the subsidiary’s level
of intangible assets by 1.6% (cf. column (4)).
5.2 Robustness Checks
As a first test for robustness, we rerun all our specifications with the additional inclusion
of a full set of 110 one–digit NACE code industry–year dummies (not reported). This
add–on does not change any of our qualitative and quantitative results.
In another general sensitivity check we reestimate our regression model employing
the statutory corporate tax rate difference between a subsidiary and its parent as ex-
planatory variable (instead of the average tax difference to all other group affiliates,
including the parent). It might be interesting to explain subsidiary intangible invest-
ment by comparing tax rates at the parent and the subsidiary level since a large fraction
of intangible property is still held by parent firms (see Figures 1 and 2) and corporate
structures indicate the parents to be the traditional owners and administrators of in-
tangibles since they usually host the MNEs’ central management and administration
departments. Therefore, regressing intangible asset investment on the tax difference to
the parent captures the incentive to relocate intangibles from the parent to the con-
sidered subsidiary for tax purposes. We hence reestimate all specifications presented
in this paper (including the upcoming robustness checks) using the tax difference to
the parent as the relevant tax measure. This modification leads to the same qualitative
results as the model accounting for the tax structure of the whole MNE.12
5.2.1 Binary Dependent Variable
In a second step, we estimate equation (2) and thus focus on the binary multinational
choice whether to locate intangible property at a certain affiliate or not. The results are
displayed in Table 4. Specifications (1) and (2) thereby present maximum–likelihood
estimations of a fixed–effect logit model. The dependent variable is the binary intangible
12The results are available from the authors upon request.
14
assets measure defined above. Since the logit estimation controls for subsidiary fixed
effects, many subsidiaries drop out of the estimation since they observe no variation
in the status of intangibles–holding vs. non–holding during the observation period.
Nevertheless, the estimations still comprises an adequate number of about 2, 200 firms
for which information is available for 7.5 years on average.
In specification (1), we regress the binary variable on the subsidiary’s statutory tax
rate. The coefficient estimate is negative and highly significant and thus confirms the
presumption that a subsidiary’s probability of holding intangible property decreases in
the location’s statutory tax rate. Moreover, specification (2) reestimates the relation
using the average tax difference to all other affiliates as explanatory tax variable. Again,
we find a negative effect on intangibles holdings which is statistically significant at the
5% level. Thus, the lower a subsidiary’s statutory corporate tax rate compared to all
other affiliates of the same multinational group (including the parent), the higher is its
probability of holding intangible assets.13
Nevertheless, the estimation of the fixed–effect logit model critically depends on the
assumption of a logistic distribution of the error term. Thus, as a sensitivity check,
we moreover estimate a linear probability model with subsidiary fixed effects. The
application of an OLS framework thereby has the additional advantage that we make
use of all information in our dataset and do not preclude the sample to subsidiaries
which observe a change over the sample period in the status of intangibles–holding
vs. non–holding. The results are displayed in specifications (3) and (4) of Table 4 and
are qualitatively equal to the results of the logit model. Ceteris paribus, a reduction
of the unweighted average tax difference to all other affiliates by 10 percentage points
is suggested to rise the subsidiary’s probability of holding intangible assets by 1.97
percentage points on average (cf. column (4)). As the mean probability of holding
intangibles is 55.2%, this corresponds to an average increase of 3.6%.
5.2.2 Control for Subsidiary Size
As a third robustness check, we will determine whether our estimated corporate tax
effect on intangible asset investment is robust against the inclusion of a control variable
for subsidiary size. Precisely, we will condition the intangible property holdings on the
subsidiary’s total capital investment. To account for potential reverse causality with
13The coefficient estimates of a logit estimation cannot be interpreted quantitatively. Moreover,
applying a logit model with fixed effects makes the calculation of marginal effects impracticable as it
requires specifying a distribution for the fixed effects.
15
respect to total and intangible investment levels as described in Section 4.3, we estimate
the equation in first differences and employ the lagged levels of total investment as
instruments for the current difference in total asset (Anderson and Hsiao, 1982).
To do so, we first compare the coefficient estimates from a first–differencing approach
to the fixed effects model and reestimate specifications (2) and (4) of Table 3 using
first differences instead of fixed effects. The results are displayed in columns (1) and (2)
of Table 5. While the qualitative effect of both, the statutory tax rate and the average
tax difference to all other affiliates, on the level of intangible asset investment remains
unchanged, the coefficient estimates are substantially smaller than for the fixed effect
regressions. Precisely, the estimates drop by around 50% in absolute terms to −1.17
and −0.92, respectively. Since we consider unobserved heterogeneity in the subsidiary
characteristics to be a major issue in our regression context, we generally presume the
fixed effects approach to deliver the more efficient estimates. Nevertheless, since the
qualitative results are independent of the model employed and first–differencing delivers
smaller coefficient estimates than the fixed effect approach, we feel confident that a
qualitative and quantitative interpretation of the first–differencing model’s coefficient
estimates (as a lower bound) is valid.
In specifications (3) and (4), we add the level of a subsidiary’s total assets as size
control whereas we treat the variable as exogenous with respect to the error term. The
inclusion of this additional control leaves the coefficient estimates of our tax variables
quantitatively almost unaffected and indicates that the estimated tax effects on in-
tangible asset investment are not contaminated by an underlying correlation between
corporate taxes and affiliate size. The coefficient estimate of total assets is positive and
statistically significant suggesting that larger affiliates tend to hold more intangible
property. However, the specifications do not control for potential reverse causality and
henceforth the coefficient estimates may clearly be biased.
In specifications (5) and (6), we address this endogeneity problem and instrument the
first difference of total assets with lagged levels of the variable.14 This modification of
the estimation model only slightly affects the coefficient estimates for our tax measures
which remain statistically significant. Interestingly though, instrumenting for total as-
set investments erases the positive effect of affiliate size on intangible asset holdings
now suggesting that intangible asset investment is independent of affiliate size. More-
14Precisely, we employ the second to fourth lag of the logarithm of total asset investment as in-
struments. We consider this to be an appropriate model specification since with the Anderson and
Hsiao (1982) estimator, the gained information from including additional lags as instruments has to
be weighted against the loss in sample size due to missing values implied by including additional lags.
16
over, the usual test statistics claim our specification to be valid since the F–test for
the instruments at the first stage is highly significant indicating our instruments to
be relevant. Furthermore, the null–hypothesis of the Sargan/Hansen test is accepted
stating that the instruments are uncorrelated with the error term and henceforth valid.
5.2.3 Dynamic Estimation
As a last sensitivity check, we determine the relation between corporate taxes and
intangible asset investment in a dynamic model as explained in Section 4.4 which ad-
ditionally accounts for positive adjustment and relocation costs of intangible property.
Employing the one–step linear GMM estimator in first differences proposed by Arel-
lano and Bond (1991), we confirm the dynamic nature of intangible asset investment
as lagged intangible property holdings indeed show a significant impact on current
intangibles investments.
Our corporate tax effects on intangible asset investment are, however, almost unaf-
fected by the inclusion of the lagged dependent variable and quantitatively correspond
to the estimations in the non–dynamic case presented in Table 5. Specifications (1)
and (2) of Table 6 document a negative and significant effect of the subsidiary’s statu-
tory corporate tax rate and the tax difference variable on intangible asset investment.
Following Arellano and Bond (1991) we instrument the endogenous differenced lag of
intangible assets investments with the second and all deeper lags of the level of intan-
gible assets as explained in Section 4.4.15 In specification (3) and (4), we again include
subsidiary total asset investment as size control whereas, likewise, we treat the variable
as endogenous and thus also instrument it with the second and all deeper lags of its
level. The results show the same picture as the previous subsection. While the coeffi-
cient estimates for the corporate tax measures are unaffected by the inclusion of the
size control and remain statistically significant and of quantitatively relevant size, the
total asset variable itself does not exert any statistically significant effect on intangible
asset holdings. In specification (5) and (6), we additionally include the second lag of
15Note that with the Arellano and Bond (1991) estimator, we do not face the trade–off of the
Anderson and Hsiao (1982) estimator that the gained information from including additional lags as
instruments has to be weighted against the loss in sample size due to missing values. This applies since
the Arellano and Bond (1991) methodology sets missing values to 0 and still derives a meaningful set
of moments conditions. Nevertheless, we additionally reestimated the specifications of Table 6 in an
Anderson and Hsiao (1982) framework and found qualitative and quantitative comparable results.
Here, the F–statistic of the first–stage regression also indicates a strong relevance of our instrument
set used.
17
the intangible asset variable to control for a deeper dynamic effect. This second lag
shows no significant effect on intangible investment and does not affect our qualitative
tax result.
Summing up, the lower the statutory corporate tax rate of a subsidiary relative to
all other affiliates of the multinational group, the higher is its level of intangible as-
sets. Moreover, the test statistics confirm our specification to be valid. The Arellano
and Bond (1991) test accepts the null–hypothesis that there is no second order auto-
correlation in the error term and likewise the Sargan/Hansen test of overidentifying
restrictions accepts the null–hypothesis that the set of instruments is exogenous to the
error term.
5.3 Link to Profit Shifting
The previous subsections presented evidence that intangible assets are distorted to-
wards affiliates with a low corporate tax rate. Our theoretical motivation predicts this
distortion to root in the optimization of profit shifting opportunities within the multi-
national group. Thus, in the next paragraph, we will discuss to what extend our results
can indeed be linked to profit shifting activities of MNEs.
First, relocation of intangible property to low–tax countries for profit shifting pur-
poses directly implies that profit is shifted within the whole multinational group and
profit relocation is not restricted to the parent–subsidiary–channel. Since empirical evi-
dence on profit shifting has so far, however, largely focus on the investigation of shifting
between parent firms and their subsidiaries (see e.g. Collins et al., 1998, or Dischinger,
2007), we determine to what extent profit shifting activities take place within the whole
multinational group. Methodologically, we follow the standard approach and give indi-
rect evidence on profit shifting activities by regressing the subsidiary’s unconsolidated
pre–tax profit on a tax measure that captures the profit shifting incentives. Simulta-
neously, the regressions control for the number of employees (as a proxy for labor),
the level of fixed assets (as a proxy for capital) and hosting country characteristics
whereas all firm variables are calculated per operating revenue (sales) to control for
economies of scale and are transformed in logarithmic form.16 The estimation results
16Following the existing empirical literature, we restrict our analysis to subsidiaries with a positive
profit by estimating the equation in logarithmic form. Therefore, and due to a limited availability of
the required firm variables, the sample size shrinks to about 24,000 observations. In line with previous
papers, the estimations do not explicitly control for potential reverse causality problems between the
input factors and affiliate profitability. Robustness checks on this assumption did, however, turn out
18
are presented in Table 7 in the Appendix.
The regressions employ three tax measures to absorb profit shifting activities: the
subsidiary’s statutory tax rate in regressions (1) and (2), the tax difference to (the)
parent (to capture profit shifting incentives between subsidiary and parent firm) in
regressions (3) and (4), and the average tax difference to all other affiliates (to cap-
ture profit shifting incentives within the whole MNE) in regressions (5) and (6).17 In
all specifications, the coefficient estimates for the tax measures exhibit the expected
negative sign and are statistically significant at the 1% level. Thus, subsidiaries with
a low tax rate (compared to the parent firm and to all other group affiliates, respec-
tively) tend to observe a higher pre–tax profitability which provides indirect evidence
for profit shifting activities. Applying our preferred shifting measure, the average tax
difference to all other affiliates, thereby yields a more than twofold larger coefficient
estimate than the tax difference to parent. This suggests that profit shifting activities
indeed take place within the whole multinational group and are not restricted to the
parent–subsidiary channel.
However, this evidence does, strictly speaking, not provide a clear–cut link between
intangibles location and shifting activities. To do so requires a rather complex analysis
that investigates whether MNEs with a high fraction of intangible assets at low–tax
affiliates indeed exhibit larger profit shifting volumes. But, since the affiliates’ intangi-
bles holdings are endogenous and correlated with the tax differentials, a proper analysis
goes beyond the scope of our work and is referred to a companion paper (Dischinger
and Riedel, 2007).18
to have no significant effect on our results.
17A recent paper by Huizinga and Laeven (2008) equally uses the average tax difference to other
affiliates to test for profit shifting activities within the MNE. The authors find comparable results.
18In Dischinger and Riedel (2007), we handle the endogeneity problem by exploiting the observation
that parent firms tend to be a major location for shifting–relevant intangible assets. Precisely, they
exhibit an over–proportional fraction of the group’s intangible assets (see Figures 1 and 2) and usually
likewise comprise central management and administration units that provide services for affiliates of
the whole multinational group. Headquarters are moreover largely immobile in an international context
and usually remain in the country where the corporation was originally founded. Thus, the parent
location may be considered exogenous. In line with our theoretical presumptions, the paper finds that
profit shifting activities are significantly larger if the multinational headquarters, and thus a high
fraction of shifting–relevant assets, are located in a low–tax country.
19

6 Conclusions
The last years have witnessed an increasing importance of intangible assets (patents,
copyrights, brands, etc.) in the corporate production process of MNEs (see Figures 1
and 2). Anecdotal evidence thereby suggests that these intangibles are often located
at low–tax affiliates. For example, Nestle, Vodafone and British American Tabacco
have created brand management units in countries with a relatively low corporate
tax rate that charge royalties to operating subsidiaries worldwide. Since intangible
assets are often firm–specific goods, arm’s length prices can hardly be determined by
national tax authorities and, henceforth, MNEs may overstate the transfer price for the
intermediate immaterial good and thus shift profits from high–tax production affiliates
to the intangibles–holding affiliate in the low–tax country.
To the best of our knowledge, our paper provides the first systematic empirical
evidence that the location of intangible assets within MNEs is indeed distorted towards
low–tax affiliates. Based on a rich data set for European MNEs during the years 1995
to 2005, we show that the lower the statutory corporate tax rate of a subsidiary relative
to all other affiliates of the multinational group, the higher is the level of intangible
assets at this location. This result turns out to be robust against various specifications
and robustness checks. Thus, the evidence suggests that MNEs exploit the enhanced
importance of intellectual property in the production process by distorting its location
within the corporate group to optimize their tax planning strategies.
These behavioral adjustments have profound consequences for international corpo-
rate tax competition. First, the relocation of intangible assets to tax havens facilitates
income shifting and enlarges the streams of multinational profit transferred to countries
with a low tax rate. This increases the governmental incentive to lower its corporate
tax rate and aggravates the race–to–the–bottom in corporate taxes. Second, it is im-
portant to stress that the creation and administration of intangible assets is related
to real corporate activity. To relocate patents and trademark rights to low–tax coun-
tries, MNEs have to transfer part of their R&D departments and their administration
and marketing units with them. Obviously, these multinational service units comprise
high–skilled workers who represent part of the decisive corporate human capital (see
e.g. Bresnahan et al., 2002). Thus, countries which attract intangible investment by
lowering their corporate tax rate do not only gain shifty pre–tax profits but may also
win additional jobs and knowledge capital that may spill over and increase the produc-
tivity of local firms. According to this, the gains from lowering the corporate tax rate
surge along a second line and enforce tax competition behavior.
20

Currently, the regulations on intangibles relocation within MNEs are rather lax in
many OECD countries. For example, rules with respect to cost sharing agreements
between multinational affiliates are favorable in the US (see Grubert and Mutti, 2007)
and thus tend to foster the shift of patent rights from US multinational R&D depart-
ments to R&D units at low–tax affiliates.19 Our results thus suggest that profit shifting
activities may be effectively restricted by implementing adequate multilateral regula-
tions for the transfer of intangible assets within the MNE – analogously to e.g. the
OECD guidelines on transfer pricing that regulate prices for intra–firm trade to be set
according to the arm’s length principle. First unilateral attempts to restrict intangible
asset relocations within MNEs were brought forward by the German government which
currently promotes a major tax reform. In the course of the reform, it is planed that a
considerable fraction of future earnings streams of (intangible) assets originally devel-
oped in Germany and transferred to foreign affiliates at a later point in time remain
to be taxable in Germany. The reform is expected to pass the German parliament in
autumn 2008. Other countries are anticipated to follow with the introduction of similar
regulations. In the light of our paper, this development should be appreciated.
19Under the current US regulations, US multinationals have an incentive to develop patents jointly
in R&D units at the US parent and at low–tax affiliates and to sell them from the low–tax subsidiary
to other production affiliates in high–tax countries since the profit of these transactions has not to be
re–transfered to the US parent.
21

7 Appendix
Figure 1: Parent Level Intangible Assets over Time(Mean of all observations per year, in thousand US dollars, current prices)
Figure 2: Subsidiary Level Intangible Assets over Time(Mean of all observations per year, in thousand US dollars, current prices)
22
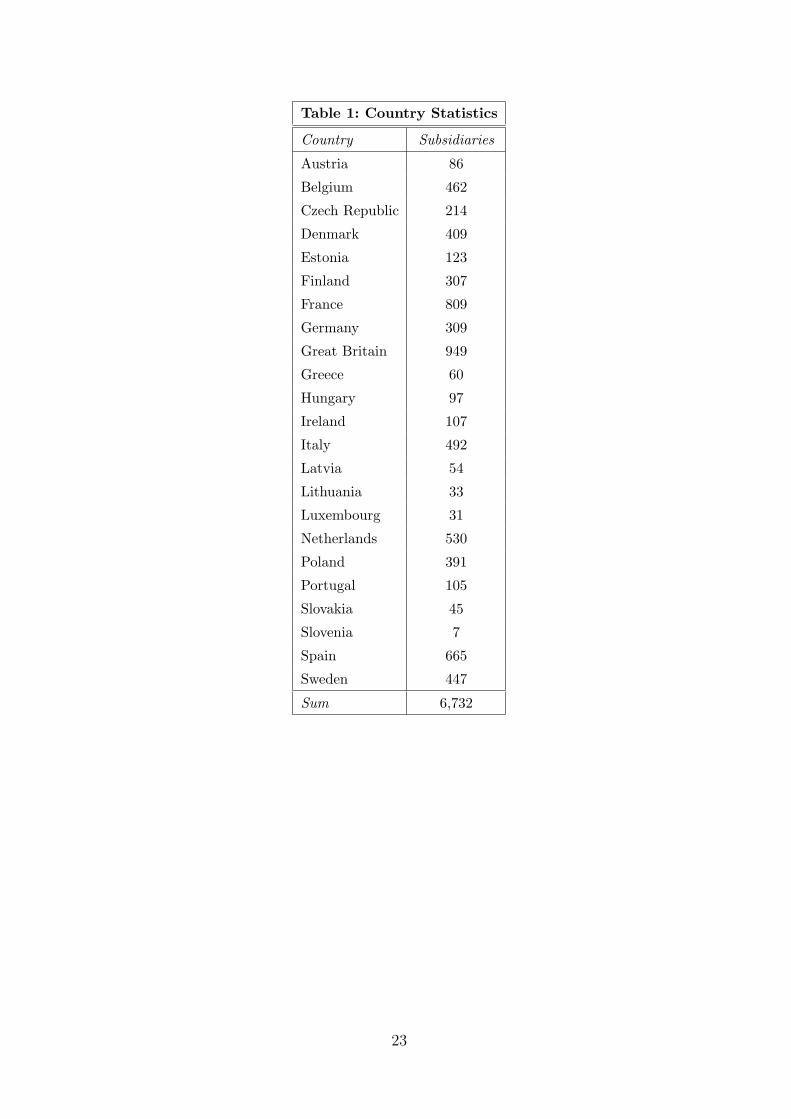
Table 1: Country Statistics
Country Subsidiaries
Austria 86
Belgium 462
Czech Republic 214
Denmark 409
Estonia 123
Finland 307
France 809
Germany 309
Great Britain 949
Greece 60
Hungary 97
Ireland 107
Italy 492
Latvia 54
Lithuania 33
Luxembourg 31
Netherlands 530
Poland 391
Portugal 105
Slovakia 45
Slovenia 7
Spain 665
Sweden 447
Sum 6,732
23

Table 2: Descriptive Statistics
Variable Obs. Mean Std. Dev. Min. Max.
Subsidiary Level:
Statutory Corporate Tax Rate 45,575 .3333 .0632 .1 .5676
Avg. Tax Diff. to All Other Aff.N 43,813 -.0070 .0634 -.3817 .2865
Tax Difference to ParentH 43,813 -.0286 .0853 -.4676 .317
Intangible AssetsF 45,575 3,420 116,636 0 1.03e+07
Binary Intangible Assets� 45,575 .5519 .4973 0 1
Total AssetsF 45,575 105,206 900,066 2 7.75e+07
Profit/Loss before TaxationF 44,719 3,532 56,286 -3,930,011 3,926,446
Number of Employees 40,551 219.6 903.5 1 41,186
Fixed AssetsF 45,134 62,470 724,873 1 7.74e+07
Operating RevenueF 44,583 82,179 439,198 0 2.25e+07
Parent Level:
Statutory Corporate Tax Rate 45,575 .3624 .0725 .1 .5676
Intangible AssetsF 36,223 64,845 784,666 0 1.98e+07
Number of Subsidiaries� 45,575 81.4 135.6 3 752
Country Level:
GDP per Capita (in Euro) 45,575 21,877 8,333 1,517 60,311
Population (per thousand) 45,575 34,588 24,274 406 82,537
Unemployment Rate 45,217 .0863 .0365 .021 .199
Notes:N The Average Tax Difference to All Other Affiliates is calculated as: statutory corporatetax rate of the considered subsidiary minus the unweighted average statutory corporate taxrate of all other group members, comprising subsidiaries (owned with at least 90% of theownership shares) and the parent firm.H The Tax Difference to Parent is calculated as: statutory corporate tax rate of the subsidiaryminus statutory corporate tax rate of the parent.F In thousands of US dollars, current prices.� Binary Intangible Assets takes on the value 1 if a subsidiary owns intangible assets andtakes on the value 0 if a subsidiary does not own any intangibles.� Subsidiaries owned with ≥ 90% of the ownership shares. Median is calculated with 26.
24
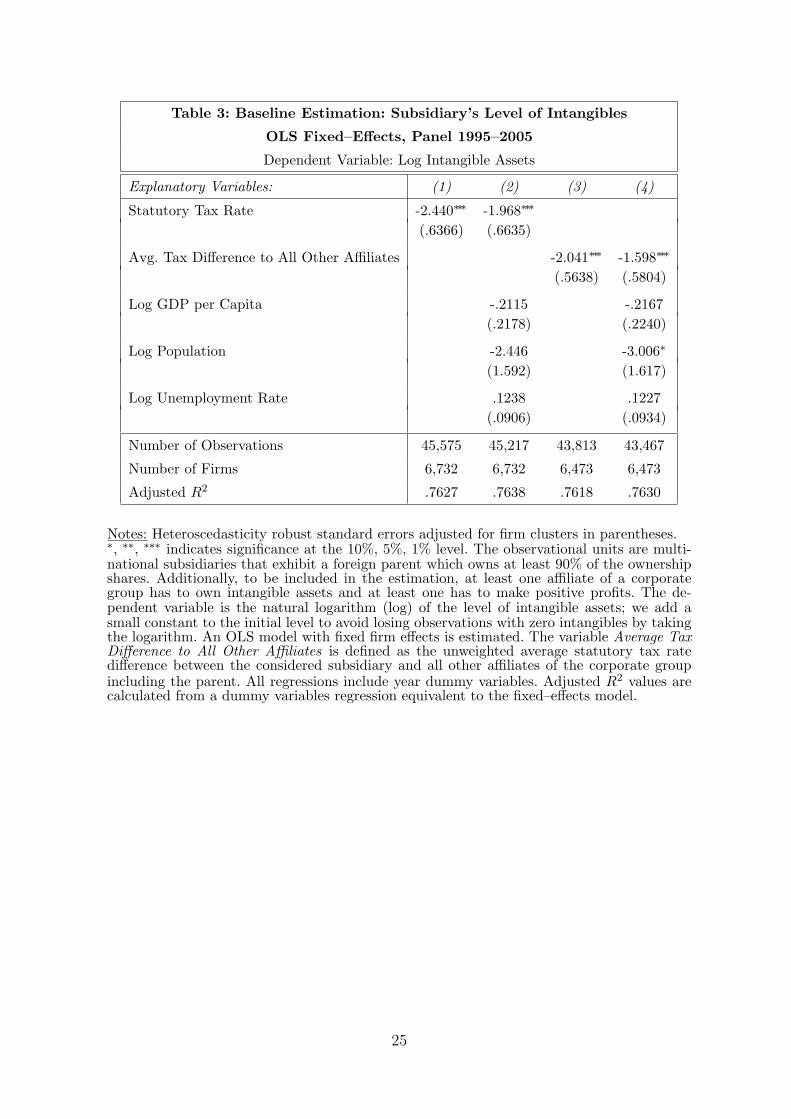
Table 3: Baseline Estimation: Subsidiary’s Level of Intangibles
OLS Fixed–Effects, Panel 1995–2005
Dependent Variable: Log Intangible Assets
Explanatory Variables: (1) (2) (3) (4)
Statutory Tax Rate -2.440∗∗∗ -1.968∗∗∗
(.6366) (.6635)
Avg. Tax Difference to All Other Affiliates -2.041∗∗∗ -1.598∗∗∗
(.5638) (.5804)
Log GDP per Capita -.2115 -.2167(.2178) (.2240)
Log Population -2.446 -3.006∗
(1.592) (1.617)
Log Unemployment Rate .1238 .1227(.0906) (.0934)
Number of Observations 45,575 45,217 43,813 43,467
Number of Firms 6,732 6,732 6,473 6,473
Adjusted R2 .7627 .7638 .7618 .7630
Notes: Heteroscedasticity robust standard errors adjusted for firm clusters in parentheses.∗, ∗∗, ∗∗∗ indicates significance at the 10%, 5%, 1% level. The observational units are multi-national subsidiaries that exhibit a foreign parent which owns at least 90% of the ownershipshares. Additionally, to be included in the estimation, at least one affiliate of a corporategroup has to own intangible assets and at least one has to make positive profits. The de-pendent variable is the natural logarithm (log) of the level of intangible assets; we add asmall constant to the initial level to avoid losing observations with zero intangibles by takingthe logarithm. An OLS model with fixed firm effects is estimated. The variable Average TaxDifference to All Other Affiliates is defined as the unweighted average statutory tax ratedifference between the considered subsidiary and all other affiliates of the corporate groupincluding the parent. All regressions include year dummy variables. Adjusted R2 values arecalculated from a dummy variables regression equivalent to the fixed–effects model.
25

Table 4: Robustness Check I: Binary Dependent Variable
Logit & OLS Fixed–Effects, Panel 1995–2005
Dependent Variable: Binary Intangible Assets
Explanatory Variables: (1) (2) (3) (4)
Statutory Tax Rate -3.935∗∗∗ -.3352∗∗∗
(1.126) (.1035)
Avg. Tax Difference to All Other Affiliates -2.557∗∗ -.1972∗∗
(1.083) (.1010)
GDP per Capita 1.868 3.907∗∗ -.0008 .1581(1.917) (1.904) (.1347) (.1315)
Population -22.31∗∗∗ -21.34∗∗∗ -1.580∗∗∗ -1.492∗∗
(7.321) (7.464) (.6186) (.6358)
Unemployment Rate -.0452 1.266 -.1267 -.0176(2.568) (2.577) (.1782) (.1811)
Number of Observations 16,817 16,245 45,198 43,448
Number of Firms 2,254 2,178 6,732 6,473
Model Logit FE Logit FE OLS FE OLS FE
Pseudo R2 (Logit), Adjusted R2 (OLS) .0233 .0229 .7224 .7209
Notes: Heteroscedasticity robust standard errors adjusted for firm clusters in parentheses.∗, ∗∗, ∗∗∗ indicates significance at the 10%, 5%, 1% level. The observational units are multi-national subsidiaries that exhibit a foreign parent which owns at least 90% of the ownershipshares. Additionally, to be included in the estimation, at least one affiliate of the corporategroup has to own intangible assets and at least one has to make positive profits. The depen-dent binary variable is set to 1 if a subsidiary owns intangible assets and is 0 if not. In (1)– (2), a logit model with fixed firm effects (FE) is estimated while in (3) – (4) a linear OLSmodel with fixed firm effects is applied. The variable Average Tax Difference to All OtherAffiliates is defined as the unweighted average statutory tax rate difference between the con-sidered subsidiary and all other affiliates of the corporate group including the parent. Allregressions include year dummy variables. Adjusted R2 values are calculated from a dummyvariables regression equivalent to the fixed–effects model.
26

Table 5: Robustness Check II: Control for Subsidiary Size
OLS & IV First Differences, Panel 1995–2005
Dependent Variable: Log Intangible Assets
Explanatory Variables: (1) (2) (3) (4) (5) (6)
Statutory Tax Rate -1.166∗∗∗ -1.044∗∗ -1.845∗∗
(.4393) (.8993)
Avg. Tax Difference to -.9235∗∗ -.8164∗∗ -1.292∗
All Other Affiliates (.4006) (.3976) (.7648)
Log GDP per Capita .3442∗∗ .3620∗∗ -.0308 -.0131 .2658 .2741(.1689) (.1729) (.1678) (.1717) (.3125) (.3215)
Log Population -1.311 -1.639 -1.341 -1.497 -3.709∗ -4.637∗∗
(1.527) (1.540) (1.459) (1.473) (1.946) (1.966)
Log Unemployment Rate .2004∗∗ .2047∗∗ .1955∗∗ .2011∗∗ .1363 .1383(.0826) (.0839) (.0812) (.0825) (.1175) (.1192)
Log Total Assets .5056∗∗∗ .5052∗∗∗ -.0441 -.0388(.0299) (.0305) (.1841) (.1876)
Number of Observations 37,242 35,800 37,214 35,773 19,436 18,659
Number of Firms 6,498 6,251 6,498 6,251 4,881 4,693
Model OLS FD OLS FD OLS FD OLS FD IV FD IV FD
1st–stage F–Test of excl. 48.54 46.13instruments (F–statistic)
Hansen J–Test (P–value) .3461 .1836
Notes: Heteroscedasticity robust standard errors adjusted for firm clusters in parentheses.∗, ∗∗, ∗∗∗ indicates significance at the 10%, 5%, 1% level. The observational units are multi-national subsidiaries that exhibit a foreign parent which owns at least 90% of the ownershipshares. Additionally, to be included in the estimation, at least one affiliate of the corporategroup has to own intangible assets and at least one has to make positive profits. The depen-dent variable is the natural logarithm (log) of the level of intangible assets; we add a smallconstant to the initial level to avoid losing observations with zero intangibles by taking thelogarithm. In (1) – (4), an OLS model in first differences (FD) with no constant is estimated.In (5) – (6), a first–differenced instrumental variables (IV) approach in two stages (2SLS)with no constant is applied, with the 1st difference of Log Total Assets being instrumentedwith the 2nd – 4th lag of the level of Log Total Assets (cf. Anderson and Hsiao, 1982). Thevariable Average Tax Difference to All Other Affiliates is defined as the unweighted averagestatutory tax rate difference between the considered subsidiary and all other affiliates of thecorporate group including the parent. All regressions include year dummy variables. Note,time–constant heterogeneity between subsidiaries is controlled for by first differencing.
27

Table 6: Robustness Check III: Dynamic Estimation
Difference GMM, Panel 1995–2005
Dependent Variable: Log Intangible Assets
Explanatory Variables: (1) (2) (3) (4) (5) (6)
1st Lag of Log Intang. Ass. .8515∗∗∗ .8519∗∗∗ .8421∗∗∗ .8423∗∗∗ .8351∗∗∗ .8288∗∗∗
(.0241) (.0246) (.0217) (.0222) (.0255) (.0260)
2nd Lag of Log Intang. Ass. .0018 .0035(.0133) (.0135)
Statutory Tax Rate -1.349∗∗ -1.300∗∗ -1.711∗∗
(.5976) (.6018) (.8077)
Avg. Tax Difference to -1.123∗∗ -1.125∗∗ -1.237∗
All Other Affiliates (.5802) (.5769) (.7191)
Log GDP per Capita .0607 .1905 -.0394 .0872 .0795 .1195(.1541) (.1428) (.2036) (.2062) (.3304) (.3398)
Log Population -2.284∗ -2.182∗ -2.354∗ -2.226∗ -1.655 -1.785(1.280) (1.333) (1.238) (1.291) (1.529) (1.538)
Log Unemployment Rate .1899∗ .1892∗ .1827∗ .1805∗ .1896 .1879(.1060) (.1071) (.1049) (.1060) (.1202) (.1225)
Log Total Assets .0582 .0534 -.0241 -.0297(.0962) (.0986) (.1257) (.1301)
Number of Observations 30,164 28,984 30,148 28,969 24,046 23,095
Number of Firms 5,893 5,671 5,890 5,668 5,357 5,155
Number of Instruments 22 22 31 31 30 30
Arellano–Bond–Test for .356 .296 .349 .290 .887 .805AR(2) (P–value)
Hansen–Test (P–value) .432 .501 .459 .441 .243 .242
Notes: Standard errors robust against heteroscedasticity and autocorrelation within firmsare reported in parentheses. ∗, ∗∗, ∗∗∗ indicates significance at the 10%, 5%, 1% level. Theobservational units are multinational subsidiaries that exhibit a foreign parent which owns atleast 90% of the ownership shares. Additionally, to be included in the estimation, at least oneaffiliate of the corporate group has to own intangibles and at least one has to make positiveprofits. The dependent variable is the logarithm (log) of the level of intangible assets; weadd a small constant to the initial level to avoid losing observations with zero intangiblesby taking the logarithm. A one–step linear GMM dynamic panel–data estimation in firstdifferences with no constant is applied. Following Arellano and Bond (1991), we instrumentthe 1st difference of the 1st Lag of Log Intangible Assets with the 2nd and all deeper lags ofthe level of Log Intangible Assets. In (3) – (6), we additionally instrument the 1st differenceof Log Total Assets with the 2nd and all deeper lags of Log Total Assets levels. The variableAverage Tax Difference to All Other Affiliates is defined as the unweighted average statutorytax rate difference between the considered subsidiary and all other affiliates of the corporategroup including the parent. All regressions include year dummy variables. Note, time–constantheterogeneity between subsidiaries is controlled for by first differencing.
28

Table 7: Profit Shifting Evidence
OLS Fixed–Effects, Panel 1995–2005
Dependent Variable: Log Profit before Taxation (per Sales)
Explanatory Variables: (1) (2) (3) (4) (5) (6)
Statutory Tax Rate -1.888∗∗∗ -2.093∗∗∗
(.3414) (.3595)
Tax Difference to Parent -.5464∗∗∗ -.7181∗∗∗
(.2205) (.2283)
Avg. Tax Difference to -1.251∗∗∗ -1.669∗∗∗
All Other Affiliates (.3376) (.3562)
Log Number Employees .1195∗∗∗ .1208∗∗∗ .1168∗∗∗ .1208∗∗∗ .1162∗∗∗ .1217∗∗∗
(per Sales) (.0316) (.0322) (.0317) (.0322) (.0325) (.0330)
Log Fixed Assets .0587∗∗∗ .0604∗∗∗ .0597∗∗∗ .0612∗∗∗ .0572∗∗∗ .0581∗∗∗
(per Sales) (.0183) (.0183) (.0184) (.0184) (.0189) (.0188)
Log GDP per Capita .1654∗ .3048∗∗∗ .3126∗∗∗
(.1002) (.0975) (.0998)
Log Population .5233 .5752 .7901(.9057) (.9232) (.9298)
Log Unempl. Rate -.1372∗ -.0767 -.1211∗
(.0724) (.0719) (.0740)
Number of Observations 24,446 24,327 24,446 24,327 23,497 23,383
Number of Firms 5,056 5,056 5,056 5,056 4,862 4,862
Adjusted R2 .6897 .6914 .6890 .6907 .6901 .6919
Notes: Heteroscedasticity robust standard errors adjusted for firm clusters in parentheses.∗, ∗∗, ∗∗∗ indicates significance at the 10%, 5%, 1% level. The observational units are multi-national subsidiaries that exhibit a foreign parent which owns at least 90% of the ownershipshares. Additionally, to be included in the estimation, at least one affiliate of the corporategroup has to own intangible assets. All subsidiaries in the sample exhibit positive profits. Thedependent variable is the natural logarithm (log) of the subsidiary’s unconsolidated pre–taxprofit calculated per operating revenue. An OLS model with fixed firm effects is estimated.The variable Tax Difference to Parent is defined as the statutory corporate tax rate of theconsidered subsidiary minus the statutory corporate tax rate of the subsidiary‘s parent. Thevariable Average Tax Difference to All Other Affiliates is defined as the unweighted aver-age statutory tax rate difference between the considered subsidiary and all other affiliatesincluding the parent. All regressions include year dummy variables. Adjusted R2 values arecalculated from a dummy variables regression equivalent to the fixed–effects model.
29
References
Alesina, A., R. J. Barro, and S. Tenreyro (2002): “Optimal Currency Areas,”
NBER Working Papers, Working Paper No. 9072, National Bureau of Economic
Research.
Anderson, T. W., and C. Hsiao (1982): “Formulation and Estimation of Dynamic
Models Using Panel Data,” Journal of Econometrics, 18, 47–82.
Arellano, M., and S. Bond (1991): “Some Tests of Specification for Panel Data:
Monte Carlo Evidence and an Application to Employment Equations,” Review of
Economic Studies, 58, 277–97.
Brand Finance plc (2008): “The Increasing Importance of Branding,” Brand Fi-
nance Report - Brands and tax planning, Issue 3, Twickenham (UK).
Bresnahan, T. F., E. Brynjolfsson, and L. M. Hitt (2002): “Information Tech-
nology, Workplace Organization, and the Demand for Skilled Labor: Firm-Level Ev-
idence,” Quarterly Journal of Economics, 117(1), 339–376.
Budd, J. W., J. Konings, and M. J. Slaughter (2005): “Wages and International
Rent Sharing in Multinational Firms,” The Review of Economics and Statistics, 87,
73–84.
Clausing, K. A. (2003): “Tax-Motivated Transfer Pricing and US Intrafirm Trade
Prices,” Journal of Public Economics, pp. 2207–2223.
Collins, J. H., D. Kemsley, and M. Lang (1998): “Cross-Jurisdictional Income
Shifting and Earnings Valuation,” Journal of Accounting Research, 36, 209–230.
Desai, M. A., C. F. Foley, and J. R. Hines (2006): “The Demand for Tax Haven
Operations,” Journal of Public Economics, 90(3), 513–531.
Devereux, M. P. (2006): “The Impact of Taxation on the Location of Capital, Firms
and Profit: A Survey of Empirical Evidence,” Oxford University Centre for Business
Taxation Working Paper Series, WP 07/02, Said Business School, Oxford.
Dischinger, M. (2007): “Profit Shifting by Multinationals: Indirect Evidence from
European Micro Data,” Munich Economics Discussion Papers, No. 2007-30, Univer-
sity of Munich.
30

Dischinger, M., and N. Riedel (2007): “Economies of Scope in International Profit
Shifting and Multinational Headquarter Location,” mimeo, University of Munich.
Edmans, A. (2007): “Does the Stock Market Misvalue Intangibles? Employee Satis-
faction and Equity Prices,” mimeo, MIT Sloan School of Management.
European Commission (2006): “Structures of the Taxation Systems in the European
Union,” Directorate Generale Taxation and Customs Union, Brussels.
Gattai, V. (2005): “Firm’s Intangible Assets and Multinational Activity: Joint-
Venture Versus FDI,” Fondazione Eni Enrico Mattei Working Paper Series, No.
122.2005, Bocconi University and ISESAO.
Grubert, H. (2003): “Intangible Income, Intercompany Transactions, Income Shift-
ing, and the Choice of Location,” National Tax Journal, 56(1), 221–242.
Grubert, H., and J. H. Mutti (2007): “The Effect of Taxes on Royalties and
the Migration of Intangible Assets Abroad,” NBER Working Paper Series, Working
Paper No. 13248.
Grubert, H., and J. Slemrod (1998): “The Effect of Taxes on Investment and
Income Shifting to Puerto Rico,” The Review of Economics and Statistics, 80(3),
365–373.
Hall, R. E. (2001): “The Stock Market and Capital Accumulation,” The American
Economic Review, 91(5), 1185–1202.
Hejazi, J. (2006): “Assessing the Risks of Intangibles Migration,” Tax Management
- Transfer Pricing, 15(10), 399–401, The Bureau of National Affairs.
Hilary, G., and C. Lennox (2005): “The Credibility of Self-Regulation: Evidence
from the Accounting Professions Peer Review Program,” Journal of Accounting and
Economics, 40, 211–229.
Huizinga, H., and L. Laeven (2008): “International Profit Shifting Within Multi-
nationals: A Multi-Country Perspective,” Journal of Public Economics, forthcoming.
KPMG International (2006): “KPMGs Corporate Tax Rate Survey,” Corporate
Income Tax Rate - A Trend Analysis, 304-250(October 2006).
Markusen, J. R. (1995): “The Boundaries of Multinational Enterprises and the The-
ory of International Trade,” Journal of Economic Perspectives, 9, 169–189.
31

(2002): Multinational Firms and the Theory of International Trade. The MIT
Press, Cambridge.
Morgan Lewis & Bockius LLP (2007): “Optimising Brand Value Through Strate-
gic Tax Planning,” Intellectual Asset Management - Brands in the Boardroom 2007,
April 2007, Washington DC (USA).
Plassmann, F., and T. N. Tideman (2001): “Does the Right to Carry Concealed
Handguns Deter Countable Crimes? Only a Count Analysis Can Say,” The Journal
of Law and Economics, 44, 771–98.
Reinganum, J. F., and L. L. Wilde (1985): “Income Tax Compliance in a
Principal–Agent Framework,” Journal of Public Economics, 26(1), 1–18.
Simpson, G. R. (2005): “Irish Unit Lets Microsoft Cut Taxes in U.S. and Europe,”
The Wall Street Journal, November 7, 2005, p. A1.
Weichenrieder, A. J. (2008): “Profit Shifting in the EU: Evidence from Germany,”
International Tax and Public Finance, forthcoming.
Zingales, L. (2000): “In Search of New Foundations,” Journal of Finance, 55(4),
1623–1653.
32