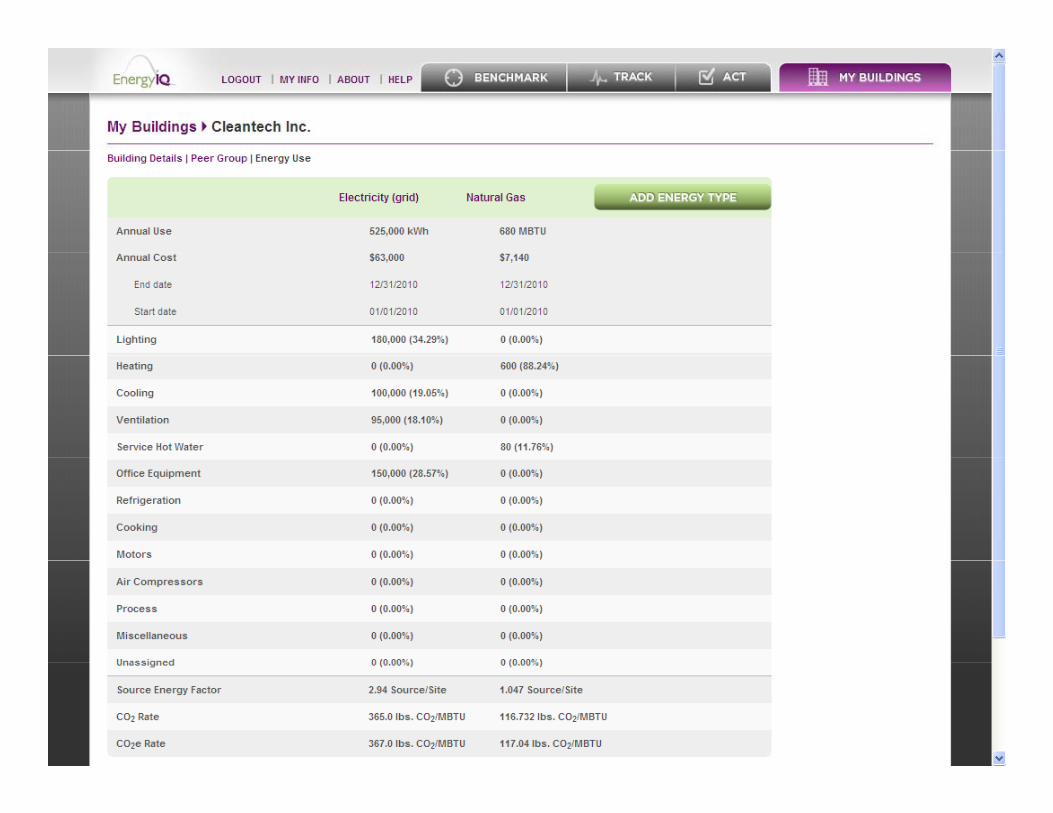
mathewpec energyvisualization energyiq …€“ user datauser data. energygy qiq project team lbnl...
TRANSCRIPT
Action-Oriented Benchmarking Identify and Prioritize Efficiency Opportunities
in Commercial Buildings
Paul MathewStaff ScientistStaff Scientist
Lawrence Berkeley National LaboratoryBerkeley, California
Recent Policy Developmentsy p
California California– AB1103 requires benchmarking of all commercial buildings at time of lease
or sale.– Executive order S-20-04 requires benchmarking of all state buildings.– SB1 requires buildings applying for solar incentives to benchmark energy
use intensity. Federal
EISA 2007 requires benchmarking of federal buildings to track performance– EISA 2007 requires benchmarking of federal buildings to track performance of energy goals.
Other– Minnesota requires all state buildings to be benchmarked.q g– Many organizations requiring LEED-EB, which requires benchmarking.
Europe– Energy Performance of Buildings Directive requires energy performance to
be publicly displayed.
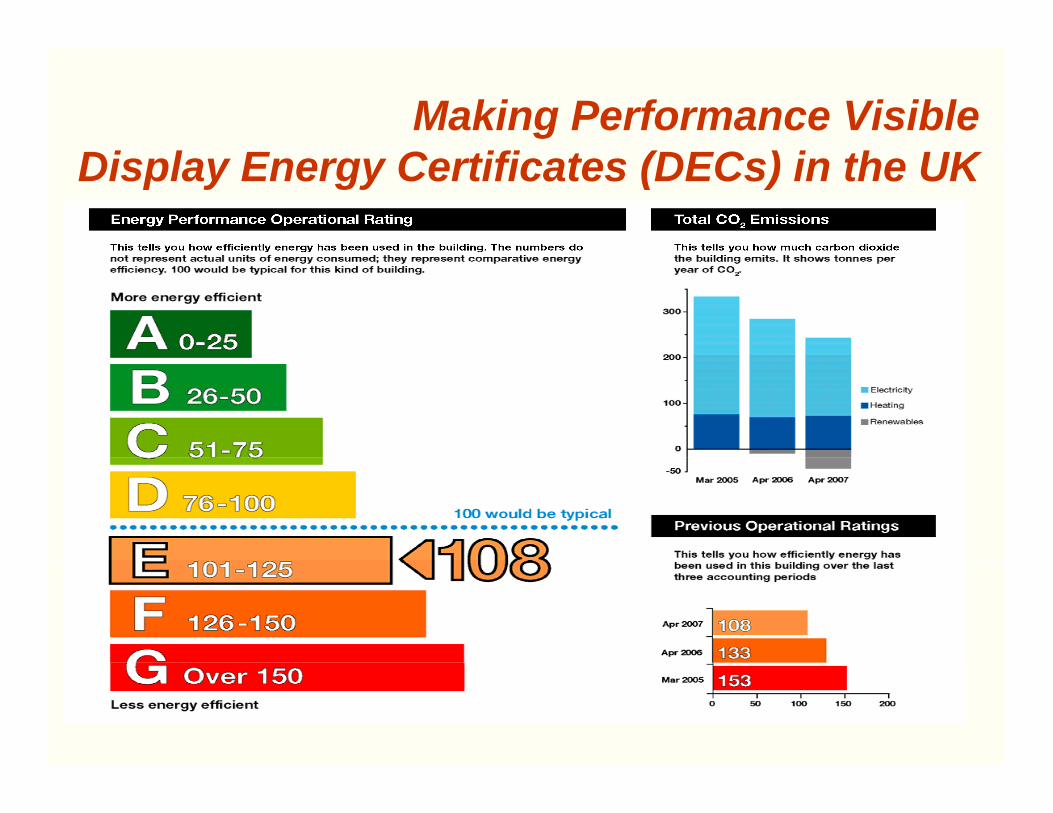
Making Performance Visible C f ( C )Display Energy Certificates (DECs) in the UK
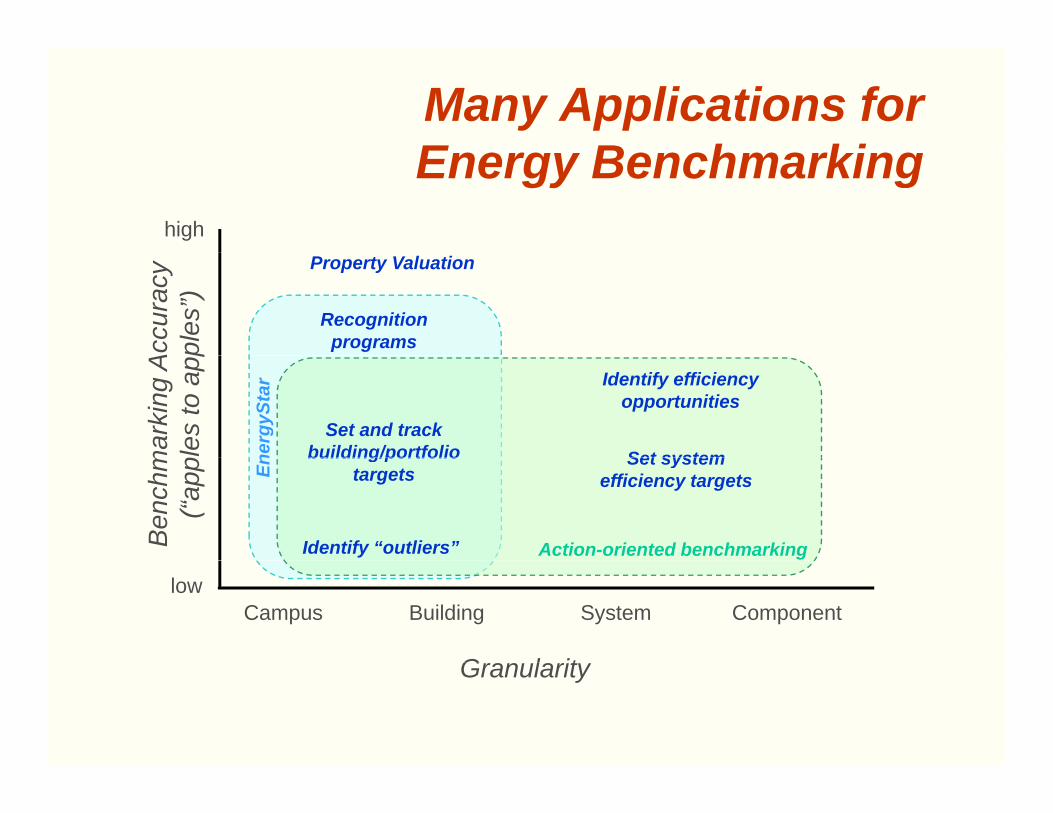
Many Applications for E B h kiEnergy Benchmarking
high
Acc
urac
ypl
es”)
Recognition programs
Property Valuationne
rgyS
tar
mar
king
Apl
es to
app
Set and track building/portfolio
Identify efficiency opportunities
Set systemEn
Action-oriented benchmarkingBen
chm
(“ap
p building/portfolio targets
Identify “outliers”
Set system efficiency targets
G l it
lowCampus Building System Component
Granularity
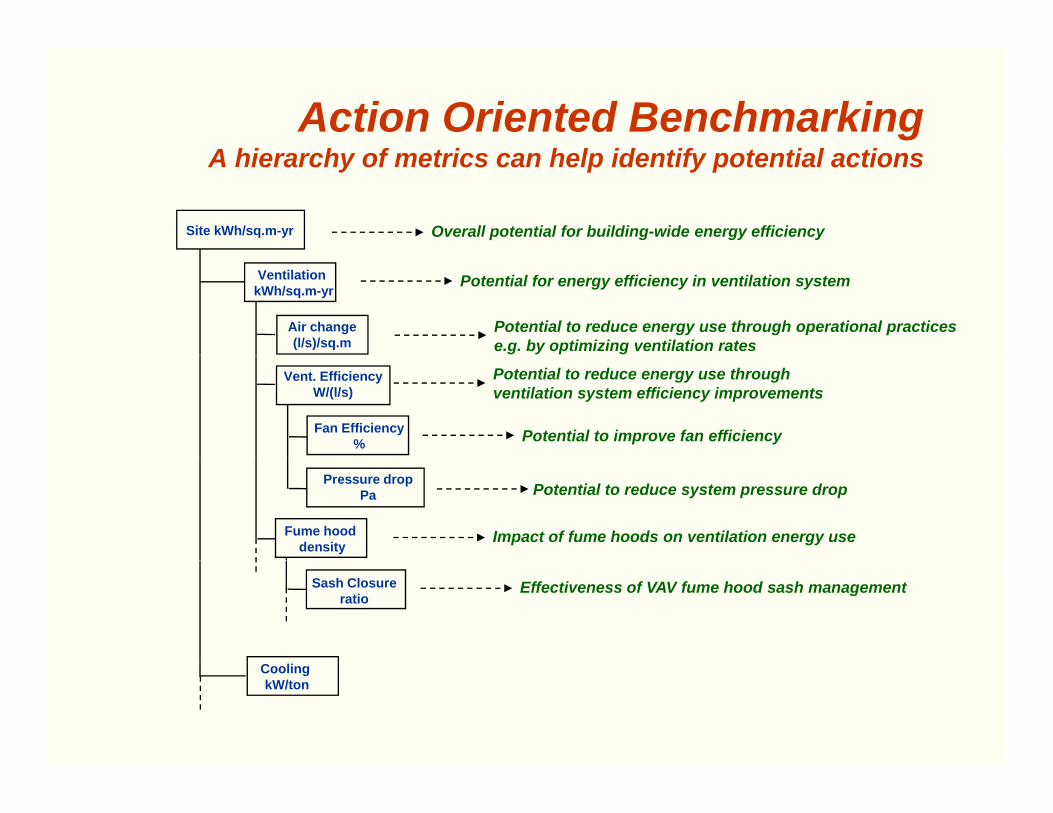
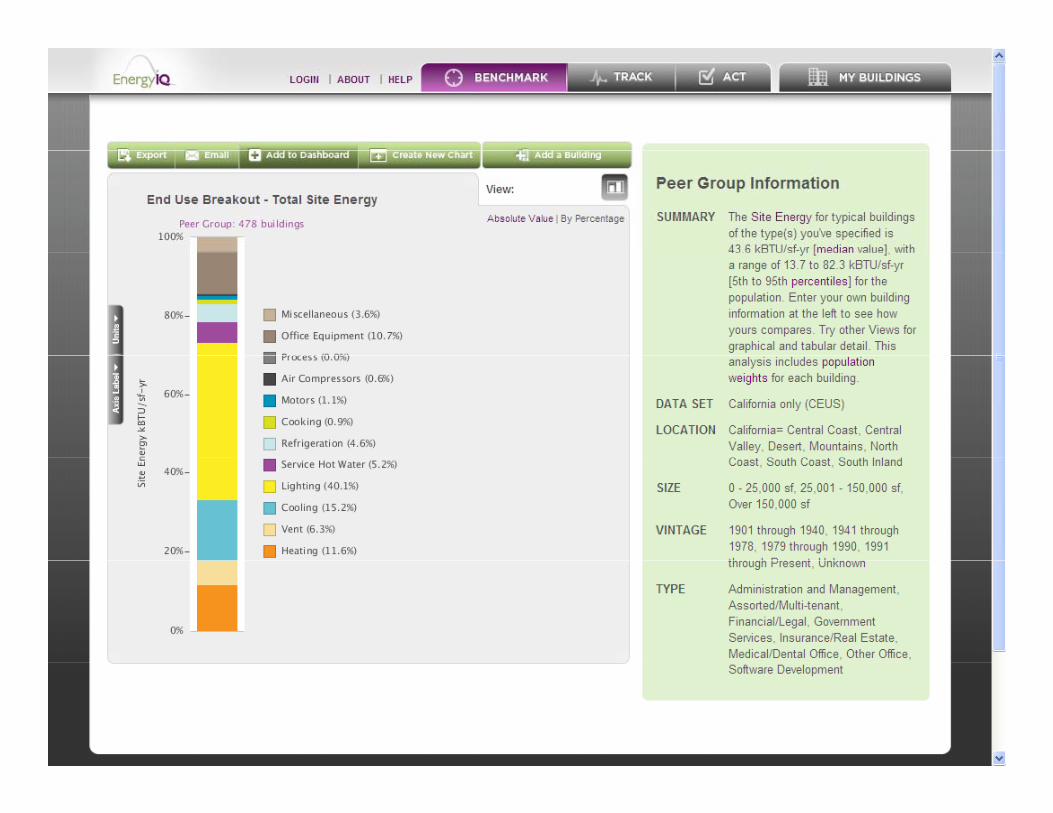
Action Oriented BenchmarkingA hi h f t i h l id tif t ti l tiA hierarchy of metrics can help identify potential actions
Site kWh/sq.m-yr Overall potential for building-wide energy efficiency
VentilationkWh/sq.m-yr
Air change(l/s)/sq.m
Potential to reduce energy use through operational practices e.g. by optimizing ventilation rates
Potential for energy efficiency in ventilation system
Vent. EfficiencyW/(l/s)
Fan Efficiency % Potential to improve fan efficiency
Potential to reduce energy use through ventilation system efficiency improvements
Fume hood density
Pressure dropPa Potential to reduce system pressure drop
Impact of fume hoods on ventilation energy use
Sash Closureratio
Effectiveness of VAV fume hood sash management
CoolingkW/ton
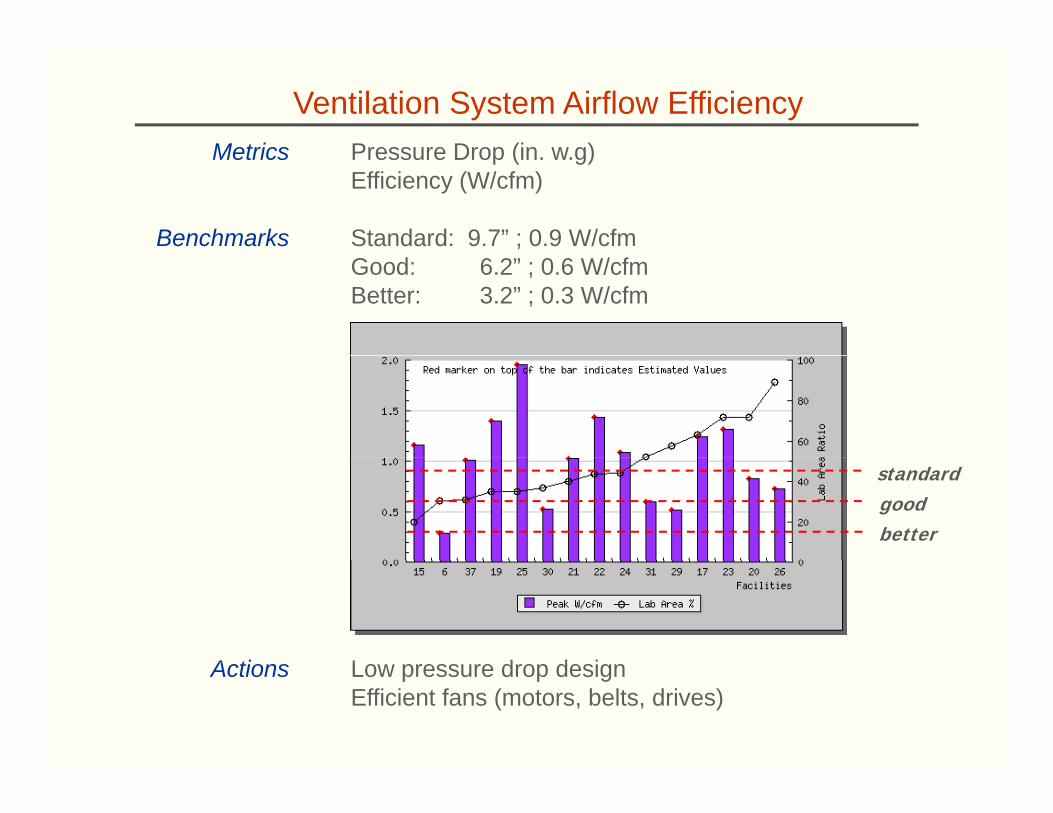
Ventilation System Airflow EfficiencyMetrics Pressure Drop (in w g)Metrics
Benchmarks
Pressure Drop (in. w.g) Efficiency (W/cfm)
Standard: 9.7” ; 0.9 W/cfmGood: 6.2” ; 0.6 W/cfm Better: 3.2” ; 0.3 W/cfm
standardgoodbetter
A ti L d d iActions Low pressure drop designEfficient fans (motors, belts, drives)
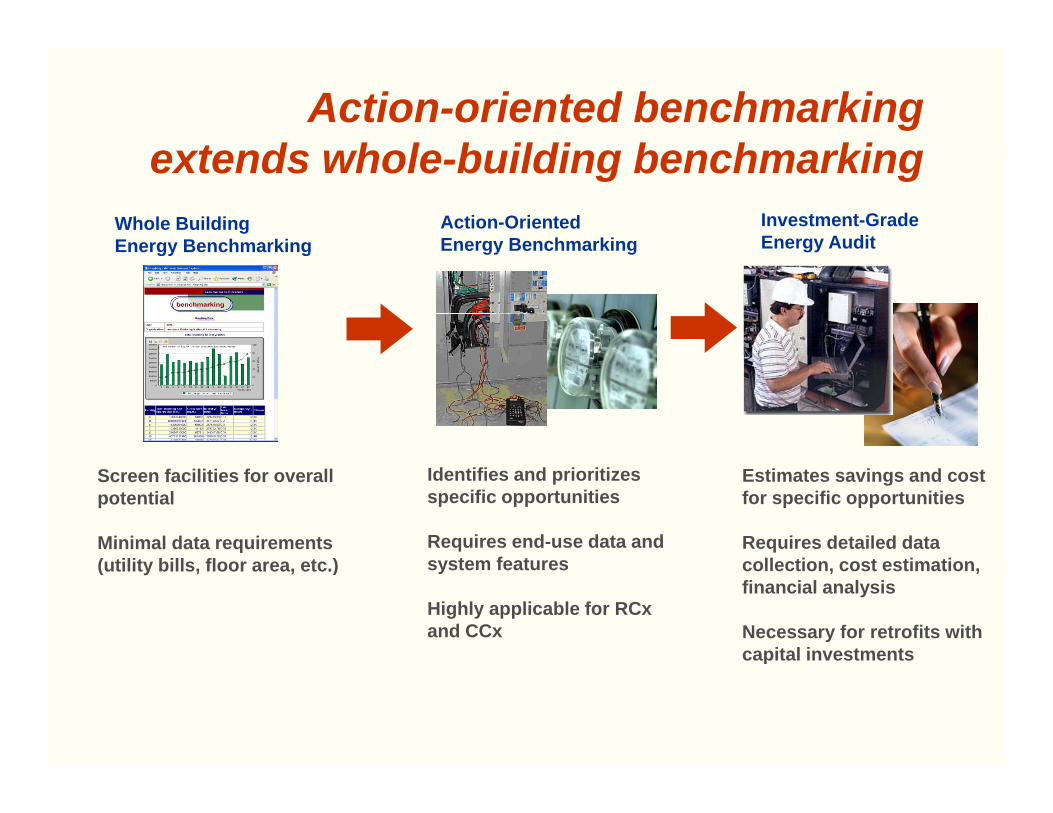
Action-oriented benchmarking t d h l b ildi b h kiextends whole-building benchmarking
Whole Building Energy Benchmarking
Action-Oriented Energy Benchmarking
Investment-GradeEnergy Auditgy g gy g
Screen facilities for overall potential
Minimal data requirements( tilit bill fl t )
Identifies and prioritizes specific opportunities
Requires end-use data and system features
Estimates savings and cost for specific opportunities
Requires detailed data ll ti t ti ti(utility bills, floor area, etc.) system features
Highly applicable for RCxand CCx
collection, cost estimation, financial analysis
Necessary for retrofits with capital investmentsp
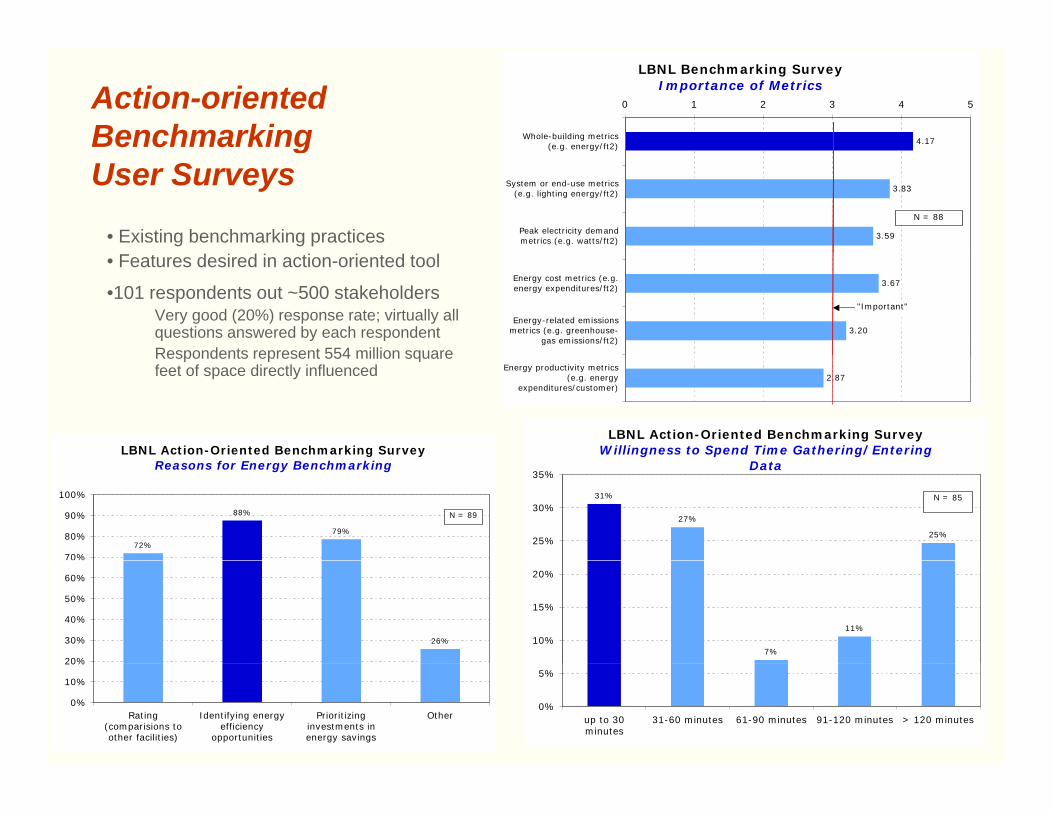
LBNL Benchmarking SurveyImportance of Metrics
4.17
0 1 2 3 4 5
Whole-building metrics(e.g. energy/ft2)
Action-oriented Benchmarking
3.83
3.59
( g gy/ )
System or end-use metrics(e.g. lighting energy/ft2)
Peak electricity demandmetrics (e.g. watts/ft2)
N = 88
gUser Surveys
• Existing benchmarking practices
3.67
3.20
Energy cost metrics (e.g.energy expenditures/ft2)
Energy-related emissionsmetrics (e.g. greenhouse-
gas emissions/ft2)
"Important"
• Features desired in action-oriented tool
•101 respondents out ~500 stakeholdersVery good (20%) response rate; virtually all questions answered by each respondentRespondents represent 554 million square
2.87Energy productivity metrics
(e.g. energyexpenditures/customer)
Respondents represent 554 million square feet of space directly influenced
LBNL Action-Oriented Benchmarking SurveyWillingness to Spend Time Gathering/Entering LBNL Action-Oriented Benchmarking Survey
Data
31%
27%
25%25%
30%
35%
N = 85
Reasons for Energy Benchmarking
72%
88%
79%
70%
80%
90%
100%
N = 89
7%
11%10%
15%
20%
26%
20%
30%
40%
50%
60%
0%
5%
up to 30minutes
31-60 minutes 61-90 minutes 91-120 minutes > 120 minutes
0%
10%
20%
Rating(comparisions toother facilities)
Identifying energyefficiency
opportunities
Prioritizinginvestments inenergy savings
Other

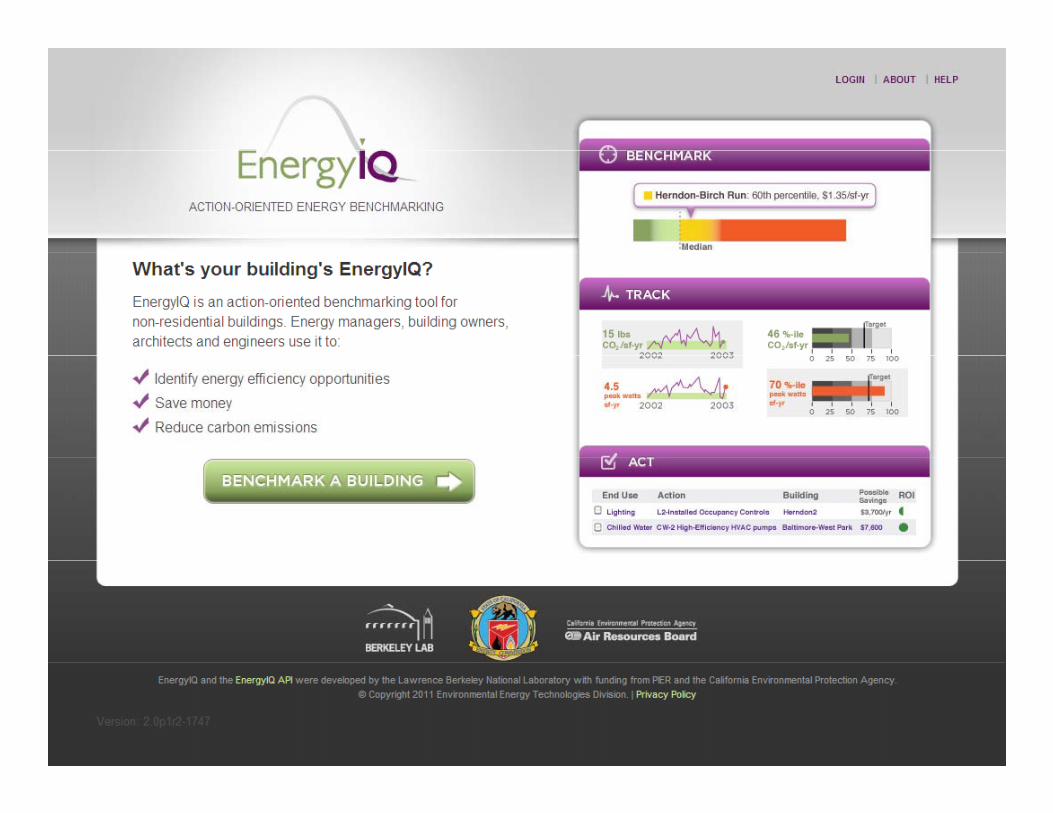
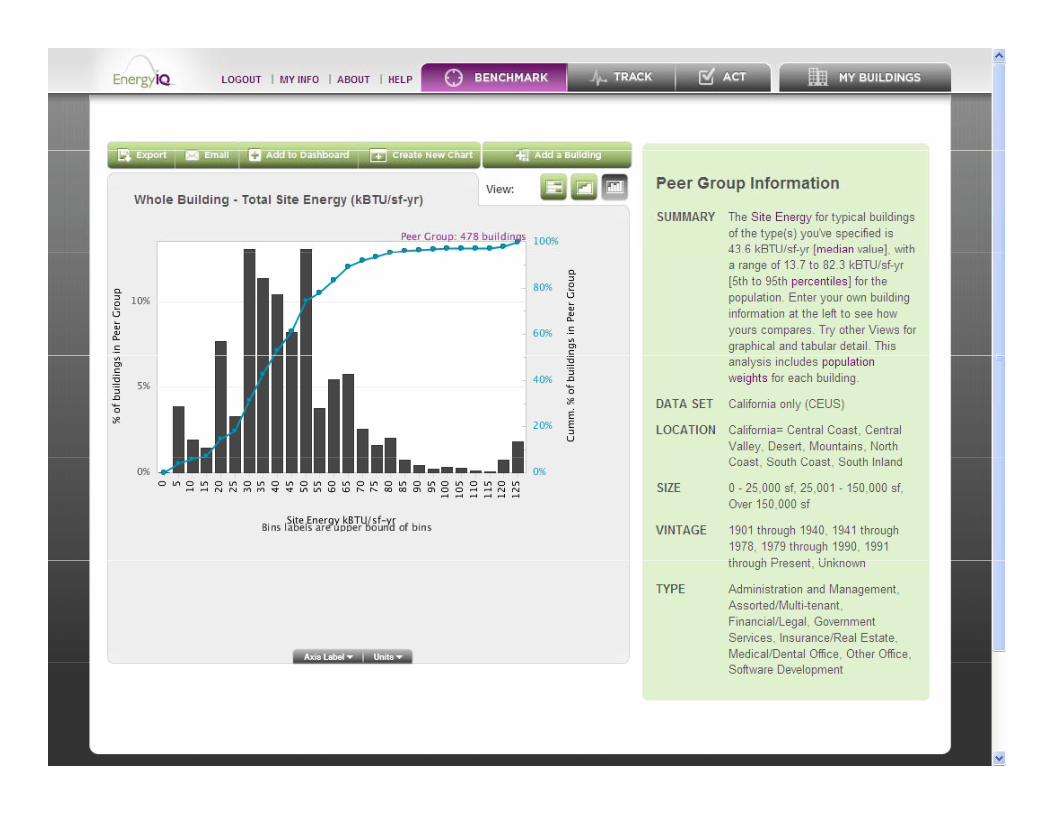
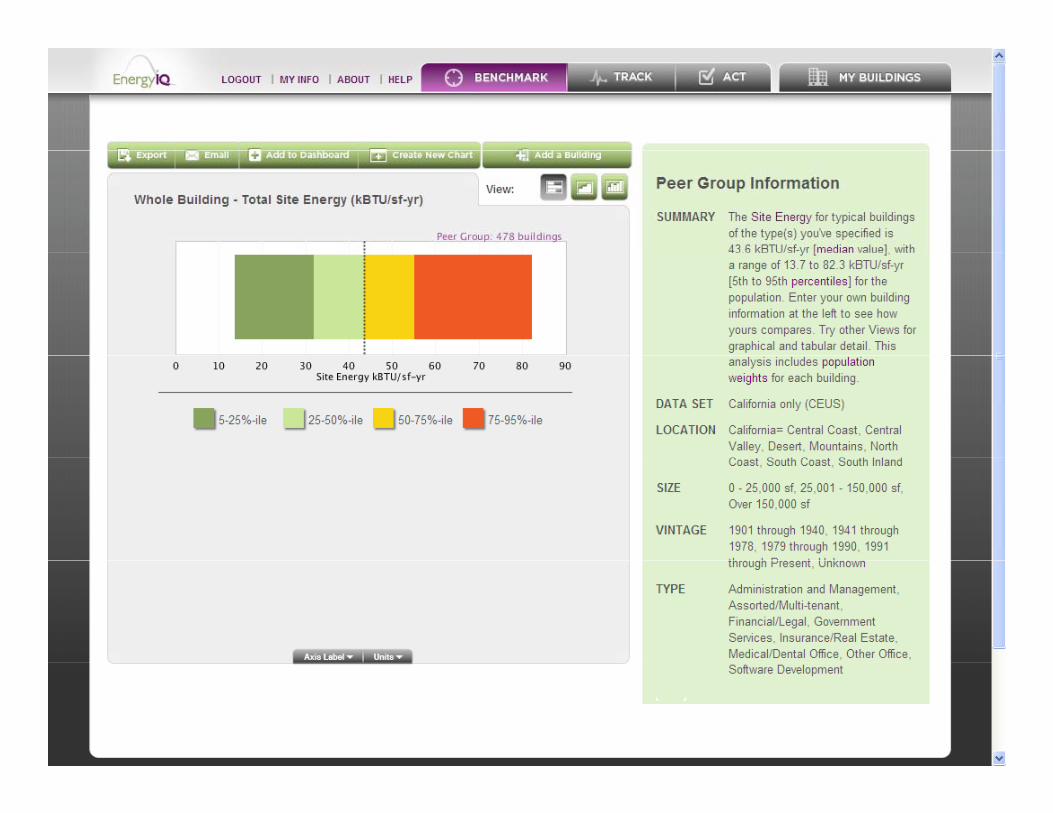
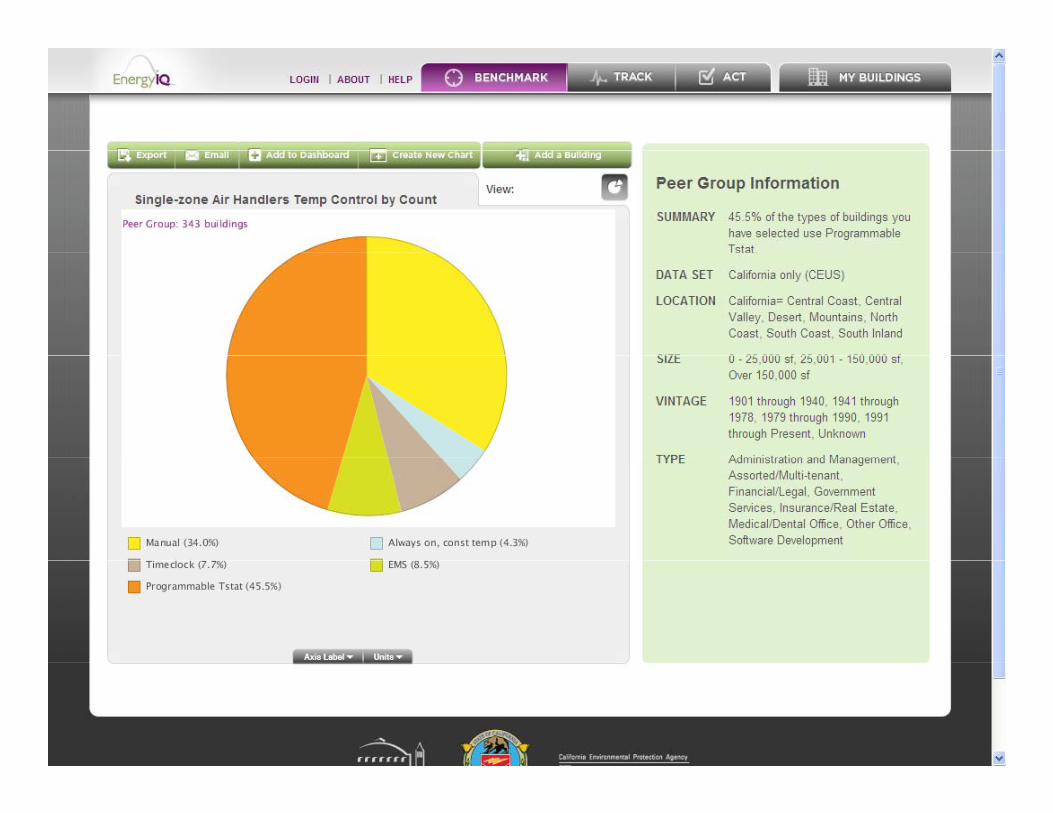
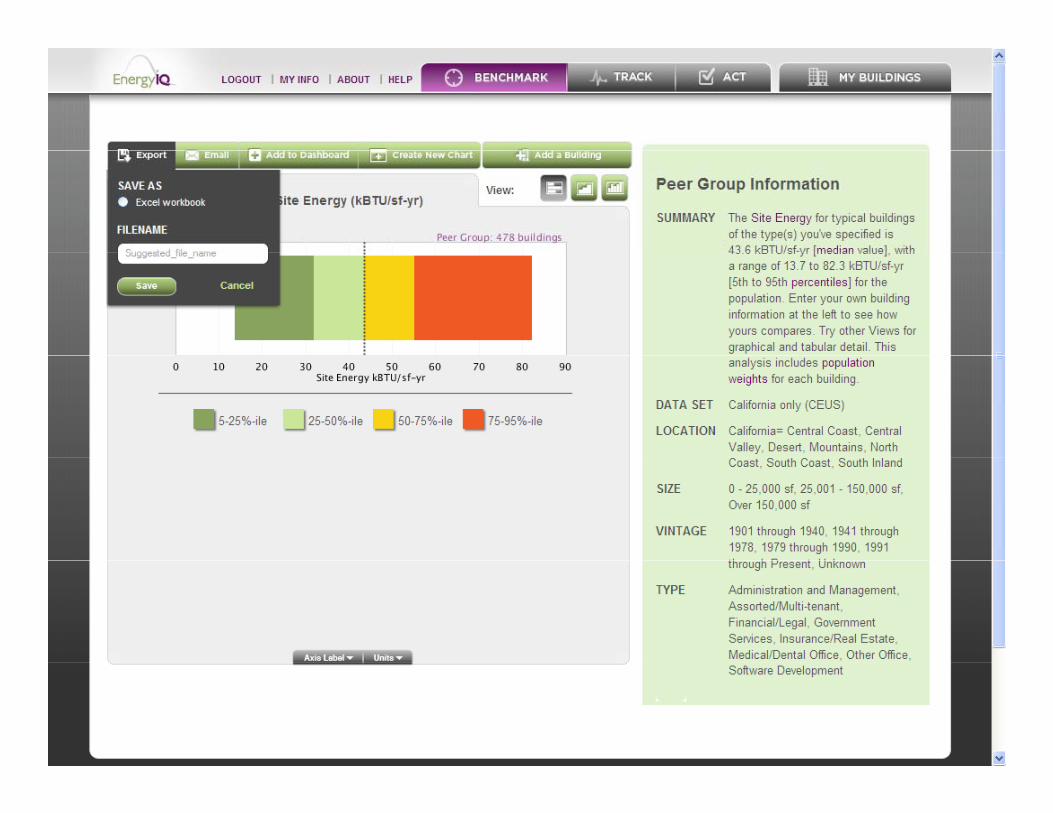
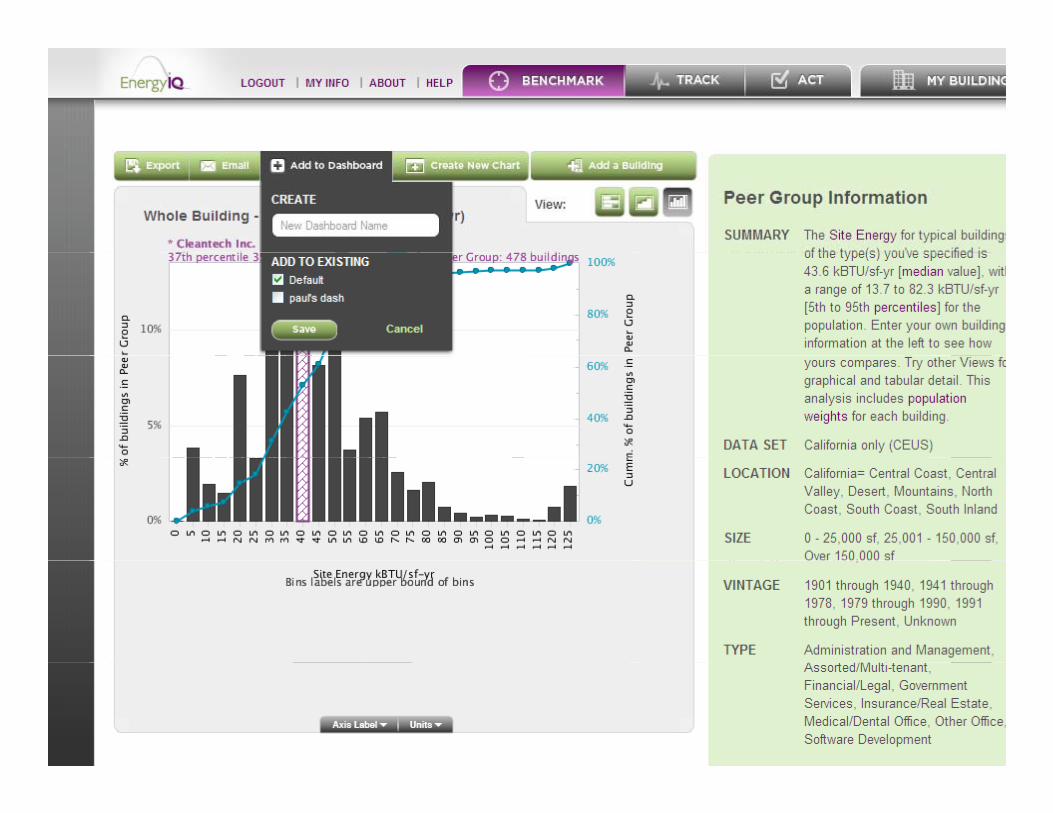
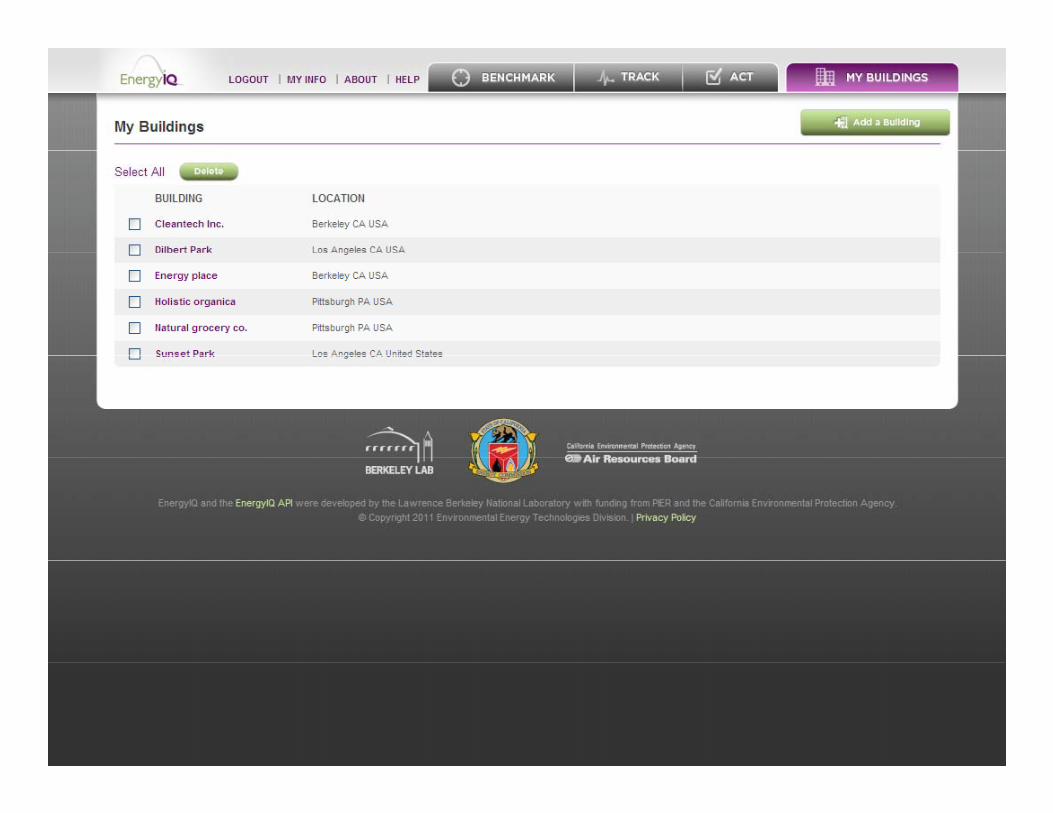
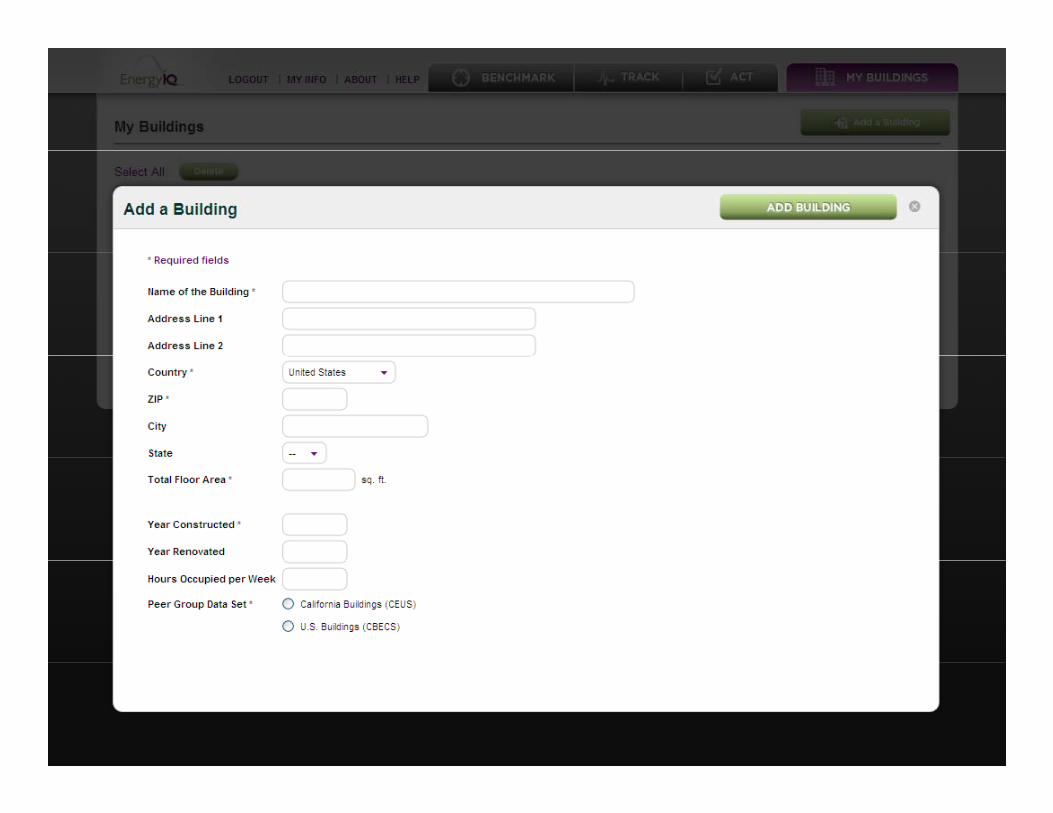
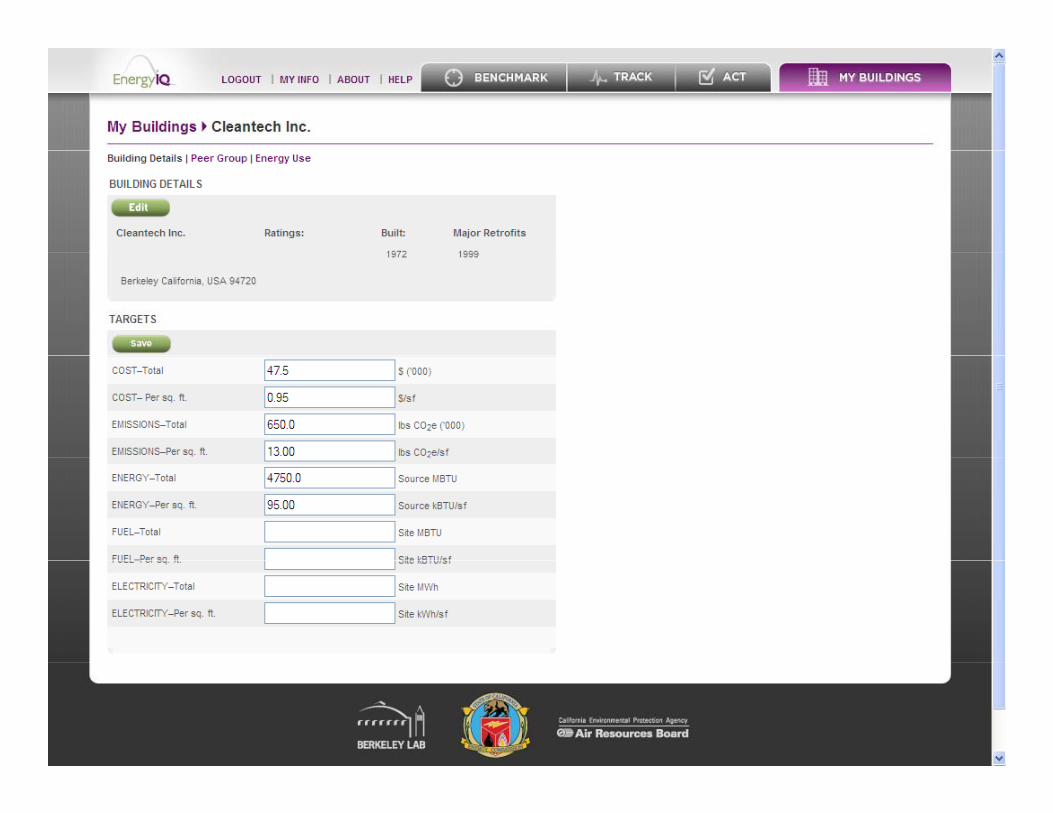
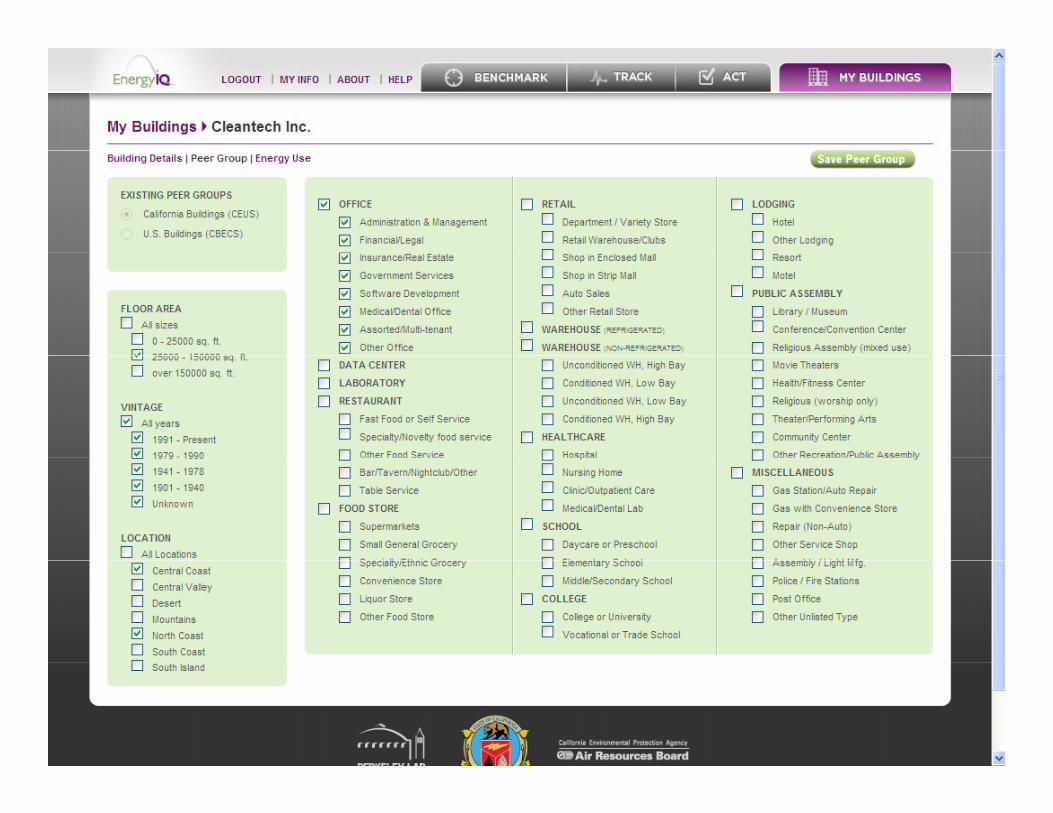
Energy IQEnergy IQ
EnergyIQ Goals and Premisesgy Q
1. Craft an AOB process that pairs “you-are-here” benchmarking with1. Craft an AOB process that pairs you are here benchmarking with pointers to actions to reduce energy use, cost, and emissions.
2. Serves as bridge between conventional benchmarking and full audit or simulation study.
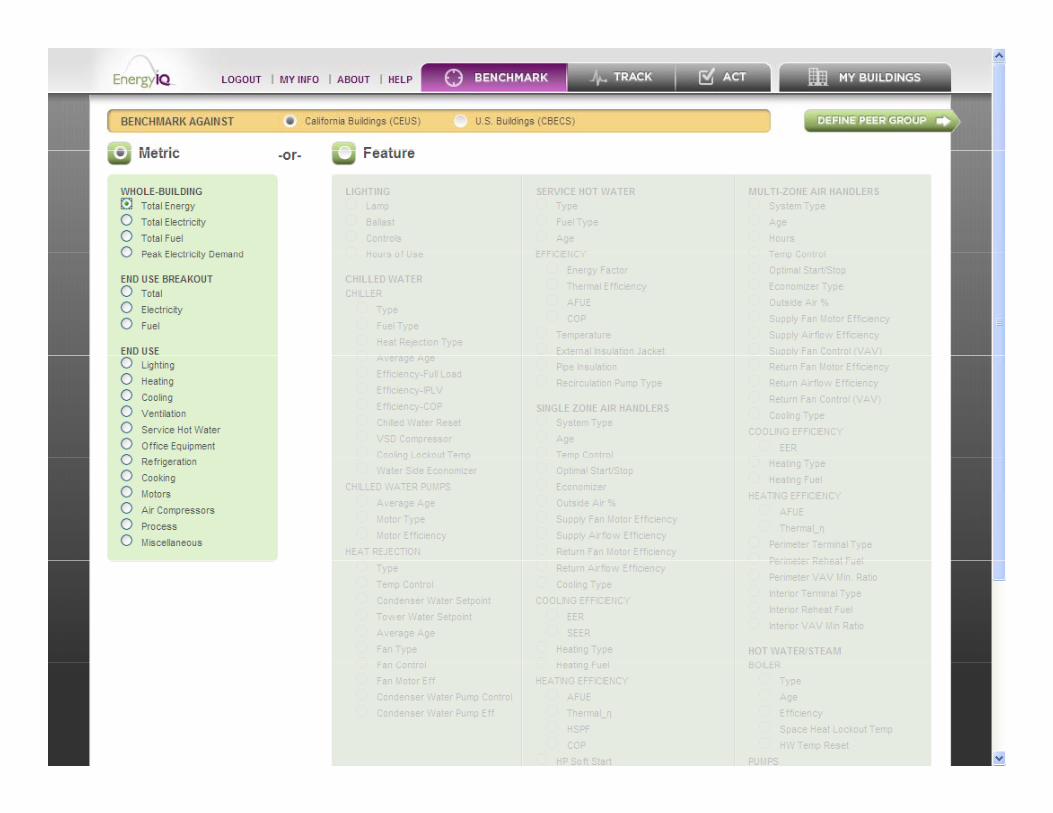
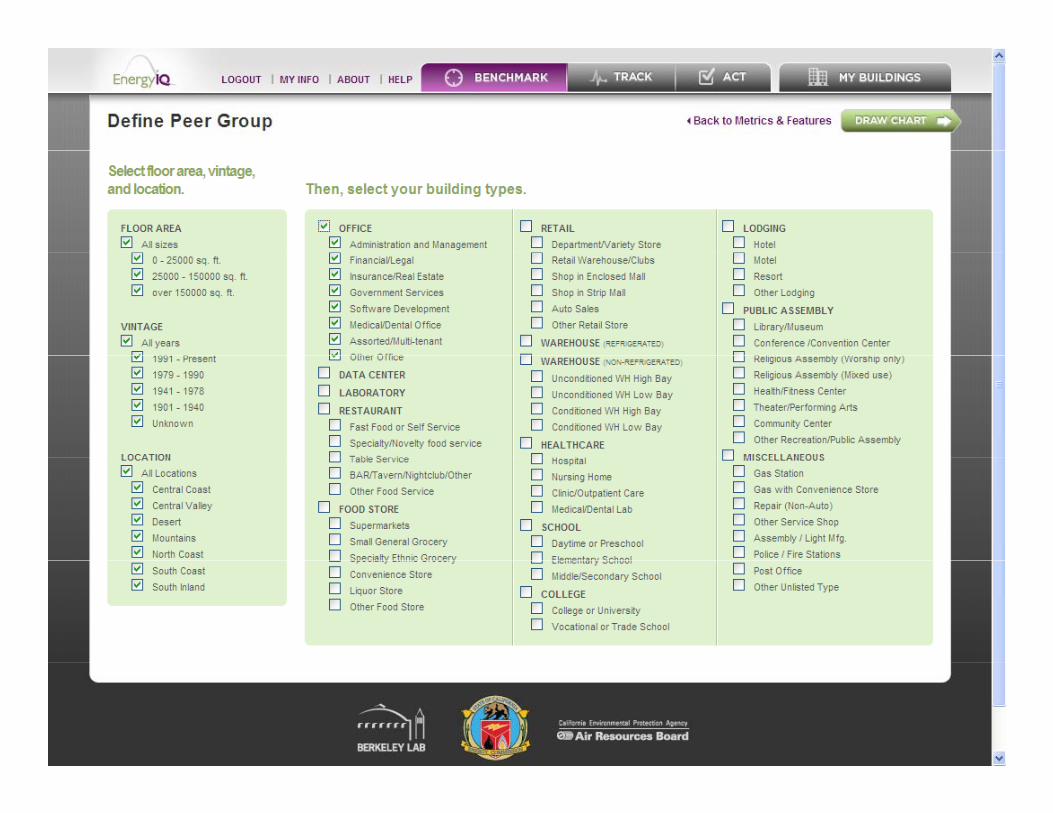
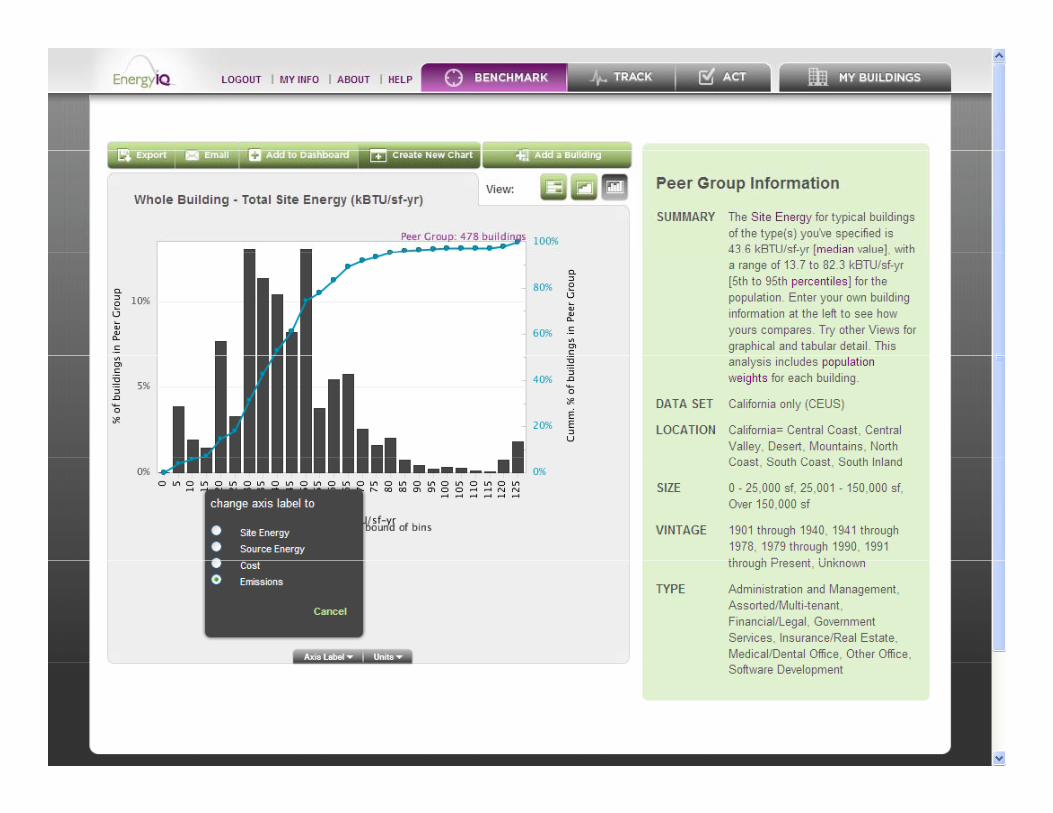
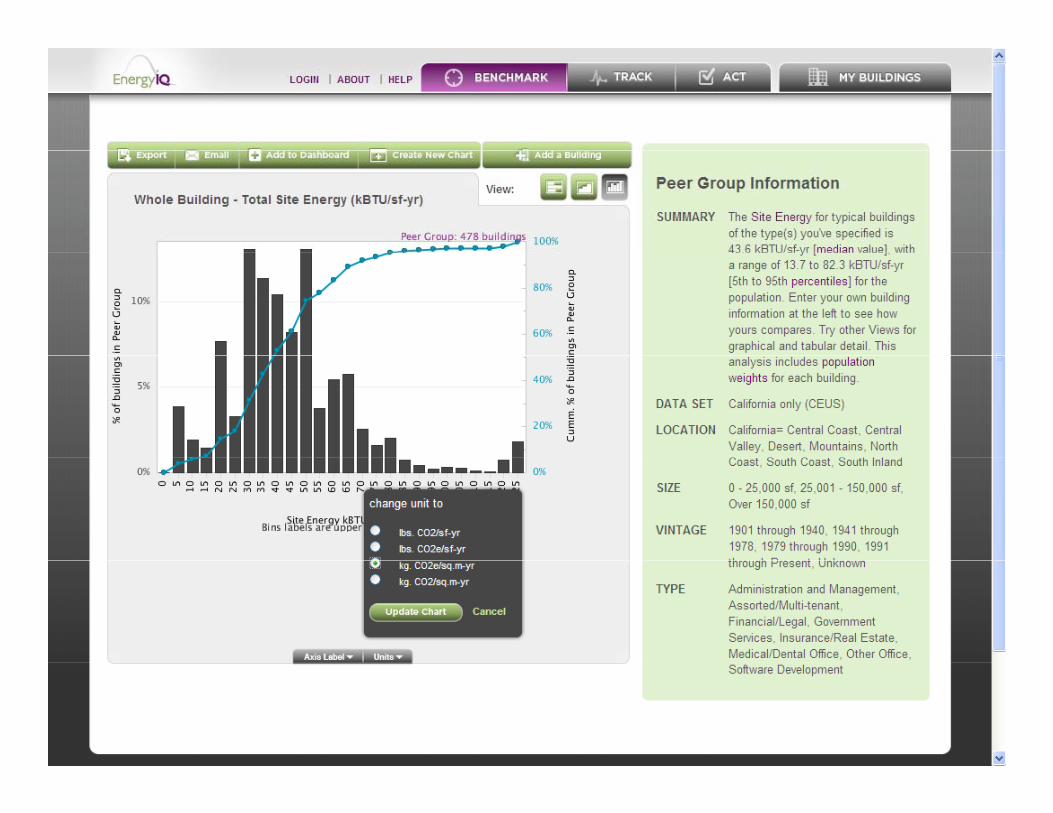
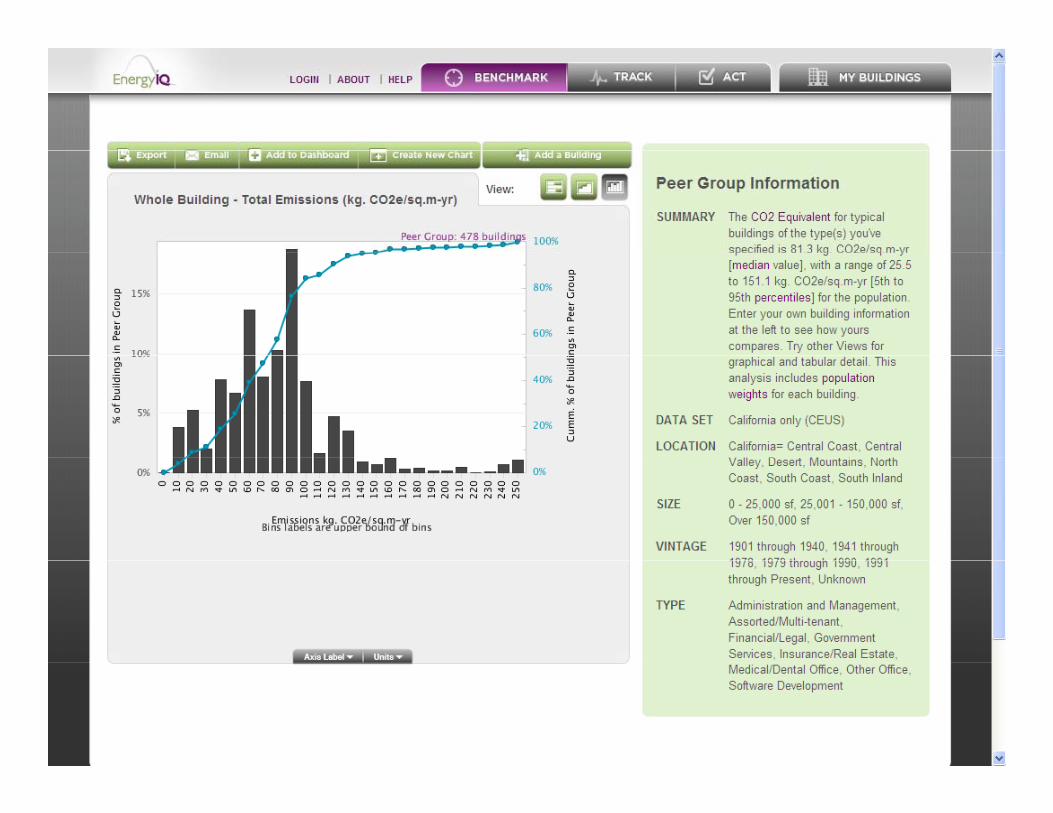
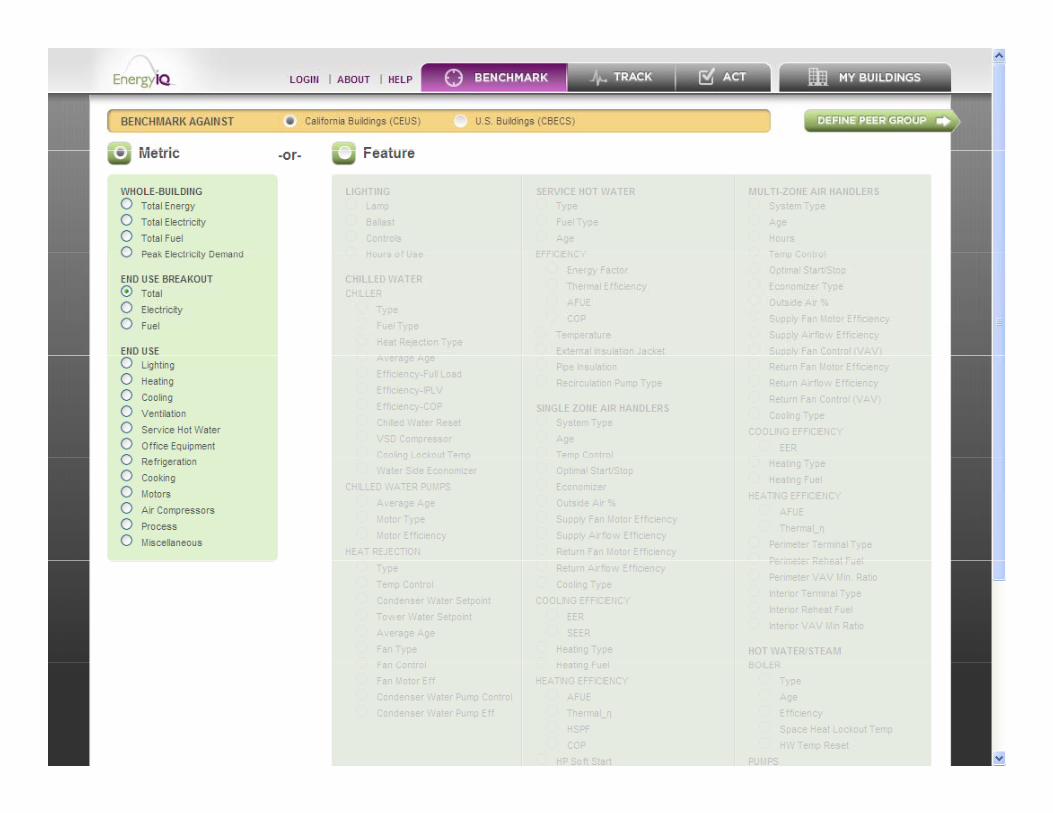
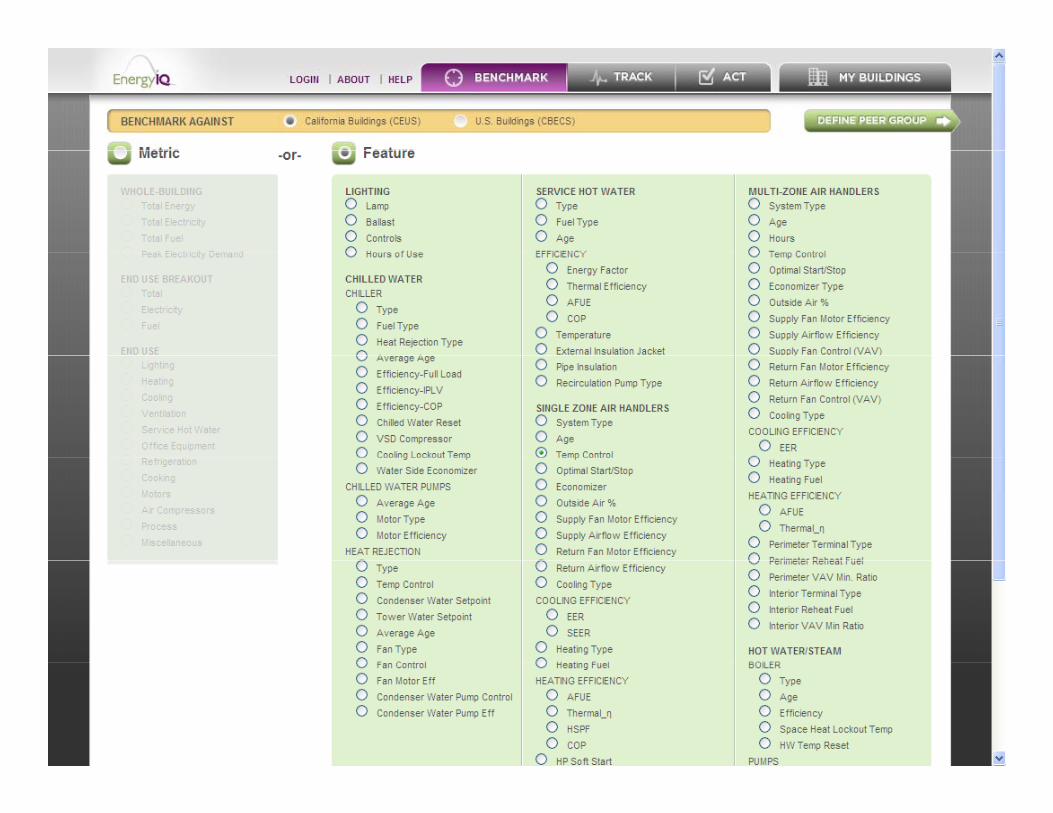
3. Enable (and motivate) users to select the peer group, metrics, and views that have meaning for them.
4. “Features” benchmarking is useful in addition to traditional “Energy” benchmarkingbenchmarking.
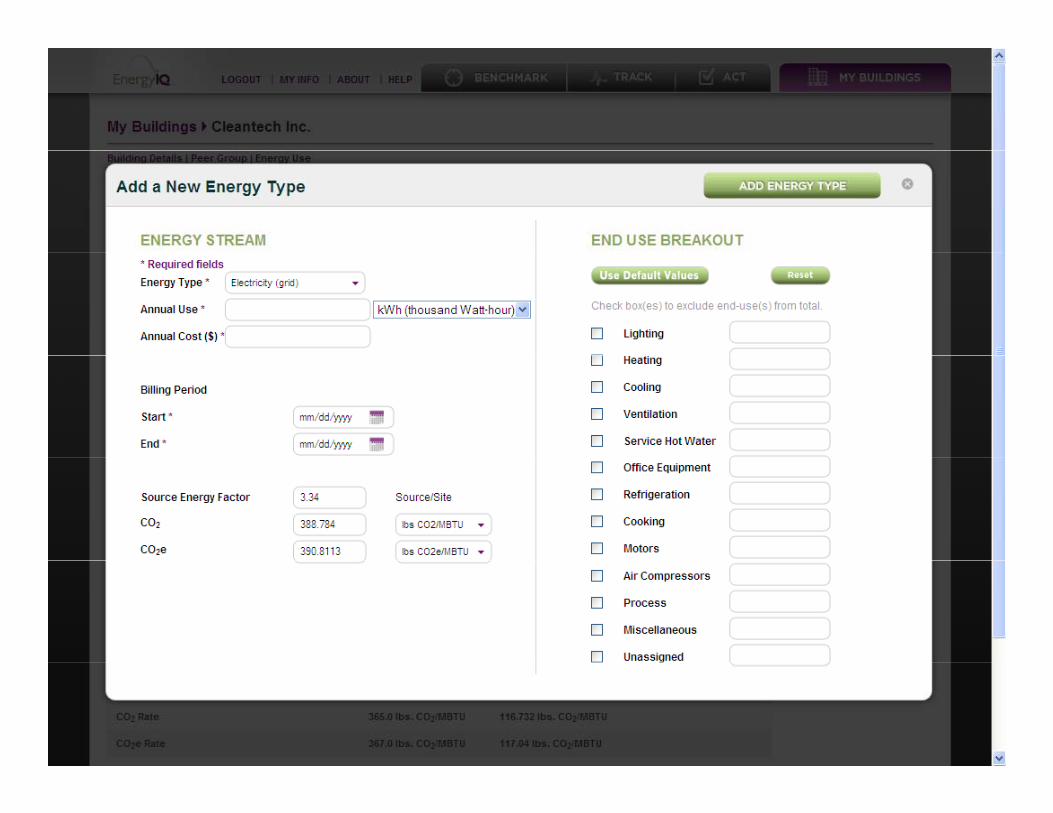
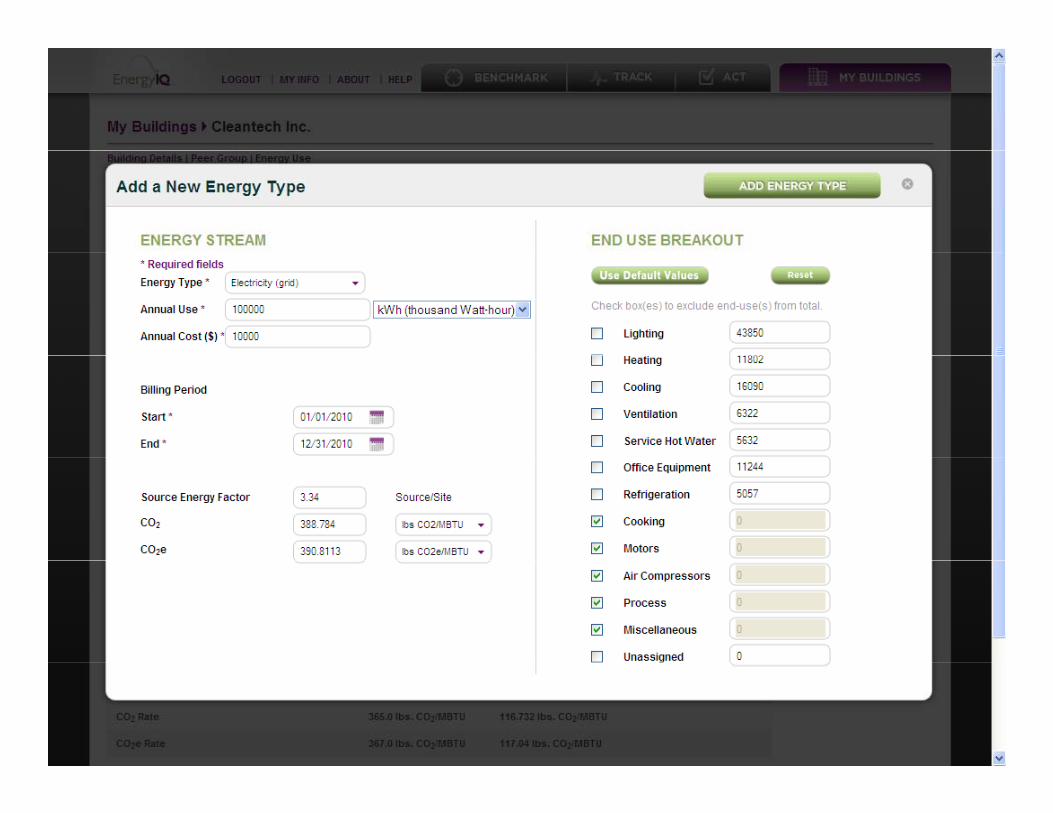
5. Offer benchmarking on the fly - only enter as much data as needed for desired results.
6 Build AOB system as a web service so that third parties (public or6. Build AOB system as a web service so that third parties (public or private) can build custom applications for their constituencies
7. Complement and interoperate with existing methods (e.g. Energy Star Portfolio Manager)
Peer Comparison Datasetsp
CEUS California CEUS - California– 2800 facilities– On-site survey of building features– End use data from calibrated simulation models
CBECS - National5215 facilities– 5215 facilities
– Less data on building features than CEUS– End use data from regression models
Other datasets (future)– High tech buildings – labs, cleanrooms, datacenters– User dataUser data
EnergyIQ Project Teamgy Q j
LBNL (prime) LBNL (prime)– Evan Mills, Paul Mathew, Martin Stoufer, Chris Havstad
Usability (usability analysis, user interface)y ( y y , )– Kath Straub, Karen Fojas Lee, Vinit Jain, Amy Sullivan
Itron (simulation module)R b t R i T M– Robert Ramirez, Tom Mayer
uTest (testing) William Bordass (expert review)William Bordass (expert review)

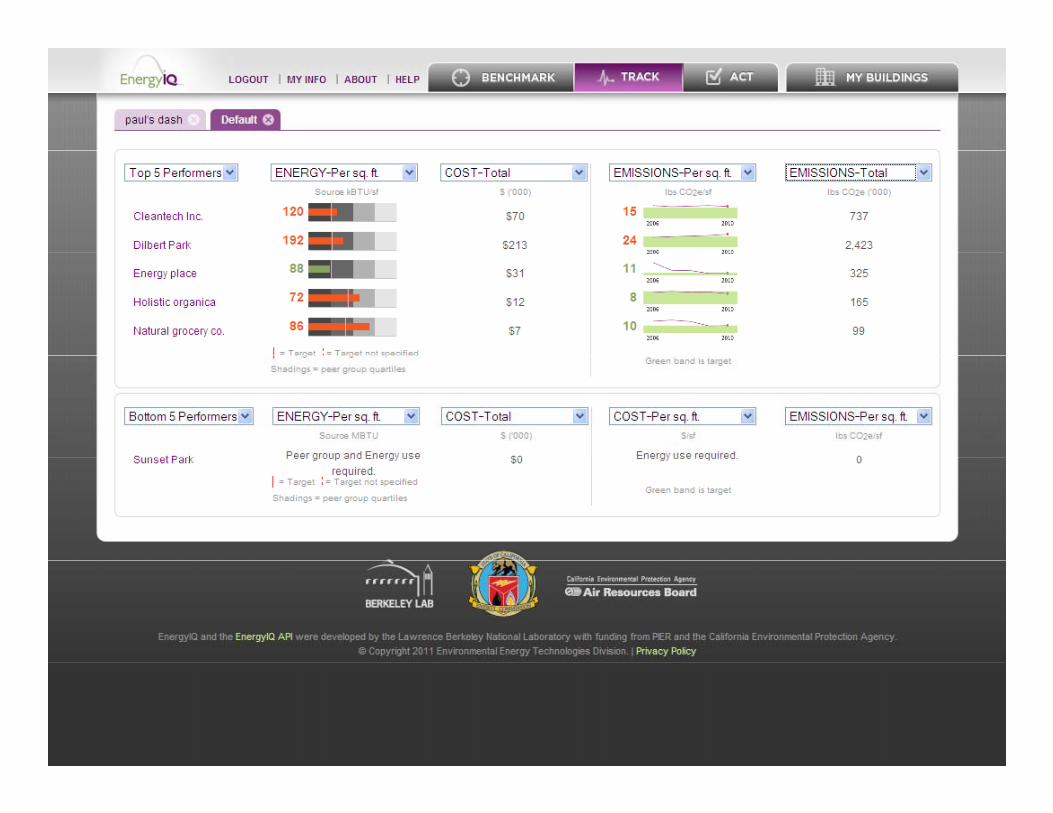
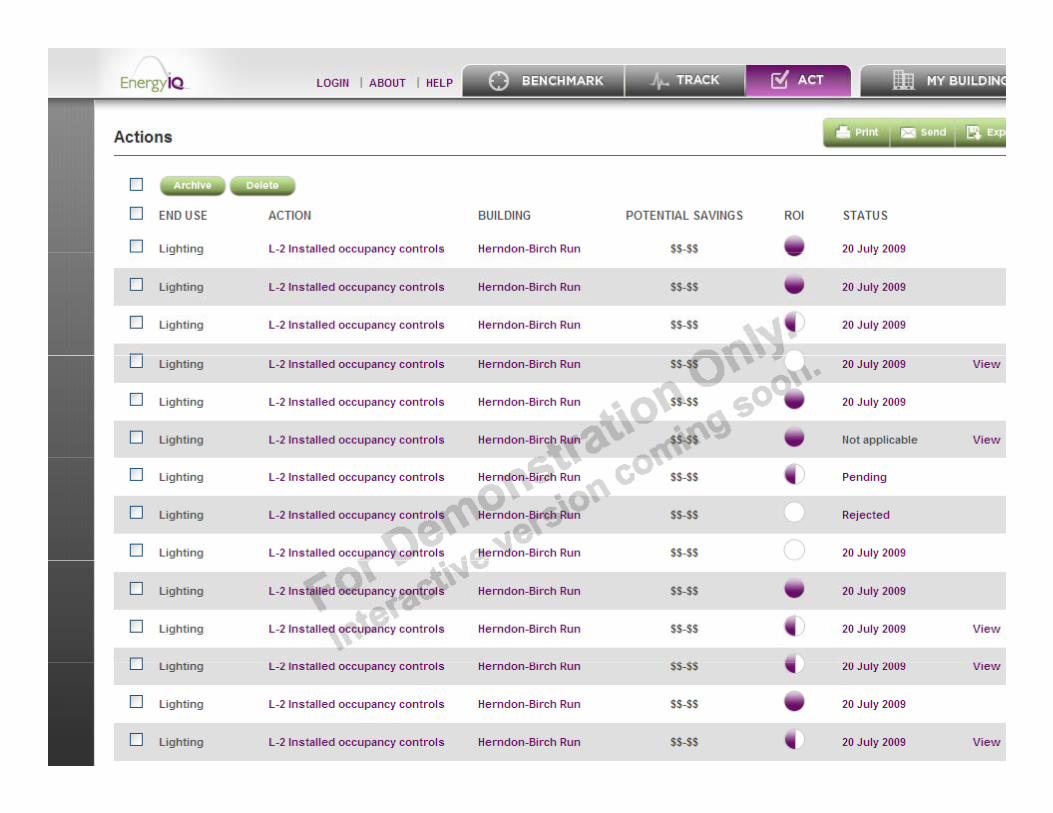
Energy IQ demodemo
http://energyiq.lbl.gov/


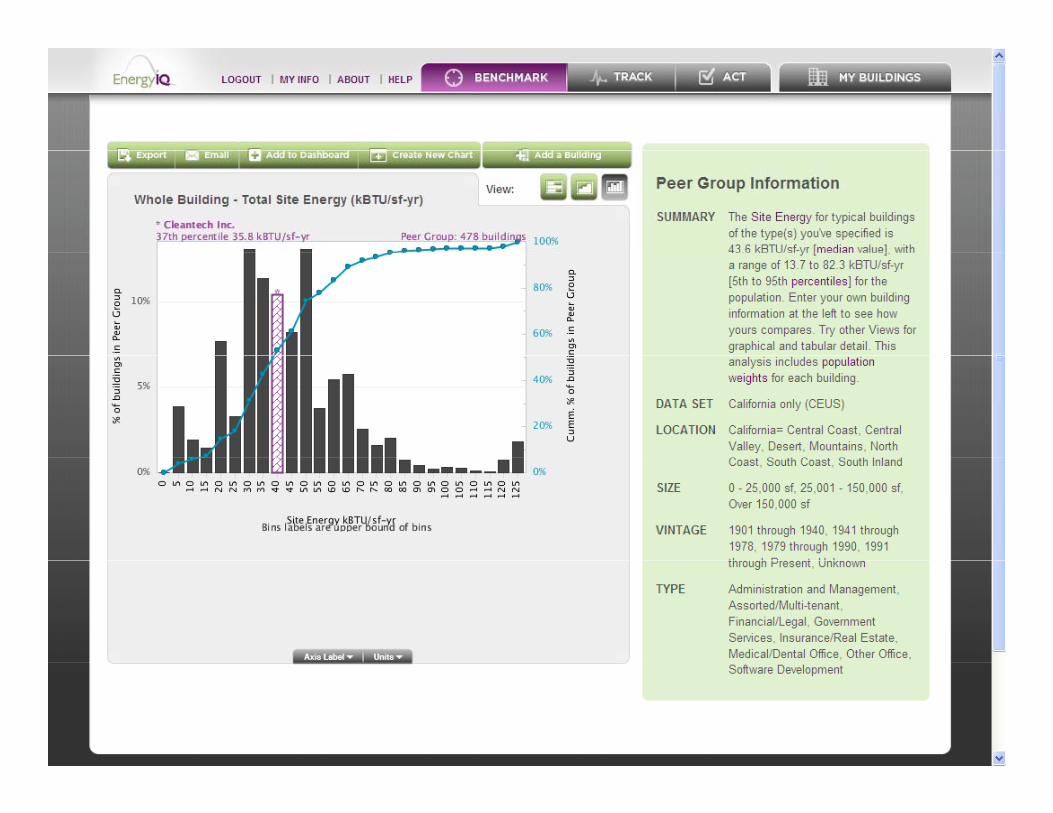
Summaryy
AOB provides quantitative measures for efficiency at AOB provides quantitative measures for efficiency at building and system level– Design: incorporate benchmarks in program documents
Operations se benchmarks to e al ate and track– Operations: use benchmarks to evaluate and track performance over time.
AOB is not “audit in a box” AOB is not “audit in a box”– AOB helps identify potential actions and prioritize areas for
more detailed analysis and audits.
Get Started with Action Oriented B h ki i Y O i tiBenchmarking in Your Organization
Define purpose of energy benchmarking Define purpose of energy benchmarking Set up benchmarking system
– Select metrics– Set benchmarks (levels of performance)– Set up practical data collection and analysis strategy
Consider integration with existing non energy Consider integration with existing non-energy benchmarking systems or KPIs
Define how information will be used– Benchmarking is a means to an end…. What will be done
with the information?
http://energyiq.lbl.gov/