mathematics - paterson.k12.nj.us curriculum guides... · 1 | p a g e mathematics pre-calculus: ......
TRANSCRIPT

1 | P a g e
MATHEMATICS
Pre-Calculus: Unit 1
Functions and Their Graphs
Polynomial, Rational, and Exponential Functions

2 | P a g e
Course Philosophy/Description
The high school Pre-calculus course covers mathematical topics ranging from Basics of Functions to Limits of Functions. It provides opportunities to
the students to expand their knowledge base and understanding of mathematics in general. The overarching goal of the course is to build a solid
foundation for the students who choose Mathematics, Engineering, Sciences, or Business as their college major and/or career options. The major
topics in the course such as, Polynomials, Exponents, Trigonometry, Logarithms, Complex numbers, Series/sequences, and Limits help generate
students’ inquiries about the mathematical nature, complexities, and applications of these topics in real-life situations. Students not only acquire new
knowledge, but also deepen their topical and overall understanding of the content for future transfer to new situations or other disciplines.
Assessment results from this course may be used for the purpose of placements into Calculus/AP Calculus, Statistics, Physics/AP Physics, or other
higher level courses.

3 | P a g e
ESL Framework
This ESL framework was designed to be used by bilingual, dual language, ESL and general education teachers. Bilingual and dual language
programs use the home language and a second language for instruction. ESL teachers and general education or bilingual teachers may use this
document to collaborate on unit and lesson planning to decide who will address certain components of the SLO and language objective. ESL teachers
may use the appropriate leveled language objective to build lessons for ELLs which reflects what is covered in the general education program. In this
way, whether it is a pull-out or push-in model, all teachers are working on the same Student Learning Objective connected to the Common Core
standard. The design of language objectives are based on the alignment of the World-Class Instructional Design Assessment (WIDA) Consortium’s
English Language Development (ELD) standards with the Common Core State Standards (CCSS). WIDA’s ELD standards advance academic
language development across content areas ultimately leading to academic achievement for English learners. As English learners are progressing
through the six developmental linguistic stages, this framework will assist all teachers who work with English learners to appropriately identify the
language needed to meet the requirements of the content standard. At the same time, the language objectives recognize the cognitive demand
required to complete educational tasks. Even though listening and reading (receptive) skills differ from speaking and writing (expressive) skills
across proficiency levels the cognitive function should not be diminished. For example, an Entering Level One student only has the linguistic ability
to respond in single words in English with significant support from their home language. However, they could complete a Venn diagram with single
words which demonstrates that they understand how the elements compare and contrast with each other or they could respond with the support of
their home language (L1) with assistance from a teacher, para-professional, peer or a technology program.
http://www.state.nj.us/education/modelcurriculum/ela/ELLOverview.pdf
4 | P a g e
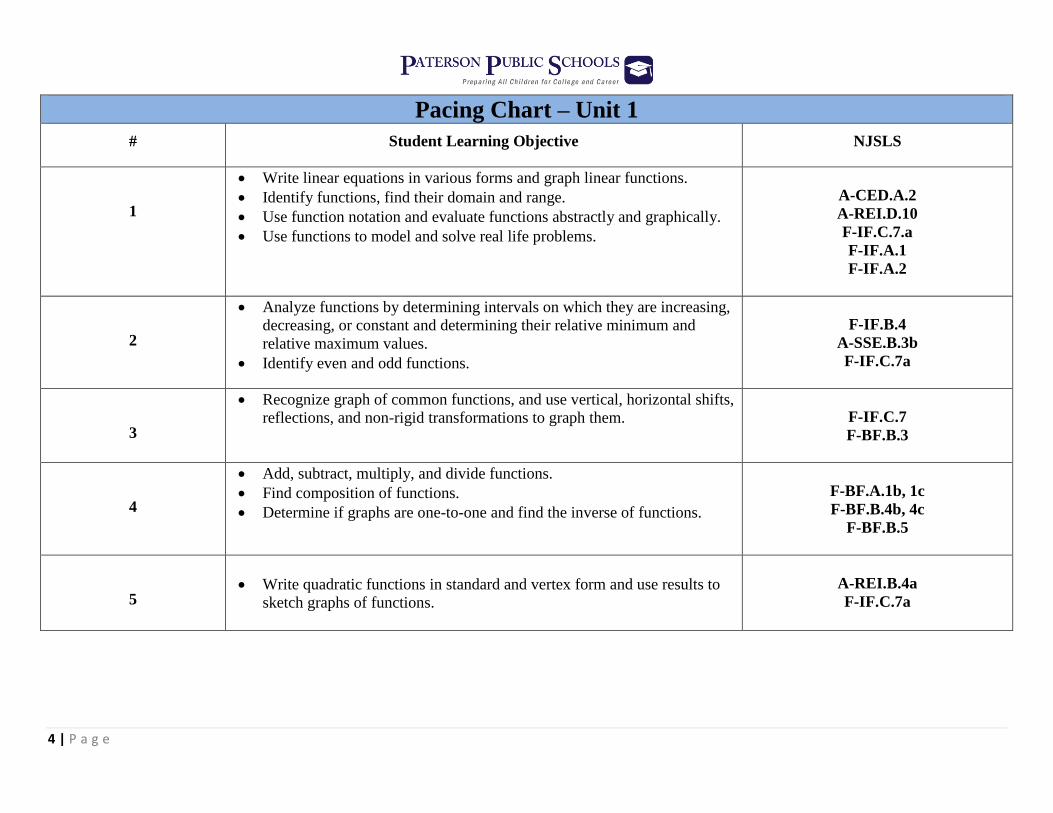
Pacing Chart – Unit 1
# Student Learning Objective NJSLS
1
Write linear equations in various forms and graph linear functions.
Identify functions, find their domain and range.
Use function notation and evaluate functions abstractly and graphically.
Use functions to model and solve real life problems.
A-CED.A.2
A-REI.D.10
F-IF.C.7.a
F-IF.A.1
F-IF.A.2
2
Analyze functions by determining intervals on which they are increasing,
decreasing, or constant and determining their relative minimum and
relative maximum values.
Identify even and odd functions.
F-IF.B.4
A-SSE.B.3b
F-IF.C.7a
3
Recognize graph of common functions, and use vertical, horizontal shifts,
reflections, and non-rigid transformations to graph them.
F-IF.C.7
F-BF.B.3
4
Add, subtract, multiply, and divide functions.
Find composition of functions.
Determine if graphs are one-to-one and find the inverse of functions.
F-BF.A.1b, 1c
F-BF.B.4b, 4c
F-BF.B.5
5
Write quadratic functions in standard and vertex form and use results to
sketch graphs of functions.
A-REI.B.4a
F-IF.C.7a

5 | P a g e
Pacing Chart – Unit 1
6
Analyze polynomial functions by finding all zeros including complex
ones using the Fundamental Theorem of Algebra, factoring, and graphing
them, both manually and using technology.
A-SSE.B.3a
A-APR.B.3
F-IF.C.7, 8a
N-CN.C.7, C.9
A-REI.B.4b
7
Use long division and synthetic division to divide polynomials.
A-APR.D.6
8
Analyze rational functions by finding all horizontal, vertical and slanted
asymptotes and graphing them, both manually and using technology.
Use polynomial and rational functions to model and solve real-life
problems including ones with minimum and maximum values.
F.IF.C.7a, 7d
F-BF.A.1
S-ID.B.6a
A-SSE.B.3b
F-IF.B.4,

6 | P a g e
Research about Teaching and Learning Mathematics Structure teaching of mathematical concepts and skills around problems to be solved (Checkly, 1997; Wood & Sellars, 1996; Wood & Sellars, 1997)
Encourage students to work cooperatively with others (Johnson & Johnson, 1975; Davidson, 1990)
Use group problem-solving to stimulate students to apply their mathematical thinking skills (Artzt & Armour-Thomas, 1992)
Students interact in ways that support and challenge one another’s strategic thinking (Artzt, Armour-Thomas, & Curcio, 2008)
Activities structured in ways allowing students to explore, explain, extend, and evaluate their progress (National Research Council, 1999)
There are three critical components to effective mathematics instruction (Shellard & Moyer, 2002):
Teaching for conceptual understanding
Developing children’s procedural literacy
Promoting strategic competence through meaningful problem-solving investigations
Teachers should be:
Demonstrating acceptance and recognition of students’ divergent ideas.
Challenging students to think deeply about the problems they are solving, extending thinking beyond the solutions and algorithms
required to solve the problem
Influencing learning by asking challenging and interesting questions to accelerate students’ innate inquisitiveness and foster them to
examine concepts further.
Projecting a positive attitude about mathematics and about students’ ability to “do” mathematics
Students should be:
Actively engaging in “doing” mathematics
Solving challenging problems
Investigating meaningful real-world problems
Making interdisciplinary connections
Developing an understanding of mathematical knowledge required to “do” mathematics and connect the language of mathematical
ideas with numerical representations
Sharing mathematical ideas, discussing mathematics with one another, refining and critiquing each other’s ideas and understandings
Communicating in pairs, small group, or whole group presentations
Using multiple representations to communicate mathematical ideas
Using connections between pictures, oral language, written symbols, manipulative models, and real-world situations
Using technological resources and other 21st century skills to support and enhance mathematical understanding

7 | P a g e
Mathematics is not a stagnate field of textbook problems; rather, it is a dynamic way of constructing meaning about the world around
us, generating knowledge and understanding about the real world every day. Students should be metaphorically rolling up their
sleeves and “doing mathematics” themselves, not watching others do mathematics for them or in front of them. (Protheroe, 2007)
Conceptual-Based Model
The purpose of the Conceptual-Based Model is to allow students the time to explore mathematical concepts to promote academic rigor and high level
of student discourse to concurrently develop conceptual understanding, procedural fluency, and problem-solving skills. During the 90 minute block
of mathematics instruction, teachers will select and set up a mathematical task that targets the mathematical goal(s) for the lesson. The teacher sets
the stage for learning by ensuring the objective/rationale of the lesson is well-defined and connected to the task. The task should build on student’s
prior knowledge, life experiences, and culture allowing students to share their prior knowledge and life/cultural experiences as it relates to the task to
ensure that students understand the context of the problem. The instructional goal is to introduce the activity/task to the students allowing them to
have access to learning while maintaining the cognitive demands of the task. Teachers will then support the students’ exploration of the task; this can
be done independently, in pairs or in small groups or a combination of all. It is highly recommended that students be given the opportunity to
privately work on a task to generate solutions on their own. Students are encouraged to share their findings with their peers in small group to
compare their solutions. As students are actively engaged in constructing meaning of the mathematical concept(s) being taught and communicating
their understanding of the concept(s) with their peers, the teacher monitors the development of student understanding by observing student thinking
and using questions to stimulate thinking to drive students toward the aimed mathematical goal(s). The teacher assesses students’ understanding of
key mathematical ideas, problem-solving strategies, and the use of and connection between models and representations to determine what the student
knows. The teacher advances the students’ understanding to move the student beyond their present thinking and expand what they know to an
additional situation. Teachers have been trained to strategically select groups of students who have different solution paths to the same task, different
representations and errors/misconceptions to share, discuss, and analyze as a whole group. By providing these instructional opportunities, the teacher
will then be able to orchestrate the class discussion by providing students with the opportunities to make their learning public as students share,
discuss, analyze, clarify, extend, connect, strengthen, and record their thinking strategies. After students discuss, justify, and challenge the various
solution paths that were shared, a summary of the learning is articulated and connected to the objective of the lesson. Students should be given an
opportunity to close the lesson with a reflection on their learning.

8 | P a g e
Effective Pedagogical Routines/Instructional Strategies
Collaborative Problem Solving
Connect Previous Knowledge to New Learning
Making Thinking Visible
Develop and Demonstrate Mathematical Practices
Inquiry-Oriented and Exploratory Approach
Multiple Solution Paths and Strategies
Use of Multiple Representations
Explain the Rationale of your Math Work
Quick Writes
Pair/Trio Sharing
Turn and Talk
Charting
Gallery Walks
Small Group and Whole Class Discussions
Student Modeling
Analyze Student Work
Identify Student’s Mathematical Understanding
Identify Student’s Mathematical Misunderstandings
Interviews
Role Playing
Diagrams, Charts, Tables, and Graphs
Anticipate Likely and Possible Student Responses
Collect Different Student Approaches
Multiple Response Strategies
Asking Assessing and Advancing Questions
Revoicing
Marking
Recapping
Challenging
Pressing for Accuracy and Reasoning
Maintain the Cognitive Demand

9 | P a g e
Educational Technology
Standards
8.1.12.A.4, 8.1.12.D.5, 8.1.12.E.1, 8.1.12.F.1
Technology Operations and Concepts
Construct a spreadsheet workbook with multiple worksheets, rename tabs to reflect the data on the worksheet, and use mathematical or
logical functions, charts and data from all worksheets to convey the results.
Example: Students will be able to define functions by a recursive process, which can be displayed effectively using a spreadsheet or other
technology.
Digital Citizenship
Analyze the capabilities and limitations of current and emerging technology resources and assess their potential to address personal,
social, lifelong learning and career needs.
Example: Students will be able to use critical thinking skills to plan and conduct, research, manage p[projects, solve problems, and male
informed decisions using appropriate digital tools and resource.
Research and Information Literacy
Produce a position statement about a real world problem by developing a systematic plan of investigation with peers and experts
synthesizing information from multiple sources.
Example: Students will be able to produce a position statement about a real world problem by developing a systematic plan of
investigation with peers and experts synthesizing information from multiple sources.
Critical Thinking, Problem Solving, Decision Making
Evaluate the strengths and limitations of emerging technologies and their impact on educational, career, personal and or social needs.
Example: A problem-solving approach will allow students to construct their own ideas about mathematics and take responsibility for their
own learning.
10 | P a g e
Career Ready Practices
Career Ready Practices describe the career-ready skills that all educators in all content areas should seek to develop in their students. They are
practices that have been linked to increase college, career, and life success. Career Ready Practices should be taught and reinforced in all career
exploration and preparation programs with increasingly higher levels of complexity and expectation as a student advances through a program of
study.
CRP2. Apply appropriate academic and technical skills.
Career-ready individuals readily access and use the knowledge and skills acquired through experience and education to be more productive. They make
connections between abstract concepts with real-world applications, and they make correct insights about when it is appropriate to apply the use of an
academic skill in a workplace situation
Example: Students will use technology to acquire, manipulate, analyze and report data, display and communicate STEM information and apply
science and mathematical concepts to the development of plans, processes and projects that address real world problems.
CRP8. Utilize critical thinking to make sense of problems and persevere in solving them.
Career-ready individuals readily recognize problems in the workplace, understand the nature of the problem, and devise effective plans to solve the
problem. They are aware of problems when they occur and take action quickly to address the problem; they thoughtfully investigate the root cause of
the problem prior to introducing solutions. They carefully consider the options to solve the problem. Once a solution is agreed upon, they follow
through to ensure the problem is solved, whether through their own actions or the actions of others.
Example: Throughout this unit, students work to improve their critical-thinking skills and problem-solving techniques.
CRP11. Use technology to enhance productivity.
Career-ready individuals find and maximize the productive value of existing and new technology to accomplish workplace tasks and solve workplace
problems. They are flexible and adaptive in acquiring new technology. They are proficient with ubiquitous technology applications. They understand
the inherent risks-personal and organizational-of technology applications, and they take actions to prevent or mitigate these risks.
Example: Students will use digital tools such as TI-83/84/89, Interactive Whiteboard, etc. to access, manage, evaluate, and synthesize information in
order to solve problems individually and collaboratively to create an communicate knowledge.

11 | P a g e
WIDA Proficiency Levels
At the given level of English language proficiency, English language learners will process, understand, produce or use
6- Reaching
Specialized or technical language reflective of the content areas at grade level
A variety of sentence lengths of varying linguistic complexity in extended oral or written discourse as required
by the specified grade level
Oral or written communication in English comparable to proficient English peers
5- Bridging
Specialized or technical language of the content areas
A variety of sentence lengths of varying linguistic complexity in extended oral or written discourse, including
stories, essays or reports
Oral or written language approaching comparability to that of proficient English peers when presented with
grade level material.
4- Expanding
Specific and some technical language of the content areas
A variety of sentence lengths of varying linguistic complexity in oral discourse or multiple, related sentences or
paragraphs
Oral or written language with minimal phonological, syntactic or semantic errors that may impede the
communication, but retain much of its meaning, when presented with oral or written connected discourse, with
sensory, graphic or interactive support
3- Developing
General and some specific language of the content areas
Expanded sentences in oral interaction or written paragraphs
Oral or written language with phonological, syntactic or semantic errors that may impede the communication,
but retain much of its meaning, when presented with oral or written, narrative or expository descriptions with
sensory, graphic or interactive support
2- Beginning
General language related to the content area
Phrases or short sentences
Oral or written language with phonological, syntactic, or semantic errors that often impede of the
communication when presented with one to multiple-step commands, directions, or a series of statements with
sensory, graphic or interactive support
1- Entering
Pictorial or graphic representation of the language of the content areas
Words, phrases or chunks of language when presented with one-step commands directions, WH-, choice or
yes/no questions, or statements with sensory, graphic or interactive support

12 | P a g e
Differentiated Instruction
Accommodate Based on Students Individual Needs: Strategies
Time/General
Extra time for assigned tasks
Adjust length of assignment
Timeline with due dates for
reports and projects
Communication system
between home and school
Provide lecture notes/outline
Processing
Extra Response time
Have students verbalize steps
Repeat, clarify or reword
directions
Mini-breaks between tasks
Provide a warning for
transitions
Reading partners
Comprehension
Precise processes for
conceptual model
Short manageable tasks
Brief and concrete directions
Provide immediate feedback
Small group instruction
Emphasize multi-sensory
learning
Recall
Teacher-made checklist
Use visual graphic organizers
Reference resources to
promote independence
Visual and verbal reminders
Graphic organizers
Assistive Technology
Computer/whiteboard
Tape recorder
Video Tape
Tests/Quizzes/Grading
Extended time
Study guides
Shortened tests
Read directions aloud
Behavior/Attention
Consistent daily structured
routine
Simple and clear classroom
rules
Frequent feedback
Organization
Individual daily planner
Display a written agenda
Note-taking assistance
Color code materials
13 | P a g e
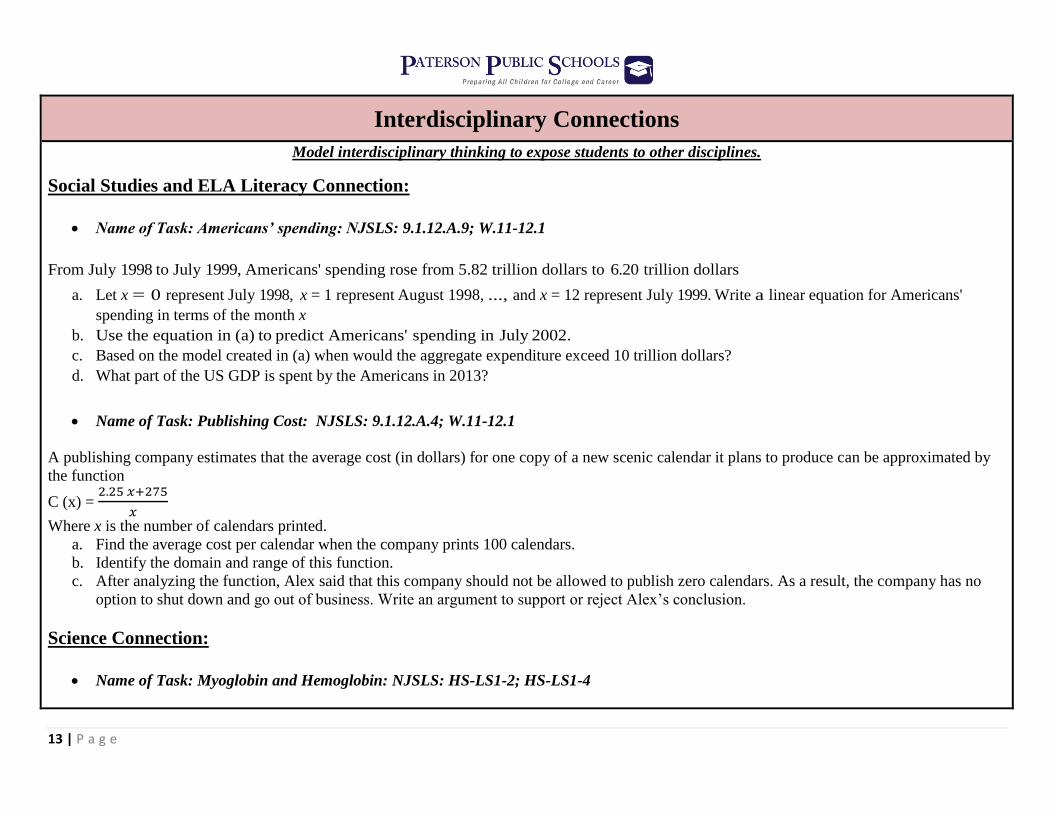
Interdisciplinary Connections
Model interdisciplinary thinking to expose students to other disciplines.
Social Studies and ELA Literacy Connection:
Name of Task: Americans’ spending: NJSLS: 9.1.12.A.9; W.11-12.1
From July 1998 to July 1999, Americans' spending rose from 5.82 trillion dollars to 6.20 trillion dollars
a. Let x = 0 represent July 1998, x = 1 represent August 1998, ..., and x = 12 represent July 1999. Write a linear equation for Americans'
spending in terms of the month x
b. Use the equation in (a) to predict Americans' spending in July 2002.
c. Based on the model created in (a) when would the aggregate expenditure exceed 10 trillion dollars?
d. What part of the US GDP is spent by the Americans in 2013?
Name of Task: Publishing Cost: NJSLS: 9.1.12.A.4; W.11-12.1
A publishing company estimates that the average cost (in dollars) for one copy of a new scenic calendar it plans to produce can be approximated by
the function
C (x) = 2.25 𝑥+275
𝑥
Where x is the number of calendars printed.
a. Find the average cost per calendar when the company prints 100 calendars.
b. Identify the domain and range of this function.
c. After analyzing the function, Alex said that this company should not be allowed to publish zero calendars. As a result, the company has no
option to shut down and go out of business. Write an argument to support or reject Alex’s conclusion.
Science Connection:
Name of Task: Myoglobin and Hemoglobin: NJSLS: HS-LS1-2; HS-LS1-4

14 | P a g e
Interdisciplinary Connections
Myoglobin and hemoglobin are oxygen-carrying molecules in the human body. Hemoglobin is found inside red blood cells, which flow from the
lungs to the muscles through the bloodstream. Myoglobin is found in muscle cells. The function 𝑌 = 𝑀(𝑝) =𝑃
1+𝑃 calculates the fraction of
myoglobin saturated with oxygen at a given presure p Torrs. For example, at a pressure of 1 Torr, M(1) = 0.5, which means half of the myoglobin
(i.e. 50%) is oxygen saturated. (Note: More precisely, you need to use something called the “partial pressure”, but the distinction is not important for
this problem.) Likewise, the function calculates the fraction of hemoglobin saturated with oxygen at a given pressure p. [UW]
a. The graphs of M(P) and H(P) are given here on the domain 0 ≤ 𝑝 ≤ 100
Which is which?
b. If the pressure in the lungs is 100 Torrs, what is the level of oxygen saturation of the hemoglobin in the lungs?
c. The pressure in an active muscle is 20 Torrs. What is the level of oxygen saturation of myoglobin in an active muscle? What is the level of
hemoglobin in an active muscle?
d. Define the efficiency of oxygen transport at a given pressure p to be M(p) – H(p) . What is the oxygen transport efficiency at 20 Torrs? At 40
Torrs? At 60 Torrs? Sketch the graph of M(p) – H(p) ; are there conditions under which transport efficiency is maximized (explain)?

15 | P a g e
Interdisciplinary Connections
Business Connection :
Name of Task: Minimize the metal in a can: NJSLS: 9.1.12.A.4; W.11-12.1
A manufacturer wants to manufacture a metal can that holds 1000 cm3 of oil. The can is in the shape of a right cylinder with a radius r and height h.
Assume the thickness of the material used to make the metal can is negligible.
For each question, include correct units of measurement and round your answers to the nearest tenth. Using your knowledge of volume and surface
area of a right cylinder, write a function S(r) that represents the surface area of the cylindrical can in terms of the radius, r, of its base. Show in detail
your algebraic thinking.
1. Sketch the graph of S(r) and show key features of the graph. State any restriction on the value of r so that it represents the physical model of
the can
2. What dimensions will minimize the quantity of metal needed to manufacture the cylindrical can? Show in detail your mathematical solution.
3. Calculate the minimum value of the function S(r) and interpret the result in the context of the physical model. Show the mathematical steps
you used to obtain the answer.
Name of Task: Chemco Manufacturing: NJSLS: 9.1.12.A.4; W.11-12.1
Chemco Manufacturing estimates that its profit P in hundreds of dollars is where x is the number of units produced in thousands.
a. How many units must be produced to obtain the maximum profit?
b. Graph the profit function and identify its vertex.
c. An increase in productivity increased profit by $7 at each quantity sold. What kind of a transformation would model this situation? Show your
work graphically and algebraically.
d. A decrease in marginal cost lead to a 4 units increase in the optimum level of production. What kind of a transformation would model this
situation? Show your work graphically and algebraically.
* Tasks can be found within the additional task folders.
P x x 4 40 32

16 | P a g e
Enrichment
What is the purpose of Enrichment?
The purpose of enrichment is to provide extended learning opportunities and challenges to students who have already mastered, or can quickly master, the
basic curriculum. Enrichment gives the student more time to study concepts with greater depth, breadth, and complexity.
Enrichment also provides opportunities for students to pursue learning in their own areas of interest and strengths.
Enrichment keeps advanced students engaged and supports their accelerated academic needs.
Enrichment provides the most appropriate answer to the question, “What do you do when the student already knows it?”
Enrichment is…
Planned and purposeful
Different, or differentiated, work – not just more work
Responsive to students’ needs and situations
A promotion of high-level thinking skills and making connections
within content
The ability to apply different or multiple strategies to the content
The ability to synthesize concepts and make real world and cross-
curricular connections.
Elevated contextual complexity
Sometimes independent activities, sometimes direct instruction
Inquiry based or open ended assignments and projects
Using supplementary materials in addition to the normal range
of resources.
Choices for students
Tiered/Multi-level activities with
Flexible groups (may change daily or
weekly)
Enrichment is not…
Just for gifted students (some gifted students may need
intervention in some areas just as some other students may need
frequent enrichment)
Worksheets that are more of the same (busywork)
Random assignments, games, or puzzles not connected to the
content areas or areas of student interest
Extra homework
A package that is the same for everyone
Thinking skills taught in isolation
Unstructured free time

17 | P a g e
Assessments
Required District/State Assessments SGO Baseline Assessment
SGO Post Assessment
Suggested Formative/Summative Classroom Assessments Describe Learning Vertically
Identify Key Building Blocks
Make Connections (between and among key building blocks)
Short/Extended Constructed Response Items
Multiple-Choice Items (where multiple answer choices may be correct)
Drag and Drop Items
Use of Equation Editor
Quizzes
Journal Entries/Reflections/Quick-Writes
Accountable talk
Projects
Portfolio
Observation
Graphic Organizers/ Concept Mapping
Presentations
Role Playing
Teacher-Student and Student-Student Conferencing
Homework

18 | P a g e
New Jersey Student Learning Standards
A.CED.A.2: Create equations in two or more variables to represent relationships between quantities; graph equations on coordinate axes with labels and scales.
A.APR.B.3: Identity zeros of polynomials when suitable factorizations are available, and use the zeros to construct a rough graph of the function defined by the
polynomial.
A.APR.D.6: Rewrite simple rational expressions in different forms; write a(x)/b(x) in the form q(x) + r(x)/b(x), where a(x), b(x), q(x), and r(x) are polynomials
with the degree of r(x) less than the degree of b(x), using inspection, long division, or, for the more complicated examples, a computer algebra system.
A.REI.D.10: Understand that the graph of an equation in two variables is the set of all its solutions plotted in the coordinate plane, often forming a curve (which
could be a line).
A.REI.B.4a: Use the method of completing the square to transform any quadratic equation in x into an equation of the form (x – p)2= q that has the same solutions.
Derive the quadratic formula from this form.
A.REI.B.4b: Solve quadratic equations by inspection (e.g., for x2 = 49), taking square roots, completing the square, the quadratic formula and factoring, as
appropriate to the initial form of the equation. Recognize when the quadratic formula gives complex solutions and write them as a ± bi for real numbers a and b.
A.SSE.B.3a: Factor a quadratic expression to find real the zeros of the function it defines
A.SSE.B.3b: Complete the square in a quadratic expression to reveal the maximum or minimum value of the function it defines.
F.BF.A.1: Write a function that describes a relationship between two quantities.
F.BF.B.5: Understand the inverse relationship between exponents and logarithms and use this relationship to solve problems involving logarithms and exponents.
F.IF.A.1: Understand that a function from one set (called the domain) to another set (called the range) assigns to each element of the domain exactly one element
of the range. If f is a function and x is an element of its domain, then f(x) denotes the output of f corresponding to the input x. The graph of f is the graph of the
equation y = f(x).
F.IF.A.2: Use function notation, evaluate functions for inputs in their domains, and interpret statements that use function notation in terms of a context.
F.IF.B.4: For a function that models a relationship between two quantities, interpret key features of graphs and tables in terms of the quantities, and sketch graphs
showing key features given a verbal description of the relationship. Key features include: intercepts; intervals where the function is increasing, decreasing,
positive, or negative; relative maximums and minimums; symmetries; end behavior; and periodicity.
19 | P a g e
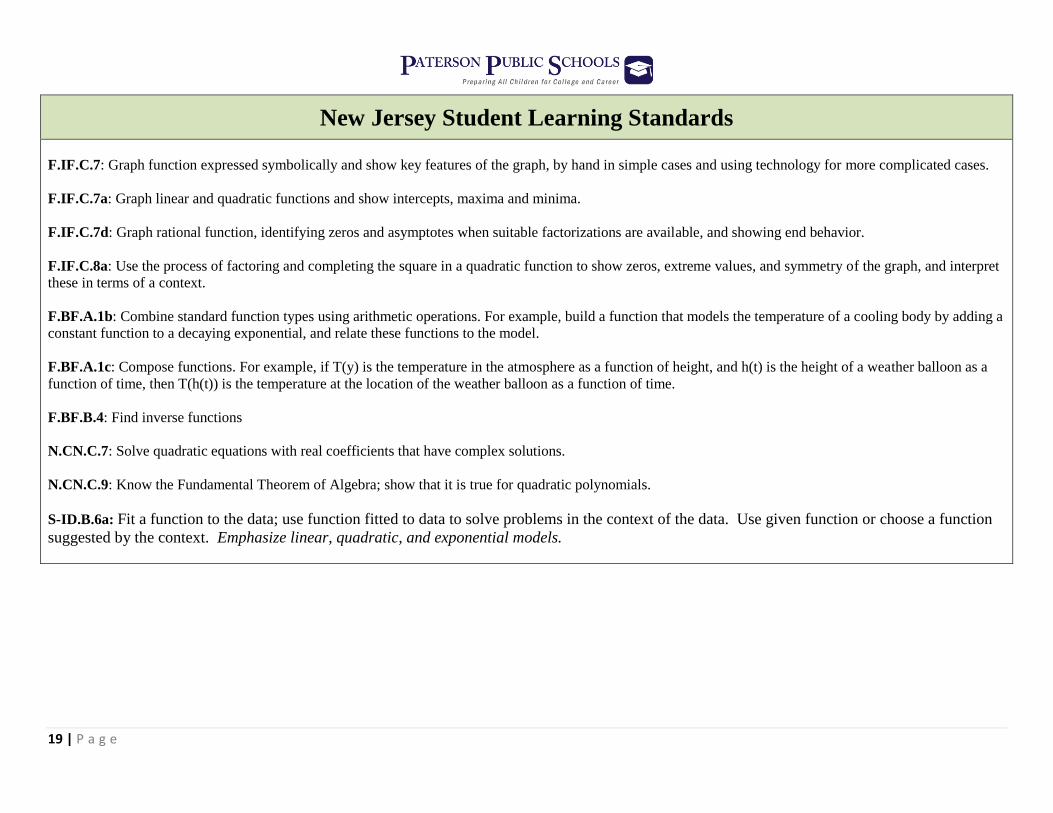
New Jersey Student Learning Standards
F.IF.C.7: Graph function expressed symbolically and show key features of the graph, by hand in simple cases and using technology for more complicated cases.
F.IF.C.7a: Graph linear and quadratic functions and show intercepts, maxima and minima.
F.IF.C.7d: Graph rational function, identifying zeros and asymptotes when suitable factorizations are available, and showing end behavior.
F.IF.C.8a: Use the process of factoring and completing the square in a quadratic function to show zeros, extreme values, and symmetry of the graph, and interpret
these in terms of a context.
F.BF.A.1b: Combine standard function types using arithmetic operations. For example, build a function that models the temperature of a cooling body by adding a
constant function to a decaying exponential, and relate these functions to the model.
F.BF.A.1c: Compose functions. For example, if T(y) is the temperature in the atmosphere as a function of height, and h(t) is the height of a weather balloon as a
function of time, then T(h(t)) is the temperature at the location of the weather balloon as a function of time.
F.BF.B.4: Find inverse functions
N.CN.C.7: Solve quadratic equations with real coefficients that have complex solutions.
N.CN.C.9: Know the Fundamental Theorem of Algebra; show that it is true for quadratic polynomials.
S-ID.B.6a: Fit a function to the data; use function fitted to data to solve problems in the context of the data. Use given function or choose a function
suggested by the context. Emphasize linear, quadratic, and exponential models.

20 | P a g e
Mathematical Practices
1. Make sense of problems and persevere in solving them.
2. Reason abstractly and quantitatively.
3. Construct viable arguments and critique the reasoning of others.
4. Model with mathematics.
5. Use appropriate tools strategically.
6. Attend to precision.
7. Look for and make use of structure.
8. Look for and express regularity in repeated reasoning

21 | P a g e
Course: Pre-Calculus
Unit: 1 Topic: Functions and Their Graphs
Polynomial, Rational, and Exponential Functions
NJSLS: A.CED.A.2, A.REI.D.10, F.IF.C.7A, F.IF.A.1, F.IF.A.2, F.LE.A.1, F. BF. A.1c, F.IF.B.4, A.SSE.B.3b, F.BF.B.3, F.IF.C.7, F.BF.A.1b,
F.BF.C.4c, F.BF.C.4, F.BF.C.5, S.ID.B.6c, A.APR.B.3, A.APR.D.6, A-REI.B.4a, A.REI.B.4b, A.SSE.B.3a, A.SSE.B.3b, F.BF.A.1, F.IF.B.4,
F.IF.C.7, F.IF.C.7a, F.IF.C.7d, F.IF.C.7e, F.IF.C.8a, N.CN.C.7, N.CN.C.9, S.ID.B.6a
Unit Focus:
Understand the concept of a function and use function notation
Interpret functions that arise in applications in terms of the context
Understand the concept of a non-linear function and use function notation
Interpret non-linear functions that arise in applications in terms of the context
Write a function defined by an expression in different but equivalent forms to reveal and explain different properties of the function
Understand that the zeroes of polynomials are related to the factors of the polynomials and that the zeroes represent one key feature used in
graphing polynomial
New Jersey Student Learning Standard(s):
A.CED.A.2: Create equations in two or more variables to represent relationships between quantities; graph equations on coordinate axes with labels
and scales.
A.REI.D.10: Understand that the graph of an equation in two variables is the set of all its solutions plotted in the coordinate plane, often forming a
curve (which could be a line).
F.IF.C.7a: Graph linear and quadratic functions and show intercepts, maxima and minima.
F.IF.A.1: Understand that a function from one set (called the domain) to another set (called the range) assigns to each element of the domain exactly
one element of the range. If f is a function and x is an element of its domain, then f(x) denotes the output of f corresponding to the input x. The graph
of f is the graph of the equation y = f(x).
22 | P a g e
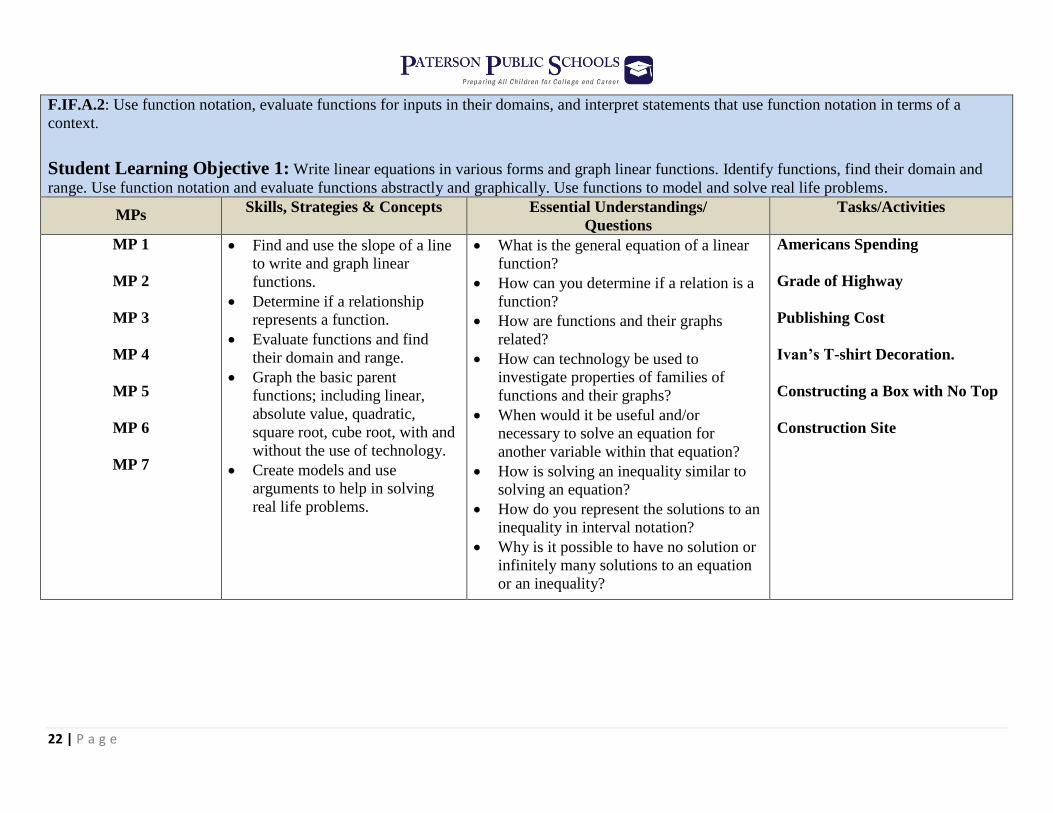
F.IF.A.2: Use function notation, evaluate functions for inputs in their domains, and interpret statements that use function notation in terms of a
context.
Student Learning Objective 1: Write linear equations in various forms and graph linear functions. Identify functions, find their domain and
range. Use function notation and evaluate functions abstractly and graphically. Use functions to model and solve real life problems.
MPs Skills, Strategies & Concepts Essential Understandings/
Questions
Tasks/Activities
MP 1
MP 2
MP 3
MP 4
MP 5
MP 6
MP 7
Find and use the slope of a line
to write and graph linear
functions.
Determine if a relationship
represents a function.
Evaluate functions and find
their domain and range.
Graph the basic parent
functions; including linear,
absolute value, quadratic,
square root, cube root, with and
without the use of technology.
Create models and use
arguments to help in solving
real life problems.
What is the general equation of a linear
function?
How can you determine if a relation is a
function?
How are functions and their graphs
related?
How can technology be used to
investigate properties of families of
functions and their graphs?
When would it be useful and/or
necessary to solve an equation for
another variable within that equation?
How is solving an inequality similar to
solving an equation?
How do you represent the solutions to an
inequality in interval notation?
Why is it possible to have no solution or
infinitely many solutions to an equation
or an inequality?
Americans Spending
Grade of Highway
Publishing Cost
Ivan’s T-shirt Decoration.
Constructing a Box with No Top
Construction Site

23 | P a g e
New Jersey Student Learning Standard(s): F.IF.B.4: For a function that models a relationship between two quantities, interpret key features of graphs and tables in terms of the quantities, and
sketch graphs showing key features given a verbal description of the relationship. Key features include: intercepts; intervals where the function is
increasing, decreasing, positive, or negative; relative maximums and minimums; symmetries; end behavior; and periodicity.
A.SSE.B.3b: Complete the square in a quadratic expression to reveal the maximum or minimum value of the function it defines.
F.IF.C.7a: Graph linear and quadratic functions and show intercepts, maxima and minima.
Student Learning Objective 2: Analyze functions by determining intervals on which they are increasing, decreasing, or constant and
determining their relative minimum and relative maximum values. Identify even and odd functions.
MPs Skills, Strategies & Concepts Essential Understandings/
Questions
Tasks/Activities
MP 2
MP 3
MP 5
Analyze the graph and identify
positive and negative values of
y.
Find the zeros of the functions.
Identify increasing and
decreasing intervals.
Find the maximum and
minimum of the functions in a
given interval.
Identify even and odd functions
How can you describe a function using
its key features?
How do the characteristics of graphs
relate to their corresponding equations?
How can algebra help us get information
about a graph from an equation?
What are common characteristics of
polynomials?
What is the best method for graphing
polynomials?
How can technology assist in the
understanding of graphing polynomials?
Odd and Even Functions
Sum of Even and Odd
NJD Construction Cost Curve

24 | P a g e
New Jersey Student Learning Standard(s): F-IF.C.7: Graph function expressed symbolically and show key features of the graph, by hand in simple cases and using technology for more
complicated cases.
F-BF.B.3: Identify the effect on the graph of replacing f(x) by f(x) + k, k f(x), f(kx), and f(x + k) for specific values of k (both positive and negative);
find the value of k given the graphs. Experiment with cases and illustrate an explanation of the effects on the graph using technology. Include
recognizing even and odd functions from their graphs and algebraic expressions for them
Student Learning Objective 3: Recognize graph of common functions, and use vertical, horizontal shifts, reflections, and non-rigid
transformations to graph them.
MPs Skills, Strategies & Concepts Essential Understandings/
Questions
Tasks/Activities
MP 2
MP 4
MP 5
MP 6
Analyze the effect of the
coefficients on the graph of a
function.
Identify horizontal and vertical
shifts.
Identify reflections and non-
rigid transformations to the
graph.
(Given a verbal description) How would
you sketch a graph of this function?
How do you write equations and draw
graphs for the simple transformations of
functions?
Chemco Manufacturing
New Jersey Student Learning Standard(s): F.BF.A.1b: Combine standard function types using arithmetic operations. For example, build a function that models the temperature of a cooling body by adding a
constant function to a decaying exponential, and relate these functions to the model.
F.BF.A.1c: Compose functions. For example, if T(y) is the temperature in the atmosphere as a function of height, and h(t) is the height of a weather
balloon as a function of time, then T(h(t)) is the temperature at the location of the weather balloon as a function of time.
F.BF.B.5: Understand the inverse relationship between exponents and logarithms and use this relationship to solve problems involving logarithms
25 | P a g e
and exponents.
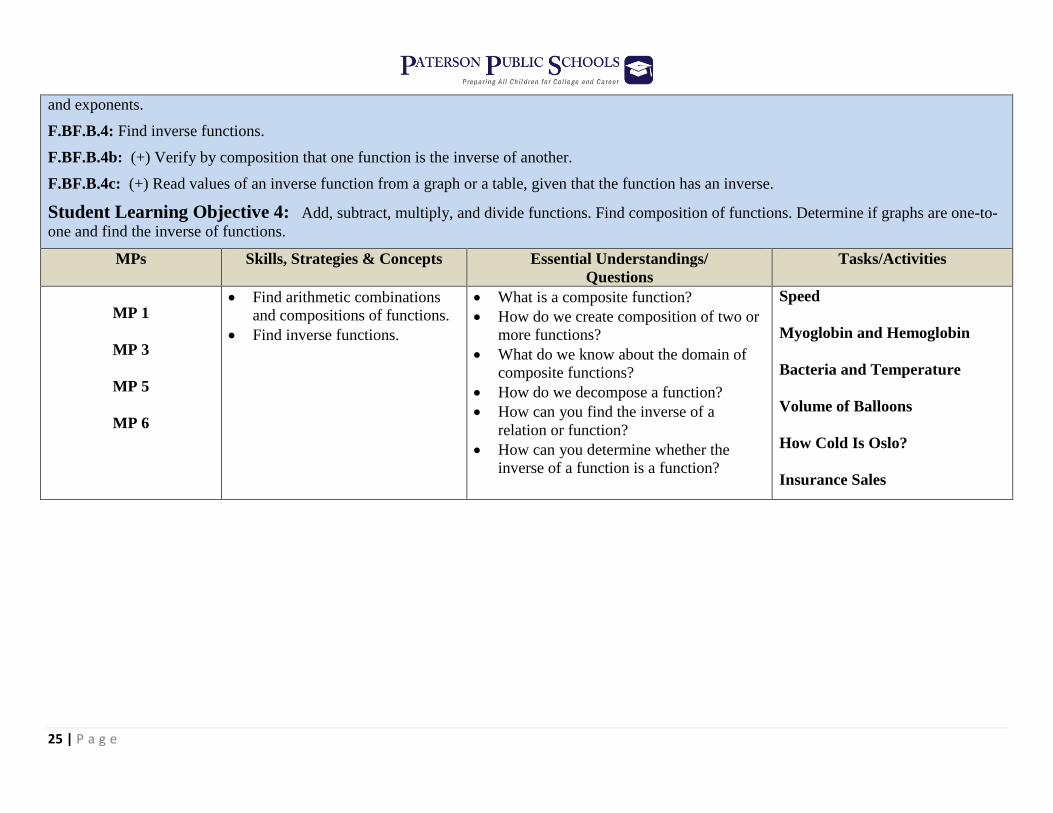
F.BF.B.4: Find inverse functions.
F.BF.B.4b: (+) Verify by composition that one function is the inverse of another.
F.BF.B.4c: (+) Read values of an inverse function from a graph or a table, given that the function has an inverse.
Student Learning Objective 4: Add, subtract, multiply, and divide functions. Find composition of functions. Determine if graphs are one-to-
one and find the inverse of functions.
MPs Skills, Strategies & Concepts Essential Understandings/
Questions
Tasks/Activities
MP 1
MP 3
MP 5
MP 6
Find arithmetic combinations
and compositions of functions.
Find inverse functions.
What is a composite function?
How do we create composition of two or
more functions?
What do we know about the domain of
composite functions?
How do we decompose a function?
How can you find the inverse of a
relation or function?
How can you determine whether the
inverse of a function is a function?
Speed
Myoglobin and Hemoglobin
Bacteria and Temperature
Volume of Balloons
How Cold Is Oslo?
Insurance Sales

26 | P a g e
New Jersey Student Learning Standard(s): A.REI.B.4a: Use the method of completing the square to transform any quadratic equation in x into an equation of the form (x – p)2= q that has the
same solutions. Derive the quadratic formula from this form.
F.IF.C.7a: Graph linear and quadratic functions and show intercepts, maxima and minima.
Student Learning Objective 5: Write quadratic functions in standard and vertex form and use results to sketch graphs of functions.
MPs Skills, Strategies & Concepts Essential Understandings/
Questions
Tasks/Activities
MP 1
MP 3
MP 5
MP 7
Find the coordinate of the
vertex.
Write the quadratic functions in
both forms.
What are the advantages of a quadratic
function in vertex form? In standard
form?
How is any quadratic function related to
the parent quadratic function?
How are the real solutions of a quadratic
equation related to the graph of the
related quadratic function?
Fireworks
Effectively Explain and Correct
New Jersey Student Learning Standard(s):
A.SSE.B.3a: Factor a quadratic expression to find real the zeros of the function it defines.
A.APR.B.3: Identity zeros of polynomials when suitable factorizations are available, and use the zeros to construct a rough graph of the function
defined by the polynomial.
F.IF.C.7: Graph function expressed symbolically and show key features of the graph, by hand in simple cases and using technology for more
complicated cases.
27 | P a g e
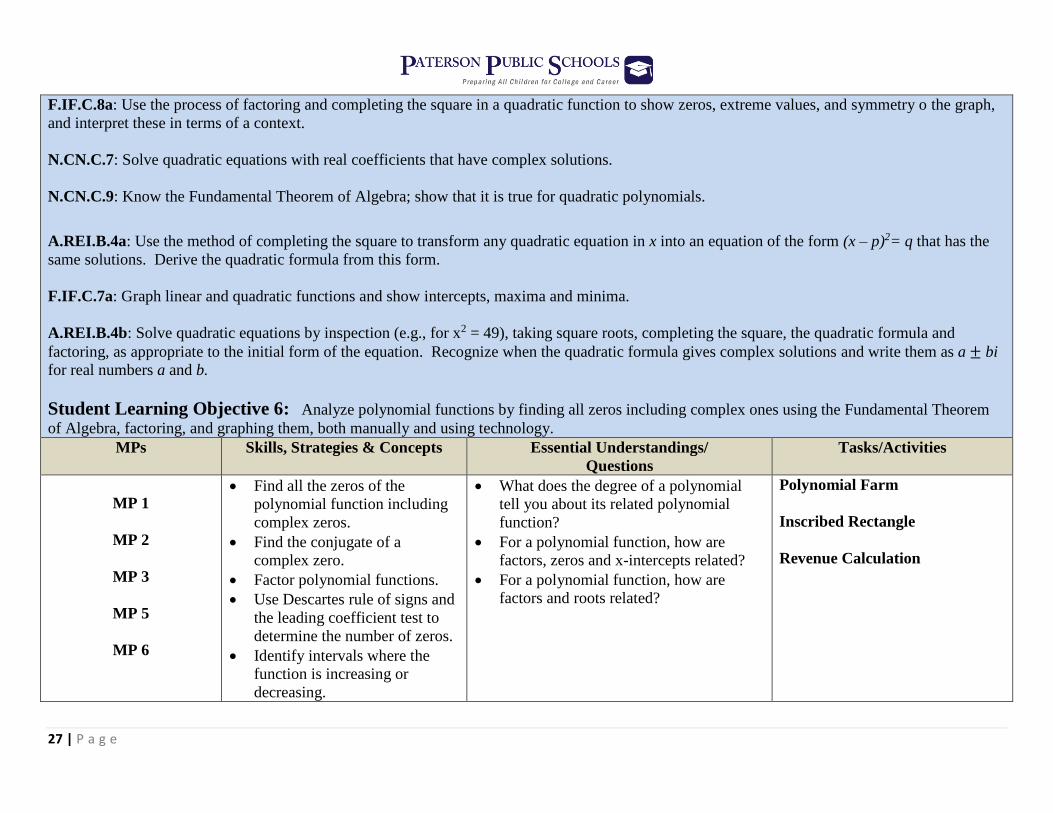
F.IF.C.8a: Use the process of factoring and completing the square in a quadratic function to show zeros, extreme values, and symmetry o the graph,
and interpret these in terms of a context.
N.CN.C.7: Solve quadratic equations with real coefficients that have complex solutions.
N.CN.C.9: Know the Fundamental Theorem of Algebra; show that it is true for quadratic polynomials.
A.REI.B.4a: Use the method of completing the square to transform any quadratic equation in x into an equation of the form (x – p)2= q that has the
same solutions. Derive the quadratic formula from this form.
F.IF.C.7a: Graph linear and quadratic functions and show intercepts, maxima and minima.
A.REI.B.4b: Solve quadratic equations by inspection (e.g., for x2 = 49), taking square roots, completing the square, the quadratic formula and
factoring, as appropriate to the initial form of the equation. Recognize when the quadratic formula gives complex solutions and write them as a ± bi
for real numbers a and b.
Student Learning Objective 6: Analyze polynomial functions by finding all zeros including complex ones using the Fundamental Theorem
of Algebra, factoring, and graphing them, both manually and using technology.
MPs Skills, Strategies & Concepts Essential Understandings/
Questions
Tasks/Activities
MP 1
MP 2
MP 3
MP 5
MP 6
Find all the zeros of the
polynomial function including
complex zeros.
Find the conjugate of a
complex zero.
Factor polynomial functions.
Use Descartes rule of signs and
the leading coefficient test to
determine the number of zeros.
Identify intervals where the
function is increasing or
decreasing.
What does the degree of a polynomial
tell you about its related polynomial
function?
For a polynomial function, how are
factors, zeros and x-intercepts related?
For a polynomial function, how are
factors and roots related?
Polynomial Farm
Inscribed Rectangle
Revenue Calculation
28 | P a g e
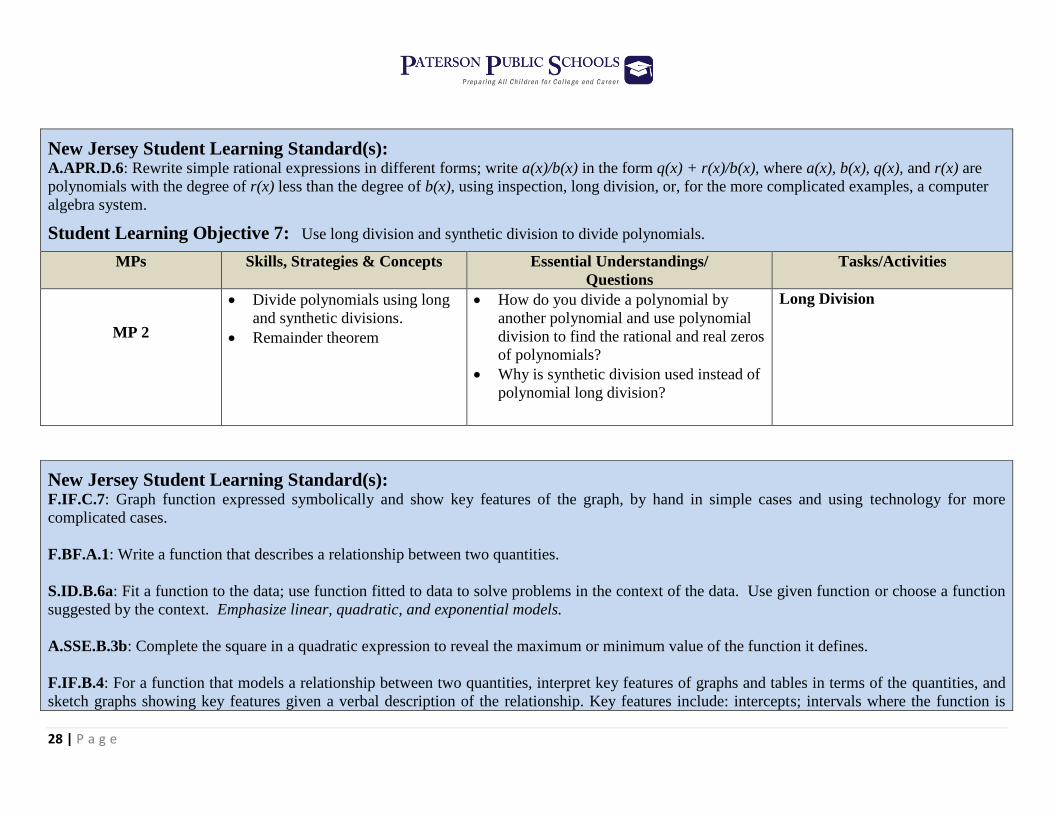
New Jersey Student Learning Standard(s): A.APR.D.6: Rewrite simple rational expressions in different forms; write a(x)/b(x) in the form q(x) + r(x)/b(x), where a(x), b(x), q(x), and r(x) are
polynomials with the degree of r(x) less than the degree of b(x), using inspection, long division, or, for the more complicated examples, a computer
algebra system.
Student Learning Objective 7: Use long division and synthetic division to divide polynomials.
MPs Skills, Strategies & Concepts Essential Understandings/
Questions
Tasks/Activities
MP 2
Divide polynomials using long
and synthetic divisions.
Remainder theorem
How do you divide a polynomial by
another polynomial and use polynomial
division to find the rational and real zeros
of polynomials?
Why is synthetic division used instead of
polynomial long division?
Long Division
New Jersey Student Learning Standard(s): F.IF.C.7: Graph function expressed symbolically and show key features of the graph, by hand in simple cases and using technology for more
complicated cases.
F.BF.A.1: Write a function that describes a relationship between two quantities.
S.ID.B.6a: Fit a function to the data; use function fitted to data to solve problems in the context of the data. Use given function or choose a function
suggested by the context. Emphasize linear, quadratic, and exponential models.
A.SSE.B.3b: Complete the square in a quadratic expression to reveal the maximum or minimum value of the function it defines.
F.IF.B.4: For a function that models a relationship between two quantities, interpret key features of graphs and tables in terms of the quantities, and
sketch graphs showing key features given a verbal description of the relationship. Key features include: intercepts; intervals where the function is

29 | P a g e
increasing, decreasing, positive, or negative; relative maximums and minimums; symmetries; end behavior; and periodicity.
F.IF.C.7a: Graph linear and quadratic functions and show intercepts, maxima and minima.
Student Learning Objective 8: Analyze rational functions by finding all horizontal, vertical and slanted asymptotes and graphing them, both
manually and using technology. Use polynomial and rational functions to model and solve real-life problems including ones with minimum and
maximum values.
MPs Skills, Strategies & Concepts Essential Understandings/
Questions
Tasks/Activities
MP 2
MP 6
Find horizontal and vertical
asymptotes.
Find slanted asymptotes.
Analyze the function as x
approaches the vertical
asymptotes.
Create models and use
arguments to help in solving
real life problems
How can I identify the characteristics of
a rational function?
How are rational functions related to
each other and to inverse functions?
How do rational functions model real-
world problems and their solutions?
How do polynomial functions model
real-world problems and their solutions?
Concentrations
Mario Car Racing
Minimize The Metal in a Can
Boyle’s Law

30 | P a g e
Unit 1 Vocabulary
algebraic function
axis of symmetry
bell-shaped curve
Change-Of-Base Formula
common logarithmic function
common logarithmic model
complex conjugates
complex numbers
composition
condense
constant
constant function
continuous compounding
continuous function
correlation coefficient
cubic function
dependent variable
Descartes’ Rule of Signs
division algorithm
domain
even function
expand
exponential decay model
exponential function
exponential growth modes
extrema
factor
function
Fundamental Theorem Of Algebra
Gaussian model
general form
greatest integer function
horizontal asymptote
horizontal Line Test
horizontal shift
horizontal shrink
horizontal stretch
imaginary number
imaginary unit i
independent variable
Intermediate Value Theorem
inverse function
irreducible
Leading Coefficient Test
Linear Factorization Theorem
linear function
linear regression equation
negative correlation
non-rigid transformations
odd function
one-to-one function
parabola
parallel line
perpendicular lines
piecewise defined function
point-slope form
polynomial function
positive correlation
power function
prime
principal square root
quadratic function
range
rational function
rational numbers
Rational Zero Test
real number
reflection
relation
relative maximum
relative minimum
Remainder Theorem
repeated zero
rigid transformations
scatter plot
sigmoidal curve
slant (or oblique) asymptote
Slope
slope-intercept form
solution
standard form
standard normal distribution
synthetic division
transcendental function
transformations
upper bound
variation in sign
vertex
vertical asymptote
Vertical Line Test
vertical shift
vertical shrink
vertical stretch
x-intercepts
zero

31 | P a g e
References & Suggested Instructional Websites
https://www.ixl.com/standards/new-jersey/math/high-school
http://www.mathwords.com/index_adv_alg_precal.htm
http://www.hershey.k12.pa.us/Page/3608
https://sites.google.com/a/evergreenps.org/ms-griffin-s-math-classes/updates
https://sites.google.com/site/dgrahamcalculus/trigpre-calculus/trig-pre-calculus-worksheets
https://www.ixl.com/math/precalculus
https://www.illustrativemathematics.org/
http://map.mathshell.org/materials/lessons.php?gradeid=24
http://www.achieve.org/ccss-cte-classroom-tasks
https://www.ck12.org/algebra/Applications-of-Function-Models/lesson/Applications-of-Function-Models-BSC-
ALG/?referrer=featured_content
Statistics Education Web (STEW). http://www.amstat.org/education/STEW/
The Data and Story Library (DASL). http://lib.stat.cmu.edu/DASL/

32 | P a g e
Field Trip Ideas SIX FLAGS GREAT ADVENTURE: This educational event includes workbooks and special science and math related shows throughout the
day. Your students will leave with a better understanding of real world applications of the material they have learned in the classroom. Each
student will have the opportunity to experience different rides and attractions linking mathematical and scientific concepts to what they are
experiencing.
www.sixflags.com
MUSEUM of MATHEMATICS: Mathematics illuminates the patterns that abound in our world. The National Museum of Mathematics strives
to enhance public understanding and perception of mathematics. Its dynamic exhibits and programs stimulate inquiry, spark curiosity, and reveal
the wonders of mathematics. The Museum’s activities lead a broad and diverse audience to understand the evolving, creative, human, and aesthetic
nature of mathematics.
www.momath.org
LIBERTY SCIENCE CENTER: An interactive science museum and learning center located in Liberty State Park. The center, which first
opened in 1993 as New Jersey's first major state science museum, has science exhibits, the largest IMAX Dome theater in the United States,
numerous educational resources, and the original Hoberman sphere.
http://lsc.org/plan-your-visit/