mathematics connection vol 5 2005 all articles
TRANSCRIPT

αααααααααααα ββββββββββββ ϕϕϕϕϕϕϕϕϕϕϕϕ φφφφφφφφφφφφ δδδδδδδδδδδδ λλλλλλλλλλλλ µµµµµµµµµµµµ ππππππππππππ θθθθθθθθθθθθ σσσσσσσσσσσσ ωωωωωωωωωωωω
Volume 5 2005
MMMaaattthhheeemmmaaatttiiicccsss
CCCooonnnnnneeeccctttiiiooonnn Published by The Mathematical Association of Ghana (MAG) ISSN 0855-4706

2
MATHEMATICS CONNECTION aims at providing a forum to promote the development of Mathematics Education in Ghana. Articles that seek to enhance the teaching and/or learning of mathematics at all levels of the educational system are welcome.
Executive Editor
Prof. B. A. Eshun, Department of Science Education (UCC), Cape Coast
Managing Editor
Dr. D. K. Mereku, Department of Mathematics Education (UEW), Winneba
Editorial Board
Prof. N. K. Kofinti, Department of Mathematics, University of Ghana, Legon
Prof. B. K. Gordor, Department of Mathematics (UCC), Cape Coast
Dr. S. K. Aseidu-Addo, Department of Mathematics Education (UEW), Winneba
Dr. P. O. Cofie, Department of Mathematics Education (UCEW), Winneba
Mr. J. F. K. Appiah-Cobbold, GES District Directorate, Twifo-Praso
Mrs. B. Osafo-Affum, GES District Directorate, Asuogyaman, Akosombo
Subscription rate for this Volume: ¢45,000.00 (excluding postage)
Orders with payment should be sent to
Managing Editor, Mathematical Association of Ghana, C/o Department of Mathematics Education University of Education, Winneba P. O. Box 25, Winneba Tel. (0432) 22139 or 22140 ext. 138
E-mail: [email protected]
ISSN: 0855-4706
Typeset: Kofi Mereku, UCEW Published by the Mathematical Association of Ghana
Mathematical Association of Ghana (MAG) 2005
The points of view, selection of facts, and opinions expressed in the MATHEMATICS CONNECTION are those of the authors and do not necessarily coincide with the official positions of MAG.

1
MMMaaattthhheeemmmaaatttiiicccsss CCCooonnnnnneeeccctttiiiooonnn
VVVooollluuummmeee 555,,, 222000000555
Published by the Mathematical Association of Ghana
2
C o n t e n t s
Ghanaian JSS2 Students’ Abysmal Mathematics Achievement in Timss-2003: A Consequence of the Basic School Mathematics Curriculum ................................. 1
Anamuah-Mensah, J. 1&1 Mereku, D. K.1
Contribution of Continuous Assessment to Student Learning in Mathematics in Senior Secondary Schools: Case Study of the Birim South District...................... 15
Amoah, S. A. ............................................................................................................................. 15
Constructivism and Mathematics Education in Ghana............................................. 29
Fletcher J. A. ................................................................................................................................. 29
The Relationship between Students’ BECE and SSSCE Grades in Mathematics....................................................................................................................................................... 39
Asare-Inkoom, A........................................................................................................................... 39
Opportunity to Learn English and Mathematics in Ghanaian Primary Schools: Implications for
Teacher Education Programmes ................................................................................................... 49
Mereku, D. K., Amedahe, F. K. & Etsey, Y. K. A.
Gender Differences in Junior Secondary School Pupils’ Intention to Participate in Elective Mathematics at the Senior Secondary Level............................................. 57
Nyala, J. I. .................................................................................................................................... 57
Constitution of the Mathematical Association of Ghana (MAG).............................. 65
1
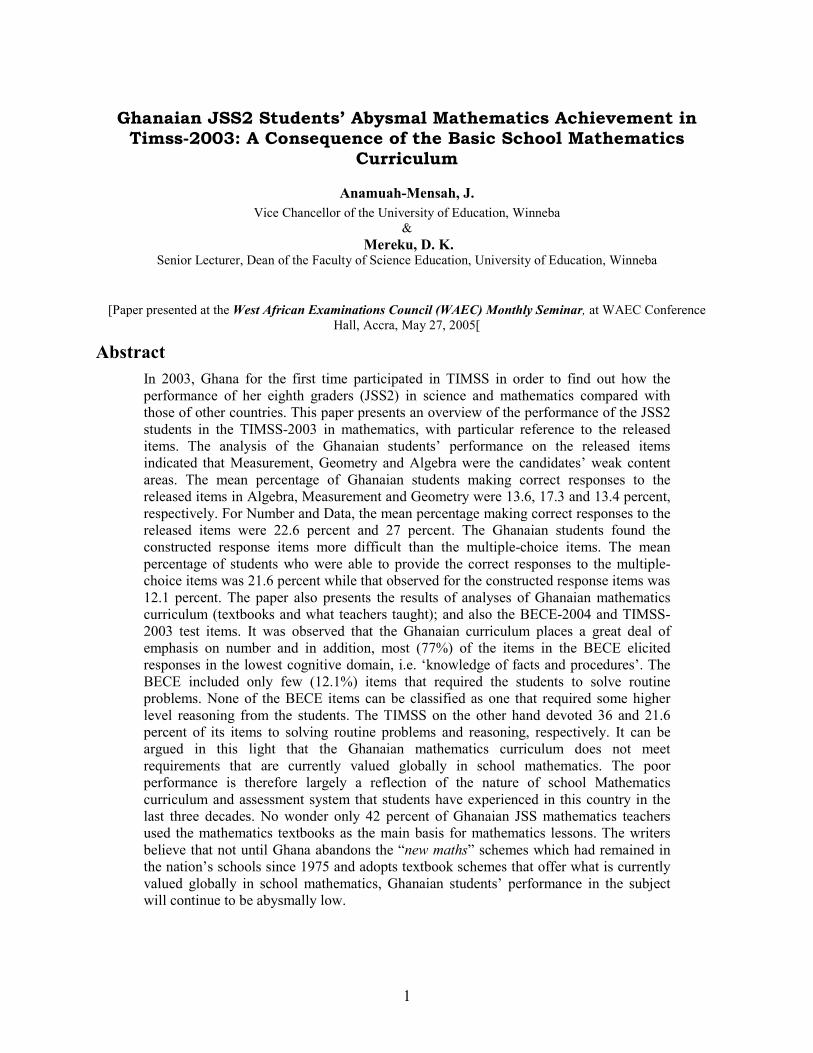
Ghanaian JSS2 Students’ Abysmal Mathematics Achievement in Timss-2003: A Consequence of the Basic School Mathematics
Curriculum
Anamuah-Mensah, J.
Vice Chancellor of the University of Education, Winneba
&
Mereku, D. K. Senior Lecturer, Dean of the Faculty of Science Education, University of Education, Winneba
[Paper presented at the West African Examinations Council (WAEC) Monthly Seminar, at WAEC Conference
Hall, Accra, May 27, 2005[
Abstract
In 2003, Ghana for the first time participated in TIMSS in order to find out how the
performance of her eighth graders (JSS2) in science and mathematics compared with
those of other countries. This paper presents an overview of the performance of the JSS2
students in the TIMSS-2003 in mathematics, with particular reference to the released
items. The analysis of the Ghanaian students’ performance on the released items
indicated that Measurement, Geometry and Algebra were the candidates’ weak content
areas. The mean percentage of Ghanaian students making correct responses to the
released items in Algebra, Measurement and Geometry were 13.6, 17.3 and 13.4 percent,
respectively. For Number and Data, the mean percentage making correct responses to the
released items were 22.6 percent and 27 percent. The Ghanaian students found the
constructed response items more difficult than the multiple-choice items. The mean
percentage of students who were able to provide the correct responses to the multiple-
choice items was 21.6 percent while that observed for the constructed response items was
12.1 percent. The paper also presents the results of analyses of Ghanaian mathematics
curriculum (textbooks and what teachers taught); and also the BECE-2004 and TIMSS-
2003 test items. It was observed that the Ghanaian curriculum places a great deal of
emphasis on number and in addition, most (77%) of the items in the BECE elicited
responses in the lowest cognitive domain, i.e. ‘knowledge of facts and procedures’. The
BECE included only few (12.1%) items that required the students to solve routine
problems. None of the BECE items can be classified as one that required some higher
level reasoning from the students. The TIMSS on the other hand devoted 36 and 21.6
percent of its items to solving routine problems and reasoning, respectively. It can be
argued in this light that the Ghanaian mathematics curriculum does not meet
requirements that are currently valued globally in school mathematics. The poor
performance is therefore largely a reflection of the nature of school Mathematics
curriculum and assessment system that students have experienced in this country in the
last three decades. No wonder only 42 percent of Ghanaian JSS mathematics teachers
used the mathematics textbooks as the main basis for mathematics lessons. The writers
believe that not until Ghana abandons the “new maths” schemes which had remained in
the nation’s schools since 1975 and adopts textbook schemes that offer what is currently
valued globally in school mathematics, Ghanaian students’ performance in the subject
will continue to be abysmally low.

2
Introduction
Trends in International Mathematics and Science Studies (TIMSS) 2003 is the third in a series of
studies undertaken once every four years by the International Association for the Evaluation of
Educational Achievement (IEA) to examine student achievement in science and mathematics,
two key curriculum areas that are fundamental to the development of technologically literate
societies. TIMSS-2003 seeks to continue to monitor trends in science and mathematics at the
eighth grade (JSS2) and at the fourth grade (Primary 4). Ghana’s participation in TIMSS-2003
was strategic as it enabled the country to find out how the performance of her eighth graders
(JSS2) in science and mathematics compared with those of other countries (Mullis, et al., 2004;
Martin, et al., 2004).
In Ghana, TIMSS-2003 involved a total of 5,114 JSS2 students in 150 schools sampled across
the country. The mathematics in the official curriculum materials (i.e. the 1987 syllabi and
Ghana Mathematics Series textbooks) used by this cohort of JSS students from primary to junior
secondary school were the type that were described as ‘modern mathematics’ in Europe and
‘new math’ on the other side of the Atlantic (Howson, Keitel, and Kilpatrick, 1981). Though in the
1980s concerns were raised internationally for countries still using the ‘new math’ textbook
schemes to adjust them (Howson and Wilson, 1986), Ghana has been very slow in responding to
this concern. While the 1987 syllabi were reviewed and supplied to schools in 2001, two years
before the TIMSS study, no matching textbooks have been supplied to schools. This implies that
the nature of mathematics experienced by this cohort of JSS2 students hardly meets requirements
that are currently valued globally in school mathematics.
This paper presents an overview of the performance of the JSS2 students’ achievement on
TIMSS-2003 released items in mathematics and examines the relationship between the
performance and the new math schemes that have remained in the nation’s schools for three
decades.
TIMSS assessment framework for mathematics
The mathematics assessment framework for TIMSS-2003 was covered by two organising
dimensions, a content dimension and a cognitive dimension. There were five content domains:
Number, Algebra, Measurement, Geometry and Data. Items in these content domains were
designed to elicit the use of particular cognitive skills in four cognitive domains, namely,
Knowing Facts and Procedures; Using Concepts; Solving Routine Problems; and Reasoning. The
Mathematics Cognitive Domains involved the use of such processes as
• Knowing facts and procedures: recall; recognize; compute; use tools.
• Using concepts: know; classify; represent; formulate; distinguish.
• Solving routine problems: select; model; interpret; apply; verify/check.
• Reasoning: hypothesize/predict; analyze; evaluate; generalize; connect; synthesize; solve non-routine problems; justify/prove (Mullis, et al., 2004).
Below are the main topics that the items covered in the five content domains:
a. Number (i.e. fractions and number sense) – includes whole numbers and integers; common and decimal fractions including their meaning and representation, operations, relations and properties, estimation; and proportionality.

3
b. Measurement – includes concepts of measurement, units of measurement, perimeter, area, and volume, and estimation of measurements.
c. Data (i.e. representation and interpretation of data, and probability) – includes interpretation of tables, charts, and graphs, and simple descriptive statistics such as means; simple probability concepts and numerical probability.
d. Geometry – includes congruence and similarity; transformations and symmetry; coordinate geometry; points, lines, angles, parallels and perpendiculars; polygons (including triangles and quadrilaterals); and circles.
e. Algebra – includes linear equations; algebraic expressions and formulas, linear inequalities, simple linear system, and number patterns; setting up and solving simple proportionality equations (Mullis, et al., 2004).
Overview of overall achievement in mathematics
Out of the 46 countries that participated, Ghana was second from the bottom of the results table
with a mean score far below the international average. The mean mathematics score of 276 and
its range (as indicated by the difference between the 5th and 95
th percentiles) for JSS2 students
are presented in Table 1.
Table 1 JSS2 Students’ mean mathematics score in TIMSS-2003
JSS2 students Mean mathematics scale score
Overall mean 276 (4.7)*
Range (95% confidence interval) 130 - 430
*Standard error in parentheses
[Source: Anamuah-Mensah, Mereku and Asabere-Ameyaw (2004)].
The mean score was significantly low compared to the international mean score of 467. It placed
Ghana at the 45th position out of the 46 countries participating in the study. The range of scores
from 130 to 430 shows how diverse the JSS2 students were in their mathematics abilities.
The mean percentage correct on all mathematics test items for each participating Ghanaian
student was 15 and only 9% and 2% of the students reached the low and intermediate
international benchmarks respectively. The performance of the JSS2 students in the TIMSS was
unsurprisingly very poor because of the nature of mathematics students were made to experience
at school in this country. Analyses of the students’ performance on the TIMSS mathematics test
items show that the few (about 15%) items for which most students were able to make correct
responses were those that were testing knowledge of facts and procedures. They performed
poorly on items that tested their ability to use concepts, solve non-routine problems and reason
mathematically (Anamuah-Mensah, et al, 2004).
Mean achievement in mathematics content domains
The five content domains listed above constitute independent subgroups with a common
reporting metric (or scale) that makes it possible to compare the relative strengths and
weaknesses of the students in relation to their performance in the different content domains (or
categories). The international mean was placed at 467 for each of the five reporting domains.
The mean performance of the Ghanaian JSS2 student in all the five mathematics content areas
was as follows: Number, 289; Algebra, 288; Measurement, 262; Geometry, 278, and Data, 293.

4
These mean scores were significantly lower than the international means in each of the content
areas and were about 180 scale score points below the international means. It can also be seen
from Figure 1 that there was little difference in the achievement of the Ghanaian students in the
different mathematics content areas.
Figure 1 Relative strengths of Ghanaian JSS 2 students in the mathematics content areas tested in TIMSS-2003
0
50
100
150
200
250
300
350
400
450
500
Number Score Algebra Score Measurement
Score
Geometry Score Data Score
Content
Mean Score
International Average
Ghana
Ghanaian students’ achievement in the mathematics content domains was also compared to those
of selected countries1. In doing this comparison, note was taken of the different curriculum
emphases among the countries, as well as relationships between the test items used in TIMSS-
2003 and the curriculum.
In Table 2 achievement in the five content areas for Ghana, five other African countries,
England, United States of America, Japan, Chinese Taipei, Malaysia, Singapore and Korea are
presented. Ghanaian students’ performance was far below that of all selected countries except
South Africa, in all content areas. It is noteworthy that in none of the mathematics content areas
did students’ achievement reach a level where it could be said that they have a relative strength
in that area in comparison to other countries. It can be seen from the table that Ghana’s average
score in Measurement and Data were the lowest of all the participating countries. The average
difference in performance between Ghanaian students and students in the highest performing
country, Singapore, is about 310 scale points in all content areas. The African country with the
highest mean score in mathematics, Tunisia (410), out-performed Ghana in the five content areas
by an average of about 120 scale points. South Africa, whose overall performance was similar to
that of Ghana, had a similar relative strength in the five areas to that of Ghana.
1 The criteria for the selection was based on whether the country had a similar economic and educational status at
the time of Ghana’s independence, was African, or currently has a strong political and economic ties with Ghana.

5
Table 2 Country mean scale scores for mathematics content areas by selected participating countries
Number Algebra Measurement Geometry Data Score Score Score Score Score
Countries comparable to Ghana at Independence
Singapore 618 (3.5)* 590 (3.5) 611 (3.6) 580 (3.7) 579 (3.2)
Korea 586 (2.1) 597 (2.2) 577 (2.0) 598 (2.6) 569 (2.0)
Chinese Taipei 585 (4.6) 585 (4.9) 474 (4.4) 588 (5.1) 568 (3.3)
Japan 557 (2.3) 568 (2.0) 559 (2.0) 587 (2.1) 573 (1.0)
Malaysia 524 (4.0) 495 (3.9) 504 (4.9) 495 (4.8) 505 (3.2)
African Countries
Ghana 289 (5.1) 288 (4.8) 262 (3.7) 278 (4.3) 293 (4.1)
Egypt 421 (3.0) 408 (3.9) 401 (3.3) 408 (3.6) 393 (3.2)
Tunisia 419 (2.3) 405 (2.4) 407 (2.2) 427 (2.0) 387 (2.2)
Morocco 384 (2.7) 405 (2.8) 376 (3.4) 415 (2.3) 374 (2.5)
Botswana 382 (2.3) 377 (2.7) 377 (2.0) 335 (3.9) 375 (2.7)
South Africa 274 (5.4) 275 (5.1) 298 (4.7) 247 (5.4) 296 (5.3)
Countries with strong links with Ghana
United States 508 (3.4) 510 (3.1) 495 (3.2) 472 (3.1) 527 (3.2)
England 485 (5.0) 492 (4.5) 505 (4.3) 492 (4.5) 535 (4.1)
International Average 467 (0.5) 467 (0.5) 467 (0.5) 467 (0.5) 467 (0.5) *Standard error in parentheses Source: (Anamuah-Mensah, et al, 2004).)
Performance on released test items in mathematics
One of the test forms for TIMSS-2003 was released in 2004. The form came with results of
students’ correct responses to the items. In analysing the released items, the following were taken
into consideration: the type of item – multiple-choice and constructed-response, the content
domain and the cognitive domain.
Performance on multiple choice and constructed response items
It was observed that 70 percent of the questions in the released items were of the multiple-choice
type and the remaining 30 percent were constructed-response items. This was close to the test
weightings used in the TIMSS framework, namely, 66 percent multiple-choice and 34 percent
constructed-response items. The mean percentage of Ghanaian JSS2 students obtaining correct
responses to the released items was 16.9. This was close to the overall mean percentage response
on all the 194 items on the mathematics test, which was 15 percent. The mean percentage of
students who provided the correct responses to the multiple choice items in the released items
was 21.6 percent. This figure was nearly double the percentage observed for the constructed
response items, which was 12.1 percent suggesting that the students either found the constructed
response items more difficult than the multiple choice items or many of the responses they made
to the multiple choice items could have been guess work.

6
Performance on selected test items in the mathematics content domains
Table 3 shows the percentage of Ghanaian students making correct responses to the TIMSS-2003
released items in the five content categories. It will be observed that students making correct
responses to items in the number category ranged between 0.2 and 47.2 percent with a mean of
26.6 percent.
Table 3 Mean percentage of Ghanaians students obtaining correct responses to the released
items
Content domain Range Mean
Number 0.2 – 47.2 26.6
Algebra 0.6 – 29.0 13.6
Measurement 0.5 – 39.0 17.3
Geometry 0.1 – 26.0 13.4
Data 2.4 – 48.5 27.0
Even though about 50 percent of the items in the number category elicited responses from the
lower cognitive domains – knowing facts and procedures, and using concepts – they were
difficult for most Ghanaian children because the items were largely word problems which many
of the students had difficulty in solving due to inadequate exposure to such problems and poor
reading abilities. Similarly, the percentage of students giving correct responses to released items
in the data category ranged between 2.4 percent and 48.5 percent with a mean of 27 percent,
making it the content area that most of the JSS2 students were able to respond correctly. The
percentage range of students making correct responses to the released items in Algebra,
Measurement and Geometry can also be seen in table. It will be observed that these were the
content areas that the students found more difficult in the test. There were several items in these
content areas that less than 1 percent of the students were able to do correctly.
TIMSS Evaluation of Coverage of the Intended and Implemented Curricula
The teaching syllabus for mathematics recommends that students at JSS2 received 25 percent of
the total instructional time. This percentage of the total instructional time allocated to
mathematics at JSS2 is the highest compared to all the TIMSS participating countries.
In Ghana no provisions are made in the national curriculum for addressing the issue of students
with different levels of ability. That is, there is no differentiation of the content of the
mathematics curriculum to meet the learning needs of groups of students with different levels of
abilities. In other words, all students are made to experience the same amount of content in
mathematics. This is however not so in many parts of the world today. This is because some of
the content found in the curricula at this level, in some educational systems, have been found not
to be essential knowledge for ALL, but additional knowledge for students with high abilities who
will continue to study the subject in their further education after this level.

7
In many countries, the national curriculum is not addressing the issue of students with different
levels of ability. But the performance of students in countries that address this issue is high.
Singapore, where the best results were reported in both subjects, practices even a more extreme
form of the differentiation in which the different curricula are used for different groups of
students according to their ability level (Mullis, et al., 2004).
In the intended mathematics curriculum, 96 percent of TIMSS topics were expected to be taught
to every student. The proportions of TIMSS topics in the five domains of mathematics are
presented in Table 4.
Table 4 Percentage of TIMSS topics in Ghana’s Intended and Taught Mathematics Curriculum in the five Content domains
TIMSS Mathematics topics in Intended Curriculum
TIMSS Mathematics topics actually taught by teachers
Content domain Ghanaian
Students (%) International Average (%)
Ghanaian Students (%)
International Average (%)
All Topics 96 70 60 72
Number 100 96 83 95
Algebra 100 63 59 66
Measurement 100 78 53 78
Geometry 100 67 51 69
Data 75 39 55 46
Form the table it can be argued that there was no agreement between inclusion of TIMSS topics
in the intended curriculum and the coverage of the implemented mathematics curriculum. The
students’ responses indicate that a good number of topics intended in most content areas were
not fully covered. This may be due to the fact that many of the topics in Measurement and
Geometry were expected to be taught in the third term of Year 8 (JSS2) and the whole of Year 9
(JSS3). With the exception of Data, the coverage of the mathematics topics was lower than the
international average. In this light, it is worthy to note that the countries with high achievement
in mathematics in the study also had high coverage of the TIMSS mathematics topics in the
classroom (Mullis, et al., 2004).
Comparison of content and cognitive domains emphasised in TIMSS-2003 and BECE-2004
All students in basic education in Ghana write one public examination, Basic Education
Certificate Examination (BECE), which is school leaving examination written at end of Year 9
(or JSS3). In this examination, students write papers in at least eight subjects including
mathematics. BECE-2004 was taken by the same cohort of students who participated in the
TIMSS-2003. While TIMSS-2003 reported that teachers claimed they taught 83 percent of the
content under number, the final examination used to evaluate the basic programme, the BECE
covered 46 percent of this content domain (see Table 5). That is, nearly half of the BECE items
assessed this content area. In the TIMSS however, only 29.4 percent of the items came from this
content domain.

8
Table 5 Emphasis on content domains in curriculum and assessment
Content domain Percentage of TIMSS items
Percentage of BECE items
Number 29.4 46.1
Algebra 24.2 23.7
Measurement 16 7.9
Geometry 16 13.2
Data 14.4 9.2
There was also a great disparity between the TIMSS and BECE in their emphasis on
measurement. Items in this content domain constituted 16 and 7.9 percent in the TIMSS and
BECE respectively. Figure 2 shows that generally, besides number, the proportion of items in the
other content areas in TIMSS was higher than those in the BECE.
Figure 2 Distribution of Items in TIMSS and BECE Mathematics by Content Domain
0
5
10
15
20
25
30
35
40
45
50
% of items in test
Num
ber
Alg
eb
ra
Me
asu
rem
en
t
Geo
me
try
Da
ta
Content domains
Percentage of TIMSS items
Percentage of BECE items
Besides the fact that the Ghanaian curriculum places a great deal of emphasis on number, most
(77%) of the items in the BECE elicit responses in the lowest cognitive domain, i.e. ‘knowledge
of facts and procedures’. TIMSS had only 23.2 percent of items in this domain. A comparison of
the other three cognitive domains shows differences between the BECE and TIMSS items. Table
6 shows the distribution of items in TIMSS and BECE Mathematics by cognitive domain

9
Table 6 Distribution of items in TIMSS and BECE Mathematics by cognitive domain
Percentage of TIMSS items
Percentage of BECE items
Knowing facts and procedures 23.2 77.3
Using concepts 19.1 10.6
Solving routine problems 36.1 12.1
Reasoning 21.6 0
It is obvious from the table that there were differences in the proportion of items set in the
cognitive domains. The BECE included only few items that required the students to solve routine
problems. None of the BECE items can be classified as one that requires some higher level
reasoning from the students. While the TIMSS devoted 36 and 21.6 percent of its items to
‘solving routine problems’ and ‘reasoning’ respectively, the BECE devoted only 12.1 percent to
solving routine problems and did not include any item that tested reasoning. Figure 3 shows that
besides knowing facts and procedures, the proportion of items in the other cognitive domains in
TIMSS was higher than those in the BECE and the former emphasised problem solving.
Figure 3 Distribution of Mathematics Items by Cognitive Domain
0.0
10.0
20.0
30.0
40.0
50.0
60.0
70.0
80.0
% of items in test
Knowing facts and
procedures
Using concepts Solving routine
problems
Reasoning
Cognitive domains
Percentage of TIMSS items
Percentage of BECE items
Discussions
The poor performance of the Ghanaian students can be attributed largely to the lack of
congruence between what is emphasized in the mathematics curriculum in Ghana and what is
currently valued globally in school mathematics which the TIMSS was designed to measure. The
10
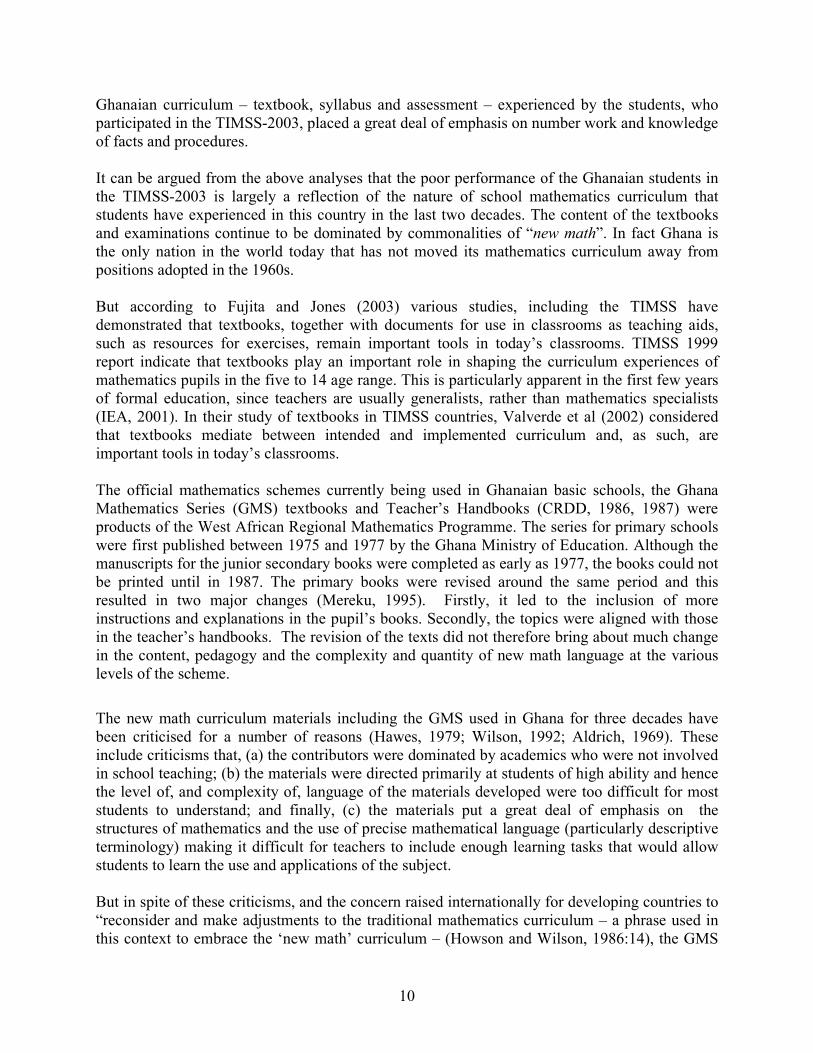
Ghanaian curriculum – textbook, syllabus and assessment – experienced by the students, who
participated in the TIMSS-2003, placed a great deal of emphasis on number work and knowledge
of facts and procedures.
It can be argued from the above analyses that the poor performance of the Ghanaian students in
the TIMSS-2003 is largely a reflection of the nature of school mathematics curriculum that
students have experienced in this country in the last two decades. The content of the textbooks
and examinations continue to be dominated by commonalities of “new math”. In fact Ghana is
the only nation in the world today that has not moved its mathematics curriculum away from
positions adopted in the 1960s.
But according to Fujita and Jones (2003) various studies, including the TIMSS have
demonstrated that textbooks, together with documents for use in classrooms as teaching aids,
such as resources for exercises, remain important tools in today’s classrooms. TIMSS 1999
report indicate that textbooks play an important role in shaping the curriculum experiences of
mathematics pupils in the five to 14 age range. This is particularly apparent in the first few years
of formal education, since teachers are usually generalists, rather than mathematics specialists
(IEA, 2001). In their study of textbooks in TIMSS countries, Valverde et al (2002) considered
that textbooks mediate between intended and implemented curriculum and, as such, are
important tools in today’s classrooms.
The official mathematics schemes currently being used in Ghanaian basic schools, the Ghana
Mathematics Series (GMS) textbooks and Teacher’s Handbooks (CRDD, 1986, 1987) were
products of the West African Regional Mathematics Programme. The series for primary schools
were first published between 1975 and 1977 by the Ghana Ministry of Education. Although the
manuscripts for the junior secondary books were completed as early as 1977, the books could not
be printed until in 1987. The primary books were revised around the same period and this
resulted in two major changes (Mereku, 1995). Firstly, it led to the inclusion of more
instructions and explanations in the pupil’s books. Secondly, the topics were aligned with those
in the teacher’s handbooks. The revision of the texts did not therefore bring about much change
in the content, pedagogy and the complexity and quantity of new math language at the various
levels of the scheme.
The new math curriculum materials including the GMS used in Ghana for three decades have
been criticised for a number of reasons (Hawes, 1979; Wilson, 1992; Aldrich, 1969). These
include criticisms that, (a) the contributors were dominated by academics who were not involved
in school teaching; (b) the materials were directed primarily at students of high ability and hence
the level of, and complexity of, language of the materials developed were too difficult for most
students to understand; and finally, (c) the materials put a great deal of emphasis on the
structures of mathematics and the use of precise mathematical language (particularly descriptive
terminology) making it difficult for teachers to include enough learning tasks that would allow
students to learn the use and applications of the subject.
But in spite of these criticisms, and the concern raised internationally for developing countries to
“reconsider and make adjustments to the traditional mathematics curriculum – a phrase used in
this context to embrace the ‘new math’ curriculum – (Howson and Wilson, 1986:14), the GMS

11
schemes have since remained in the nation’s basic schools without a supplement. Therefore it did
not come as a surprise when the report of a study commissioned by the Ghana Ministry of
Education in 1993, pointed out that mathematics teaching in basic schools focuses on
computation skills, learning of formulas, rote practice and teaching as telling. The principal
investigator in this study, Kraft (1994:2) argued that
the current syllabi, textbooks and teachers’ handbooks do not meet the highest international standards, nor the current best thinking on sequence, learning and pedagogy and will not prepare Ghanaian students for the needs of the next century.
Conclusion
The limitations of the textbooks and the BECE discussed above point to the fact that the basic
mathematics curriculum and the assessment processes that has remained in our schools for nearly
three decades have little to offer the majority of pupils, particularly those who will not continue
to learn mathematics after junior secondary. Anamuah-Mensah, et al (2004) observed that only
42 percent of Ghanaian JSS mathematics teachers used the mathematics textbooks as the main
basis for mathematics lessons while 54 percent used it as a supplementary resource. Thus, the
textbooks were used mainly by Ghanaian teachers as a supplement to other materials that
teachers may have in their possession. This was not the case in most of the high performing
countries such as Singapore, Korea and Japan, where the textbooks were the primary materials
used in teaching the subject.
For effective learning, textbooks are very essential. Without good textbooks students will have
little opportunity to engage in activities that will enable them to use concepts, solve problems
and reason mathematically. The Curriculum Research and Development Division (CRDD) of the
GES produces teaching syllabuses with specifically developed or recommended instructional
activities, which are supplied to all schools. Even though the new teaching syllabuses in
mathematics were supplied to schools in 2001, textbooks that match these syllabuses are yet to
be supplied to schools four years after the syllabuses were reviewed.
Preparation is underway for the next TIMSS, which comes off in 2007. This is two years from
now. In order to ensure there is improvement in the students’ performance in the next TIMSS,
the Ministry of Education and Sports should make available as soon as possible recommended
textbooks and teacher’s handbooks that match the revised syllabuses for mathematics. The
Ministry of Education’s new textbook policy, which provides schools with variety of textbooks
on the same subject from different publishers, should also be vigorously pursued.
The GES, in collaboration with Mathematical Association of Ghana (MAG) and the teaching
universities, should provide in-service education and training (INSET) for mathematics teachers
on test development. The INSET should provide skills in construction of mathematics tests,
especially multiple-choice and constructed response tests, to ensure most items in tests demand
higher cognitive abilities – solving routine problems and reasoning. The BECE should also be
revised to place appropriate emphasis on the various mathematics content and cognitive
domains.

12
References
Aldrich, J.L. (1969). “Thoughts on a cross-national program: African Education Program”.
Reproduced in Wilson, B. (1981), Cultural contexts of Science and Mathematics Education,
Leeds: University of Leeds, Centre for Studies in Science Education.
Anamuah-Mensah, J., Mereku, D. K. and Asabere-Ameyaw, A. (2004) Ghanaian Junior
Secondary School Students’ Achievement in Mathematics and Science: Results from Ghana’s
participation in the 2003 Trends in International Mathematics and Science Study, Accra:
Ministry of Education Youth and Sports.
CRDD - Curriculum Research and Development Division of GES, (1986) Ghana Mathematics
Series: Primary Pupil’s Book 1-6. (2nd edition) Accra: Ghana Publishing Corporation.
CRDD - Curriculum Research and Development Division of GES, (1987) Ghana Mathematics
Series: Junior Secondary Schools Pupil’s Books 1-3 Accra: Ghana Publishing Corporation.
Fujita T. and Jones K. (2003). The place of experimental tasks in geometry teaching: Learning
from the textbook designs of the early 20th century’, in Pope, S. and McNamara O. (eds.)
Research in Mathematics Education Volumes: Papers of the British Society for Research into
Learning Mathematics. London: British Society for Research into Learning Mathematics
Hawes, Hughes (1979). Curriculum Reality in African Primary Schools, Bristol, England:
Longman.
Howson, A.G., Keitel, C. and Kilpatrick, J., (1981). Curriculum Development in Mathematics,
Cambridge : Cambridge University Press.
Howson, G. and Wilson, B. (1986) School Mathematics in the 1990s, Cambridge: Cambridge
University Press,pp21.
International Association for the Evaluation of Educational Achievement –IEA- (1999) Trends in
Mathematics and Science Achievement around the World. http://timss.bc.edu/timss1999.html
International Association for the Evaluation of Educational Achievement –IEA- (2001) TIMSS
1999 Benchmarking report, http://times.bc.edu/timss1999b/mathsbench_report/
Kraft, R. J. (1994) Teaching and learning in Ghana: a curriculum, textbook, syllabus and
handbook analysis. Accra, Ghana: Ministry of Education.
Martin, M. O., Mullis, I. V. S., Gonzalez, E. J., and Chrostowski, S. J. (2004). TIMSS-2003
International Science Report: Findings from IEA’s Trends in International Mathematics and
Science Study at the Fourth and Eighth Grades, Chestnut Hill, MA: Boston College
Mereku, K. D. (1995) A comparison of the official primary mathematics curriculum in Ghana
with the way in which it is implemented by teachers, University of Leeds: School of
Education. (Ph.D. Dissertation).
Mullis, I. V. S., Martin, M. O., Gonzalez, E. J., and Chrostowski, S. J. (2004). TIMSS-2003
International Mathematics Report: Findings from IEA’s Trends in International Mathematics
and Science Study at the Fourth and Eighth Grades, Chestnut Hill, MA: Boston College
Valverde, G. A. et al (2002) According to the book: Using TIMSS to investigate the translation
of policy into practice through the world of textbooks. Dordrecht: Kluwer.

13
Wilson, B.J., (1992). “Mathematics Education in Africa”, In R. Morris (ed.) Studies in
Mathematics Education, Paris: UNESCO pp125-147.
Prof. Anamuah-Mensah, J. is the Vice Chancellor of the University of Education, Winneba. He is a seasoned scientist and science educator; and was the leader of the team that wrote the TIMSS-2003 Ghana report. For further enquiries email :[email protected]
Dr. Mereku, K. D. is a Senior Lecturer and presently the Dean of the Faculty of Science Education, University of Education, Winneba. He is a Mathematics Educator and was the member of the team that wrote the TIMSS-2003 Ghana report. For further enquiries email: [email protected]


15
Article 2
Contribution of Continuous Assessment to Student Learning in Mathematics in Senior Secondary Schools: Case Study of the
Birim South District
Amoah, S. A.
Department of Psychology and Education, University of Education, Winneba
The study seeks to find out whether continuous assessment contributes to students’
performance mathematics. The objectives of this study were to find out whether; Students
see continuous assessment as a motivating factor in their learning, there is any workload
involved in filling of continuous assessment termly, assessment form and the components
of continuous assessment comprising test/quizzes, class exercises, project work /home
work, contribute to students’ end of term examination performance. The study sample
was selected from students in the second year of the five senior secondary schools in the
Birim South District of the Eastern Region. Multi-stage stratified random sampling
method was used to select three classes from each of the schools, yielding a total sample
of two hundred and forty-five (245) students for the study. The performance scores of the
students in Mathematics were analyzed for the study. The analysis of the results of the
study showed that Students are actually motivated by continuous assessment to learn
better, Teachers output was greatly affected by the filling and completion of continuous
assessment record format. The study recommends among others that test/quizzes and
project work/homework should be given high 40% each of the 30% continuous
assessment weighting since these predict the occurrence of end of term examination
scores. Another major recommendation from the study is that moderation should be
carried out efficiently to make the scores students obtain acceptable by being valid and
reliable.
Background of the study
Assessment may generally be used for summative or formative purposes. The summative type of
assessment involves an overall assessment or decision concerning the worth of an educational
programme. Formative assessment, on the other hand, is designed to help the teacher make
effective teaching and learning decisions throughout the period of teaching. It provides
continuous information or feedback to the teacher as well as to the student about their relative
performance in teaching and learning. The information is then used for improving the quality of
instruction.
In the classroom, assessment aims at determining the extent of students' mastery or competence
over a body of knowledge and skills in a subject (Ebel and Frisbie, 1991). For several years, the
educational systems of many nations were dominated by the one-short summative type
assessment. The examination system in Ghana up to the time of the introduction of Continuous
Assessment was also based purely on the single summative assessment. Students, teachers,
parents and even textbooks were focused more on the single examination. Students were

16
coached to pass examinations so as to move up the education ladder. It was to counter the
problems of the single summative examination that suggestions for a broader approach to
assessment, which would be flexible and also provide valid and reliable results, were made
(Akplu, 1989; Estey, 1992; Amedahe, 1994; cited in Bartels, 1994).
In continuous assessment, comprehensive data is collected on students' performance in a
systematic manner throughout the entire period of teaching and learning and in a variety of
situations with the purpose of awarding a mark that reflects the typical performance of the
student over the period of instruction (Quansah, 1994). Continuous assessment provides
cumulative records of the student, which can be used to extrapolate for a students’ final
examinations- if, need be- in the event the student falls sick during examination time. Again it
also spreads work throughout a course and so keep them busy rather than wait till end of year or
course examinations which makes students too examination conscious.
Comments have been made on continuous assessment since its introduction in Ghanaian schools
in 1987. (Quansah, 1994; Aidoo-Taylor, 1992) Some of the comments relate especially to the
large number of exercises for collecting continuous assessment scores in a year, the non-
uniformity of approach in its conduct and the large amount of work involved in the continuous
assessment process in schools for conducting continuous assessment and whether continuous
assessment can predict end of term examination scores.
Statement of the Problem
In the operation of continuous assessment there are variations in the approach to continuous
assessment from school to school. A seventy percent (70%) score in one school for instance does
not mean the same in another school. In view of this how therefore is continuous assessment
contributing to students’ performance in schools in Ghana.
Purpose of the Study
The study seeks
1. to determine the relationship between performance in continuous assessment and the end
of term examination performance of students in the senior secondary schools.
2. investigate whether students are really motivated to learn through continuous
assessment.
3. to find the amount of work involved when teachers are filling continuous assessment
termly assessment form
Research Questions
The study was designed to answer the following questions:
1. How do students see continuous assessment as a motivating factor in their learning?
2. What is the workload involved in filling of continuous assessment termly assessment
forms?
3. What are the contributions of tests/quizzes, class exercises and project work/homework
towards student’s performance in the end of term examinations?

17
4. Is there any relationship between continuous assessment component scores and end of
term examination scores?
5. Can continuous assessment scores predict end of term examination scores?
Significance of Study
The findings from the study will enable school teachers have effective basis for assessing
students. To the authorities especially school administrators, and the Ghana Education service
personnel, it will serve as a guide to and design appropriate in service training programmes to
update teachers’ skills in assessment. To the stakeholders, it will give them insight on the
activities in schools in terms of assessment in schools. Finally it will provide a fertile ground for
further research.
Delimitation
Due to time and logistic problems, the study was limited to the Senior Secondary Schools in the
Birim South District. The scope should have been all senior secondary schools in the Ghana, but
due to the constraints mentioned earlier on, only senior secondary school students in the district
mentioned were used for the study.
Limitations
The limitation was that the study focused only on Second Year Students since first year students
had not had adequate and useful assessments during the period of the study. Secondly, since the
third year students were preparing for their final examinations, they could not have time to
contribute information for the study.
Methodology: Research Design
The descriptive analytical study research design was used. Descriptive studies are designed to
obtain information concerning the current status of phenomena. The information gathered is
directed towards the determination of the nature of a situation as it exists at the time of the study
(Ary et al, 1990). The design often uses questionnaire, interviews and observations.
The design is useful in education research because as Charles (1988, p. 26) pointed out, ‘it
describes, clarify and interpret aspect of education as they presently exist. It is easy to conduct
because data are fairly easily gathered and interpreted’.
Population and Sampling
The study was limited to the Senior Secondary Schools in the Birim South district. Out of the
seven senior secondary schools in the district, five were used for the study, and one was used for
the pilot study. The schools used for the study were as follows; School A: Oda Secondary
School, School B: Akim Swedru Senior Secondary School, School C: Attafuah Secondary
Technical School, School D: St. Francis Secondary Technical School, and School E: Akim
Akroso Senior Secondary School
A multi-stage stratified random sample technique was used to select classes, subjects, subject
teachers, students and their assessment records. Firstly, Eastern region was randomly selected
from the number of regions in the country, followed by the choosing of the Birim South District

18
among the districts in the region. In selecting the schools this technique was used because it was
recognized that there was internal homogeneity of students within the schools and classes, but
heterogeneity between the schools. Stratification was used in sampling classes, subjects, and
students because with such a design, the small sample from each of the schools (strata) will
provide estimate with small sampling variance. Moreover, the stratification enable various
analyses to be made separately for each school and each subject. The total number of second
year students in the five schools was 650.
In order to make the sample representative, they were firstly stratified into courses; arts, science,
agriculture, technical vocation, visual arts, and students were proportionally selected for the
courses to form the sample. This is because as Som (1975, p. 89) said “with the probability
proportional sampling method the size of the sample is made self-weighting and this leads to
improvement in the efficiency of estimation since errors in the estimates can be statistically
evaluated and controlled”. Using the method, the analysis yielded a total sample size of 250
students representing 38% of the 650 students in the five schools.
Instruments
The instruments used to collect data for the study consisted of a questionnaire, interview
schedule, documentary reports which included observing answer scripts, files which contain
students’ records of continuous assessment and examination sheets for the year, and a format for
collecting assessment scores of students. An alpha reliability coefficient was calculated for each
of the questionnaire on the basis of the try-out data. The teachers’ questionnaire had a reliability
of 0.91, and the students’ questionnaire had a reliability of 0.90.
The interview schedule required teachers to answer questions on how their work schedule was
affected by the conducting and recording of scores collected from students as their continuous
assessment performances.
Data Collection Procedure
A letter of introduction was collected from the Acting Head of Department of Psychology and
Education of the University of Education, Winneba. The letter was given to the heads of the
research schools who in turn informed their teachers and students of the study. A time was fixed
to meet the teachers.
The questionnaires were administered and the one for the students were explained to them before
being passed out to them. The questionnaires were collected back the same day. Student’s
assessment records of the selected students were requested for and the scores in the assessment
record books were compared with scores in students’ exercise books to see whether the correct
scores were recorded in the assessment books.
In all, 245 students took part in the study, representing about 98% response rate. The response
rate for the teachers was 100%. A pilot study was conducted at Achiase Senior Secondary
School.
Data Analysis Procedure
The significance level used for the study (both research questions and hypotheses) was 0.05.The
level was adopted because as Som (1975, p. 15) has claimed “researches involving behavioural

19
Science tend to be complex to the extent that it is unrealistic to set and alpha at any level lower
than 0.05”. Pearson’s correlation coefficient, multiple regressions were used for the analyses.
Analyses of Test Items
Items for class exercises, quizzes and test, project work/ homework and end of term examination
were sampled from a pile of questions collected from the headmasters’ offices. These were
observed and compared with the content of the selected subject used. This was done to establish
the validity of the items given to the students and also to find out if there are any relationship
between them. The items were matched with the West Africa Examination Council (WAEC)
items to find out if teachers usually use items from past questions to assess their students. The
items collected were analysed to see the degree of congruence that existed between them to the
extent that they measure the same or at least similar skills and abilities or otherwise. Again the
way the scores obtained by students in continuous assessment are recorded were also observed to
find out if the recordings were properly done. For confidentiality, the items were not included in
this study.
Findings and Discussions
Students’ Perception of continuous assessment as a motivating factor in their learning
The results of frequency counts of the students’ responses indicating the extent of their
agreement to continuous assessment as a motivating factor in their learning are presented in
Table 1.
Table 1 Students’ Perception of Continuous Assessment as Learning Motivation Factor
Responses Observed Cases Percentages
Agreed 201 82.0
Undecided 21 8.6
Disagreed 23 9.4
Total 245 100
Of the 245 respondents who participated in the study, 82.0% (201) agreed that continuous
assessment motivated them to learn. 8.6% (21) were undecided; and 9.4% (23) disagreed that
continuous assessment motivated them to learn; i.e. that continuous assessment did not motivate
them to learn. The results indicate that a substantial number of students, 205, perceived
continuous assessment as a motivating factor in their learning.
Amount of work involved in filling of continuous assessment termly assessment forms
To investigate the amount of work involved in filling of continuous assessment termly
assessment forms, a document analysis was carried out on the continuous assessment record
keeping documents.
To complete students’ termly assessment reports, a teacher was required to complete a 20-
columns form for continuous assessment. The teacher was expected to do the following for each
student in the record book:

20
a). Write the name of the student
b). Enter marks as follows:
Assignments for continuous assessment (11 in all), Total mark for all continuous assessment components for the term, which is equal to 100% (one total mark), Total mark for all continuous assessment components for the term, which is equal to 100 %.( one total mark), Scaled down total from 100% to 30%. (Once), enter one end of term examination mark of 70%, Addition of continuous assessment score of 30% to end of term examination score of 70%. (Once), fill the last column for the position of the student in the class, finally the teacher finds the average performance score for the class and enters at the appropriate space provided at the top of the table.
Going through the above, the teacher records a total of 20 marks for each student per term. For a
year the total marks for the three terms per subject per student per year becomes 20 × 3 = 60
marks. Table 2 shows the number of marks recorded by teachers in five classes (A to E) in a
school.
Table 2 Distribution of marks filled by teachers in the selected schools
Schools No. of students No. of Scores Recorded Totals
A 83 83 × 60 4980
B 61 61 × 60 3660
C 33 33× 60 1980
D 35 35 ×60 2100
E 33 33 ×60 1980
Table 2 indicates that, School A with the greater number of students (83) had, the teacher
recording as many as 4980 marks for the year, teachers from school B recorded 3660 marks for
each student. In school D, teachers recorded 2100 marks for each student and schools C and E
recorded 1980 marks for each student a year respectively.
The analysis shows that in schools where the number of students in class is very large, the
teacher will have to record more scores. The situation will be more tedious if a teacher is
teaching more than one subject with very large class size. This will tend to give the teacher a lot
of work to do in class.
From the interviews with teachers, some of them remarked that they spent greater part of their
time recording marks both at school and at home. Even some continue with the recording during
the holidays. One remarked that due to the number of hours I spend in recording these marks, the
number of student-teacher contact hours is reduced by the fact that continuous assessment takes a
lot of time and severely cuts into the amount of time required for effective teaching and learning.
Another also remarked that ‘a lot of stress is put on him when it comes to recording of
continuous assessment marks in the record books’.
From the foregoing, teachers are affected with high stress in compiling and recording marks,
which induces high stress on teachers. Teachers therefore use class time and part of holidays in
recording continuous assessment marks, which increases the stress, and fatigue on teachers.

21
Contributions of tests/quizzes, class exercises and project work/homework towards students’ performance in the end of term examinations
In this study, the researcher sought to find out whether or not tests/quizzes, class exercises and
project work/homework contributed towards students’ performance in the end of term
examinations. Table 3 shows the multiple regressions analyses of Students’ Continuous
Assessment (Tests/quizzes, class exercises, project work/ home work) and End of Term
Examination Performance Scores in Mathematics.
Table 3 Multiple Regression Analyses of Students’ Continuous Assessment (Tests/quizzes, class exercises,
project work/ home work) and End of Term Examination Performance Scores in Mathematics
The table gives the multiple regression analysis for the joint contribution of test/quizzes, class
exercises, and project work/homework to the end of term examination scores. In the table, R2
gives the proportion of the variance of the scores in end of term examination, which were the
effect of the linear combination of test/quizzes, class exercises and project work/homework.
From the table, the R2 for all the Schools showed that .019 of the variance of the end of term
examination was due to the linear combination of test/quizzes, class exercises and project
work/homework. This meant that 1.19% of the scores that a student obtained in the end of term
examination were due to the joint effect of test/quizzes, class exercises and project
work/homework. Column 5 shows the percentage contribution of the components to end of term
examinations.
At the school level, the joint contributions were School A (13.59%), School B (0.6%), School C
(13.9%), School D (10.4%) and School E (18.4%). At the 0.05 level of significance, none of the
groups showed statistical significance.
The different scores for the subject could be attributed to the variation in the continuous
assessment components and the end of term examinations scores. Due to this, there are bound to
be variations in the approach of assessing students in schools. Comparing performance of
students in one school to the performance of students in other schools cannot be effectively made
since teachers in respective schools have varying standards in using continuous assessment.
The variations may be due to the type of items given and how continuous assessment is
conducted in the schools. Continuous assessment is expected to offer students the chance to
exhibit their learning over a wide area of the syllabus. Questions must therefore be set to cover a
wide area of the syllabus in order to measure the true ability of the student. When questions are
selected from past examination question papers either in test/quizzes, class exercises, project
work/homework and used in end of term examinations, the student is not challenged to learn
Group Size Multiple R R2 R
2 ×100 Sig. F
All Schools 245 .139 .019 1.19 .187
School A 83 .003 .135 13.5 .874
School B 61 .077 .006 .6 .953
School C 33 .373 .139 13.9 .222
School D 35 .322 .104 10.4 .327
School E 33 .429 .184 18.4 .112

22
over a wider area of the syllabus. In this case, the marks students obtain do not indicate their
performance over the syllabus. Some of the items too were observed to be poorly constructed.
Poorly constructed tests or tests taken from published examinations in this case, have low
content validity with respect to expected achievement over the school syllabus that was taught in
class. Students’ scores are therefore meaningless since they cannot be referenced to achievement
over the syllabus. This situation can be looked at the way continuous assessment is conducted in
the schools more especially School E.
Though having all schools adopt one way of assessing may be difficult but at least common
guidelines can be developed for all to follow to avoid variation in the conduct of continuous
assessment. This may at least ensure consistency in the skills and abilities that continuous
assessment seeks to measure and improve its predictive value.
Relationship between continuous assessment component scores and end of term examination scores
The researcher sought to find out whether or not there was any relationship between continuous
assessment scores and students’ performance in the end of term examinations. Table 4 presents
the relationships between continuous assessment component scores and end of term examination
scores.
Table 4 Correlation Analyses for scores in Tests/quizzes (X1), Class Exercises,(X2) project work/homework
(X3) and End of Term Examination Scores (Y) in mathematics
** Significant at α=0.05,
The relationship between test/quizzes (X1) and end of term examinations (Y) is found in Tables
4, column 3. From the table, all the relationships were positive for mathematics.
The relationship was positive for All Schools (.084) and the rest of the Schools with School C
(.230) having the highest correlation coefficient. None of the relationship was significant as
found in Table 4.
The non-zero relationship shows that some form of relationship exists between the variables.
This means high scores on test/quizzes were associated with high scores on end of term
examinations. The results show that none of the relationships was significant. A careful
examination of the items showed that some questions for test/quizzes were repeated in the end of
term examinations. Though with this situation, the performance of students should have brought
a high correlation coefficient this was not observed. A probable explanation may be that those
Groups Size X1 Y X2 Y X3 Y
All Schools 245 .084 .91 .009
School A 83 .05 .139 .040
School B 61 .045 .053 .009
School C 33 .230 .024 .214
School D 35 .195 .190 .238
School E 33 .085 .373** .180

23
who performed poorly on the test/quizzes improved on their end of term examination
performance and those who did well on the test/quizzes did not put in much effort during the end
of term examination. This needs to be investigated since “one might not infer caution from
correlation” (Kerlinger and Pedhazur, 1973, p 16).
On how scores were recorded it was observed that some of the teachers never organized class
test for the students but had scores recorded for their students. Some also divided end of term
examination scores into various segment meant for the continuous assessment components and
recorded the scores under various component of continuous assessment. Added to this problem
was how teachers inflated mark in test/quizzes when the record books were observed.
The relationship between class exercises (X2) and end of term examinations (Y) is found in
Table 4, column 4.
There was a very high relationship for All Schools (.91) as found in column 4 in Table 4. All the
relationships were positive with School E (.375) recording a significant relationship between the
variables.
Sample items showed that the end of term examinations were selected from past WAEC
examinations papers. These students might have seen these items before taking the examination
and this did not make the items challenging for the students. Upon comparing items from class
exercises and the end of term examinations, they were found to vary. Across the schools too, the
variations were large and these contributed to the variations in the correlation coefficient as was
observed between .91 for All the School and .024 for School C.
In general, about one-half of the end of term examinations items given for class exercise in All
the Schools except in School B was in the class exercises. School B had the items in class
exercises different from the items in the end of term examination. Items found on the end of term
examination did contain some of the items on the WEAC examinations. Again the variation of
scores can also be attributed to the fact that when the records cards/forms were observed against
students work it was observed that teachers did not give any internal assessment but still
recorded marks for their students in continuous assessment.
The relationship between project work/home (X3) and end of term examinations (Y) is found in
Tables 5, column 5. From the tables all the relationships were positive for all the schools.
In column 6 of Table 5, the correlation coefficient was weak for all the Schools and none was
significant.
From the correlation analyses relating the scores from continuous assessment and end of term
examinations scores would not be unrealistic, but the principle underlying the procedure is the
maximization of the reliability of the total scores, and not mere correlation, the results as found
above is taken meaningful. Further it is noted that there were a variety of measurement
techniques employed by some of the teachers, the desired reliability of scores can only be
achieved with reference to individual cases and not the “across the board” type of proportion
employed by some institutions. (Bartels, 1994).
24
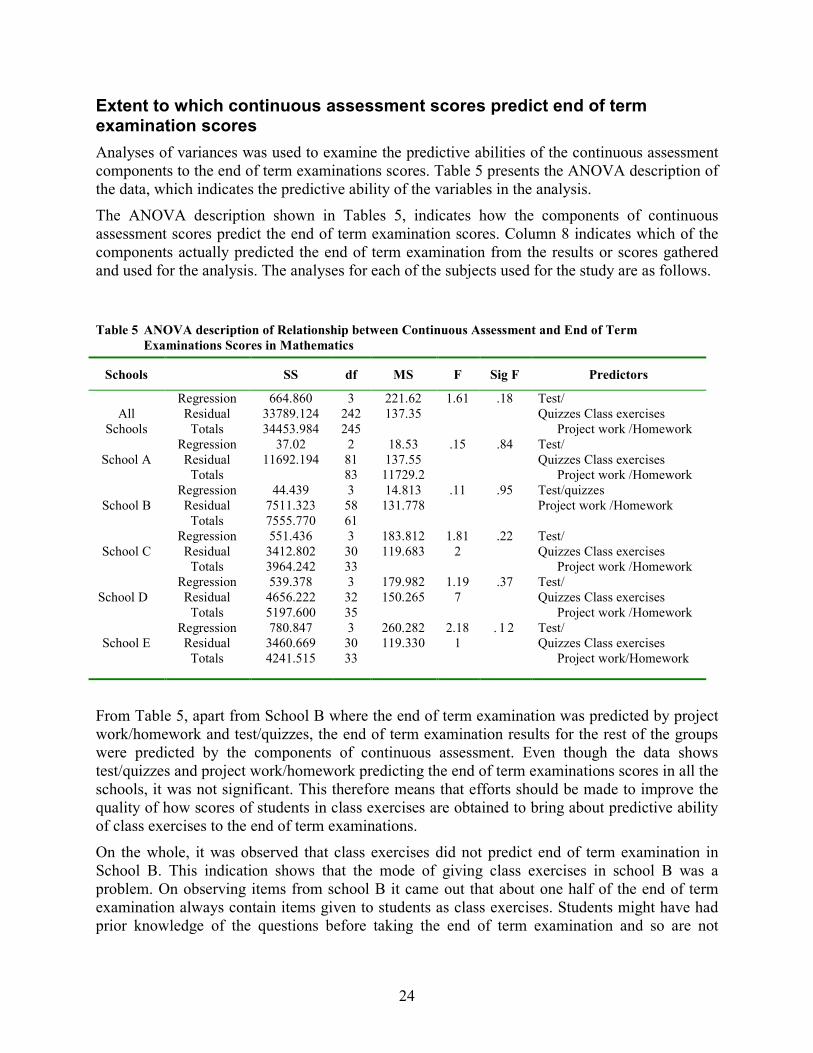
Extent to which continuous assessment scores predict end of term examination scores
Analyses of variances was used to examine the predictive abilities of the continuous assessment
components to the end of term examinations scores. Table 5 presents the ANOVA description of
the data, which indicates the predictive ability of the variables in the analysis.
The ANOVA description shown in Tables 5, indicates how the components of continuous
assessment scores predict the end of term examination scores. Column 8 indicates which of the
components actually predicted the end of term examination from the results or scores gathered
and used for the analysis. The analyses for each of the subjects used for the study are as follows.
Table 5 ANOVA description of Relationship between Continuous Assessment and End of Term
Examinations Scores in Mathematics
Schools SS df MS F Sig F Predictors
All
Schools
Regression
Residual
Totals
664.860
33789.124
34453.984
3
242
245
221.62
137.35
1.61 .18 Test/
Quizzes Class exercises
Project work /Homework
School A
Regression
Residual
Totals
37.02
11692.194
2
81
83
18.53
137.55
11729.2
.15 .84 Test/
Quizzes Class exercises
Project work /Homework
School B
Regression
Residual
Totals
44.439
7511.323
7555.770
3
58
61
14.813
131.778
.11 .95
Test/quizzes
Project work /Homework
School C
Regression
Residual
Totals
551.436
3412.802
3964.242
3
30
33
183.812
119.683
1.81
2
.22 Test/
Quizzes Class exercises
Project work /Homework
School D
Regression
Residual
Totals
539.378
4656.222
5197.600
3
32
35
179.982
150.265
1.19
7
.37 Test/
Quizzes Class exercises
Project work /Homework
School E
Regression
Residual
Totals
780.847
3460.669
4241.515
3
30
33
260.282
119.330
2.18
1
. 1 2 Test/
Quizzes Class exercises
Project work/Homework
From Table 5, apart from School B where the end of term examination was predicted by project
work/homework and test/quizzes, the end of term examination results for the rest of the groups
were predicted by the components of continuous assessment. Even though the data shows
test/quizzes and project work/homework predicting the end of term examinations scores in all the
schools, it was not significant. This therefore means that efforts should be made to improve the
quality of how scores of students in class exercises are obtained to bring about predictive ability
of class exercises to the end of term examinations.
On the whole, it was observed that class exercises did not predict end of term examination in
School B. This indication shows that the mode of giving class exercises in school B was a
problem. On observing items from school B it came out that about one half of the end of term
examination always contain items given to students as class exercises. Students might have had
prior knowledge of the questions before taking the end of term examination and so are not

25
challenged to exhibit the actual ability or skills they posses and as such the scores could not
predict the end of term examination scores.
Again it was observed that students presented very similar or sometimes the same material as
others in class exercises and in project work/homework when answered scripts were observed.
This means that students copied from each other. Copying from friends negates the essence of
independent work. The scores students obtain from copied work are obviously not reliable
indicators of their personal study and personal effort. This problem shows the lack of
independence on the part of students in responding to class assignments and examinations. This
largely may be due to the fact that there is no strict and proper supervision from teachers and
administrators in the operation of continuous assessment.
From the analyses done, the following are the findings:
1. Continuous assessment has a motivating effect on students’ learning. Eighty-two percent
of students sampled agreed that they were really motivated to learn through continuous
assessment.
2. A lot of stress is put on teachers by filling and completing the termly assessment records.
3. The performance in end of term examinations could be predicted by test/quizzes and
project work/homework scores.
4. None of the relationship between continuous assessment scores and end of term
examination scores was significant.
Evaluation of findings
Students were found to be motivated by continuous assessment to learn as revealed by the study.
This calls for the implementers of continuous assessment to look at all the facets of continuous
assessment and to see to how to effectively use all of it because continuous assessment has been
found to be diagnostic, guidance oriented and as such feedback seems to be very crucial for
effective implementation. This will therefore, if properly effected motivate students a lot as
advocated by Etsey (1992).
A lot of stress is put on teachers, as found in the study, due the filling of assessment form of
students some teachers were found to be dishonest when the scores entered in the assessment
forms were compared with scores in student’s exercise books. Some of such dishonest behaviour
is as follows: Some teachers divided one exercise they gave students into sections and recorded
the scores of each of the sections against each of the assessment modes used in continuous
assessment. For example, a ten-question exercise was divided as follows; the first three questions
were scored and recorded as class tests/quizzes score, the score for the next three questions was
recorded against class assignment, and the score for the last four questions was recorded for
project work/homework. The total score was then recorded as continuous assessment score for
the student for the term. Further, scores recorded in students’ end of term Report Books as
continuous assessment scores were found to be inflated when compared to the actual scores in
their exercise books.
The teachers involved could not assign any reason for the differences in the scores. Some of the
teachers also did not organize any internal assessment but still recorded marks for their students
on continuous assessment at the end of term. The critical issue is how to evolve a system to
check teachers’ dishonest behaviour and to make sure they follow the laid down guidelines for

26
the operation of continuous assessment. This calls for a critical look, in the view of the
researcher, at how teachers are overloaded in terms of his/her work input in the conduct of
continuous assessment. The researcher therefore suggest that in view of the fact that a lot of
stress was put on the teacher when filling the assessment forms and in order to reduce stress on
teaches due heavy workload there should be a reduction in the number of exercises teachers are
to give students.
In predicting the outcome of end of term examinations, indication from the entries showed that
apart from School B where test/quizzes and project work/homework predicted the end term
examination scores, all the schools as well as the individual schools had all the three variables
(component) predicting their end of term examinations.
The implication here is that some of the variables showed some relationship and others did not.
Reasons for the trend may be due to certain factors not dealt with in this study, which might
affect the results.
The conclusion is that test/quizzes and project work/homework scores can be used to predict the
performance of students in the end of term examination. In the view of such revelation made in
the study the researcher thinks test/quizzes and project work/home work should be encouraged
very much by giving it a high weighting whereas class exercises should be given a small weight
in the conduct of continuous assessment, for as Palmer (1970) warns that “continuous assessment
on its own does not ensure valid assessment, the teacher needs to define the objectives with some
exactness and then gauge what is being measured and in what proportion”.
Conclusions
The following conclusions are drawn from the results of the study. The study revealed from the
sample that continuous assessment has a motivating effect on students’ learning. From the study,
eighty-two percent (82%) of the students sampled agreed that they were really motivated to learn
through continuous assessment. Therefore students should be given guidance in order letting
students know how important continuous assessment is in their learning and the effect it has on
their end of their course.
The study revealed further that a lot of stress is put on teachers by filling and completing the
termly assessment records. This suggests that the numbers of number of columns in the termly
assessment form are many and needs to be revised. In revising it, it means reducing the number
of columns in order to reduce teachers’ amount of work in filling and completing the assessment
form. This therefore calls for reduction in the number of exercises given to students by teachers
as stipulated in the policy.
The research brought to light that test/quizzes and project work/homework scores of students
could predict the end of term performance. In view of this, many emphases should in terms of
supervision, constructing test items and administration of exercises, be placed on test/quizzes and
project work/homework in deciding the performance of students at the end of the term.
Limitations of the Study
This study is not immune from the general limitation usually inherent in research based on the
use of instruments (questionnaire) to collect data based on the respondent reading before writing,

27
the use of questionnaire in the survey could definitely have led to some faking of responses
especially as some teachers and students would disinterestedly have filled the questionnaires.
The use of the test scores too present a limitation because the scores cannot be said to be reliable
one as teachers, as revealed in the study, did not construct good items to elicit the right
responses, teachers dishonest behaviour, students copying etc. which cannot be used to take a
right decision.
Time and financial constraints allowed only the use of secondary schools in the Birim South
District of the Eastern region.
Recommendations
The following recommendations were made: It is recommended from the study that since
test/quizzes and project work/homework could predict students’ end of term examinations scores
from the study in continuous assessment, test/quizzes and project work/homework should be
given higher weighting than class exercises if class exercises will be used at all. It is
recommended that test/quizzes and project work/homework be given a weighting of 40% each
out of the 30% continuous assessment weight. In so doing much emphasis will be placed on two
exercises to enhance performance.
The researcher recommends that moderation of items generated in schools should be encouraged
by the schools. This will help teachers come out with well constructed and reliable test items.
This can be done by the schools forming committees that will occasionally moderate items
generated internally in the schools. This will make scores students obtain in test more reliable
and valid.
In ensuring valid continuous assessment goals, effective supervision should be carried out by
school administrators as well as officers in the district education offices, who are well informed
about the procedure of continuous assessment, to ensure that continuous assessment procedures
are followed by all teachers. This will serve as a means of standardisation of continuous
assessment scores and form the basis for comparison between schools and students. By so doing,
sores received for schools can be said to be reliable and valid.
References
Aidoo-Taylor, D. (1992), Practical assessment in school system. Journal of Institute of education
2 67-74
Akplu, H.F. (1989). Continuous assessment in schools and colleges. Journal of the Ghana
Association of Science Teachers, 1-3
Amedahe, F.K. (1994). Attitude of basic education teachers and use of continuous assessment in
Ghana. Journal of the Institute of Education, 4, 28-36
Ary J, & Razavich L. C,.(1990). Introduction to research in education. New York. Holt,
Rinehart and Winston, Inc.
Bartels, E.K. (1994). Continuous assessment practice at the university of cape coast. MEd
Thesis presented to University of Cape Coast, Cape Coast, Ghana.

28
Ebel R. L & Frisbie, D. A. (1991) Essentials of educational measurement. New Jersey,
Englewood Cliffs, Prentice Hall Inc.
Charles, C. M. (1988). Introduction to educational research. London: Longmans Group Ltd
Etsey Y. K. (1992) Continuous assessment In Oguaa Educator, 12, 85-98,
Kerlinger F. N. & Pedhazur (1973). Multiple regressions in behavioural research, New York,
Holt, Rinehart and Winston, Inc.
Quansah, K. B. (1994). Developing continuous assessment procedures. Unpublished
Memograph.
Som, R. K. (1973). A manual of sampling techniques. London Heinemann Educational Books
Ltd.
West African Examination Council (WEAC) Chief Examiners Report, (1996) Accra, Ghana.

29
Constructivism and Mathematics Education in Ghana
FLETCHER2 J. A.
Senior Lecturer in Mathematical Education, University of Cape Coast, Ghana
Abstract
Mathematics is a subject found in every school Curriculum in almost every country. Here
in Ghana, mathematics is a compulsory subject in both the basic education (i.e. primary
and junior secondary) and senior secondary curricula. This paper argues that in spite of
the desire of mathematics educators in Ghana to pursue a constructivist agenda with
regard to the teaching and learning of mathematics, mathematics teachers at the basic and
senior secondary levels continue to place undue emphasis on memorisation and
'imitation' rather than understanding and explaining. The difficulties involved in making
the switch from the transmission approach to mathematics teaching to activity-based
approaches include counteracting the effect of an examination system which encourages
rote learning and recall of facts, lack of expertise among teachers of mathematics and
teachers' resistance to change.
Mathematics is a subject found in every school curriculum in almost every country. In Ghana,
for example mathematics is a compulsory subject in both the basic school and senior
secondary school curricula. All pupils in basic and senior secondary schools must study
mathematics. In this paper, an attempt is made to answer the question: What mathematics
should be taught in Ghanaian schools? In other words, what should the Ghanaian school
mathematics curricula, look like?
To answer either of these questions, it is relevant to examine the philosophy of school
mathematics generally because of the strong link between philosophy of mathematics and the
mathematics curriculum. Indeed as Ernest (1991) observes, a number of studies (e.g. Thompson,
1984; Raymond, 1993) have confirmed the powerful impact curriculum developers' and teachers'
personal conceptions of mathematics have on the mathematics curriculum. Thompson for
example, records:
The observed consistency between the teachers' professed conceptions of mathematics and the way they typically presented the content strongly suggest that the teachers' views, beliefs and preferences about mathematics do influence their instructional practices (Thompson, 1984:125).
If the personal philosophies of those in authority (e.g. curriculum developers), play a vital role in
pedagogical and epistemological issues in mathematics education (Koss and Marks, 1994), then
it is important to discuss the various philosophies of mathematics in any discussion of the nature
of mathematics, the way it is taught and learnt, and the way it is assessed in schools today.
2 Jonathan.

30
Davis and Hersh (1981) discuss the foundations of mathematics and present a number of
philosophies. Among these are the three major philosophies of mathematics which dominated
the 'foundations' debate in the early part of the twentieth century. These philosophies are
Platonism, Formalism and Constructivism.
Briefly, Platonists believe that mathematical objects exist and that their existence is an objective
fact quite independent of our knowledge of them. These objects, they claim, are real definite
objects with definite properties, some known, some unknown. In other words, any meaningful
question about a mathematical object has a definite answer, whether we are able to determine it
or not. A mathematician in this school is an empirical scientist. He cannot invent anything
because it is already there. All he can do is discover! Thus Thom (1975), a Platonist, calls on
mathematicians to affirm that mathematical forms indeed have an existence that is independent
of the mind considering them. In other words, mathematical knowledge is "neutral", culture-free
and absolute!
Formalists, on the other hand, do not believe in the existence of mathematical objects. They
believe that mathematics just consists of anxioms, definitions and theorems. They see
mathematics as a science of rigorous proofs. Any logical truth must have a starting point - the
axiom upon which the theorem is built. The anxioms may be false or true but, to the formalist,
that is not important. What is important is the valid logical deduction that can be made from the
axiom. Perhaps the most influential example of formalism as a style in mathematical exposition
was the writing of Bourbaki, which had a tremendous influence all over the world in the 1950s
and 1960s. This period marked the construction of 'modern mathematics' as an academic content
unified by the set theoretic ideas (Dowling, 1990).
A radically different alternative to platonism and Formalism is constructivism. Constructivists
believe that mathematics does not grow through a number of indubitable established theorems,
but through the incessant improvement of guesses by speculation and criticism. Lakatos (1962),
for example, argued that mathematics is not infallible and like all the natural sciences, it too
grows from criticism and correction of theories which are never entirely free of ambiguity or the
possibility of error or oversight. Starting from a problem, there is a simultaneous search for
proofs and counter examples. New proofs explain old counter examples, new counter examples
undermine old proofs. Lakatos, however, did not actually carry out a programme of
reconstructing the philosophy of mathematics with a fallibilist epistemology. It is also uncertain,
as to what would be the "objects" of Lakatos' informal mathematics.
In spite of the inability of any of these philosophies to establish an 'undisputed' foundation of
mathematics, they have very important implication for mathematics education not only because
of the link between pedagogy and philosophy of mathematics, but the aims of mathematics
education are influenced by these philosophies. For example, Platonists view mathematics as a
set of indubitable truths, a supreme achievement of humankind and an intrinsically valuable
treasure. Based on these values, the main aim for mathematics education is the transmission of
mathematical knowledge as a good in itself. In other words, mathematical knowledge is good
because it trains the mind and not because it is used in our everyday lives. Indeed, Plato (1941)
believed that the pure disciplines such as mathematics had the "power of turning the soul's eyes
from the material world to the objects of pure thought" (p.23). Also great mathematicians such
as Frege and Russel, in their discussion of the nature of mathematics did not refer to anything
other than pure mathematical knowledge. The values of purity were illustrated by Halmos (1985)

31
with the title of his paper: 'Applied mathematics is Bad Mathematics', in which he distinguishes
the pure aesthetic of the 'knower' from the practical concerns of the 'doer'.
Here, school mathematics is understood to be a pure, hierarchically structured self-subsistence
body of objective knowledge. Higher up the hierarchy, mathematics becomes increasingly pure,
rigorous and abstract. Pupils are encouraged to climb up this hierarchy as far as possible,
according to their mathematical ability!. This position is somehow shared by Formalist too. It is
perhaps no exaggeration to suggest that mathematics education in Ghana is heavily influenced by
Platonism and Formalism although the perceived usefulness of mathematics is one of the most
popular reasons cited by Ghanaian mathematics teachers for the teaching and learning of
mathematics in schools (Fletcher, 1995).
Indeed, irrespective of the level at which mathematics is taught, the role of the Ghanaian
mathematics teacher has almost always been that of a lecturer and explainer, communicating the
structure of mathematics 'systematically'. The teaching style is simple. The teacher explains,
illustrates, demonstrates and in some cases gives notes on procedures and examples. The pupils
are led deductively through small steps and closed questions to the principle being considered. A
common pattern, particularly with lower attaining pupils, is to show a few examples on the
chalkboard at the start of the lesson and set similar exercises for the pupils to work on their own.
At its best, and given pupils who are sufficiently motivated, this style of teaching achieves what
it is set out to do - that is, prepare the pupils for examinations. At the worst, it becomes direct
'telling how' by the teacher, followed by in comprehension on the part of the pupils. What is
lacking in this approach, even at its best, is a sense of genuine enquiry, or any stimulus to
curiosity or appeal to the imagination ( Ernest, 1991).
Accepting this view of mathematics implies a tendency to bring pupils to see mathematics as a
deductive process. Here it is the method that is of central significance, and provided that it is
thoroughly taught, learned and tested by repeated exercises, mathematics is thought to be
'successfully' conveyed. In terms of assessment, this view of mathematics overemphasizes
summative assessment through 'external' examinations at the expense of formative assessment,
as competition in examinations in seen as providing a means of identifying the 'best'
mathematician (Ernest, op cit). Indeed it is the belief of many Ghanaian teachers that the best
preparation for examinations is direct practice of the kind of questions that are eventually asked (
Kanbogtah, 1999 ). It is therefore hardly surprising that the examination system in Ghana tends
to drive the school curriculum instead of being informed by the latter. If a topic is never be
examined by the examination body, it is never taught! Amongst (mathematics) educators there is
now considerable skepticism about the above perspective of mathematics, though institutionally,
it remains a powerful lobby ( Lerman, 1993).
Surely, if mathematics education is about the overall development of the growing human being,
as it should be, then other factors such as the development of the child's creativity are important.
These factors may be better achieved through the development of the child as an autonomous
enquirer and knower of mathematics and the fostering of the child's confidence, positive attitude
and self-esteem, with regard to mathematics, than through the learning of theorems and formulae
in mathematics. Adopting the constructivist philosophy of mathematics education appears to be
the way forward.

32
Constructivism and Mathematics Education
The transmission view of teaching attributes two general functions to the teacher's words and
actions. They can carry meanings in and of themselves that are waiting to be apprehended by
pupils, and they can serve to draw pupils' attention to mathematical structures in the
environment. Constructivism challenges this assumption that meaning resides in words, actions
and objects independent of the interpreter (Von Glasserfield, 1991).
Brieter (1985) had earlier observed that a core belief in contemporary approaches to learning is
that knowledge and cognitive strategies are actively constructed by the learner. This observation
has solid epistemological foundation and is generally consistent with literature (e.g. Carpenter et
al. 1988; Jaworski; 1994) that documents pupils' cognitive development in specific areas of
mathematics, particularly their misconceptions. It consequently has important implications for
instruction and assessment in mathematics. As mentioned above, the seemingly obvious
assumption that the goal of instruction is to transmit knowledge to pupils stand in flat
contradiction to the contention that students construct knowledge for themselves by restructuring
their internal cognitive structures.
In constructivism, teachers and pupils are viewed as active meaning makers who continually give
contextually based meanings to each others' words and actions as they interact. From this
perspective, mathematical structures are not perceived, intuited or taken in but are constructed by
reflectively abstracting from and re-organising sensorimotor and conceptual activity. Thus the
mathematical structures that the teacher 'sees' are considered to be the product of his or her own
conceptual activity and could be different form those of the pupils. ( Von Glasserfield, 1991).
Consequently, the teacher cannot be said to be a transmitter of such structures nor can he or she
build any structures for pupils. The teacher's role here is viewed as that of a 'consultant architect'.
Without overplaying the above metaphor, an architect must know the site or ground on which
the structure will be built and must know in some detail the nature of the structure to be built and
the theories which underlie the soundness of such structures. In the case of the mathematics
teacher, he or she must know the nature of the current mathematical knowledge base of the
student, and must have insights into the knowledge structures which can grow from such a base.
The term "consultant" has deliberately been appended to the term "architect" (in characterising
the teacher's role) to suggest that the individual pupil is in charge of his or her knowledge
building. The teacher provides ideas, activities, insights and feedback which should help the
pupil build this knowledge. But how can the teacher communicate these ideas if he or she does
not have the same mathematical structures as those of the pupils? How can constructivism
explain situations in which the pupil 'understands' what is being 'taught' if the teacher and the
pupil construct their own mathematical meanings?
Fletcher (1992) argues that although instruction clearly affects what pupils learn, it does not
determine it. Pupils are not passive recipients of knowledge; they interpret it, put structure on it
and assimilate it in the light of their own framework. Indeed, as O'Reilly (1990) points out,
children enter school with highly developed informal systems of arithmetic and before they
receive any formal instruction in arithmetic, they can solve simple addition and subtraction word
problems. These solutions arguably suggest reasonably well developed conceptions of addition
and subtraction even though the children have not learnt the formal terminology associated with
the operation.

33
Jaworski (1994) also explains that the reason for successful communication between teachers
and pupils is that teachers and pupils can negotiate meanings of actions and words as they
interact. Consequently, teachers and pupils may share meanings of actions and words not
through transmission of knowledge but through 'negotiation'.
Perhaps, one reason why the constructivist paradigm should be seriously considered as an
alternative to the transmission view instruction is that a fundamental goal of mathematics
instruction is, or should be, to help students build structures that are more complex, powerful and
abstract than those they possess before instruction. The teacher's role here cannot be merely to
convey to pupils information about mathematics but to facilitate profound cognitive restructuring
through negotiation of meanings of mathematical activities.
A number of researchers (eg. Carpenter et al, 1988; Simon and Schifter, 1993) have reported
findings which seem to confirm that the constructivist approach can lead to better
communication of mathematical ideas by pupils. For example, Simon and Schifter (op.cit)
studied the effects of a constructivist - oriented in-service programme for teachers on their
students' learning of mathematics. The researchers found that, along with transformations in the
nature and quality of mathematics activity in the classroom, students' beliefs about learning
mathematics changed and their attitudes towards mathematics improved. The students involved
in the research were encouraged to discuss their mathematical problems and solutions among
themselves. In other words, emphasis was placed on encouraging students to verbalise
mathematical thinking, to explain and justify mathematical solutions and to learn to resolve
complicating points of view.
In fact, 'radical' constructivist (see von Glaserfeld, 1983, 1991) argue that any suggested
interpretation or solution to a mathematical problem (preferably posed by the pupil) is acceptable
provided it indicates that the pupil has made appropriate suggestions. By focusing on the ways
and processes by which pupils construct their own mathematics or mathematical 'realities;
constructivism attempts to demystify mathematics and make it more accessible to all pupils. This
process may be facilitated by encouraging pupils to pose and solve mathematical problems in
social contexts and to discuss mathematics embedded in their own lives and environments.
Indeed if pupils are to be empowered and given greater control over their own lives, then as
Fletcher (1997) points out, they should be encouraged to choose their own areas of study in
mathematics and should also be encouraged to work in groups and generate mathematical
problems. In furtherance of these aims, school mathematics must be embedded in pupils' cultures
and the reality of their situation, engaging them to appropriate it for themselves. It is in this way
that knowledge of mathematics can help equip pupils with thinking tools (Norwood, 1999).
This is in line with social constructivists' advice to mathematics teachers to take into account the
social interactions as well as the power structure in the he classroom if they are to switch from
the transmission approach to mathematics teaching to the constructivists approach. Jaworski
(1994), a social constructivist writes:
The construction of knowledge in the classroom goes beyond interaction between teacher and students, to wider interaction between students themselves in the social and cultural environment and beyond. It seems crucial for mathematics teachers to be aware of how mathematical learning might be linked to language, social interaction and cultural context ( Jaworski, op.cit:128).

34
Schemes such as the Kent Mathematics Project (KMP) and the secondary Mathematics
Individualized Learning Experiment (SMILE), both in the U.K., are arguably based on
constructivists' view of mathematics. For example, among the aims of the KMP is to:
... provide a unique course in mathematics for each individual child, using materials suitable for all abilities (sic) of children ..., to give the teacher the opportunity to use his or her own skills at diagnosing weaknesses, helping children to develop concepts and establishing co-operative rather than teacher-dominated relationships ... (and) to provide a system in which children will accept responsibility for most of their own learning (Kent Mathematics Project, 1978:6).
The SMILE is in many respects similar to KMP and indeed was originally an offshoot of it,
although it is more of computer work as well as well as investigative work. The emphasis (in
SMILE) is on the pupil learning from activities that they carry on independently, using the
teacher as one resource among many, and not for formal teaching and teacher directed activities.
This is in contrast with the transmission view of instruction where teachers are seen as
authorities possessing all the 'answers'.
Teachers with the transmission view of instruction ask students to discard informal and
previously learnt methods in favour of the methods the pupils are currently studying. For
example, asking pupils to use number facts exclusively, rather than informal counting - on
strategies, may subtly suggest to pupils that counting is no longer part of the domain of
mathematics because it is no longer acceptable in mathematics class. If pupils discount their
prior knowledge of mathematics and their informal solution processes, they are discounting a
proportion of their achievement in mathematics. A resulting conjecture is that this will lower
their confidence, especially for pupils who have difficulty with mathematics and consequently
affect their mathematical attainment (Fletcher, 1997).
Another scheme which was based on, and still uses, the constructivists paradigm is the
international Mathematics In Society Project (MISP). The project started in the he early 1980s
and continued to be developed in the late 80s and the early 90s in the UK, USA and Australia
mainly for the secondary school level. In general MISP relates mathematics to the "real world",
albeit the nature of "real world" can be seen from different perspectives. A great deal of
innovative work has been completed through MISP.
Here in Ghana, several attempts have been made, with very little success, to encourage
mathematics teachers to switch from the transmission approach to mathematics teaching to
activity-based approaches. The difficulties involved in making the switch include counteracting
the effect of an examination system which encourages rote learning and recall of facts, lack of
expertise among teachers of mathematics and teacher's resistance to change which stems mainly
from their lack of content and pedagogic content knowledge in mathematics. However, the
newly introduced Whole School Development (WSD) concept promises to make some impact by
providing a way of encouraging teachers to make this important switch (GES Teacher education
Division, 1999).
The WSD is an intervention process funded by the British Council and is designed among other
things to improve the quality of teaching and learning in Ghanaian primary schools. This is done
through the provision of support to promote the development of competent and motivated
teachers in the areas of literacy (mainly English language), numeracy (ie mathematics) and
problem solving (involving the application of scientific principles). A number of workshops have
been organised by the Teacher Education Division (TED) of the Ghana Education Service (GES)

35
for teachers and headteachers to enable them improve the teaching of the three areas mentioned
above. It is hoped that by the end of the year, 2001 the intervention 'scheme' would have been
adopted by all primary schools in the country (GES, 1999).
As far as the teaching of mathematics is concerned, a number of guidelines have been introduced
through the WSD programme which are in line with the constructivist philosophy. For example,
teachers of mathematics are being asked to encourage pupils to talk about their work and also to
pose and solve their own problems. Group work is also being encouraged and education officials
whose roles were mainly inspectorial are now being asked to provide support for teachers to
enable them teach better rather than simply pass evaluative judgements on teachers' work. It is
early days yet and the full impact of the WSD process may not be known until in about three or
more years time when all primary schools in the country may have been taken on board.
Nevertheless, reports from monitoring teams (TED, 1999) suggest that, with regard to the
teaching of mathematics, the envisaged change is becoming visible in the pilot schools.
Concerning the assessment of mathematical attainment, the constructivist concept is arguably far
removed from the traditional forms of tests, not only because the pupil is given the opportunity
to take part in the assessment process, but the pupil is assessed on what he or she has learnt
(Garcia and Pearson, 1994). . Indeed, by allowing pupils an opportunity to assess themselves and
by encouraging regular dialogue with teachers, the way is open for pupils to make comments
about why they have not achieved a particular goal. Pupils may find themselves becoming
increasingly involved in assessing the nature and quality of the mathematics being taught and
how it is being taught.
A way forward is to seriously consider the alternative assessment procedures which encourage
the use of different variety of instruments (Huerta-Macias, 1995). Yet lack of expertise among
mathematics teachers particularly in the basic schools means there will be practical problems in
the assessment of pupils' performance in constructivist settings. This can make the constructivist
agenda difficult to pursue in mathematics Education in Ghana, at least, for now.
Nevertheless, as mentioned above, the WSD programme can be the starting point and provided
all mathematics teachers can be exposed to the programme, the country may make headway as
far as the much needed switch is concerned.
Until mathematics teachers at all levels of the educational system are given the required training,
it is difficult to see how constructivism can flourish in mathematics Education in Ghana.
References
GES Teacher Education Division (1999) A handbook for the Training of Headteachers and
Circuit Supervisors. Accra: Ministry of Education.
Brieter, C. (1985) 'Towards a solution to the learning Paradox. Review of Educational Research,
55, pp. 201 - 126.
Carpenter, T.P., Fennema, E., Peterson, P.L., and Carrey, D.H. (1988) Teaching arithmetic.
Journal for Research in Mathematics Education 19, 385-401.
Davis, P. and Hersh, R. (1981). The Mathematical Experience, Middlesex: Penguin Books.
Dowling, P.C. (1990) 'The Slogans and other Curriculum Voices' in P.C. Dowling and R. Noss
(eds). Mathematics versus the National Curriculum London, Falmer Press

36
Ernest, P. (1991). The Philosophy of Mathematics Education. London: Falmer.
Fletcher, J.A. (1992). The Assessment of Mathematical Performance. (Unpublished master's
dissertation), London: University of London Institute of Education.
Fletcher, J.A.(1995). Mathematics Teachers' Perception of the aims of Mathematics Education
in Ghana. A paper presented at the Mathematical association of Ghana (MAG) workshop
in the Swedru District of Ghana May, 1995.
Fletcher, J.A. (1997). A study of the Appraisal of Mathematics Teachers in Ghana Unpublished
Ph.D Thesis. London: University of London Institute of Education.
Garcia, G.E. and Pearson, P.D. (1994) Assessment and Diversity in L. Darling Hammond (Ed).
Review of Research in Education. (pp.337-391). Washington D.C. American Research
Association.
GES (1999). Whole School Development Accra: Ministry of Education.
Halmas, P.C. (1985).’Pure Thought in Better’ College Mathematics Journal, 16 pp. 14 - 16
Huerta-Macias R. (1995) Alternative Assessment. Response to commonly asked Question.
Teaching of English as a second language (TESOL) Journal Volume 5(1) pp. 8-11.
Jeworski, B. (1994). Investigating Mathematics Teaching: A Constructivist Enquiry. London:
Falmer Press.
Kanbogtah, E.S. (1999). A Comparative Study of Post Senior Secondary School and Post-
Ordinary Students' Mathematics Achievement in Teacher Training Colleges. Cape Coast:
University of Cape Coast.
Koss, R. and Mark, S. (1994). 'Implementing the Professional Standards for teaching
mathematics: The teacher and evaluation' . Mathematics Teacher, 87(8) 614-17
Lakatos, I. (1962). ‘Infinite Regress and Foundations of Mathematics’ Aristotelian Society
Proceedings, Supplementary Volume. 36, 155-184.
Norwood, K. (1999). Guiding the Mathematics Teacher in the use of Alternative Assessment. (A
paper presented on Alternative Assessment) Cape Coast: University of Cape Coast.
O'Reilly, D. (1990) 'Hierarchies in Mathematics: A critique of the CSMS Study' in P.C. Dowling
and R. Noss (eds) Mathematics versus the National Curriculum London: Falmer Press
Plato (1941). The Republic of Plato. Oxford: Clarendon.
Raymond, A.M. (1993). Understanding the Relationships between beginning elementary
mathematics teachers' beliefs and teaching practices. Unpublished doctoral dissertation,
Bloomington: Indiana University.
Simon, M. and Schifter, D. (1993). Towards a constructivist perspective: The of a mathematics
teacher in-service program on students Educational Studies in Mathematics 25, 331-340.
Teacher Education Division (TED) of GES (1999). Monitoring Whole School Development. A
report by the team monitoring the Whole School Development Programmes, Accra:
Teacher Education Division of GES (Ministry of Education, Ghana).
Thompson, A. (1984). The relationship of teacher's conceptions of mathematics and
mathematics

37


39
Article 3
The Relationship between Students’ BECE and SSSCE Grades in Mathematics
Asare-Inkoom, A.
Department of Science Education, University of Cape Coast Cape Coast, Ghana
Abstract
The purpose of the study was to find out whether there was a relationship between
students’ performances in mathematics in the Basic Education Certificate Examinations
(BECE) and Senior Secondary School Certificate Examinations (SSSCE) in the Cape
Coast Municipality. A sample of 400 students from two randomly selected schools was
used. These 400 students were made up of two groups of 100 each from one school who
took their BECE in 1996 and 1997 and another two groups of 100 each who also took
their BECE in 1997 and 1998. The BECE performances of the 1996 and 1997 were
compared with their respective SSSCE performances in 1999 and 2000. Similarly, the
BECE performances of the 1997 and 1998 groups were compared with their respective
SSSCE performances in 2000 and 2001. The SPSS software was used to analyze the
results. The results show that there were no significant correlations between the BECE
Mathematics performances and that of the SSSCE. All the hypotheses were tested at five
percent level of significance.
Introduction
Research has shown that there was a significant correlation between Ordinary Level (O/L)
Mathematics performance and that of the Advanced Level (A/L) (Wuddah, 1981). Wuddah
(1981) studied the relationship between students’ grades at the O/L and the A/L not only in
Mathematics but also in Physics, Chemistry, Biology, Geography, Economics, Government,
History, Bible Knowledge, English Literature and French. Students’ 1977 O/L grades in these
subjects were compared with their corresponding 1979 A/L grades. Again the 1978 O/L grades
in the same subjects were compared with the 1980 A/L grades for the same set of students. In all
these, it was only in Government that had no significant correlation. Wuddah (1981), therefore,
concluded that since the O/L performance was related to that of the A/L, the practice of selecting
sixth formers on the basis of the O/L results should continue.
Soriyan (1973) did similar studies comparing School Certificate grades with that of Higher
School Certificate grades in seven subjects, including mathematics. Soriyan (1973), found that
some of the correlations were significant while others were not. Soriyan (1973), therefore
concluded that since some candidates might pass the O/L with distinction and fail A/L and vice
versa, school heads had to be liberal in their requirements for selection into the sixth form
schools. Andrews (1982) study also shows that performance at the Common Entrance
Examinations was not related to the School Certificate Examinations.

40
Eshun (1999) also compared mathematics performance of 1528 students from 12 schools in
mock examinations with their West African Examinations Council’s Ordinary Level examination
in mathematics. Eshun (1999) concluded that there was significant correlation between the
grades at these two levels, hence there was the need for mock examinations for final year
students.
Procedure
Population and Sample
Simple random sampling techniques were used to select Wesley Girls’ High School (WGHS)
[coded School A] and Adisadel College [also coded School B] for the study. Examinations
results of two batches from each school were used. These batches include: for WGHS, students
who sat for the BECE in 1997 and 1998 and their corresponding results for the SSSCE in 2000
and 2001. For Adisadel College, students who sat for the BECE in 1996 and 1997 and their
corresponding results for the SSSCE in 1999 and 2000 were involved in the study. An average
of 340 students from WGHS and 622 students from Adisadel College wrote the SSSCE each
year (during the period of study). However, these numbers keep on increasing each year. A
sample of 100 students was however selected from each batch giving a total of 400 students
involved in the study. Random numbers were used to select these students. Results of these
students were obtained from the schools as well as the Municipal Education Office, Cape Coast.
Results and Discussion
The SSSCE grades of students were coded as follows A – 1; B – 2; C – 3; D – 4; E – 5 and F – 6.
Table 1 gives the frequency distribution of grades at the BECE and SSSCE of selected students
in school A.
Table 1 Frequency Distribution of Grades at BECE and SSSCE in School A
GRADE BECE (1997) SSSCE (2000) BECE (1998) SSSCE (2001)
A (1) 90 58 92 46
B (2) 10 28 8 24
C (3) - 4 - 10
D (4) - 2 - 6
E (5) - 6 - 10
F (6) - 2 - 4
TOTAL 100 100 100 100

41
Table 2 also gives the frequency distribution of grades at the BECE and SSSCE of the selected
students in school B.
Table 2: Frequency Distribution of Grades at the BECE and SSSCE in School B
GRADE BECE (1996) SSSCE (1999) BECE (1997) SSSCE (2000)
A (1) 98 12 96 24
B (2) 2 18 4 26
C (3) - 12 - 12
D (4) - 14 - 14
E (5) - 30 - 16
F (6) - 14 - 8
TOTAL 100 100 100 100
A glance at Tables 1 and 2 indicate that while all the students passed with grades 1 or 2 at the
BECE in both schools, the story was different at the SSSCE level. For example in school A
while 90 percent of the selected students passed mathematics with Grade 1 at the BECE in 1997,
58 percent of the same students passed mathematics with Grade A at the SSSCE in 2000. In
school B, while 98 percent of the selected students passed with Grade 1 in mathematics at the
BECE in 1996, only 12 percent of the same students passed with Grade A in mathematics at the
SSSCE in 1999.
Hypothesis
It was the expectation of the researcher that there was a correlation between the mathematics
grades of the BECE and those of the SSSCE. Thus the null hypotheses were formulated as
follows:
• There were no correlations between the mathematics grades at the BECE and those of the
SSSCE.
• There were no significant differences between the mean grades of the BECE mathematics
grades and those of the SSSCE mathematics grades.
The null hypotheses were stated in this way because if there were correlation between the two
sets of grades then there should not be significant difference between them. Table 3 shows the
output from SPSS showing the basic statistics and the various correlation coefficients of the
selected groups.

42
Table 3: Basic Statistics and the Correlation Coefficients
Paired Samples Statistics
SCHOOL A Mean Grade N Std. Deviation Std. Error
Mean
WGHS-BECE (1997)
WGHS-SSSCE (2000)
1.1000
1.7600
100
100
0.3015
1.2319
3.015E-02
0.1232
Paired Samples Correlations
SCHOOL A N Correlation Sig.
WGHS-BECE (1997) & WGHS-SSSCE (2000) 100 0.228 0.022
Paired Samples Statistics
SCHOOL A Mean N Std. Deviation Std. Error
Mean
WGHS-BECE (1998)
WGHS-SSSCE (2001)
1.0800
2.2200
100
100
0.2727
1.5214
2.727E-02
0.1521
Paired Samples Correlations
SCHOOL A N Correlation Sig.
WGHS-BECE (1998) & WGHS-SSSCE (2001) 100 -0.092 0.365
Paired Samples Statistics
SCHOOL B Mean N Std. Deviation Std. Error
Mean
ADISCO-BECE (1996)
ADISCO-SSSCE (1999)
1.0200
3.7400
100
100
0.1407
1.6552
1.407E-02
0.1655
Paired Samples Correlations
SCHOOL B N Correlation Sig.
ADISCO-BECE (1996) & ADISCO-SSSCE (1999) 100 -0.151 0.134
Paired Samples Statistics
SCHOOL B Mean N Std. Deviation Std. Error
Mean
ADISCO-BECE (1997)
ADISCO-SSSCE (2000)
1.0400
2.9600
100
100
0.1969
1.6571
1.969E-02
0.1657
Paired Samples Correlations
SCHOOL B N Correlation Sig.
ADISCO-BECE (1997) & ADISCO-SSSCE (2000) 100 -0.119 0.239
As shown in Table 3 above, the correlation between 1997 BECE grades and those in 2000
SSSCE grades in school A was 0.228 with p-value of 0.022 (< 0.05). This means that there was
some correlation between the 1997 BECE grades and the 2000 SSSCE grades in school A. A
correlation coefficient of 0.228 indicates a weak correlation.
The correlation coefficient for the 1998 BECE grades and those of the 2001 SSSCE grades in
school A was –0.092 with a p-value of 0.365. This indicates that there is no correlation between
the two sets of grades since there is no significant correlation. Indeed, a correlation coefficient of
–0.092 is indication of very weak negative linear relation.

43
In school B, the correlation coefficient between the mathematics grades in the 1996 BECE and
that of 1999 SSSCE was –0.151 with a p-value of 0.134. That for the 1997 BECE mathematics
grades and those of the 2000 SSSCE grades was –0.026 with a p-value of 0.797. In both cases
there were no significant correlations. Again there are weak negative linear relations between the
two pairs of sets of grades
The regression plot with the associated prediction line for the 1997 BECE mathematics grades
and those of the 2000 SSSCE mathematics grades is shown in graph below.
Fig. 1 Regression plot of WGHS 1997 BECE against 2000 SSSCE mathematics grades
0
0.5
1
1.5
2
2.5
3
0 0.5 1 1.5 2 2.5
WGHS BECE 1997
WGHS SSSCE 2000
A closer look at the prediction equation shows that it is a poor predictor. For example using the
prediction line equation y = 0.733 + 0.933x (where y represents a mathematics grade for SSSCE
2000 and x, the 1997 BECE mathematics grade for school A) then a candidate who had grade 1
in the BECE should be expected to obtain a grade of 2 or B at the 2000 SSSCE. However, in
1997, there were 90 out of the 100 students who obtained grade 1 in the BECE mathematics
examination. Out of the same 100 students, 58 obtained grade A (1), 28, grade B (2), 4, grade C
(3), 2, grade D (4), 6 grade E (5) and 2 grade F at SSSCE.
The relationship between 1998 BECE mathematics grades and the SSSCE mathematics grades
for school A is also displayed on the regression plot in Fig. 1.
y = 0.733 + 0.933x

44
Fig. 2 Regression plot of WGHS 1998 BECE against 2001 SSSCE mathematics grades
0
0.5
1
1.5
2
2.5
0 0.5 1 1.5 2 2.5 3
WGHS BECE 1998
WGHS SSSCE 2001
The regression line in Fig. 2 shows a weak negative linear relation and the prediction line
equation is a poor predictor. An interesting feature of this relation is the negative correlation,
meaning a high grade in BECE should result in a low grade in SSSCE. In school B, the
regression plot for mathematics grades for 1996 BECE and those of 1999 SSSCE mathematics
grades is shown in Fig. 3.
Just like the previous graph, there is an inverse relationship between the 1996 BECE
mathematics grades and the 1999 SSSCE mathematics grades. Again the prediction equation is
not a good predictor.
With reference to the equation, a BECE grade of 1 should result in a SSSCE grade of 4, while a
BECE grade of 2 should result in a SSSCE grade of 2. However, from Table 2, 98 out of the 100
students obtained grade 1 at the BECE in 1996 in school B, while the remaining 2 obtained grade
2. Interestingly, the 1999 SSSCE grades obtained by the same students were as follows: grade 1
– 12; grade 2 – 18; grade 3 – 12; grade 4 – 14; grade 5 – 30 and grade 6 – 14.
y = 2.77174 - 0.510870x

45
Fig. 3 Regression plot of WGHS 1996 BECE against 1999 SSSCE mathematics grades
0
0.5
1
1.5
2
2.5
3
3.5
4
0 0.5 1 1.5 2 2.5
WGHS BECE 1996
WGHS SSSCE 1999
The regression plot of the1997 BECE mathematics grades and the 2000 SSSCE mathematics
grades for school B depicture similar features as can be seen in Fig. 4.
Fig. 4 Regression plot of ADISCO BECE 1997 against 2000 SSSCE mathematics grades
0
0.5
1
1.5
2
2.5
3
3.5
0 0.5 1 1.5 2 2.5
ADISCO BECE 1997
ADISCO SSSCE 2000
The graph shows a weak negative relationship between the two grades. It is interesting to note
that apart from the relationship between the 1997 BECE mathematics grades and the 2000
SSSCE mathematics grades for school A that showed positive weak correlation, all the others
showed negative weak correlation.
y = 5.55102 - 1.77551x
y = 4 - 1x

46
On the other hand, if the grades are considered as scores and the mean grades are computed, the
hypotheses that there are no significant difference between the mean grades were tested all at a
significance level of five percent. In school A, the first hypothesis was that, there was no
significant difference between the mean grade of the 1997 BECE mathematics grades and that of
the 2000 SSSCE mathematics grades. The out from SPSS for this test is shown in Table 4.
Table 4 Paired Samples Test
Paired Differences
School A Mean
Std.
Deviation
Std.
Error
Mean
95% Confidence
Interval of the
Difference
Lower Upper t df
Sig.
(2-tailed)
BECE 1997 &
SSSCE 2000 -0.6600 1.1995 0.1199 -0.8980 -0.4220 -5.502 99 0.000
From Table 4, the t-value for the test was –5.502 with a p-value of 0.000. This is highly
significant, indicating that there is a difference between the mean grade of the 1997 BECE
mathematics grades and that of the 2000 SSSCE mathematics grades. This indicates that there is
no correlation between the two grades. If there were to be correlation between the grades, then
we should not expect the two sets of grades to differ significantly. Tables 5, 6 an7 show the
remaining tests.
Table 5 Paired Samples Test
Paired Differences
School A Mean
Std.
Deviation
Std.
Error
Mean
95% Confidence
Interval of the
Difference
Lower Upper t df
Sig.
(2-tailed) BECE 1998) & SSSCE (2001) -1.1400 1.5700 0.1570 -1.4515 -0.8285 -7.261 99 0.000

47
Table Paired Samples Test
Paired Differences
School B
Mean
Std.
Deviation
Std.
Error
Mean
95% Confidence
Interval of the
Difference
Lower Upper
t
df
Sig.
(2-tailed)
BECE 1996) &
SSSCE (1999)
-2.7200 1.6822 0.1682 -3.0538 -2.3862 -16.169 99 0.000
Table 7 Paired Samples Test
Paired Differences
School B
Mean
Std.
Deviation
Std.
Error
Mean
95% Confidence
Interval of the
Difference
Lower Upper
t
df
Sig.
(2-tailed)
BECE 1997) &
SSSCE (2000)
-1.9200 1.6918 0.1692 -2.2557 -1.5843 -11.349 99 0.000
As shown in the above tables the results indicated significant differences between the BECE
grades and the SSSCE grades in mathematics. Indeed, all the four null hypotheses were rejected
at five percent level of significance since in all the tests the p-value in each case was less than
0.05. [In all the tests, p-value was 0.000 as seen in the Tables above.]
All these are reflected in the regressional plots. The graphs show very weak correlations
implying that the BECE results may not be used to predict the SSSCE results in mathematics.
This seems to be contrary to Wuddah’s (1981) study of O/L and A/L. However, these results
confirm Oppong’s (1999) study. It appears, therefore, that the assessment at these two levels
seems to be different. Perhaps the drastic decline in the performance at the SSSCE might be
partially attributed to inflation of continuous assessment marks at the JSS level for candidates to
ensure their good performance. This view is supported by Omari (1994) who says that teachers
dream up the continuous assessment marks at the JSS. This to the researcher is quite strong an
expression. What the researcher would suggest to headmasters and headmistresses is that they
should be cautious in their admission of JSS students in their senior secondary schools, for the
BECE grades seem not to be reliable to predict the outcomes of SSSCE grades.
References
Eshun, B. A. (1999). The Pattern of Mathematical Achievement of Secondary School Students in
Ghana. Journal of Science and Mathematics Education 2 (1) , 22-33.
Omari, S (1994). “Continuous Assessment Unhelpful”. Daily Graphic, 22 August p. 7

48
Oppong, F. K. A (1999). The Relationship between Students’ BECE and SSSCE Grades in
Mathematics: A case study of Presbyterian Senior Secondary School at Brekum. A
Project Work submitted to Faculty of Education, University of Cape Coast.
Soriyan, M. A. (1973). Relationship Between School Certificate and Higher School Certificate
Grades. Test Development and Research Office, West African Examinations Council,
Lagos: Nigeria.
Wuddah, A. A. (1981). Relationship Between Grades at ‘O’ and ‘A’ Levels Examinations. Test
Development and Research Office, West African Examinations Council, Accra: Ghana.

49
Opportunity to Learn English and Mathematics in Ghanaian Primary Schools: Implications for Teacher Education Programmes
Dr. K. D. Mereku Faculty of Science Education, UEW, Winneba
Prof. F. K. Amedahe Faculty of Education, University of Cape Coast
&
Dr. Y. K. A. Etsey
Faculty of Education, University of Cape Coast
The Ghana Basic Education Comprehensive Assessment System (BECAS) is a new assessment system which replaced national tests that were instituted since the 1992 to monitor primary school pupils’ achievement and progress in English and Mathematics. To ensure the new system assesses closely what teachers actually teach, the BECAS Team carried out a survey of the contexts of learning in primary schools to inform the development of a new comprehensive assessment system. The study examined whether or not the opportunities provided in primary schools for learning are good enough to promote learning for all of pupils and assure high levels of outcomes for all pupils. The study which involved 1,063 teachers sampled from the ten regions of the country was carried out in schools in July 2004. A questionnaire was used to gather data on teachers’ schools, classes taught, location of schools, class size, gender, professional qualifications, instructional resources for teaching English and mathematics, instructional time for teaching English and mathematics, and coverage of content of English and mathematics in teachers’ instruction over the year. A major finding of the study was that OTL standards for most schools were very low and it was observed that the majority of teachers completed nearly 60% of the content of the mathematics and English syllabuses. The analysis also indicated that there were grave inequalities between schools as well as districts in the following
• availability and adequacy of textbooks, • availability and adequacy of instructional materials, • teachers’ instructional practices and management of instructional time, and • teachers’ preparedness to implement the content standards.
These inefficiencies could be attributed to the fact that the curriculum content standards are clearly defined by the syllabuses of the various subjects taught at the basic level, no OTL standards have been set to guide their implementation. It is recommended that CRDD should be made to set OTL standards that will assure a high level of achievement for all pupils. That is, state the indicators that will assure a fair and appropriate provision of inputs and processes in basic schools. Also teacher education programmes should ensure that teachers are not only exposed sufficiently to OTL standards but also the strategies that they can be adopted to ensure such standards are maintained and improved.
Introduction
Five years after the Educational Reform Programme was initiated in 1987, a national test,
designated Criterion Referenced Test (CRT) was instituted to assess Primary 6 pupils’
achievement in English and Mathematics. Despite the fact that the CRT was a quality assurance
measure, it was instituted principally to ensure whether or not the processes and inputs
introduced during the educational reforms were helping to improve the quality of education
(CRDD, 2001). The USAID assisted the Ministry of Education in the development and
administration of the CRT from 1992 to 1999. Though the CRT indicated that less than 10
percent of the pupils are reaching mastery and the performance in both English and Mathematics

50
has been rising slowly but steadily beginning from the base year of 1992, it could not provide
enough information to assess the effectiveness of the processes and inputs introduced during the
educational reforms.
It has been observed that pupils perform best on tests that assess subject matter content which
pupils have had the opportunity to learn (Gamoran, Porter, Smithson, and White, 1997;
Robitaille, et al, 1994). Though supported time and again by research, this observation is little
more than common sense. In connection with assessment, Winfield (1987:438) notes that
opportunity to learn relates to "the provision of adequate and timely instruction of specific
content and skills prior to taking a test". She adds that opportunity to learn may be measured by
"time spent in reviewing, practicing, or applying a particular concept or by the amount and depth
of content covered with particular groups of students" (p. 439).
One the major limitation of the CRT was that the test coverage exceeded the realities of the
classroom. Items for the CRT covered the entire curriculum (syllabus) for Primary 6 and
outcomes pupils attained were compared with the entire intended curriculum, even though a
substantial proportion of the content prescribed in the syllabus could not be implemented under
the conditions that prevailed in schools. Though curriculum content standards in the various
Ghanaian primary school subjects are clearly defined by syllabuses designed by CRDD, little is
said about the processes and inputs required for their attainment. That is, the curriculum content
standards we currently have in this country are silent over the opportunities to learn that must be
provided to promote high level of achievement for all pupils.
Opportunity to learn refers to equitable conditions or circumstances within the school or
classroom that promotes learning for all students (Porter, 1993). It includes provision of
curricula, teaching/learning material, facilities, teachers, and instructional experiences that
enable students to achieve high standards. The term also refers to absence of barriers that prevent
learning. The present opportunity to learn study was included in the planning of the Ghana Basic
Education Comprehensive Assessment System (BECAS) to provide essential information that
will ensure the quality of the assessments and the ethics of testing what is actually taught. Finally
information from the study would guide the development of the new National Education
Assessment (NEA), which is being developed under the BECAS project, to make it assess
performances on what is actually taught, as well as document what aspects of the curriculum go
unlearned and/or untaught.
Studies in national curriculum in Ghana
OTL standards can be defined as the criteria for, and the basis of assessing the sufficiency or
quality of the resources, practices, and conditions necessary at each level of the education system
to provide all students with the opportunity to learn the material in national curriculum
(Ysseldyke, Thurlow, and Shin, 1995). No study in Ghana has looked fully at the curriculum
delivery standards. Two studies have examined aspects of these standards.
The first was a study commissioned by the Ghana Ministry of Education in 1993 to examine and
analyze the primary school official curriculum materials – syllabuses, pupils’ textbooks and
teacher’s guides. The study reported that mathematics teaching in basic schools focuses on

51
computation skills, learning of formulas, rote practice and teaching as telling. The study also
reported that the vast majority of Ghanaian children are growing up functionally illiterate in both
their native language and in English. The principal investigator in this study, Kraft (1994),
attributed these unfortunate developments to the poor nature of curriculum, including syllabi,
textbooks and teachers’ handbooks, used in the nation’s schools. He argued that the current syllabi, textbooks and teachers’ handbooks do not meet the highest international standards, nor the current best thinking on sequence, learning and pedagogy and will not prepare Ghanaian students for the needs of the next century (Kraft:2).
The second study was TIMSS-2003, which was the third in a series of studies undertaken once
every four years by the International Association for the Evaluation of Educational Achievement
(IEA). The performance of the junior secondary school form 2 (JSS2) students in the TIMSS was
unsurprisingly very poor because of the nature of mathematics students are made to experience at
school in this country (Anamuah-Mensah, et al., 2004). Analyses of the students’ performance
on the TIMSS mathematics test items show that the few (about 15%) items for which most
students were able to make correct responses were those that were testing knowledge of facts and
procedures. They performed poorly on items that tested their ability to use concepts, solve non-
routine problems and reason mathematically.
Analysis of the TIMSS data on the context for learning mathematics in Ghanaian schools
indicate students have little opportunity to engage in activities that will enable them to use
concepts, solve non-routine problems and reason mathematically (Mullis, et. al., 2004).
Anamuah-Mensah, et al. (2004) observed that only 42 percent of Ghanaian JSS mathematics
teachers used the mathematics textbooks as the main basis for mathematics lessons while 54
percent used it as a supplementary resource. Thus, the textbooks were used mainly by Ghanaian
teachers as a supplement to other materials that teachers may have in their possession. This was
not the case in most of the high performing countries such as Singapore, Korea and Japan, where
the textbooks were the primary materials used in teaching the subject. In Ghana, the textbooks
were used mainly as a supplementary resource because they are obsolete and do not align with
the current syllabuses in school.
Purpose of the study
In order to come out with a comprehensive assessment system that can ensure all primary school
pupils do reasonably well or do not feel failures, it is necessary to consider the OTL provided in
the primary schools. It is necessary to know whether or not the opportunities provided in primary
schools for learning are good enough to promote learning for all of pupils and assure high levels
of outcomes for all pupils.
The purpose of the study was to find out
• teachers’ preparedness to implement the content of the national curriculum in English
and mathematics
• the adequacy and availability of resources provided for the delivery of the national
curriculum content in English and mathematics;
• how well the instructional times for teaching English and mathematics were
managed;

52
• extent of teachers’ coverage of the national curriculum content in English and
mathematics
• extent of teachers’ emphasis in the national curriculum content in English and
mathematics
• teachers’ content emphasis for individual students or groups of students (i.e. whether
or not the content is differentiated to ensure each student achieves his/her highest
potential);
The study did not cover all aspects of OTL for Ghanaian schools.
Methodology
The study involved 1,063 teachers teaching in primary schools in the country. There were both
trained and untrained teachers of which 44.1% were male and 55.9 were female. A questionnaire
was used to gather data on teachers’ schools, classes taught, location of schools, class size,
gender, professional qualifications, instructional resources for teaching English and mathematics,
instructional time for teaching English and mathematics, and coverage of content of English and
mathematics in teachers instruction over the year.
Findings
The main findings of the study were
i. Majority (84) percent of the primary school teachers have low teaching qualifications and a
substantial proportion (12.3%) is not at all trained. It can be argued in this regard that the
preparedness of the majority of teachers to implement the content of the curriculum in
English and mathematics is low.
ii. Difficulties in teaching certain topics in the two subjects were expressed by 21 and 34 percent of the English and mathematics teachers respectively.
iii. The schools do not have sufficient resources to deliver high level of curriculum content and
also to achieve higher levels of outcomes for all students. Only 21 percent of the teachers
indicated that pupils’ English textbooks were available and adequate while 43 percent
indicated that pupils’ mathematics textbooks were available and adequate. The environment
for learning mathematics and English for many Ghanaian pupils is not conducive for teachers
to deliver their best and help pupils to achieve their highest potentials.
iv. Lessons in many schools do not start early. The instructional time was often interrupted with
co-curricular (or planned non-instructional) activities like, school worship, cleaning
compound and classrooms, gardening, practicing sports for athletics meetings, practicing
matching and cultural activities, just to mention a few.
v. More than half of the teachers (53%) indicated they followed the timetable, but as many as
47 percent did not rigidly follow it.
vi. About 30 percent of the teachers indicated that they were able to cover only half of the English syllabus. Only about 20 percent completed the syllabus but the majority was able to
cover up to 80% of the content of the English syllabus.

53
vii. About 31 percent of the teachers indicated that they were able to cover only half of the mathematics syllabus content and 21 percent indicated that they were able to cover all the
content. The majority was able to cover up to nearly 80% of the content of the mathematics
syllabus.
viii. Certain topics/units were not taught by many of the teachers in the two subjects. Some of
the unpopular topics in mathematics were shape and space, length, capacity and mass,
decimals and percentage, investigations with numbers, time and money, collecting and
handling data, chance, and area and volume. While some of the unpopular topics in English
were library, story telling, drama, song, mechanical writing, poem and verse, and
directions/instructions
ix. In teaching English, the teachers gave equal attention to comprehension/reading,
writing/composition and language item (grammar and structure). But nearly half of them did
not give adequate attention to units in oral language (listening and speaking). In teaching of
mathematics, almost all teachers taught topics in number and numeral as well as shape and
space. A substantial proportion of teachers gave little attention to the other content domains –
operations/algebra, measurement and handling data.
x. Many of the teachers indicated they often or sometimes grouped their pupils by ability during
mathematics and English lessons. However it was observed that classes were too large for
organizing any effective group work. In about 25 percent of the classes the number of pupils
in a class ranged from 31 to 40, and there were over 40 pupils in more than 40 percent of the
classes.
Conclusion
It was found that the preparedness of the majority of teachers to implement the content of the
curriculum in English and mathematics was low; and a substantial proportion experienced
difficulties in teaching certain topics in the two subjects. The schools were also found not to have
sufficient resources to deliver high level of curriculum content and also to achieve higher levels
of outcomes for all students. Textbooks, classroom furniture and teaching/learning materials
were inadequate in supply. Notwithstanding, classes were too large for organizing any effective
group work. There were over 40 pupils in more than 40 percent of the classes. Besides, lessons in
many schools do not start early and the instructional time in the year was often interrupted with
co-curricular (or planned non-instructional) activities.
As a result, that a substantial proportion of the primary school mathematics and English curricula
go untaught. Some of the unpopular topics in mathematics were shape and space, length,
capacity and mass, decimals and percentage, investigations with numbers, time and money,
collecting and handling data, chance, and area and volume. While some of the unpopular topics
in English were library, story telling, drama, song, mechanical writing, poem and verse, and
directions/instructions. Another consequence of the insufficient textbooks and resources to
deliver the curriculum is teachers giving little attention to units in oral language (i.e. listening
and speaking) and little attention to operations/algebra, measurement and handling data in
mathematics.

54
Though curriculum content standards are clearly defined by the syllabuses of the various subjects
taught at the basic level, the study has shown that no OTL standards have been set guide the
implementation of these content standards. Hence there are grave inequalities between schools in
• availability and adequacy of instructional materials,
• availability and adequacy of textbooks,
• teachers’ instructional practices and management of instructional time, and
• teachers’ preparedness to implement the content standards.
Recommendations
The tests items for NEAs and SEAs developed for the BECAS should cover largely the critical
objectives in the primary mathematics and English syllabuses which are usually taught by all
teachers. This will also ensure there is match in content emphasis as well as coverage in the
official curricula and what teachers actually teach.
The CRDD should be made to set opportunities to learn (OTL) standards that must be provided
to promote high level of achievement for all pupils. It should indicate who should provide the
resources that will be required to meet the OTL standards for teaching in basic schools. In doing
so, they should make a list of resources that schools can be encouraged to acquire themselves in
the implementation of the content standards and those that have to be supplied by the
government.
The CRDD should also advise the MOES on issues relating policy on class sizes, INSET and
continuing professional education of teachers, use of instructional time,
Textbooks that match the revised syllabuses for mathematics and science should be purchased
for teachers.
A quality assurance mechanism should be put in place to ensure schools meet these standards in
the implementation of the content standards.
Implication for Teacher Education Programmes
Teacher education programmes should ensure that teachers are not only exposed
sufficiently to OTL standards but also the strategies that can be adopted to ensure such
standards are maintained and improved.
Prospective and in-service teachers should be sufficiently exposed to standards on
• educational input/resources,
• teachers’ instructional practices,
• management of instructional time, and
• continuing in-service education and training (INSET) that will improve teachers’
efficacy.

55
References
Anamuah-Mensah, J., Mereku, D. K. and Asabere-Ameyaw, A. (2004). Ghanaian Junior
Secondary School Students’ Achievement in Mathematics and Science: Results from
Ghana’s participation in the 2003 Trends in International Mathematics and Science
Study, Accra: Ministry of Education Youth and Sports.
CRDD (2001). Performance of Pupils in Criterion-Referenced Test: 1992 – 1999, Accra: GES
CRDD
Gamoran, A., Porter, A.C., Smithson, J., & White, P.A. (1997). Upgrading high school
mathematics instruction: Improving learning opportunities for low-achieving, low-
income youth. Educational Evaluation and Policy Analysis, 19(4), 325-338.
Hawes, Hughes (1979). Curriculum Reality in African Primary Schools, Bristol, England:
Longman.
Kraft, R. J. (1994) Teaching and learning in Ghana: a curriculum, textbook, syllabus and
handbook analysis. Accra, Ghana: Ministry of Education.
Mullis, I. V. S., Martin, M. O., Gonzalez, E. J., and Chrostowski, S. J. (2004) TIMSS-2003
International Mathematics Report: Findings from IEA’s Trends in International
Mathematics and Science Study at the Fourth and Eighth Grades, Chestnut Hill, MA:
Boston Colege
Porter, A. C. (1993). Defining and Measuring Opportunity to Learn. Madison, WI: University of
Wisconsin.
Robitaille, D. F., Schmidt, W. H., Raizen, S., McKnight, C., Britton, E. and Nicol, C. (1994).
Curriculum Frameworks for Mathematics and Science: TIMSS Monograph No.1:
Vancouver, BC: Pacific Educational Press.
Winfield, L F. (1987). Teachers' estimates of test content covered in class and first-grade
students' reading achievement. Elementary School Journal, 87(4), 438-445.
Ysseldyke, J., Thurlow, M., & Shin H. (1995). Opportunity-to-learn standards (Policy Directions
No. 4). Minneapolis, MN: University of Minnesota, National Center on Educational
Outcomes. Retrieved [today's date], from the World Wide Web:
http://education.umn.edu/NCEO/OnlinePubs/Policy4.html (accessed 4/7/2004)


57
Gender Differences in Junior Secondary School Pupils’ Intention to Participate in Elective Mathematics at the Senior
Secondary Level
Joseph Issah Nyala
Abstract The study investigated the intentions to participate in elective mathematics of JSS pupils.
The purposive sampling method was used to select nine Junior Secondary Schools in the
Cape coast Municipality involving 581 pupils. Questionnaires on intention to participate
in elective mathematics were used to gather data. The analysis of data involved
calculating means and finding significant differences in means of specific respondents
using Kruskal-Wallis test. The results of the analysis indicated a positive intent to
participate in elective mathematics at the SSS level by both sexes.
Introduction
Although findings may vary in the literature on gender differences in mathematics participation,
many studies (Armstrong, 1979; Robitaille and Sherill, 1977; Fennema, 1978; Wyoming, 1978)
as cited in Lamb (1997), reveal a low participation in non-compulsory mathematics courses by
females than males. In Ghana, female participation is not only lower than that of males but
females are in reality under-represented. Eshun (1987) reported that out of 200 mathematics
graduates from the University of Cape Coast, only four were females. Dekkers et al (1991)
reported higher enrolment rates in university approved mathematics courses in the final year of
secondary school by boys across the Australian States and territories, thus revealing the higher
involvement in mathematics by boys than girls.
Lamb (1997) cited Teese (1994) as having reported that in 1990 there was a 14% gap in favor of
males in the Australian state of Victoria. In Ghana, Eshun (2000) found a similar wide gap when
he reported that while the percentage of Senior Secondary School males who participated in
elective mathematics increased significantly from only 14.0% in 1995 to 35.85 in 1999, the
percentage of females increased from 4.1% in 1995 to only 13.1% in 1999.
The under-representation of females in mathematics has important implications. There will be a
higher male population in courses like the physical sciences and engineering in the universities
than females. However, a strong foundation in mathematics is a pre-requisite for many careers
and jobs. This is to say that there would be more males in such careers and jobs than females.
This is confirmed by Lamb (1997) as he reports that in the Australian state of Victoria large
differences existed in such higher-level mathematics careers and jobs.
Education is the key to a nations’ success, and mathematics is observed to be of fundamental
significance in this process. A study to investigate the intended participation in elective

58
mathematics by Ghanaian school children at the Junior Secondary level is very relevant. Even
though students at this level can only indicate intentions to study elective mathematics, their
expressed intentions can be used to predict their participation at the Senior Secondary School and
higher levels.
Reporting on the transition of children from primary to secondary school in Great Britain,
Walden & Walkerdine (1985) and Walkerdine (1989) stated that while girls were still
performing as well as boys, by the fourth year of Secondary School, they were often perceived
by the teachers as being less confident and were not helped in the subject, neither were they
encouraged to take the more prestigious ‘O’ and ‘A’ level examinations in the Senior School.
Purpose of the Study
The purpose of this study is to investigate the intention to participate in the study of elective
mathematics at higher levels of Ghanaian Junior Secondary School (JSS) students and determine
any gender differences.
Methodology
The targeted population for the study was Junior Secondary School (JSS) pupils in the Central
Region. The sample was taken from the final year group of the Junior Secondary Schools in the
Cape Coast Municipality.
The sample comprised five hundred and eighty-one (581) pupils from nine (9) schools in the
Cape Coast Municipality of the central Region. Two were private JSS, and the rest were either of
single-sex male, single-sex female or mixed public schools. The breakdown is shown in table 1. Table 1 Distribution of Pupils by Type of School
Type Number
Single-sex male 61
Single-sex female 158
Mixed male 172
Mixed female 190
Total 581
The targeted schools were visited and the Headmasters (J)/Headmistresses (J) served with copies
of a letter seeking permission to conduct the study. The heads were notified of the intended
period when the study would be conducted and asked to specify a convenient day on which they
could make their pupils available for the study involving a questionnaire.
The selection procedure described above was chosen so as to suit the descriptive survey type of
study chosen. As pointed out by Gay (1987), this design involves collecting data in order to test
hypotheses or to answer questions concerning the current status of the subject of the study.

59
Instrument
The instrument employed for the data collection was participatory questionnaire items. The
Likert scale was used in preparing a questionnaire instrument. Each statement had five options of
which one was selected according to the respondent’s feelings. Weights of 1, 2, 3, 4 and 5 were
attached to the options of “Strongly Discouraged (SD)”, “Discouraged (D)”, “Undecided (U)”,
“Encouraged (E)” and “Strongly Encouraged (SE)” respectively.
Mean scores were calculated on scores of responses made. Any mean above three was taken to
indicate a positive intent to participate in mathematics, whilst a mean score below three
suggested a negative intent to participate.
Subjects were made to respond to thirty-two (32) items comprising, ten items on the
respondent’s background, and twenty-two items on respondent’s intention to participate in
elective mathematics of the questionnaire’s close-ended items. Subjects were to provide a tick or
write down the most appropriate initials of the pre-printed responses of each item.
Participatory Factors
Twenty-two questions of the intended participatory factors were classified under eight broad
dimensions. These were: parental influence, career influence, clinics/workshops, teacher
influence, the curriculum, effective motivation, female role model, and peer influence. Each
dimension consisted of a collection of the various items into a unit that pointed to specific
aspects of the intended participatory factors. For instance, “how would you be encouraged to do
mathematics if you are always under a terrible pressure in mathematics class?” suggests a feeling
of mathematics anxiety while “how would you be encouraged to do mathematics if you are well
informed about careers that require mathematics?” suggests the factor, career influence. Table 2
shows a classification of the intended participatory items into units. Table 2 Questionnaire Items Contributing to the Various Dimensions by Nature of
Statement
Intended Participatory Factor Statement
Parental influence 11, 15
Career influence 12, 17, 18
Clinics/Workshops 19, 25, 27
Teacher influence 13, 20, 22, 23, 24, 32
Curriculum 14, 21, 56
Effective Motivation 28, 31
Female Role Model 26, 30
Peer influence 16, 29
Kruskal-Wallis analysis of variance was used to compute and test whether there were any
significant differences between the mean responses of:
a) girls in single-sex schools and boys in mixed schools
b) girls in single-sex schools and girls in mixed schools
c) girls in single-sex schools and boys in single sex schools

60
d) boys in mixed schools and girls in mixed schools
e) boys in mixed schools and girls in mixed schools.
Results of the Study
About two-fifths, representing 40% of the respondents were males whilst three-fifths,
representing 60% of respondents were females. Of the males, there were more males from the
mixed schools than males from single-sex schools. This was intended to find out whether the
presence of females would have any effect on the males’ decision. Of the females, there were
more females from mixed schools than females from single-sex schools.
The average age of respondents was found to be 15.0 years. Only one pupil was ten years old
whilst 19 pupils were aged 18 years. The highest number of respondents was from the age of 15
years. This implies that much as there were a few respondents with ages falling outside the
expected age range of 14 to 16 years, the majority fell within the age range. For those wishing to
proceed to the senior secondary school, 95.4% responded in the affirmative. Only 3.4% would
not want to proceed to the SSS. This implies that majority of the students in the study would
want to study at the SSS. To the vital question, “will you like to do elective mathematics at the
SSS?” 67.6% expressed the desire to study the subject. Of this percentage, 41.8% were females
and 25.8% were males. Thus, more females planned for elective mathematics at this stage. Hence
the possibility of females dominating in mathematics related courses at the higher levels if they
are able to meet their intentions.
To determine the rate at which students of JSS express their intention to participation in elective
mathematics, the number of students who expressed their intentions to study elective
mathematics at the senior secondary school was tabulated in table 3.
Table 3 Number of Students Intending To Study Elective Mathematics at the SSS
Choice of Subject Male Female Total
Elective Mathematics 153 240 393
No Elective Mathematics 80 108 188
Total 233 348 581
Table 3 shows that more females than males expressed their intentions to study elective
mathematics. The results of table 3 were expressed in percentages along two broad categories of
male and female, and recorded in Table 4. The values obtained represented the rates of intended
participation of the two sexes.
Table 4 Rate of Intended Participation by Sex
Percentage of students intending to study Elective Mathematics by Sex
Own Group Total
Male 65.7 26.3
Female 69.0 41.3

61
Table 4 shows that females indicated a higher rate of intent to study elective mathematics than
males, as they recorded a rate of 41.3% as against 26.3% by males.
Intended Participatory Factors
Table 5 shows means of scores of the eight intended participatory dimensions by type of school
and sex.
Table 5 Means of Intended Participatory Scores by Type of School and Sex
Factors Single-sex Single-sex Mixed Mixed
(Male) (Female) (Male) (Female) All
Parental Influence 3.93 4.14 4.12 4.98 4.07
Career Influence 3.92 3.92 4.19 4.08 4.03
Clinics/Workshops 3.76 3.76 3.73 3.77 3.76
Teacher Influence 4.19 4.11 4.09 4.08 4.12
Curriculum 3.89 3.97 3.79 3.83 3.87
Effective Motivation 3.56 4.01 3.55 3.91 3.76
Female Role Model 2.94 3.58 3.63 3.71 3.47
Peer Influence 4.08 3.93 3.62 3.84 3.87
From table 5, it is clear that the mean scores for all students in the sample were above three.
However, at category level, males in single-sex schools registered the only value below three.
Thus, almost all the students selected positive items of the intended participatory dimensions.
The highest mean responses were for teacher influence, career influence and parental influence
in that order.
In all the eight dimensions, males attached more value to the factors, teacher influence and career
influence than females, but the latter were more positive about parental influence. Thus, even
though females are encouraged by their teachers and the types of careers they can do when they
choose to study elective mathematics, they seem to be much more encouraged by their parents to
opt to study the subject.
Discussions
The findings on rates of intention to participate in elective mathematics of JSS pupils indicated a
difference in the rates by sex. This result implies that boys and girls probably had different
encouragement levels to study the subject. Philips (1982) reporting on the effects of career unit
on middle school students’ attitudes towards mathematics and intentions to continue the study of
the subject, stated that the unit positively altered students’ attitudes towards mathematics.
Males and females expressed the same intentions to study elective mathematics at the JSS level.
An implication is that if proper encouragement is given, more girls will participate in elective
mathematics when they move to the SSS than we have now.

62
Males in mixed schools showed more interest in careers involving elective mathematics than
females in mixed schools. The finding is consistent with findings by Looft (1971), Schlossberg
and Goodman (1972) as they found evidence that girls are less career-oriented than boys. This is
confirmed by the high indication by males that they would want to do careers such as
engineering, piloting and accounting among their choices of future careers.
Females in single-sex schools indicated that they receive more support and encouragement from
their parents in learning mathematics than males in mixed schools. Males in mixed schools also
showed that they received more support and encouragement from their parents than females in
mixed schools as was evident in their mean scores. On the whole, females indicated that they
received more support and encouragement from their parents than males. As observed by
Parsons et al (1983), children’s attitudes were influenced more by their parents’ attitudes than
their own past performances within grades 5 to 11. A possible reason is that children tend to
imitate more at this stage. Parsons et al (1983) also observed that most parents would want their
wards to study mathematics and take mathematics related courses, as they see them as
prestigious, and leading to more rewarding careers and jobs. The implication of this finding is
that more career guidance and counseling talks and seminars should be organized for parents to
equip them with relevant information to influence their wards.
From the findings, the following general conclusions were made on the students.
Females indicated that they would be encouraged to study mathematics if they received support
from parents than males. As observed by Fox et al (1980), parental support in mathematics
differs with the sex of the child, but is often in favor of the males. Findings in this study however
indicated the contrary.
Both sexes depended greatly on their teachers in learning mathematics, but students in single-sex
schools expressed the most dependence. This seems to suggest that teachers of JSS single-sex
schools interact more with their students than teachers in mixed schools.
On the whole however, males showed that they received more support and encouragement from
their teachers than females. This finding is supported by findings by Bean (1979) that teachers in
mathematics classes tend to interact more with boys than with girls. Both sexes also indicated
their support for encouragement from their peers.
In view of the above findings it is recommended that teachers modify their relationships with
both sexes of students in their classrooms. Mathematics clubs should be reinstituted in our senior
secondary schools. There is the need also to expand counseling services to parents as well.
References
Bean, J. P (1976) What’s Happening in Mathematics and Science Classrooms? Student-Teacher
Interactions. Paper presented at the meeting of the American Educational Research
Association, San Francisco.
Cockcroft, W. H (1982). Mathematics Counts, HMSO, London.

63
Dekkers, J. Delaetor, J. & Malone, J. (1991). Upper Secondary School Science and Mathematics
Enrolment Patterns in Australia 1970-1988, Curtin University of Technology, Perth.
Department of Employment, Education and Training (1994). Selected higher education
statistics, Department of Employment, Education and Training, Canberra.
Eshun, B. A (1990). Sex-related Differences in Mathematics Achievement of Secondary School
Students, University of Cape Coast.
Eshun, B. A (2000). Pattern of Mathematical Achievement of Secondary School Students in
Ghana. Journal of Science and Mathematics Education, 2(1) 22-33
Fennema & G. Leder (Eds). Mathematics and Gender, 169-187 (New York, Teachers’ College,
Columbia University).
Fox, L. , Brody, L. and Tobin, D (1980). Women and the Mathematical Mystique. (Baltimore,
John Hopkins University Press).
Gay, L. R (1987). Educational Research: Competences for Analysis and Application. (3rd Ed.)
Columbus, Ohio, Merrill Pub. Co. 364.
Joffe, L. & Foxman, D. (1986). Attitudes and Sex differences- some APU findings in: L. Burton
(Ed). Girls into Mathematics Can Go, 38-50 (London, Holt Educational).
Lamb, S (1997). Gender differences in mathematics Participation: An Australian perspective.
Educational Studies, 23 (1) 105-125.
Looft, W. R.(1971) Sex Differences in the expression of vocational aspiration by elementary
school children Development Psychology.
Parsons, Jacquelynne Eccles (1983). Sex Differences in Attributions and Learned Helpless. Sex
Roles : Journal of Research, 8, 421- 432
Philips, Robert Leonard. (1983). The efforts of an Attitude/Career Unit on Middle school
students’ Attitudes Towards Mathematics and intentions to continue the study of
mathematics. at Austin, Texas: The University Texas
Robitaille, D (1977). A comparison of boys and girls’ feelings of self-confidence in arithmetic
computation. Canadian Journal of Education, 2,15-22
Schlossberg, N. K and Goodman, J. (1972). A woman’s place: Children’s sex stereotyping of
occupations: Vocational Guidance Quarterly, 20 (4) 266-270
Sherman, J.A. (1980). Predicting Mathematics grades of high school girls and boys: a further
study. Contemporary Educational Psychology , 5,249-255.
Shuard , H (1986). The relative attainment of girls and boys in mathematics in the primary
years, in: L. Burton, (Ed.), Girls into Maths can Go, 23-27. (London, Holt, Rinehart and
Winston ).
Walkerdine , V. (1989) Counting Girls Out (London, Virago Press).


65
Constitution of the Mathematical Association of Ghana (MAG)
[Last Revised 2000]
1. N A M E:
The name of the Association shall be the Mathematical Association of Ghana (MAG).
2. A I M S:
The aims of the Association are as follows:
a) To stimulate mathematical thinking in Ghana.
b) To improve the teaching of mathematics in Ghana, and to acquaint
members of new trends in mathematics and mathematics syllabuses.
c) To initiate and develop links between teachers of mathematics, their pupils
and other institutions requiring the application of mathematics.
3. MEMBERSHIP:
The Association shall consist of Ordinary members and Honorary members.
a) Ordinary membership is open to:-
i) Practising teachers of mathematics in Educational Institutions.
ii) Persons who are interested in or concerned with the teaching of the
subject, or with its application in Government, Commerce or Industry.
iii) Organisations concerned with the application of mathematics.
b) Honorary Membership:
i) The Association at a general meeting may resolve by ordinary resolution
that the Council may admit to honorary membership of the Association
any person who has rendered a singular service to the Association or to
any of the aims which the Association is formed to promote.
ii) An honorary member shall have all the privileges of an ordinary member
but shall not be liable to pay any subscription to the Association.

66
4. RESIGNATION OR EXCLUSION OF MEMBERS:
a) Any ordinary or honorary member may resign his membership by notice in writing to the
Council;
b) The Council may at its discretion exclude from membership of the Association any
ordinary member;
i) If the subscription payable to the Association by such ordinary member shall be
unpaid six months after same shall have become due and payable; or
ii) If in the opinion of the Council the continued membership of such person would
be detrimental to the interest of the Association or to the furtherance of its aims or
both.
5. GENERAL MEETING:
A general meeting shall be held once in every two years in the course of national
workshop/Conference.
6. OFFICERS AND COUNCIL:
a) The officers of the Association shall be the Chairman, the Vice-Chairman, the Secretary,
the Assistant Secretary and the Treasurer.
b) The Council shall consist of the officers; one representative from each region, the
president, an appointed editor and any co-opted members.
c) The Council shall manage the affairs of the Association for the realisation of its aims, and
shall decide on matters not provided for in the constitution. The Council has power to co-
opt any members of the Association to fill any vacancy in its membership or for the
effective execution of its functions.
In exercising such power the Council might consider co-opting a member from the
various levels of the educational system and from fields of application of mathematics.
d) All members of Council shall be members of the Association in good standing except the
President who may be an honorary member.
e) Where there is no female member, the Council shall endeavour to co-opt one.
ELECTIONS:
a) The officers of the Association shall be elected at the General Meeting by a secret ballot.
b) For the purpose of election the Council shall appoint a Returning Officer and two
Supporters who should not be seeking elections to the Council. Such a team may design
their own procedure for the elections.
c) The President shall be appointed by the Council at its last meeting before the General
Meeting.
d) Council Members take office upon election for two (2) years. A member may be eligible
for another term of office but no member shall serve at the same post for more than two
consecutive terms.

67
7. COUNCIL MEETINGS:
a) The Council shall meet at least twice annually and five (5) members. Two of whom shall
be Regional representatives, shall constitute a quorum.
b) At all meetings of the Council, the Chairman shall preside and in his absence, the Vice-
Chairman. If neither of them is present, the members present shall choose one of their
members to preside.
8. DUTIES OF THE OFFICERS:
a) Chairman
He shall
i) preside over all meetings of the Council, officers and the General Meeting;
ii) Act as the Chief Executive of the Association;
iii) be a signatory to the Accounts of the Association,
iv) be the convenor of all meetings of the Council Officers and the General Meeting.
b) Vice-Chairman:
He shall
i. act in the absence of the Chairman;
ii. be the Chairman of the Workshops/Conference Committee;
iii. represent MAG on the Council of G.A.S.T.;
iv. perform such other duties as may be assigned by the Chairman or the Council;
c) Secretary:
He shall
i. Take down minutes at all Council, Officers and the General Meetings;
ii. Present an annual report on the activities of the Association
iii. Attend to all correspondence on behalf of the Association;
iv. Be a signatory to the Accounts of the Association;
v. Perform other duties as may be assigned to him by the Chairman or the Council.
d) Assistant Secretary
He shall
i) act in the absence of the Secretary;
ii) be the secretary to the Workshops/conference committee,
iii) keep an up-to-date register of members of the Association.
iv) Perform any other duties that may be assigned by the Chairman or the Council.

68
e) Treasurer
He shall
i) be the Trustee of the accounts of the Association,
ii) ensure the regularity of all accounting operations of the Association;
iii) present an annual audited financial statement to the Council and members of the
Association;
iv) be a signatory to the Accounts of the Association;
v) represent the Association on the consultative Council of Teachers Association
(C.C.T.A.);
vi) perform such duties as may be assigned by the Chairman or the Council.
f) President
He shall
i. oversee the general welfare of the Association.
ii. Present a presidential address at the General Meeting
9. OFFICERS’ MEETING
(a) The officers shall meet from time to time to implement decisions of the Council.
(b) The Officers shall meet and take decision on behalf of the Council in emergency
situations. Such a decision/decisions should be communicated to all members of the
Council as soon as they are taken, for confirmation at the next Council Meeting.
10. SUBSCRIPTION
(a) Ordinary members shall pay such annual subscriptions as the members in general
meeting shall determine by ordinary resolution from time to time.
(b) The subscription shall be due and payable on admission to membership and thereafter on
the first day of September in each year or such other date as the resolution shall provide.
(c) A different subscription may be prescribed in the case of corporate bodies admitted to
membership, or in the case of any person admitted to membership, or representing any
institution, or as a full member of any recognised subject Association in Ghana.
(d) Ordinary members may opt for life membership my making a single prescribed payment.
11. FINANCE:
a) The financial resources of the Association shall be as follows:-
i) Subscription from members
ii) Subsidies from the Ghana Education Service (G.E.S.)
iii) Donations and legacies accepted by the Association
iv) Interest and revenue from its assets.
v) Royalties/Profits from Publications.

69
b) A current banking account shall be held in the name of the Association and the Treasurer
is empowered to draw monies not exceeding Fifty Thousand Cedis (¢50, 000) from it
and kept as imprest. The Treasurer may be the sole signatory for this amount.
c) Sums of money exceeding Fifty Thousand Cedis (¢50,000) may be drawn form this
account only with the consent of Council. For such sums of money any two of the
following: Chairman, Secretary and Treasurer shall be the signatories.
c) The Association’s financial year shall be from August 1st to July 31
st of each year. Its
accounts shall be audited by a body appointed by the Council and copies of the balance
Sheet circulated to members before the General Meeting.
13. NATIONAL WORKSHOP
National Workshop for members of the Association shall be held at least once in every two (2)
years, for professional development in line with the aims of the Association.
14. DELEGATES CONFERENCE:
a) A delegates conference shall be held in between the General Meetings and shall be
attended by the Council and three (3) representatives from each region; one of whom
shall be a female member.
b) The delegates conference shall
i. review the achievements of the Association;
ii. make appointments to fill vacancies in the Council;
iii. review the activities in the regions; undertake any other business on behalf of the
Association that may be referred to it by the Council.
15. REGIONAL BRANCHES:
(a) Regional branches of the Association shall be formed in all the regions.
(b) There shall be a Regional Executive made up of the Chairman, Secretary/Treasurer and
three (3) other members.
(c) Members of the Regional executive shall be elected at a regional meeting held in the
regions before the General Meeting.
(d) The Regional Chairman or his representative shall represent the regional branch on the
Council.
(e) Regional branches shall promote the aims of the Association in the regions.
(f) Regional branches shall be eligible for grants from the funds of the Association for the
purpose of carrying out the aims of the Association on submission of financial statements
supported with receipts and reports.
(g) Grants for each Region shall take into accounts its paid-up membership.

70
16. COMMITTEES
(a) The Council shall have the following committees:
i. Finance
ii. Workshop
iii. Projects
Additional committees may be formed when it becomes necessary.
The Council may appoint from its membership or from the members of the Association or from a
combination of both members to serve on these committees.
(b) The terms of reference and duration of office of all committees shall be prescribed by the
Council and all such committees shall be deemed to be committees of the Council.
17. REGISTER OF MEMBERS
A register of members shall be kept and individual membership cards provided. The following
particulars shall be entered in the register:
(a) The names and addressed of members
(b) The date on which each person was entered in the register as a member.
(c) Subscriptions paid by each member annually.
18. THE SEAL
(a) The council shall be empowered to adopt a common seal for use by the Association and
shall provide for the Association and shall provide for the safe custody thereof.
(b) The seal shall only be used by authority of the council or a committee of the council
authorised by the council on their behalf and ever instrument to which the seal shall be
affixed shall be signed by a member of the council and shall be countersigned by the
chairman or secretary.
19. AMENDMENTS TO THE CONSTITUTION:
(a) Amendments to the Constitution can only be made at the General Meeting.
(b) Amendments must be proposed by one and seconded by another ordinary member of the
Association, amendments must be received by the Secretary in writing at least two (2)
months before the General Meeting at which it is to tabled.
(c) Notice of proposed amendments shall be made available by the Secretary to all members
of the Association at least two (2) days before the General Meeting.
(d) Voting on amendments is by members present. An amendment is carried if at least two
thirds of the total votes cast are in favour of it.
(e)
i. The Council can undertake a general review of the constitution from time to time.
ii. Such a revised constitution shall be made available to all regional executives for
the consideration and discussion of members in their various regions.

71
iii. Such a constitution shall be valid if it is voted open by members at a General
Meeting and carried by at least two-thirds of the total votes cast.
20. ADOPTION OF REVISED CONSTITUTION:
This revised constitution as promulgated at the 27th Biennial Annual Conference/Workshop on
the 31st day of August 2000 is deemed to have come into effect on the 31
st day of August 2000.


73