mathematics b unit 1: statistics and probability (calculator)
TRANSCRIPT

Centre Number Candidate Number
Write your name hereSurname Other names
Total Marks
Paper Reference
Turn over
*N38394A0120*
Edexcel GCSE
Mathematics BUnit 1: Statistics and Probability (Calculator)
Higher Tier
Tuesday 9 November 2010 – MorningTime: 1 hour 15 minutes 5MB1H/01
N38394A©2010 Edexcel Limited.
6/6/5/6/c6
You must have:
Ruler graduated in centimetres and millimetres, protractor, compasses, pen, HB pencil, eraser, calculator. Tracing paper may be used.
Instructions
• Use black ink or ball-point pen.• Fill in the boxes at the top of this page with your name, centre number and candidate number.• Answer all questions.• Answer the questions in the spaces provided – there may be more space than you need.• Calculators may be used.
• If your calculator does not have a π button, take the value of π to be 3.142 unless the question instructs otherwise.
Information
• The total mark for this paper is 60. • The marks for each question are shown in brackets – use this as a guide as to how much time to spend on each question.• Questions labelled with an asterisk (*) are ones where the quality of your written communication will be assessed – you should take particular care on these questions with your spelling, punctuation
and grammar, as well as the clarity of expression.
Advice
• Read each question carefully before you start to answer it.• Keep an eye on the time.• Try to answer every question.• Check your answers if you have time at the end.

2
*N38394A0220*
GCSE Mathematics 2MB01
Formulae – Higher Tier
You must not write on this formulae page.Anything you write on this formulae page will gain NO credit.
Volume of prism = area of cross section × length Area of trapezium = (a + b)h
Volume of sphere = r3 Volume of cone = r2h
Surface area of sphere = 4 r2 Curved surface area of cone = rl
In any triangle ABC The Quadratic Equation The solutions of ax2+ bx + c = 0 where a 0, are given by
Sine Rule
Cosine Rule a2= b2+ c2– 2bc cos A
Area of triangle = ab sinC
length
crosssection
rh
r
l
C
ab
c BA
13
a b csin A sinB sinC
xb b ac
a=
− ± −( )2 42
43
12
b
a
h
12

3
*N38394A0320* Turn over
Answer ALL questions.
Write your answers in the spaces provided.
You must write down all stages in your working.
1 Laura has a four-sided spinner. The spinner is biased.
1
3 2
4
The table shows each of the probabilities that the spinner will land on 1 or land on 3 The probability that the spinner will land on 2 is equal to the probability that it will land on 4
Number 1 2 3 4
Probability 0.25 0.35
Laura is going to spin the spinner once.
(a) Work out the probability that the spinner will not land on 1
. . . . . . . . . . . . . . . . . . . . . . . . . . . . . . . . . . . . . . . . . . . . . . . . . . . . . . . . . . . . . . . . .
(2)
(b) Work out the probability that the spinner will land on 2
. . . . . . . . . . . . . . . . . . . . . . . . . . . . . . . . . . . . . . . . . . . . . . . . . . . . . . . . . . . . . . . . .
(2)
(Total for Question 1 is 4 marks)

4
*N38394A0420*
*2 Mr and Mrs Jones are planning a holiday to the Majestic Hotel in the Cape Verde Islands.
The table gives information about the prices of holidays to the Majestic Hotel.
MAJESTIC HOTEL, Cape Verde Islands Departures Price per adult
7 nights 14 nights1 Jan – 8 Jan £ 694 £ 825 9 Jan – 28 Jan £ 679 £ 804 29 Jan – 5 Feb £ 687 £ 815 6 Feb – 18 Feb £ 769 £ 835 19 Feb – 8 Mar £ 714 £ 817 9 Mar – 31 Mar £ 685 £ 805 1 April – 9 April £ 788 £ 862
10 April – 30 April £ 748 £ 802 Price per child: 95% of adult price for 7 nights or 85% of adult price for 14 nights.
Mr and Mrs Jones are thinking about going on holiday
on 20 February for 7 nights or on 10 April for 14 nights.
Mr and Mrs Jones have 2 children.
Compare the costs of these two holidays for the Jones family.
(Total for Question 2 is 5 marks)

5
*N38394A0520* Turn over
3 Ouzma wants to find out the method of transport people use to travel to a shopping centre.
Design a suitable data collection sheet she could use to collect this information.
(Total for Question 3 is 3 marks)

6
*N38394A0620*
*4 Zoe recorded the heart rates, in beats per minute, of each of 15 people. Zoe then asked the 15 people to walk up some stairs. She recorded their heart rates again.
She showed her results in a back-to-back stem and leaf diagram.
Before After9 8 5
Key for before 8 5 means 58
beats per minute
7 6 6 4 1 0 6 5 8 8 9 Key for after 6 5 means 65
beats per minute
9 8 6 3 2 7 2 4 7 84 1 8 5 6 8
9 1 3 710 2
Compare the heart rates of the people before they walked up the stairswith their heart rates after they walked up the stairs.
(Total for Question 4 is 6 marks)
7
*N38394A0720* Turn over
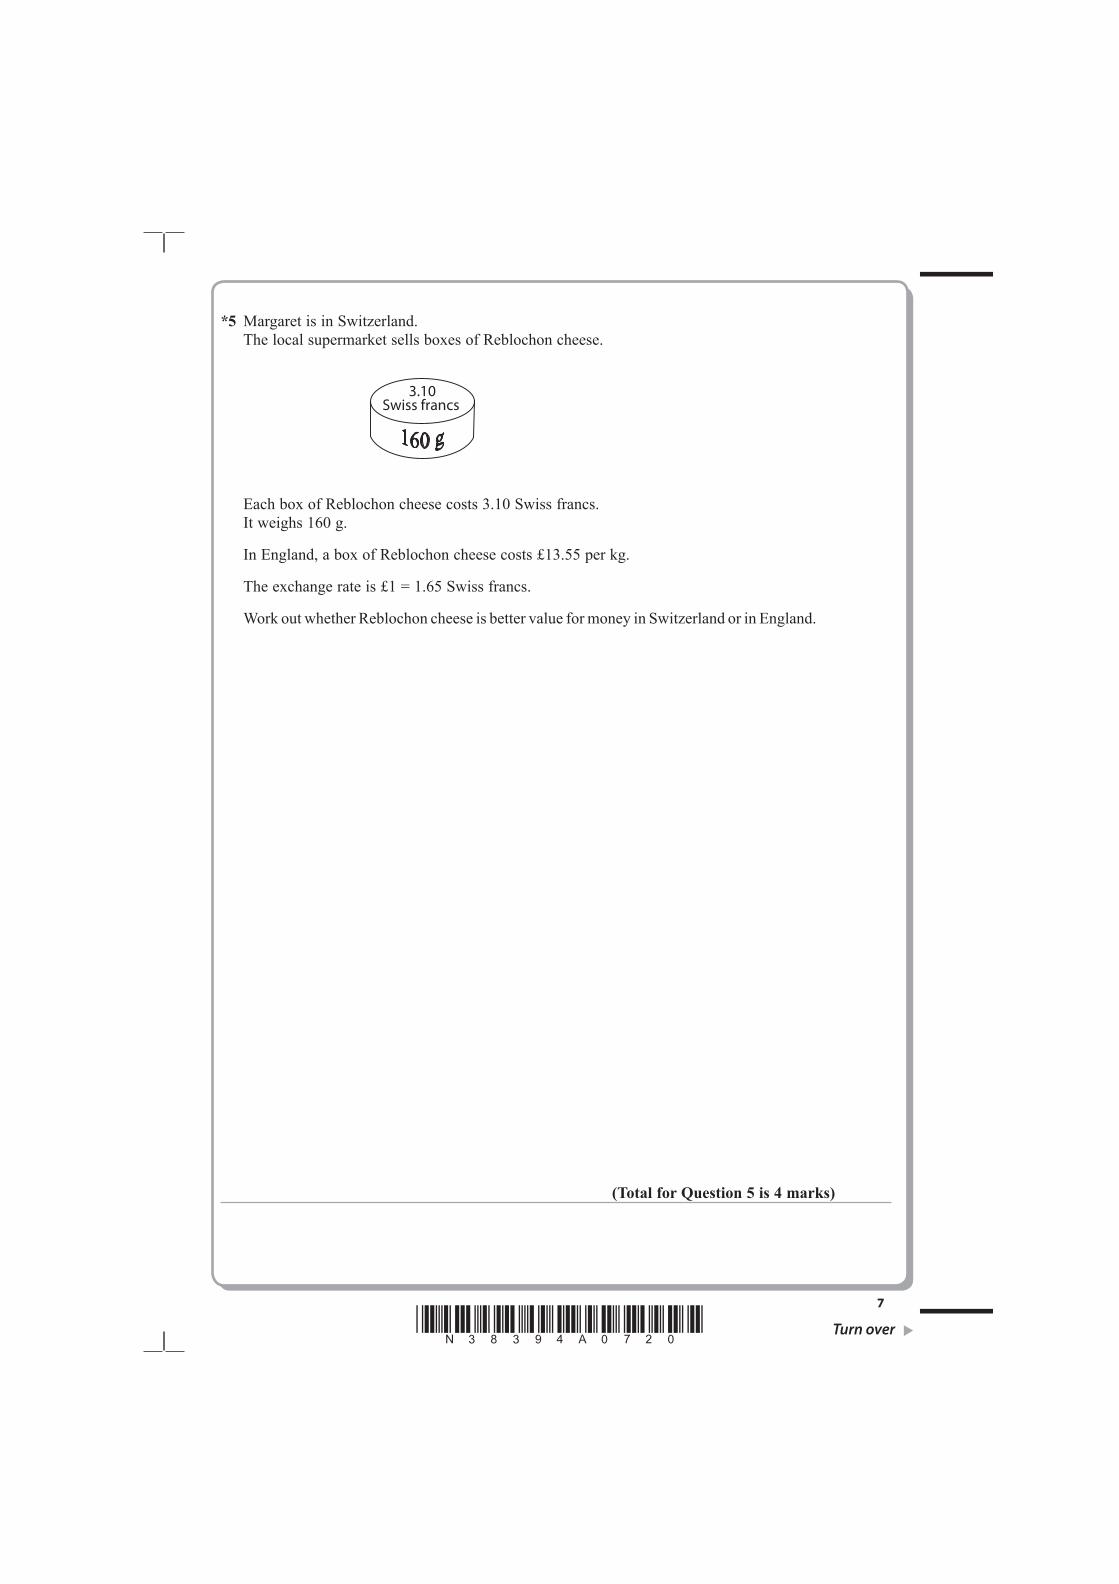
*5 Margaret is in Switzerland. The local supermarket sells boxes of Reblochon cheese.
Each box of Reblochon cheese costs 3.10 Swiss francs. It weighs 160 g.
In England, a box of Reblochon cheese costs £13.55 per kg.
The exchange rate is £1 = 1.65 Swiss francs.
Work out whether Reblochon cheese is better value for money in Switzerland or in England.
(Total for Question 5 is 4 marks)
3.10 Swiss francs

8
*N38394A0820*
6 120 children went on a school activities day. Some children went bowling. Some children went to the cinema. The rest of the children went skating.
66 of these children were girls. 28 of the 66 girls went bowling. 36 children went to the cinema. 20 of the children who went to the cinema were girls. 15 boys went skating.
Work out the number of children who went bowling.
. . . . . . . . . . . . . . . . . . . . . . . . . . . . . . . . . . . . . . . . . . . . . . . . . . . . . . . . . . . . . . . . .
(Total for Question 6 is 4 marks)

9
*N38394A0920* Turn over
7 A company sends every item of mail by second class post. Each item of mail is either a letter or a packet.
The tables show information about the cost of sending a letter by second class post and the cost of sending a packet by second class post.
Letter Packet
Weight range Second Class Weight range Second Class
0–100g 32p 0–100g £1.17
101–250g £1.51
251–500g £1.95
501–750g £2.36
751–1000g £2.84
The company sent 420 items by second class post. The ratio of the number of letters sent to the number of packets sent was 5 : 2
23
of the packets sent were in the weight range 0 – 100 g.
The other packets sent were in the weight range 101 – 250 g.
Work out the total cost of sending the 420 items by second class post.
£ . . . . . . . . . . . . . . . . . . . . . . . . . . . . . . . . . . . . . . . . . . . . . . . . . . . . . . . . . . . .
(Total for Question 7 is 5 marks)

10
*N38394A01020*
8 Water flows out of a cylindrical tank at a constant rate. The graph shows how the depth of water in the tank varies with time.
40
30
20
10
0 1 2 3 4 5
Depth (cm)
Time (hours)
(a) Work out the gradient of the straight line.
. . . . . . . . . . . . . . . . . . . . . . . . . . . . . . . . . . . . . . . . . . . . . . . . . . . . . . . . . . . . . . . . .
(2)
(b) Write down a practical interpretation of the value you worked out in part (a).
. . . . . . . . . . . . . . . . . . . . . . . . . . . . . . . . . . . . . . . . . . . . . . . . . . . . . . . . . . . . . . . . . . . . . . . . . . . . . . . . . . . . . . . . . . . . . . . . . . . . . . . . . . . . . . . . . . . . . . . . . . . . . . . . . . . . . . . . . . . . . . . . . . . . . . . . . . . . . . . . . . . . . . . . . . . . . . . . . . . . . . . . . . . . . . . . . . . . . . . . . . . . . . . . . . . . . . . . . . . . . . . . . . . . . . . . . . . . . . . . . . . . . . . . . . . . . . . . . . . . . . . . . . . . . . . . .
. . . . . . . . . . . . . . . . . . . . . . . . . . . . . . . . . . . . . . . . . . . . . . . . . . . . . . . . . . . . . . . . . . . . . . . . . . . . . . . . . . . . . . . . . . . . . . . . . . . . . . . . . . . . . . . . . . . . . . . . . . . . . . . . . . . . . . . . . . . . . . . . . . . . . . . . . . . . . . . . . . . . . . . . . . . . . . . . . . . . . . . . . . . . . . . . . . . . . . . . . . . . . . . . . . . . . . . . . . . . . . . . . . . . . . . . . . . . . . . . . . . . . . . . . . . . . . . . . . . . . . . . . . . . . . . . .
(1)
(Total for Question 8 is 3 marks)

11
*N38394A01120* Turn over
BLANK PAGE

12
*N38394A01220*
9 The cumulative frequency graph shows information about the speeds of 60 cars on a motorway one Sunday morning.
60
50
40
30
20
10
090 100 110 120 130 140
Cumulativefrequency
Speed (km/h)
(a) Use the graph to find an estimate for the median speed.
. . . . . . . . . . . . . . . . . . . . . . . . . . . . . . . . . . . . . . . . . . . . . . . . . . . km/h(1)

13
*N38394A01320* Turn over
The speed limit on this motorway is 130 km/h. The traffic police say that more than 20% of cars travelling on the motorway break the
speed limit.
(b) Comment on what the traffic police say.(3)
For these 60 cars
the minimum speed was 97 km/h and the maximum speed was 138 km/h.
(c) Use the cumulative frequency graph and the information above to draw a box plot showing information about the speeds of the cars.
(3)
90 100 110 120 130 140Speed (km/h)
(Total for Question 9 is 7 marks)

14
*N38394A01420*
10 The table gives some information about the weights, in kg, of 50 suitcases at an airport check-in desk.
Weight (w kg) Frequency
0 < w 10 16
10 < w 15 18
15 < w 20 10
20 < w 35 6
(a) Work out an estimate for the mean weight.
. . . . . . . . . . . . . . . . . . . . . . . . . . . . . . . . . . . . . . . . . . . . . . . . . . . . . . . . . . kg(4)

15
*N38394A01520* Turn over
Passengers have to pay extra money for any suitcase that weighs more than 20 kg. Two of the 50 suitcases are chosen at random.
(b) Work out the probability that both suitcases weigh more than 20 kg.
. . . . . . . . . . . . . . . . . . . . . . . . . . . . . . . . . . . . . . . . . . . . . . . . . . . . . . . . . . . . . . . . .
(2)
(c) On the grid, draw a histogram for the information in the table.
0 10 20 30 40Weight (w kg)
(3)
(Total for Question 10 is 9 marks)

16
*N38394A01620*
11 A factory makes 600 laptops. Mrs Green is responsible for checking these laptops. She is going to take a random sample of 80 of the laptops.
(a) Describe a method she could use to select the sample.
. . . . . . . . . . . . . . . . . . . . . . . . . . . . . . . . . . . . . . . . . . . . . . . . . . . . . . . . . . . . . . . . . . . . . . . . . . . . . . . . . . . . . . . . . . . . . . . . . . . . . . . . . . . . . . . . . . . . . . . . . . . . . . . . . . . . . . . . . . . . . . . . . . . . . . . . . . . . . . . . . . . . . . . . . . . . . . . . . . . . . . . . . . . . . . . . . . . . . . . . . . . . . . . . . . . . . . . . . . . . . . . . . . . . . . . . . . . . . . . . . . . . . . . . . . . . . . . . . . . . . . . . . . . . . . . . .
. . . . . . . . . . . . . . . . . . . . . . . . . . . . . . . . . . . . . . . . . . . . . . . . . . . . . . . . . . . . . . . . . . . . . . . . . . . . . . . . . . . . . . . . . . . . . . . . . . . . . . . . . . . . . . . . . . . . . . . . . . . . . . . . . . . . . . . . . . . . . . . . . . . . . . . . . . . . . . . . . . . . . . . . . . . . . . . . . . . . . . . . . . . . . . . . . . . . . . . . . . . . . . . . . . . . . . . . . . . . . . . . . . . . . . . . . . . . . . . . . . . . . . . . . . . . . . . . . . . . . . . . . . . . . . . . .
(1)
Mrs Green finds that 3 of the 80 laptops are faulty.
(b) Work out an estimate for how many of the 600 laptops are faulty.
. . . . . . . . . . . . . . . . . . . . . . . . . . . . . . . . . . . . . . . . . . . . . . . . . . . . . . . . . . . . . . . . .
(2)
(Total for Question 11 is 3 marks)

17
*N38394A01720* Turn over
12 There are 10 socks in a drawer.
7 of the socks are brown. 3 of the socks are grey.
Bevan takes at random two socks from the drawer at the same time.
(a) Complete the probability tree diagram.(2)
710
1st sock 2nd sock
Brown
Brown
Grey
Brown
Grey
Grey
. . . . . . . . . . . . . . . . . . . . . . . . . . . .
. . . . . . . . . . . . . . . . . . . . . . . . . . . .
. . . . . . . . . . . . . . . . . . . . . . . . . . . .
. . . . . . . . . . . . . . . . . . . . . . . . . . . .
. . . . . . . . . . . . . . . . . . . . . . . . . . . .
(b) Work out the probability that Bevan takes two socks of the same colour.
. . . . . . . . . . . . . . . . . . . . . . . . . . . . . . . . . . . . . . . . . . . . . . . . . . . . . . . . . . . . . . . . .
(3)
(Total for Question 12 is 5 marks)

18
*N38394A01820*
13 The table below shows the population of each of three villages.
Village Population
Ashley 243
Brigby 370
Irton 127
Mr Akhtar carries out a survey of the people living in these three villages. He uses a sample stratified by village population.
There are 50 people from Brigby in his sample.
Work out the number of people from Irton in his sample.
. . . . . . . . . . . . . . . . . . . . . . . . . . . . . . . . . . . . . . . . . . . . . . . . . . . . . . . . . . . . . . . . .
(Total for Question 13 is 2 marks)
TOTAL FOR PAPER IS 60 MARKS

19
*N38394A01920*
BLANK PAGE

20
*N38394A02020*
BLANK PAGE