mathematics - arc :: assessment resource centre · 2003-05-15 · this statement gives guidelines...
TRANSCRIPT

Mathematics Years 9–10
Syllabus
Intermediate Course
Stage 5
9 6 2 0 0 I n t M a t h s 9 - 1 0 p t 1 1 0 / 9 / 9 6 4 : 1 9 P M P a g e

© Board of Studies NSW 1996
Published byBoard of Studies NSWPO Box 460North Sydney NSW 2059Australia
Tel: (02) 9927 8111
ISBN 0 7310 7503 X
August 1996
96200
9 6 2 0 0 I n t M a t h s 9 - 1 0 p t 1 1 0 / 9 / 9 6 4 : 1 9 P M P a g e

Contents
Introduction 5
NSW Mathematics Courses K–12 6
Rationale 7
The Three Courses 8
Aim 10
Objectives 10
Equity Principles and Issues 11
Solving Problems 14
Communication — The Role of Language 16
Collecting, Analysing and Organising Information 17
Using Technology 17
Working with Others and in Teams 18
Planning and Organising Activities 18
Teaching Strategies 19
Programming 19
Syllabus Structure 20
Summary of Years 9–10 Intermediate Course — Core 23
Summary of Years 9–10 Intermediate Course — Options 24
Outcomes 25
Assessment 36
Evaluation of School Programs 41
9 6 2 0 0 I n t M a t h s 9 - 1 0 p t 1 1 0 / 9 / 9 6 4 : 1 9 P M P a g e

Intermediate Course Content — Core 43
Geometry (G1–G4) 44
Number (N1–N4) 68
Measurement (M1–M4) 90
Chance and Data (CD1–CD3) 110
Algebra (A1–A4) 128
Mathematical Investigations 151
Intermediate Course Content — Options 157
1. Fractals 159
2. Networks 167
3. Mathematics of Small Business 173
4. Further Measurement 180
5. Further Algebra 190
6. Coordinate Geometry and Curve Sketching 201
7. Further Number 209
8. Further Probability 217
9 6 2 0 0 I n t M a t h s 9 - 1 0 p t 1 1 0 / 9 / 9 6 4 : 1 9 P M P a g e

Introduction
Mathematics is one of the eight Key Learning Areas that comprise the secondarycurriculum. This syllabus specifies the content of the Mathematics Key LearningArea for students in Stage 5 (usually Years 9 and 10) of their secondary education.
Students who have completed Stage 4 Mathematics are at various stages in thedevelopment of their mathematical knowledge, understanding and skills. Somestudents demonstrate a high degree of conceptual understanding, while otherstudents still need to practise their basic numeracy skills in a variety ofapplications. This syllabus provides the opportunity for students in Years 9 and 10to study one of three courses in Mathematics — Advanced, Intermediate orStandard. These courses show variation in mathematical abstraction, depth oftreatment and practicality. In this way the syllabus caters for a wide range ofstudents with different learning needs.
The curriculum in NSW requires all students to engage in substantial study ofMathematics each year from Kindergarten to Year 10. Mathematics is one of thefour Key Learning Areas in Years 7–10 that must be studied each year. CurriculumRequirements for NSW Schools (1990) states that 400 indicative hours of Mathematicsare to be completed from Year 7 to Year 10. This syllabus has been designed for aminimum of 200 indicative hours. However, it is more usual for schools to have agreater time allocation for Mathematics over Years 9 and 10, and requirements forgovernment schools mandate 500 hours of Mathematics over Years 7–10.
In each course there are two components:
• the core — this section is mandatory and is designed to be taught in a minimumtime of 160 indicative hours
• the options — option topics can be chosen to meet varying student needs andinterests. It is intended that students spend a minimum of 40 indicative hours onthe options.
This syllabus is designed for mathematics teaching and learning within the contextof mathematical problems that are meaningful and challenging to students. Thisphilosophy continues that of the NSW Mathematics K–6 and Mathematics 7–8syllabuses, and reflects the Mathematics Statement of Principles K–12, The Nature ofMathematics Learning and the Aims of Mathematics Education, which are detailed inthe support document accompanying this syllabus.
5
Introduction
9 6 2 0 0 I n t M a t h s 9 - 1 0 p t 1 1 0 / 9 / 9 6 4 : 1 9 P M P a g e

NSW Mathematics Courses K–12
The diagram below summarises the Mathematics courses in NSW for Years K–12.
6
Mathematics Years 9–10 Syllabus — Intermediate Course
Mathematics K–6
MathematicsYears 7–8
Years 9–10Standard
Years 9–10Intermediate
Years 9–10Advanced
Years 11–12Mathematics in
Practice
Years 11–12Mathematics inSociety (2UG)
Years 11–12Mathematics
2 Unit
Years 11–12Mathematics
3 Unit
Year 124 Unit
Stage 6
Stages 1–3
Stage 4
Stage 5
9 6 2 0 0 I n t M a t h s 9 - 1 0 p t 1 1 0 / 9 / 9 6 4 : 1 9 P M P a g e

Rationale
Mathematics involves the study of patterns and relationships and provides apowerful, precise and concise means of communication. Mathematics is a creativeactivity. It is more than a body of collected knowledge and skills. It requiresobservation, representation, investigation and comparison of patterns andrelationships in social and physical phenomena. At an everyday level it isconcerned with practical applications in many branches of human activity. At ahigher level it involves abstraction and generalisation. As such, it has been integralto most of the scientific and technological advances made in Australia and world-wide.
Mathematical demands on people have changed considerably over the past fewdecades. All people need to be numerate — that is, to be able to calculate, measureand estimate in a variety of situations. There is an increased dependence ontechnology, and the amount of information that is available has expanded rapidly.It is vital that Australia has a mathematically competent workforce. There is ademand for people to be innovative, to be able to solve mathematical problems,communicate and to make informed decisions after analysing data. Mathematicseducation provides many opportunities for students to develop these skills.
There is general recognition that the process of mathematical problem solving willprepare students more appropriately to function competently in society and that aproblem-solving approach actually aids mathematical learning. Mathematicalactivity in society frequently involves problem solving — whether the activity isrelated to everyday life or is more abstract in nature. By supporting a problem-solving approach, as in this syllabus, the mathematical education community isrecognising its responsibility to ensure that students are prepared to take theirplace as effective members of society who are able to solve the mathematicalproblems that arise.
The Mathematics 9–10 Syllabus aims to develop mathematical skills andconfidence in students appropriate to their level of development. It emphasises theability to investigate and reason logically, to solve non-routine problems, tocommunicate about and through mathematics, to connect ideas withinmathematics and to be motivated to learn more mathematics. It follows theMathematics K–6 (1989) and Mathematics 7–8 (1988) syllabuses in presentingmathematics as a dynamic and process-oriented subject, as well as one which hasan important body of knowledge and skills.
These ideas are balanced within the syllabus, while the nature and needs of thestudent and the learning processes are taken into account. Problem solving and theapplications of mathematics in the world are key elements, as is student
7
Rationale
9 6 2 0 0 I n t M a t h s 9 - 1 0 p t 1 1 0 / 9 / 9 6 4 : 1 9 P M P a g e

communication. By talking to each other about mathematics, reflecting and writingabout mathematics, drawing diagrams and listening to the teacher and otherstudents discussing mathematics, the learning of mathematics is enhanced andstudents are motivated to investigate further mathematical problems.
This philosophy underpins the teaching of Mathematics throughout Years K–12.Such an approach represents a shift in philosophy and a resulting change inpedagogy for mathematics since the previous Mathematics 9–10 Syllabus, writtenin the early 1980s.
The approach of this Mathematics 9–10 Syllabus reflects that expressed in thedocument A National Statement on Mathematics for Australian Schools (CurriculumCorporation for the AEC, 1990). This statement gives guidelines for curriculumdevelopment in Mathematics across all States and recognises the need forimprovement and change in school mathematics:
We need to aim for improvement in both access and success inmathematics for all Australians. All Australians must leave school wellprepared to meet the demands of their future lives and with theknowledge and attitudes needed to become lifelong learners ofmathematics.
Through material in the core and options, this syllabus provides opportunities forthe solutions of relevant, non-routine problems to be integrated into the teachingand learning of mathematics.
The Three Courses
The Standard course combines a thematic and topical approach to encourage thedevelopment of basic mathematical skills. It is designed for students who needmore time to develop these skills for everyday life by practising these skills in avariety of realistic themes and topics. The mathematical content of the coursebuilds on skills and knowledge from the Mathematics 7–8 course and provides theopportunity for students to experience some of the applications of mathematics totheir lives.
The Intermediate course lies between the Advanced course and the Standardcourse and contains elements of both. The number of new concepts and level ofdifficulty is less than in the Advanced course. The Intermediate course is designedfor students who require more time than those doing the Advanced course todevelop their mathematical ideas, and for students who are still developing a moreabstract approach to mathematical thinking.
8
Mathematics Years 9–10 Syllabus — Intermediate Course
9 6 2 0 0 I n t M a t h s 9 - 1 0 p t 1 1 0 / 9 / 9 6 4 : 1 9 P M P a g e

9
The Three Courses
The Advanced course is the most abstract of the three courses. It is designed forthose students who have achieved all, or the vast majority of, the outcomes of theprevious Mathematics syllabus (ie Mathematics 7–8). The Advanced course doesnot repeat material from this syllabus since the assumption is that it has beencompleted.
In some areas, material from the Mathematics 7–8 syllabus is reviewed, particularlywhere it is then covered in greater depth and at a higher cognitive level. TheAdvanced course contains and extends the content of the Intermediate course,requiring students to develop their reasoning abilities to a greater extent than forthe Intermediate course. The course emphasises algebraic processes, graphicaltechniques, interpretation, justification of solutions, advanced applications andreasoning, which arise in more sophisticated problems from realistic applications.
There is a degree of commonality between courses, especially between theAdvanced and Intermediate courses and also between the Intermediate andStandard courses. There is flexibility for students to move between courses,especially during Year 9. The options are designed to provide the opportunity forstudents to proceed to different courses in Years 11–12.
The expected pathways through the Years 9 and 10 Mathematics courses to Years11 and 12 Mathematics are as follows:
Advanced Course
3/4 Unit
2 Unit
Mathematics inSociety
(2 Unit General)
Mathematics inPractice
IntermediateCourse
Standard Course
9 6 2 0 0 I n t M a t h s 9 - 1 0 p t 1 1 0 / 9 / 9 6 4 : 1 9 P M P a g e

Aim
The Mathematics 9–10 Syllabus aims to promote students’ appreciation ofmathematics and develop their mathematical thinking, understanding, confidenceand competence in solving mathematical problems.
This aim is to be achieved through developing students’ capacities to:
• acquire the mathematical knowledge, operational facility, concepts, logicalreasoning, symbolic representation and terminology appropriate to their stageof mathematical development and in preparation for further study ofMathematics
• interpret, organise and analyse mathematical information and data
• apply mathematical knowledge and skills to creatively and effectively solveproblems in familiar and unfamiliar situations
• communicate mathematical information and data
• justify mathematical results and give proofs where appropriate, makingconnections between important mathematical ideas and concepts
• value mathematics as an important component of their lives.
Objectives
Students will develop:
• appreciation of mathematics as an essential and relevant part of life
• knowledge, understanding and skills in working mathematically
• knowledge, understanding and skills in Geometry
• knowledge, understanding and skills in Number
• knowledge, understanding and skills in Measurement
• knowledge, understanding and skills in Chance and data
• knowledge, understanding and skills in Algebra.
10
Mathematics Years 9–10 Syllabus — Intermediate Course
9 6 2 0 0 I n t M a t h s 9 - 1 0 p t 1 1 0 / 9 / 9 6 4 : 1 9 P M P a g

11
Equity Principles and Issues
Equity Principles and Issues
This syllabus and its accompanying support materials, assessment guidelines andexamination specifications for the School Certificate reflect the Board of Studies’Statement of Equity Principles, which relates two of the Board’s corporate objectives:
• to develop high quality courses and support materials for primary andsecondary education suited to the needs of the full range of students;
• to assess student achievement and award credentials of international standards to meet the needs of the full range of students.
Statement of Equity Principles (1996), p 1.
The syllabus supports these objectives by recognising educational research, notonly in relation to the identification of groups that are disadvantaged in gainingaccess to the curriculum and participating fully in its aspects, but also in relation toeffective approaches to teaching and learning involving disadvantaged groups.Research suggests:
… the following groups are disadvantaged in gaining access to thecurriculum and participating fully in its aspects:• students from low socioeconomic backgrounds• Aboriginal and Torres Strait Islander students• students learning English as a second language• students of non-English speaking background• students who have physical or intellectual disability.
In addition, both girls and boys are disadvantaged by various forms ofsex stereotyping.
Ibid, p 1.
It should be recognised that children from different cultural backgrounds bringdiverse mathematical experiences to the classroom. Aboriginal children, forexample, bring with them complex understandings of patterns, kinship and spatialconcepts. These different experiences and perspectives can contribute to a deeperunderstanding of the nature of mathematics. For example, many students ofmathematics would take the use of base 10 for granted as being almost a naturalway of doing mathematics. Students may not be aware that this is culturallyspecific and that different bases can be used in counting. Such a realisationprovides insight into the nature of mathematics.
9 6 2 0 0 I n t M a t h s 9 - 1 0 p t 1 1 0 / 9 / 9 6 4 : 1 9 P M P a g

Aboriginal world-views emphasise an intelligent responsiveness to the environmentthat is characterised by cooperation and coexistence with nature. This cooperationextends to human relationships. Many Aboriginal people show a preference tolearn from each other in groups, using oral language. Individual competitiveness islikely to be at odds with their cultural backgrounds. Western notions of quantitiesand measurements, comparisons (more or less), number concepts, time andpositivistic thinking can be irrelevant and contrary to their established thoughtpatterns. Effort must be made to provide basic linkages between their world andthe social meanings of Western mathematical ideas, which are important for themto develop. (Adapted from Dawe, L, Teaching Secondary School Mathematics, p 243.)
Effective approaches to teaching and learning
The Aboriginal child brings to school a way of communicating that reflects thelanguage used at home. In most cases this is Aboriginal English. AboriginalEnglish is a dialect of standard English and the first (or home) language of manyAboriginal children. Aboriginal English differs not only in words and meanings,but grammatically and pragmatically (see Board of Studies document, AboriginalEnglish). Teachers need to be aware that mathematical language is often veryunfamiliar to Aboriginal children, as it is to many children from a variety of othercultural backgrounds.
Relating mathematics to the students’ lives, using materials as well as makingexplicit connections between the concrete and the abstract, will help the studentsto gain a firmer understanding of new words and their meanings, as well as theirassociated concepts. A variety of teaching methods, including group work, workingin pairs, working outdoors and working with materials, helps to create anenvironment conducive to learning.
The language of mathematics is often the same as everyday language. This can addto some children’s confusion. To avoid ambiguities, explicit teacher explanation isneeded if a word has more than one meaning. Consideration of these similaritiesand differences will help teachers to emphasise the acquisition and use ofmathematical terminology.
How the syllabus and support material address equity issues
Research suggests that equity of access for all groups is increased when strategiesnecessary for success are made explicit and students are able to develop anawareness and control of holistic processes, which enable them to effectivelysynthesise their learning.
12
Mathematics Years 9–10 Syllabus — Intermediate Course
9 6 2 0 0 I n t M a t h s 9 - 1 0 p t 1 1 0 / 9 / 9 6 4 : 1 9 P M P a g

The Mathematics 9–10 syllabus and support documents address equity issues byproviding:
• a focus on the articulation of processes essential for success in mathematics
• a focus on the development of thinking skills through problem solving
• suggestions for a range of relevant resources that will complement and facilitategood teaching practice
• a wide range of applications, suggested activities and sample questions thatemphasise the use of relevant problems in the learning process
• three courses in Stage 5 so that students’ mathematical needs can be moreappropriately met
• a number of option topics that provide additional flexibility for catering forstudent needs
• suggestions for teaching strategies which include group work, discussion andactive participation
• a range of suggested assessment methods and strategies through which toidentify students’ achievement within a range of modes.
13
Equity Principles and Issues
9 6 2 0 0 I n t M a t h s 9 - 1 0 p t 1 1 0 / 9 / 9 6 4 : 1 9 P M P a g
Solving Problems
A major aspect of mathematics is problem solving. Students learn through solvingproblems. A mathematics teacher should provide opportunities for students tosolve meaningful, non-routine and challenging problems as a significant aspect oftheir learning.
Problem solving promotes processes and skills such as communication, criticalreflection, creativity, analysis, organisation, experimentation, synthesis,generalisation and validation. In addition, teaching through problems that arerelevant to the students encourages improved attitudes to mathematics, and anappreciation of its importance to society. Problem solving should encouragestudents to be systematic when recording information and to persevere.
Four important elements of solving problems are detailed below.
1. Understanding the problem
Teachers can help students to understand problems by enabling practice in:
• text editing, including identification of redundant and irrelevant information
• identifying problems where insufficient information has been given
• discussing the meaning of the text of a problem and any ambiguities
• restating a problem in a student’s own words
• explaining the meaning of a problem to others (peers and the teacher)
• trying a problem and returning to the text a number of times to ensureappropriate interpretation.
Sample questions have been included in this syllabus that encourage students todiscuss and explain the meaning of particular problems, decide what furtherinformation may be needed and identify any redundant or irrelevant informationin a question. Often students need time to try to solve the problem and then rereadthe problem a number of times to ensure appropriate interpretation.
2. Planning a solution
Planning a solution involves categorising a problem and then knowing theappropriate procedures for that type of problem. Teachers can help students toplan solutions by:
• facilitating students’ schema acquisition. This can be helped by reducingstudents’ cognitive load through providing goal-free or open-ended questions,
14
Mathematics Years 9–10 Syllabus — Intermediate Course
9 6 2 0 0 I n t M a t h s 9 - 1 0 p t 1 1 0 / 9 / 9 6 4 : 1 9 P M P a g

integrating text with diagrams and encouraging the study and development ofworked examples
• discussing plans for solving problems
• organising group activities in which students sequence plans for solving problems.
This syllabus provides a large number of sample questions that are open-ended.Such questions are also useful when assessing student achievement, since theyallow students to respond on a variety of levels.
Note: Students might not automatically be able to give full responses to open-endedquestions — this needs to be developed over time. Students will need to practisethese types of questions so that they can identify them and give the full range ofanswers or a generalised answer as appropriate. This development will be facilitatedby students working in groups, listening to and discussing the responses of others.
3. Implementing the plan to find the solution
Teachers can help students to improve their problem-solving skills and develop theability to work out solution by:
• offering students experience with a variety of problems that require differentstrategies for solution (eg using a table, drawing a diagram, looking for patterns,working backwards, guessing and checking, simplifying the problem, breakingthe problem up into smaller parts)
• ensuring that students have a well structured foundation of basic mathematicalideas on which to build their understanding
• facilitating the development of the necessary knowledge and skills to enablestudents to carry out their plan of solution
• encouraging students to recall any necessary formulae and be competent withroutine skills to ensure that they can carry out the solution phase of a problem.
While specific problem-solving strategies such as those above have been includedin the section A1 of this syllabus, it is intended that such strategies would beencouraged throughout this course. The development of real understanding, in-depth knowledge and competence is emphasised throughout this syllabus.
4. Looking back
Reflection on the problem solution is an important aspect of problem solving, andone which is often ignored. The recording of the problem solution is also a vital step,and one which students often find difficult. Both of these aspects can be aided by:
• discussing errors and a range of solution methods, where students need toidentify the most efficient method
15
Solving Problems
9 6 2 0 0 I n t M a t h s 9 - 1 0 p t 1 1 0 / 9 / 9 6 4 : 1 9 P M P a g

• encouraging ‘internal talk’ throughout the problem, where students sit back, askthemselves how they are going and gain a holistic view of the problem
• ensuring that students write up their work carefully, including:– a statement of the problem in their own words– all the necessary working– a statement of what has been discovered– some discussion of the processes used– a list of any helpful ideas– a generalisation of the result if appropriate.
There are many suggestions through the syllabus for students to report on theprocess of their solution, discuss their solution and those of others, evaluatesolutions and make judgements by deciding on the ‘best’ or most efficient (orelegant) solution.
Communication — The Role of Language
The Mathematics 9–10 Syllabus makes a significant contribution towards thedevelopment of the Key Competency of Communicating Ideas and Information. Itfacilitates the development of communication by recognising the importance oflanguage in learning and focusing on numerical, algebraic and graphicalpresentation of information. This is particularly evident in the statisticalinvestigation for Chance and data.
Students’ command of language dramatically affects the quality of learning inschool mathematics classrooms. Students need to develop a deep understanding ofthe meaning of mathematical vocabulary and facility in communicating theirunderstanding to others. This understanding will allow them to use themathematics terms meaningfully, both inside and outside school. Beyondmathematical vocabulary, unravelling semantic structure places significantdemands on students’ problem-solving skills. For example, for the problem ‘Thereare twelve times as many sheep (s) as people (p); write this relationship in symbols’,many students will write ‘12s = p’. Students can lose the meaning of the wordsbecause of the sentence structure. They need to focus on semantic structure ratherthan a key-words approach. This syllabus supports the teaching of mathematics tolink learners’ personal worlds with their formal mathematical skills and theirformal mathematical language.
Research suggests that learners’ personal worlds are inherently influenced by theircultural, socioeconomic and/or geographic backgrounds. These factors need to beconsidered in determining the most appropriate means of developing mathematicallanguage concepts.
16
Mathematics Years 9–10 Syllabus — Intermediate Course
9 6 2 0 0 I n t M a t h s 9 - 1 0 p t 1 1 0 / 9 / 9 6 4 : 1 9 P M P a g

17
Using Technology
Collecting, Analysing and Organising Information
This syllabus explicitly addresses knowledge and skills that develop, and providestudents with opportunities to demonstrate, the Key Competency of Collecting,Analysing and Organising Information numerically and graphically. Students arerequired to formulate and refine key questions prior to investigation, to design andconduct an investigation with an understanding of issues involved in sampling, andto use this understanding to evaluate the information, its sources and the methodsused in the investigation.
Using Technology
Mathematics provides an opportunity for students to use materials and equipmentin a manner that constitutes a process and reflects the ‘technology’ or ‘know-how’of mathematics. It is important for students to determine the purpose of atechnology, to apply the technology, and to evaluate the effectiveness of theapplication. This ability depends not only upon the students learning when andhow to use technology, but also on their learning when the use of technology isinappropriate or even counter-productive.
The use of scientific calculators is mandatory — students must have regular accessto scientific calculators during this course. It is very important, however, thatstudents maintain and develop their mental arithmetic skills, rather than relying ontheir calculators for every calculation.
Other tools such as geometrical instruments and templates are also needed atdifferent times throughout the course. The use of graphics calculators andcomputers is optional, but is suggested in the Applications, suggested activities andsample questions to enhance the teaching and learning of mathematics. Some schoolsmay not have access to these tools. It is important to recognise that this course canbe taught successfully without the use of graphics calculators and computers, butthat the appropriate use of such technology within this course will enhancestudents’ mathematical learning.
Technology also has a role in assisting students with special education needs to gainaccess to the mathematics curriculum. A computer may assist students who have aphysical disability. For example, students who are unable to write may be able touse a wand and produce their own work on a computer.
Further advice on the use of technology in Stage 5 Mathematics is provided withinthe support document.
9 6 2 0 0 I n t M a t h s 9 - 1 0 p t 1 1 0 / 9 / 9 6 4 : 1 9 P M P a g

Working with Others and in Teams
Experience of working in groups can facilitate learning. Group work provides theopportunity for students to communicate mathematically with each other, to makeconjectures, to cooperate and to persist in solving problems and in investigations.This strategy can also promote and improve motivation, enjoyment and confidencein mathematics. Group work should be carefully managed — students need to bevery clear about their tasks and each member of a group should be givenresponsibility for an aspect or part of the task.
Experience of working in groups can not only facilitate learning but also providefoundation experience in the Key Competency of Working with Others and inTeams. Students may elect to develop this competency by working in a team onthe in-depth mathematical investigation or on shorter investigations. Such studentscan develop their awareness that working with others requires them to establishgroup goals and consensus on individual roles and responsibilities. They recognisethe importance of taking responsibility for individual performance and groupperformance, and develop the ability to work within a given time frame. It isimportant that they focus on evaluating not only the product of the investigationbut also the process of group interaction involved in developing it.
Planning and Organising Activities
The mathematical investigation also allows students to develop the capacity to planand organise their own activities. This involves the ability to set goals, establishpriorities, implement a plan, manage resources and time, and monitor one’s ownperformance.
18
Mathematics Years 9–10 Syllabus — Intermediate Course
9 6 2 0 0 I n t M a t h s 9 - 1 0 p t 1 1 0 / 9 / 9 6 4 : 1 9 P M P a g
19
Programming
Teaching Strategies
To allow students to achieve the outcomes of this course, a range of teaching strategiesmust be employed. If students are to improve their mathematical communication, forexample, they must have the opportunity to discuss interpretations, solutions,explanations etc with other students as well as their teacher. They should beencouraged to communicate not only in writing but orally, and to use diagrams aswell as numerical, algebraic and word statements in their explanations.
Students learn in a range of ways. Students can be mainly visual, auditory orkinesthetic learners, or employ a variety of senses when learning. The range oflearning styles is influenced by many factors, each of which needs to be consideredin determining the most appropriate teaching strategies. Research suggests thatcultural and social background have a significant impact on the way students bestlearn mathematics. These differences need to be recognised and a variety ofteaching strategies used so that all students have equal access to the developmentof mathematical knowledge and skills.
Learning can occur within a large group where the class is taught as a whole, within asmall group where students interact with other members of the group, or at anindividual level where a student interacts with the teacher or another student, or worksindependently. All arrangements have their place in the mathematics classroom.
Programming
There is no need for teachers to teach a whole strand at once. Rather, the content ofeach of these courses, being spiral in nature, provides for the strands to be revisitedand concepts developed further over time as students mature in their understanding ofmathematics. It is not intended that each strand occupy the same amount of time.Within each strand, many concepts relate to aspects of other strands. Thisinterrelatedness is fundamental to mathematics and should be included in students’learning experiences. The Considerations at the beginning of each strand discuss theserelationships and identify areas where connections should be made. The incorporationof issues raised in these considerations encourages students to view the course as awhole and helps them appreciate the interrelatedness of mathematics. The supportdocument that accompanies this syllabus has further advice on programming, alongwith some sample formats for programs and sequences of teaching for each course.
9 6 2 0 0 I n t M a t h s 9 - 1 0 p t 1 1 0 / 9 / 9 6 4 : 1 9 P M P a g

Syllabus Structure
The Mathematics Years 9–10 Syllabus — Intermediate Course is divided into coreand options as below:
The core is divided into six strands, each of which must be studied by all students.All the content of each strand is to be studied. These strands are:
GeometryNumberMeasurement Chance and dataAlgebra Mathematical investigations.
As well as the core, eight options are provided. Teachers must ensure that at least40 hours (indicative) are spent in the study of the option topics included here.
Each core strand and option is introduced by Considerations which teachers shouldread before teaching sections of the strand. The Considerations raise issues related tothe teaching and learning of the concepts and skills in the strand or option. Theissues relate to:
• the syllabus aim and objectives
• the syllabus outcomes
• possibilities for integration with other strands and subjects
• language development
• assumed knowledge and skills from Stage 4
• other specific aspects of the syllabus.
Content
The content statements on the left-hand pages (core and options) describe in detailwhat students should know, understand and be able to do as a result of appropriateand relevant learning experiences facilitated by the teacher. These statements guideteachers on the extent and depth of treatment expected. The content provides thebasis for the achievement of syllabus outcomes and includes the skills that students
20
Mathematics Years 9–10 Syllabus — Intermediate Course
Core (160 hours minimum) Options(Themes and topics) (40 hours minimum)
9 6 2 0 0 I n t M a t h s 9 - 1 0 p t 1 1 0 / 9 / 9 6 4 : 1 9 P M P a g

21
Syllabus Structure
acquire as they undertake the learning experiences described. They are groupedunder subsections and have been arranged somewhat sequentially. This does notimply that teachers must follow this particular sequence when teaching each section.
Applications, suggested activities and sample questions
The applications, suggested activities and sample questions on the right-hand pagesare optional. They are suggestions for learning experiences and relevant problemsthat will aid students in their achievement of syllabus outcomes. They reflect currentresearch on the teaching and learning of mathematics. They give a range of problemtypes and investigations to aid the teaching and learning process. The activitiesincluded highlight the relevance of mathematics. Their use within the teachingprogram facilitates a problem-solving approach to student learning experiences. Theyare also intended to provide teachers with a guide to the level of difficulty intended bythe syllabus. The list of suggestions provided is not intended to be exhaustive, nor is itintended that students must experience every one of the activities and questions listed.Teachers should choose those activities and questions that are appropriate for theirstudents and will need to use additional applications, activities and questions to ensurethat the students have broad experiences in mathematics.
GeometryG1: Drawing geometrical figures
G2: Scale drawing and similar figuresG3: Geometrical facts, properties and
relationshipsG4: Congruence
Considerations
The study of space through geometry is bothderived from and applicable to the real world.The connections should be stressed to all studentsand wherever possible, situations should relate tostudents’ own experiences.
It is assumed that students are familiar with parts ofa circle from the Years 7–8 Mathematics syllabus.…
Considerationsfor the strand
G1: Drawing GeometricalFigures
Content
i) Drawing 3D figures
Learning experiences should providestudents with the opportunity to:
• make reasonable sketches of prisms,pyramids, cylinders and cones
• identify and draw nets of simplesolids
• sketch common solids from differentviews (top, side, front etc).
G1: Drawing Geometrical Figures
Applications, suggested activitiesand sample questions
i) Drawing 3D figures
Students could:
◊ include perspective in representing 3Dobjects, eg drawing those which are furtheraway smaller, making parallel lines comecloser together, using ellipses for circles etc
◊ predict which hexominoes can be used as netsfor a cube, or colour the net of a cube usingdifferent colours for the faces and predict howthe colours would meet on the cube
◊ use isometric drawings to represent cubes anddraw elevations of solids, eg draw top, front,side elevations for the ‘building’ shown …
Contentof thesectionsof thestrand
Applications,suggestedactivities
and samplequestions forthe sections
of the strand
9 6 2 0 0 I n t M a t h s 9 - 1 0 p t 1 1 0 / 9 / 9 6 4 : 1 9 P M P a g
The core
The core of essential learning has been designed for a minimum of 160 indicativehours for Stage 5. All students should undertake the appropriate mathematicalexperiences so that they have ample opportunity to achieve the outcomes of thiscourse.
Students must undertake at least one mathematical investigation, which would takearound five hours, as part of the core of this course. This could be done when thecore has been completed or could be integrated into the teaching of the core.Teachers should refer to the considerations for Mathematical investigations on page151 for further information.
The options
The remainder of the time spent on Mathematics in Years 9–10 is to be taken upby the options component. Students should study the options for at least 40 hours.It is not the case that a particular number of options needs to be taught — parts ofoptions and/or whole options can be chosen from this syllabus. Option topics orparts of option topics should be chosen that best meet the needs and interests ofthe students. The options will give students experience in applications ofmathematics that are relevant to them, and also provide further preparation fortheir chosen course of Mathematics for Years 11 and 12.
Students completing the Intermediate course who intend to continue their study ofMathematics at 2 Unit (Related) level in Stage 6 should study the following optionsas preparation for this course:
Option 4: Further measurement (Further trigonometry)
Option 5: Further algebra
Option 6: Coordinate geometry and curve sketching
Option 7: Further number.
A summary of the core and options for this course follows.
22
Mathematics Years 9–10 Syllabus — Intermediate Course
9 6 2 0 0 I n t M a t h s 9 - 1 0 p t 1 1 0 / 9 / 9 6 4 : 1 9 P M P a g

Summary of Years 9–10 Intermediate Course — Core
23
Summary — Core
Geometry
G1: Drawinggeometrical figures• Drawing 3D
figures• Drawing 2D
figures
G2: Scaledrawing andsimilar figures• Scale drawing• Similar figures
G3: Geometricalfacts, propertiesand relationships• Angles• Triangles• Quadrilaterals• Polygons
G4: Congruence• Congruence of
general figures• Congruence of
triangles
Number
N1: Number andcomputation skills• Rational
numbers• Calculation
and numbersense
• Approximation
N2: Consumerarithmetic• Earning• Interest• Sales• Consumer
problems
N3: Indices• Index notation• Applying the
index laws• Scientific
notation
N4: Ratio andrates • Ratio• Rates
Measurement
M1: Techniquesand tools formeasuring• Measuring• Time• Estimation
M2: Pythagoras’theorem
M3: Perimeter,area and volume• Perimeter• Area• Surface area• Volume
M4: Trigonometry• Right-angled
triangles andtrigonometry
• Applications oftrigonometry
Chance anddata
CD1: Collectingand organisingdata• Defining the
question• Designing the
investigation• Collecting data• Organising and
displaying data
CD2: Summarisingand interpretingdata• Measures of
location andspread
• Interpretingdisplays of data
• Evaluatingresults
CD3: Chance• Informal
concept ofchance
• Simpleexperiments
• Probability
Algebra
A1: Generalisingpatterns andproblem solving• Generalising
patterns• Generalising
solutions toproblems
A2: Algebraicstatements• Algebraic skills• Indices with
algebraicexpressions
• Formulae
A3: Linearrelationships• Relationships• Equations• Graphs of
straight lines• Inequalities
A4: Graphs• Everyday
graphs• Parabolas• Hyperbolas• Graphs
Mathematical Investigations
9 6 2 0 0 I n t M a t h s 9 - 1 0 p t 1 1 0 / 9 / 9 6 4 : 1 9 P M P a g

Summary of Years 9–10 Intermediate Course — Options
Option 1: Fractals• Iteration• Fractals in two dimensions
Option 2: Networks
Option 3: Mathematics of small business • Paying wages• Paying taxes• Investment• Running costs of small businesses
Option 4: Further measurement• Further trigonometry• Surveying• Navigation• Navigation on land
Option 5: Further algebra
• Simultaneous equations• Quadratic and related expressions• Quadratic equations• Graphs of parabolas
Option 6: Coordinate geometry and curvesketching• Distance, gradient and midpoint• Equation of a straight line• Parallel and perpendicular lines• Coordinate exercises• Curve sketching
Option 7: Further number• Real numbers• Surds• Indices• Exponential relationships
Option 8: Further probability• Probability• Probability problems with compound
events
24
Mathematics Years 9–10 Syllabus — Intermediate Course
9 6 2 0 0 I n t M a t h s 9 - 1 0 p t 1 1 0 / 9 / 9 6 4 : 1 9 P M P a g

Outcomes
Outcomes for Mathematics K–10 are written for each of the five stages. Theoutcomes for the Mathematics Stage 5 Intermediate course are derived from thecontent of this syllabus and express the specific intended results of the teaching ofthis syllabus. They provide clear statements of the knowledge and understanding,skills, values and attitudes expected to be gained by most students as a result of theeffective teaching and learning of this course. The objectives of the syllabus act asorganisers for the outcomes.
Outcomes can help teachers to:
• understand the intent of this syllabus
• set clear expectations and focus on what is to be achieved
• indicate to students and parents what has been achieved and what is to beachieved
• focus on student growth and progress, and make informed judgements aboutstudent achievement
• determine student needs, whether it be for consolidation, extension activities,remediation, or progress to another stage
• clarify the type of student achievement to be assessed by indicating appropriateknowledge and understandings, skills, and values and attitudes for students ineach stage
• encourage student self-assessment and independent learning
• plan the learning environment, program appropriate learning activities andselect teaching resources
• focus upon the product as well as the process of teaching, thereby taking greaterresponsibility for the result of their efforts
• evaluate the effectiveness of their teaching programs.
The Advanced, Intermediate and Standard Mathematics courses for Stage 5 (Years9–10) each have their own set of outcomes derived from the syllabus. As there issome commonality between the courses, there is also some overlap between theoutcomes for each course. There is overlap between the outcomes of theIntermediate course and those of the Advanced course, as well as those of theStandard course. There is also some overlap between the outcomes of Mathematics7–8 and those of the Stage 5 Intermediate course.
25
Outcomes
9 6 2 0 0 I n t M a t h s 9 - 1 0 p t 1 1 0 / 9 / 9 6 4 : 1 9 P M P a g

The outcomes for the core of the Intermediate course are organised in thecategories Values and attitudes, Working mathematically, Geometry, Number,Measurement, Chance and data and Algebra. The outcomes for each strand of thesyllabus have been linked to the content by the identification of the sections of thestrand. The outcomes for the Geometry strand are included as an example below.
The identification of outcomes related to sections of the syllabus does notnecessarily imply that all aspects of the syllabus will be represented by the relatedgroup of outcomes. In some strands, outcomes may relate to more than onesection. Completion of a section might provide the opportunity for students toachieve part of a particular outcome or set of outcomes, or in some cases thecomplete outcome(s). For example, the first two outcomes for Geometry link fairlyclosely to the section G1 (Drawing geometrical figures) of the syllabus, but theoutcome ‘identifies and uses geometrical facts, properties and relationships to solvegeometrical problems relating to angles, triangles, quadrilaterals and polygons andjustifies the results’, whilst relating to G3 (Geometrical facts, properties andrelationships), could also relate to other sections of the Geometry strand.
Knowledge, Understanding and Skills
26
Mathematics Years 9–10 Syllabus — Intermediate Course
Outcomes
A student:• recognises and sketches 3D objects in various
orientations• uses geometric techniques and tools to construct angles
and 2D figures • interprets and describes diagrams using appropriate
language• interprets and makes scale drawings and uses scale
factors to solve problems• recognises similar figures as those which can be
superposed through a series of transformations• uses the relationships between similar figures to solve
numerical problems• identifies and uses geometrical facts, properties and
relationships to solve problems relating to angles,triangles, quadrilaterals and polygons and justifies theresults
• recognises congruent figures as those which can besuperposed through a series of transformations
• applies the four congruence tests to solve problems,justifying the results.
Objectives
Students willdevelopknowledge,understandingand skills in:• Geometry.
Syll. Ref
G1
G2
G3
G4
9 6 2 0 0 I n t M a t h s 9 - 1 0 p t 1 1 0 / 9 / 9 6 4 : 1 9 P M P a g

The outcomes for the options of the syllabus have been organised within eachtopic. Students will work towards the achievement of the relevant outcomes fromthe option topics that they study.
It is intended that most students undertaking the Intermediate course shouldachieve most of the course outcomes by the end of Stage 5.
The outcomes for Working mathematically relate to the important and overarchingskills that are expected to be achieved by students while undertaking the learningexperiences in each of the six strands.
Outcomes statements for the Mathematics Stage 5 (Years 9–10) Intermediate courseare included in the following pages.
27
Outcomes
9 6 2 0 0 I n t M a t h s 9 - 1 0 p t 1 1 0 / 9 / 9 6 4 : 1 9 P M P a g

Objectives and Outcomes Intermediate Course
28
Mathematics Years 9–10 Syllabus — Intermediate Course
Values and Attitudes
Objectives Outcomes
A student:• appreciates that mathematics involves observing, generalising and
representing patterns and relationships• demonstrates a positive response to the use of mathematics as a
tool in practical situations• shows an interest in and enjoyment of the pursuit of mathematical
knowledge• demonstrates the confidence to apply mathematics and to seek
and gain knowledge about the mathematics they need from avariety of sources
• shows a willingness to work cooperatively with others and tovalue the contributions of others
• appreciates the importance of visualisation when solving problems• shows a willingness to take risks when working mathematically• shows a willingness to persist when solving problems and to try
different methods• uses mathematics creatively in expressing new ideas and
discoveries• recognises the economy and power of mathematical notation,
terminology and convention in helping to develop andcommunicate mathematical ideas
• appreciates that conventions, rules about initial assumptions,precision and accuracy enable information to be communicatedeffectively
• appreciates that a mathematical model is a simplified image ofsome aspect of the social or physical environment
• realises that justification of intuitive insights is important• appreciates how mathematics is used in a range of aspects of
society• appreciates the contribution of mathematics to our society• recognises that mathematics has its origins in many cultures and is
developed by people in response to human needs• appreciates aspects of the historical development of mathematics• appreciates the impact of mathematical information on daily life.
Students willdevelop:• appreciation of
mathematics asan essential andrelevant part oflife.
9 6 2 0 0 I n t M a t h s 9 - 1 0 p t 1 1 0 / 9 / 9 6 4 : 1 9 P M P a g

29
Outcomes
Objectives and Outcomes Intermediate Course — Core
Knowledge, Understanding and Skills
Objectives Outcomes
A student:• estimates the results of calculations and checks the reasonableness
of results using approximations and exact values as appropriate• uses appropriate technology effectively to assist in the solution of
problems• carries out algebraic and arithmetic calculations efficiently and
accurately• selects and uses appropriate mathematical techniques effectively• interprets and uses mathematical information presented in a
variety of forms (ie diagrams, text, tables, symbols)• uses appropriate problem-solving strategies which include
selecting and organising key information systematically andidentifying and working on related problems
• interprets the results of problem solutions in different contexts,considering other possible solutions
• plans, carries out and reports on a mathematical investigation withguidance
• communicates mathematical knowledge and understandingclearly, using mathematical terms and notations.
Students willdevelopknowledge,understanding and skills in:• Working
mathematically.
9 6 2 0 0 I n t M a t h s 9 - 1 0 p t 1 1 0 / 9 / 9 6 4 : 1 9 P M P a g

Objectives and Outcomes Intermediate Course — Core
30
Mathematics Years 9–10 Syllabus — Intermediate Course
Knowledge, Understanding and Skills
Objectives Outcomes Syll. Ref
A student:• recognises and sketches 3D objects in various
orientations• uses geometric techniques and tools to construct 2D
figures • interprets and describes diagrams using appropriate
language• interprets and makes scale drawings and uses scale
factors to solve problems• recognises similar figures as those that can be
superposed through a series of transformations• uses the relationships between similar figures to solve
numerical problems• identifies and uses geometrical facts, properties and
relationships to solve problems relating to angles,triangles quadrilaterals and polygons and justifies theresults
• recognises congruent figures as those that can besuperposed through a series of transformations
• applies the four congruence tests to solve problems,justifying the results.
Students willdevelopknowledge,understandingand skills in:• Geometry.
G1
G2
G3
G4
9 6 2 0 0 I n t M a t h s 9 - 1 0 p t 1 1 0 / 9 / 9 6 4 : 1 9 P M P a g
Objectives and Outcomes Intermediate Course — Core
31
Outcomes
Knowledge, Understanding and Skills
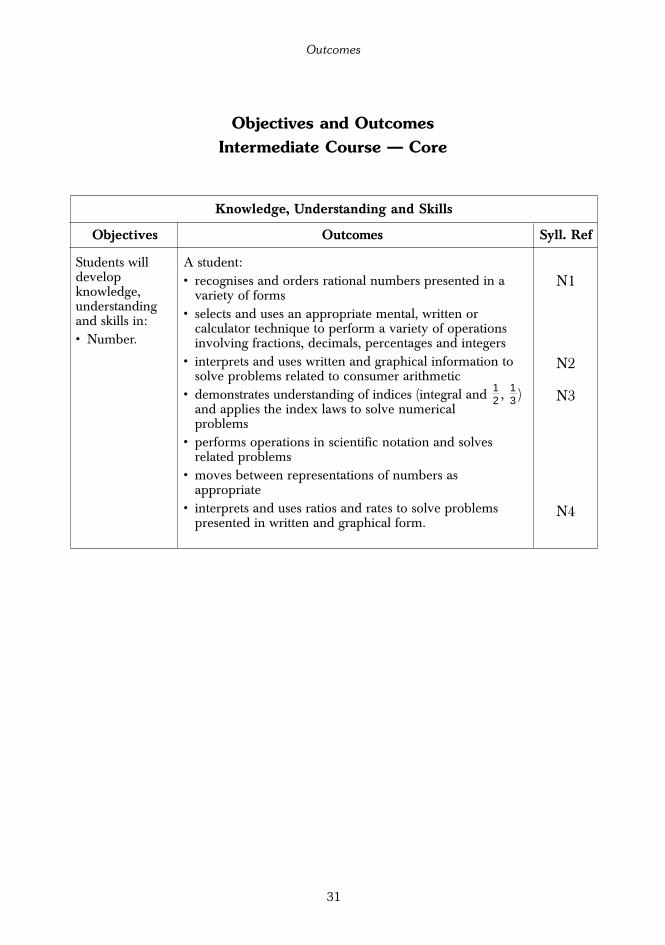
Objectives Outcomes Syll. Ref
A student:• recognises and orders rational numbers presented in a
variety of forms• selects and uses an appropriate mental, written or
calculator technique to perform a variety of operationsinvolving fractions, decimals, percentages and integers
• interprets and uses written and graphical information tosolve problems related to consumer arithmetic
• demonstrates understanding of indices (integral and , )and applies the index laws to solve numericalproblems
• performs operations in scientific notation and solvesrelated problems
• moves between representations of numbers asappropriate
• interprets and uses ratios and rates to solve problemspresented in written and graphical form.
13
12
Students willdevelopknowledge,understandingand skills in:• Number.
N1
N2
N3
N4
9 6 2 0 0 I n t M a t h s 9 - 1 0 p t 1 1 0 / 9 / 9 6 4 : 1 9 P M P a g

Objectives and OutcomesIntermediate Course — Core
32
Mathematics Years 9–10 Syllabus — Intermediate Course
Knowledge, Understanding and Skills
Objectives Outcomes Syll. Ref
A student:• uses a variety of techniques and tools to measure and
compare quantities• selects and uses appropriate common units and converts
between measures• estimates measurements appropriately in various
contexts• understands and uses Pythagoras’ theorem to solve
problems• understands and uses formulae to find lengths,
perimeters and areas of triangles, quadrilaterals, circlesand composite figures
• selects and uses formulae to find the surface area of rightprisms and cylinders
• selects and uses formulae to find the volume of rightprisms, cylinders, pyramids, cones, spheres andcomposite solids
• understands and uses the trigonometric ratios sine,cosine and tangent for angles between 0° and 90°
• uses trigonometry to solve practical problems involvingright-angled triangles.
Students willdevelopknowledge,understandingand skills in:• Measurement.
M1
M2
M3
M4
9 6 2 0 0 I n t M a t h s 9 - 1 0 p t 1 1 0 / 9 / 9 6 4 : 1 9 P M P a g

Objectives and OutcomesIntermediate Course — Options
Knowledge, Understanding and Skills
Objectives Outcomes Syll. Ref
33
Outcomes
A student:• investigates a problem by determining its focus and using
appropriate statistical processes and techniques• organises and displays data in a variety of ways and
interprets the displays• finds measures of location and spread from sets of scores• compares sets of data using graphical displays and
measures of location and spread• evaluates statements about data and draws informal
conclusions• places informal expressions of chance on a scale of 0 to 1• designs and performs simple chance experiements and
uses these experiments to estimate probabilities • solves simple probability problems.
A student:• recognises, describes and extends patterns• generalises the solutions to problems in symbols• understands, simplifies and manipulates algebraic
expressions, including those involving indices• solves equations resulting from substitution into formulae• understands and uses linear relationships expressed in
tables of values, symbols and graphs• uses a variety of techniques to solve linear equations and
inequalities and solves related problems• understands and uses gradient/intercept form of straight
line graphs• uses and interprets graphs representing physical
phenomena • understands and uses simple quadratic relationships and
reciprocal relationships• graphs straight lines, parabolas of the form y = ax2 + c
and hyperbolas, and associates their graphs with therelated equations.
Students willdevelopknowledge,understandingand skills in:• Chance and
data.
Students willdevelopknowledge,understandingand skills in:• Algebra.
CD1
CD2
CD3
A1
A2
A3
A4
9 6 2 0 0 I n t M a t h s 9 - 1 0 p t 1 1 0 / 9 / 9 6 4 : 1 9 P M P a g

Objectives and OutcomesIntermediate Course — Options
Knowledge, Understanding and Skills
Objectives Options Outcomes
34
Mathematics Years 9–10 Syllabus — Intermediate Course
A student:• uses a variety of methods to produce fractals• recognises, describes and generalises patterns
arising from 2D fractals.
A student:• draws and interprets networks appropriately,
in both theoretical and practical situations• identifies paths and circuits within networks.
A student:• makes calculations related to wages, taxes
and investments• draws conclusions related to the running
costs of small businesses after makingappropriate calculations.
A student:
• understands and uses the trigonometric ratiossine, cosine and tangent for angles between0° and 180°
• draws sine and cosine curves for anglesbetween 0° and 180°
• uses the sine, cosine and area rules to solveproblems involving non-right-angled triangles
• selects and uses the most appropriate methodof surveying areas including the traverse,radial and triangulation methods
• constructs scale drawings from sketches andpractical exercises and calculates areas andperimeters
• uses navigation terminology and techniques
• demonstrates understanding of theconventions used in navigation on sea andland and solves problems involving bearings
• uses appropriate techniques to navigate asimple course.
Students willdevelopknowledge,understanding andskills in:• Working
mathematically• Geometry• Number• Measurement • Chance and data• Algebra
Fractals
Networks
Smallbusiness
Furthermeasurement
9 6 2 0 0 I n t M a t h s 9 - 1 0 p t 1 1 0 / 9 / 9 6 4 : 1 9 P M P a g

Objectives and OutcomesIntermediate Course — Options
Knowledge, Understanding and Skills
Objectives Options Outcomes
35
Outcomes
A student:• uses a variety of techniques to solve linear
simultaneous equations and solves related problems• applies various techniques of factorisation• solves quadratic equations using a variety of
techniques• graphs parabolas and recognises the relationship
between the equation and its graphical form.
A student:• finds the length, gradient and midpoint of an
interval in the coordinate plane• understands and uses various standard forms of the
equation of a straight line and the equation of a circle• graphs circles and simple cubic relationships• applies the techniques of coordinate geometry to
simple exercises• graphs equations of the form y = axn and vertical
and horizontal transformations of these.
A student:• demonstrates an understanding of real numbers as
points on the number line and as decimals anddistinguishes between rational and irrational numbers
• performs operations with surds and indices, movingbetween representations as appropriate and solvesrelated problems
• applies the index laws for fractional indices• recognises and represents exponential relationships
in tables, graphs and symbols.
A student:• assigns probabilities to simple events of chance• constructs organised lists, tables and/or tree
diagrams to help assign probabilities to compoundevents.
Students willdevelopknowledge,understandingand skills in:• Working
mathematically• Geometry• Number• Measurement• Chance and
data• Algebra.
Furtheralgebra
Coordinategeometryand curvesketching
Furthernumber
Furtherprobability
9 6 2 0 0 I n t M a t h s 9 - 1 0 p t 1 1 0 / 9 / 9 6 4 : 1 9 P M P a g

Assessment
Assessment is the process of gathering, judging and interpreting information aboutstudent achievement in order to inform different decisions about education,including decisions about students, curriculum, and educational policy. Assessmentforms an integral and continuous part of any teaching program. The purposes ofassessment include:
• providing reliable information that can be used to inform teaching and learning
• providing feedback to students about progress
• generating information to be used in reporting processes.
Assessment can be diagnostic, formative and/or summative.
diagnostic: the identification of students’ needs, strengths and weaknesses (usedto determine the nature of students’ misconceptions or lack ofunderstanding)
formative: the measurement of students’ achievement (used to find out whatstudents know and can do so that the next steps in learning can beplanned)
summative: the measurement of the result of teaching and learning (used torecord information that shows overall achievement of a student atthe end of a unit or course).
Assessing requires measuring student achievement of syllabus outcomes. Within anassessment program it is important to consider the selection of assessmentstrategies in relation to the outcomes being assessed. The most appropriate methodor procedure for gathering assessment information is best decided by consideringthe purpose for which the information will be used, and the kind of performancethat will provide the information. For example, the assessment of achievement ofoutcomes for Chance and data involves consideration of the students’ statisticalinvestigation, while assessment of achievement of outcomes for Measurement wouldrequire different assessment strategies and often practical tasks.
Assessment throughout Stage 5 would usually be diagnostic as well as formativeand, at times, summative. Assessment during the Mathematics Stage 5 course helpsidentify students’ needs and measures students’ achievement so that the next stepsin learning can be planned.
Assessment of student achievement in relation to the objectives and outcomes ofthe syllabus should incorporate measures of students’:
• ability to work mathematically
• knowledge, understanding and skills related to Geometry, Number, Measurement,Chance and data, and Algebra.
36
Mathematics Years 9–10 Syllabus — Intermediate Course
9 6 2 0 0 I n t M a t h s 9 - 1 0 p t 1 1 0 / 9 / 9 6 4 : 1 9 P M P a g

37
Assessment
While achievement of Values and attitudes outcomes need not be reported upon,schools may choose to do so. Assessment of these outcomes could occur informallythrough student feedback, observation etc.
Students indicate their level of understanding and skill development in what theydo, what they say, and what they write and draw. Consequently there is a varietyof ways to gather information in mathematics for assessment purposes. No one wayalone is adequate, but each makes a valuable contribution to the overall assessmentprocess. Each assessment instrument should be appropriate for the outcomes it isdesigned to measure.
The following are points to consider when developing effective assessment tasks tomeasure student achievement of syllabus outcomes. (‘Tasks’ refers to anything studentsare given to do from which assessment information will be gathered, eg projects,investigations, oral reports or explanations, tests, practical assignments etc.)
• Which syllabus objectives are to be assessed?
• What are the associated syllabus outcomes?
• What type of task will be used?
• What should be considered when designing the task? – the requirements of the task need to be clear to students– the task needs to allow students to demonstrate achievement of the
appropriate outcomes– the language used needs to be clear to students– any stimulus material or practical materials need to be appropriate to the
task– students need to have the appropriate tools to complete the task– the task needs to be accessible to students.
• Does the task measure what is intended? – it should assess the appropriate balance of knowledge, understanding and
skills– it should allow for valid judgements to be made of the students’
achievements– will the task be commented upon, graded, and/or marked?
• How will the task be designed to produce consistent results?– it should be challenging and promote interest– it should be of sufficient length and level of difficulty– it should facilitate the achievement of the relevant outcomes regardless of
gender or cultural background– it should not disadvantage students who have a particular physical disability– the method of drawing information from the task should be consistent for all
students.
9 6 2 0 0 I n t M a t h s 9 - 1 0 p t 1 1 0 / 9 / 9 6 4 : 1 9 P M P a g

Teachers have the opportunity to observe and record aspects of learning. Whenstudents are working in groups, teachers are well placed to determine the extent ofstudent interaction and participation — aspects that can enhance the learningexperience for many students. By listening to what students say, including theirresponses to questions or other input, teachers are able to collect many clues aboutstudents’ existing understandings and attitudes. Through interviews (which mayonly be a few minutes in duration), teachers can collect specific information aboutthe ways in which students think in certain situations. The students’ responses toquestions and comments will often reveal levels of understanding, interests andattitudes. Records of such observations form valuable additions to informationgained using other assessment strategies and enhance teachers’ judgement of theirstudents’ achievement of outcomes. Consideration of students’ journals or theircomments on the process of gaining a solution to a problem can also be veryenlightening for teachers and provide valuable insight to the degree of students’mathematical thinking.
Possible sources of information for assessment purposes include the following:
• student responses to questions, including open-ended questions
• student explanation and demonstration to others
• questions posed by students
• samples of students’ work
• student-produced overviews or summaries of topics
• practical tasks such as measurement activities
• investigations and/or projects
• students’ oral and written reports
• short quizzes
• pen and paper tests involving multiple choice, short-answer questions andquestions requiring longer responses, including interdependent questions (whereone part depends on the answer obtained in the preceding part)
• open-book tests
• comprehension and interpretation exercises
• student-produced worked examples
• teacher/student discussion or interviews
• observation of students during learning activities, including listening to students’use of language
• observation of students’ participation in a group activity
38
Mathematics Years 9–10 Syllabus — Intermediate Course
9 6 2 0 0 I n t M a t h s 9 - 1 0 p t 1 1 0 / 9 / 9 6 4 : 1 9 P M P a g
39
Assessment
• consideration of students’ portfolios
• students’ plans for and records of their solutions of problems
• students’ journals and comments on the process of their solutions.
Teachers may wish to use some of the suggested activities and sample questionsfrom the syllabus when assessing students.
The Board’s document Assessing Students with Special Education Needs: Guidelines forthe Provision of Alternative Assessment Tasks for Students with Severe Physical Disabilities inStage 5 and Stage 6 provides advice on the adjustment of assessment strategies forspecial needs students. This document will be very useful for teachers who havestudents with physical disabilities in their class.
Assessment for the School Certificate
One aspect of assessment during Stage 5 is assessment for the School Certificate.Such assessment is summative in nature and is for the specific purpose ofmeasuring student achievement in relation to all other students in the stage whohave studied the same Mathematics course. For the purpose of the SchoolCertificate, schools need to produce a rank order of their students in each of theMathematics courses based on their achievement in mathematics.
The assessment process for this purpose involves the design of assessment tasksthat will allow decisions to be made on students’ achievement of their Mathematicscourse in relation to other students in their school who are studying the samecourse. The tasks need to validly discriminate between students. They must bebased on the relevant course of the Mathematics 9–10 Syllabus and could employ avariety of strategies.
Where tasks are scheduled throughout a course, greater weight would usually begiven to those tasks held towards the end of the course. Generally, it will benecessary to use a number of different assessment tasks in order to ensure thatstudent achievement in all the knowledge and skills objectives is assessed. For thepurpose of grading for the award of the School Certificate, values and attitudesshould not be included in assessment.
9 6 2 0 0 I n t M a t h s 9 - 1 0 p t 1 1 0 / 9 / 9 6 4 : 1 9 P M P a g

40
Mathematics Years 9–10 Syllabus — Intermediate Course
Achievement at the School Certificate in all courses is reported as a grade, basedon each school’s assessment of their students’ learning. In each Mathematicscourse, the pattern of grades awarded is:
Top 10% A
Next 20% B
Next 40% C
Next 20% D
Next 10% E
In order to ensure a common standard statewide, the grades in Mathematics aremoderated by the performance of the students on a Reference Test in each course.These tests are prepared by the Board of Studies and are based on the content ofthe core of each course.
Schools are advised how many of each grade they can award, determined by thenumber of their students who were in the percentile band for each grade on theReference Test. Schools then award grades to their students in accordance with theresults achieved on the school’s assessment program.
9 6 2 0 0 I n t M a t h s 9 - 1 0 p t 1 1 0 / 9 / 9 6 4 : 1 9 P M P a g

41
Evaluation of School Programs
Evaluation of School Programs
A regular evaluation of class and school programs should be implemented byteachers within each school. The purpose of the evaluation of teaching programs isto improve the teaching and learning of mathematics. Evaluation is concerned withreviews and judgements concerning the effectiveness, quality and need formodification of all aspects of the Mathematics curriculum.
The evaluation should include the following aspects:
• the extent to which the aims, objectives and outcomes of the syllabus are met
• the appropriateness of the assessment procedures adopted
• the adequacy of the teaching program for the development of knowledge,understanding, skills, values and attitudes specified in the syllabus
• the adequacy of the resource material available for the course
• the extent to which the syllabus supports teachers to facilitate student motivationand involvement in mathematics.
Schools should conduct effective ongoing evaluation that addresses questions such as:
• Have the overall aims of the syllabus been achieved?
• Were the objectives as stated in the syllabus implemented?
• Have the syllabus outcomes been achieved through the teaching program set bythe school?
• What types of assessment procedures were used? How effective were they?
• What teaching strategies were used? How effective were they?
• How did the students respond to the course as presented?
• Has the course been relevant to the students?
• What revisions to the teaching program have been worthwhile?
• What resources were used? Were others available? Were they effective?
This will involve qualitative as well as quantitative measures.
Informal evaluation is a continuous process in which teachers monitor and react tothe needs of their students in the teaching/learning environment.
Informal evaluations should be complemented by formal monitoring to enableschools to coordinate and plan more effective mathematics programs. The Board ofStudies will conduct a formal evaluation of the syllabus document at least oncethrough its period of implementation.
9 6 2 0 0 I n t M a t h s 9 - 1 0 p t 1 1 0 / 9 / 9 6 4 : 1 9 P M P a g

9 6 2 0 0 I n t M a t h s 9 - 1 0 p t 1 1 0 / 9 / 9 6 4 : 1 9 P M P a g

Intermediate Course
Content — Core
Geometry
Number
Measurement
Chance and data
Algebra
Mathematical investigations
9 6 2 0 0 I n t M a t h s 9 - 1 0 p t 1 1 0 / 9 / 9 6 4 : 1 9 P M P a g

44
Mathematics Years 9–10 Syllabus — Intermediate Course
Geometry
G1: Drawing geometrical figuresG2: Scale drawing and similar figures
G3: Geometrical facts, properties and relationshipsG4: Congruence
Considerations
The study of space through geometry is both derived from and applicable to thereal world. The connections should be stressed to all students and, whereverpossible, situations should relate to students’ own experience.
It is assumed that students are familiar with parts of a circle from the MathematicsYears 7–8 syllabus.
Students should be able to visualise 3D objects in different orientations and drawpossible ‘other views’ of the object. This, along with other aspects of this Geometrystrand, are included in the Mathematics 7–8 course, but are repeated here toensure that students will be competent with these skills. Some students may notneed the degree of revision encountered here.
Students should be able to perform a number of geometrical constructions, asdetailed in the Content. While the reasons that the constructions achieve the desiredresults should be explained to students, they would not be expected to produceformal proofs of such constructions.
Students will have met scale drawing in Years 7–8. The skills involved should bereviewed here as a lead-in to the concept of similar figures. Students need todevelop an intuitive understanding of similar figures, where shape is constant butsize varies. Photographs, models, scale drawings, overhead projectors etc could beused to help students gain this understanding of similarity. The concept ofsimilarity could be introduced through consideration of the enlargementtransformation. It is not intended that students will meet the formal definition ofsimilarity or formally prove that two triangles are similar, but rather that they usethe idea of similar figures as enlargements to solve practical problems.
Many of the geometrical facts and relationships have already been introduced inYears 7–8. These properties may need to be reviewed and further developed.Students need to be able to describe a geometrical situation using appropriatelanguage. The use of computers and graphics calculators as tools for drawingshould be incorporated here, especially dynamic geometry software tools which arepowerful means of encouraging investigation and building understanding ofgeometrical properties and relationships.
9 6 2 0 0 I n t M a t h s 9 - 1 0 p t 1 1 0 / 9 / 9 6 4 : 1 9 P M P a g

45
Intermediate Course — Core
The term ‘corresponding’ is often used to refer to angles or sides in the sameposition, but it also describes corresponding angles within parallel lines. Thesyllabus has used the word ‘matching’ to describe angles and sides in the sameposition; however, the use of the word corresponding is not incorrect. The word‘superposed’ is used to describe the placement of one figure upon another in such away that the parts of one coincide with the parts of the other.
References to ‘establish’ in this course imply an informal approach to explaininggeometrical relationships. Symmetry can often be useful in demonstrating theserelationships.
Discussion of congruence should begin with consideration of real situations.Transformations can be used as a basis for establishing the concept of congruence,where students recognise that congruent shapes are those that can be superposedonto each other through combinations of reflections, translations and rotations. Aninvestigative approach, using construction and measurement, could be taken toestablish the conditions for congruence. Students then use congruence conditionsto justify that two triangles are congruent. In this course it is not intended thatstudents formally prove relationships and theorems involving deductive geometry.Rather, the need for justification should be understood and practised, where suchjustification could be in the form of written sentences. If students need to usecongruent triangles to show some relationship, it is expected that they would bedirected towards congruence (or given a hint) within the question. The intendedlevel of difficulty is shown by the sample questions and applications.
9 6 2 0 0 I n t M a t h s 9 - 1 0 p t 1 1 0 / 9 / 9 6 4 : 1 9 P M P a g

46
Mathematics Years 9–10 Syllabus — Intermediate Course
G1: Drawing Geometrical Figures
Content
i) Drawing 3D figures
Learning experiences should provide students with the opportunity to:
• make reasonable sketches of prisms, pyramids, cylinders and cones
• identify and draw nets of simple solids
• sketch common solids from different views (top, side, front etc).
9 6 2 0 0 I n t M a t h s 9 - 1 0 p t 1 1 0 / 9 / 9 6 4 : 1 9 P M P a g

47
Intermediate Course — Core
G1: Drawing Geometrical Figures
Applications, suggested activities and sample questions
i) Drawing 3D figures
Students could:
◊ include perspective in representing 3D objects, eg drawing those which arefurther away smaller, making parallel lines come closer together, using ellipsesfor circles etc
◊ predict which hexominoes can be used as nets for a cube, or colour the net of acube using different colours for the faces and predict how the colours wouldmeet on the cube
◊ use isometric drawings to represent cubes anddraw elevations of solids, eg draw top, front,side elevations for the ‘building’ shown here.
9 6 2 0 0 I n t M a t h s 9 - 1 0 p t 1 1 0 / 9 / 9 6 4 : 1 9 P M P a g

G1: Drawing Geometrical Figures
Content
ii) Drawing 2D figures
Learning experiences should provide students with the opportunity to:
• use appropriate geometric instruments to draw angles
• use appropriate geometric tools to draw parallel and perpendicular lines
• use a straight edge and compasses to construct the following:– an equilateral triangle– a perpendicular from a point to a line– a bisector of an interval – the bisector of an angle– a perpendicular to a line from a point within the line
• construct figures including triangles, quadrilaterals and circles given theirdimensions
• draw and label diagrams from a set of simple specifications or a copy of thediagram
• describe a diagram using appropriate language
• explain that there may be constraints on the drawing of figures (for example,two sides of a triangle must together be longer than the third).
48
Mathematics Years 9–10 Syllabus — Intermediate Course
9 6 2 0 0 I n t M a t h s 9 - 1 0 p t 1 1 0 / 9 / 9 6 4 : 1 9 P M P a g

49
Intermediate Course — Core
G1: Drawing Geometrical Figures
Applications, suggested activities and sample questions
ii) Drawing 2D figures
Students could:
◊ draw angles of 25°, 67°, 127°, 90°, 240°, 180°, 360°, 175° … using a protractor,and describe the angles using appropriate terminology
◊ draw a pair of parallel lines that are 2 cm apart
◊ construct a 90° angle and bisect it. These constructions could be used to draw anaccurate version of an isosceles right-angled triangle with a pair of compassesand a straight edge
◊ construct a variety of figures given their dimensions, eg a square of side 5 cm, arectangle of sides 7.5 cm and 4 cm, and a triangle with sides 6 cm, 4 cm and 3 cm
◊ use mathematical properties to check the accuracy of constructed figures, egcheck the lengths of the diagonals
◊ construct a circle of radius 4.2 cm and use a piece of string to mark off an arcthat has length equal to the length of the radius, and another that has lengthequal to the diameter of the circle
◊ in a circle of diameter 7 cm, construct an equilateral triangle and a hexagon,and measure the sides of these polygons
◊ given specifications, draw a figure accurately, eg ‘An equilateral triangle ABChas BC produced to D and D joined to A. The point E is the midpoint of ADand is joined to C. Draw the figure’
◊ explain the features of a shape or solid to someone who cannot see the shape sothat they could draw an accurate version of the figure
◊ try to draw triangles with a variety of lengths of sides, including one withdimensions of 2, 3, and 4 cm. Develop a ‘rule’ for the lengths of sides oftriangles so that they can be drawn
(continued)
9 6 2 0 0 I n t M a t h s 9 - 1 0 p t 1 1 0 / 9 / 9 6 4 : 1 9 P M P a g

G1: Drawing Geometrical Figures
Content
50
Mathematics Years 9–10 Syllabus — Intermediate Course
9 6 2 0 0 I n t M a t h s 9 - 1 0 p t 1 1 0 / 9 / 9 6 4 : 1 9 P M P a g

51
Intermediate Course — Core
G1: Drawing Geometrical Figures
Applications, suggested activities and sample questions
ii) Drawing 2D figures (continued)
◊ answer questions like:a) cut off each corner of a square, as far as the midpoints of the edges. What
shape is left over? How could the four ‘corners’ be reassembled to makeanother square? Will the pattern continue if the process is repeated?
b) take two squares. Place the second square centred over the first square but ata 45° angle. What shape is the intersection of the two squares? (This could bea visualisation exercise)
c) Write a set of geometric instructions that would enable another person toconstruct a diagram with the same geometric features as those shown.
A B
D C
E
9 6 2 0 0 I n t M a t h s 9 - 1 0 p t 1 1 0 / 9 / 9 6 4 : 1 9 P M P a g

G2: Scale Drawing and Similar Figures
Content
i) Scale drawing
Learning experiences should provide students with the opportunity to:
• interpret scale drawings, using the scale to calculate actual lengths
• choose appropriate scales for making scale drawings
• make simple scale drawings
• use scale drawings to solve problems.
52
Mathematics Years 9–10 Syllabus — Intermediate Course
9 6 2 0 0 I n t M a t h s 9 - 1 0 p t 1 1 0 / 9 / 9 6 4 : 1 9 P M P a g

G2: Scale Drawing and Similar Figures
Applications, suggested activities and sample questions
i) Scale drawing
Students could:
◊ use scale drawings to find the actual measurements of sides and inclusions
◊ draw scale diagrams of a field/building that can be measured, eg netball court,football field, basketball court, swimming pool, classroom, home, local building,choosing the appropriate scale
◊ enlarge and/or reduce cartoons/logos
◊ use a floor plan to work out the cost of floor coverings, including labour.
53
Intermediate Course — Core
9 6 2 0 0 I n t M a t h s 9 - 1 0 p t 1 1 0 / 9 / 9 6 4 : 1 9 P M P a g

G2: Scale Drawing and Similar Figures
Content
ii) Similar figures
Learning experiences should provide students with the opportunity to:
• demonstrate understanding that two figures are similar when one figure can beenlarged and superposed on the other so that they coincide exactly
• demonstrate understanding that such superpositions can be achieved by asequence of enlargements, translations, rotations and/or reflections
• demonstrate understanding that two figures are similar when they have thesame shape but different sizes
• identify the elements preserved in similar figures, namely shape, angle size andthe ratio of corresponding sides
• find the scale factor or similarity factor that relates two similar figures
• recognise that similarity is demonstrated in scale drawings, models,photographs, plans etc
• identify similar 2D figures
• calculate dimensions of similar figures using the enlargement or reductionfactor.
54
Mathematics Years 9–10 Syllabus — Intermediate Course
9 6 2 0 0 I n t M a t h s 9 - 1 0 p t 1 1 0 / 9 / 9 6 4 : 1 9 P M P a g

G2: Scale Drawing and Similar Figures
Applications, suggested activities and sample questions
ii) Similar figures
Students could:◊ enlarge triangles, eg a 3, 4, 5 triangle to a 6, 8, 10 triangle, or to 9, 12, 15 or 4.5,
6, 7.5 etc, and verify that angle size and shape remain constant. They could thenfind the scale factors for each enlargement
◊ find the scale factor of enlargement obtained by an overhead projector, orenlargements of photos
◊ find the scale factors of reduction for maps and plans◊ consider the triangle tessellation shown, and find the
scale factor between triangle ABC and DEF. Theycould investigate other pairs of similar triangles
◊ investigate the similarity of triangles in theconstruction of a fractal such as the Sierpinski triangle
◊ investigate whether two rectangles are similar always, sometimes or never◊ comment appropriately on statements such as: ‘Any two circles are similar’,
‘Any two equilateral triangles are similar’, ‘Any two isosceles triangles aresimilar’, ‘Any two squares are similar’ etc
◊ answer questions like:a) the rectangles in the diagram are similar.
Calculate the missing length
b) decide which of the trianglesshown are similar and find thefactor of reduction or enlargement
c) the triangles in the diagram aresimilar. Calculate the missinglengths of the sides
◊ use practical measurement and similar triangles to find lengths that cannot bemeasured, eg find the height of a tree by measuring the lengths of the shadowscast by it and by a vertical metre ruler.
55
Intermediate Course — Core
A D
B
EF
C
6cm
3.5cm
24cm
?
1
1 1.5
2
3
4
5
12
A
C
G
B A F5cm 20cm
4cm 8cm
9 6 2 0 0 I n t M a t h s 9 - 1 0 p t 1 1 0 / 9 / 9 6 4 : 1 9 P M P a g

G3: Geometrical Facts, Properties and Relationships
Content
Basic facts about the parts of a circle are assumed knowledge from the Years 7–8 course.
i) Angles
Learning experiences should provide students with the opportunity to:
• identify angles that are congruent, complementary and supplementary
• identify and use angle relationships involving– angles in a straight line– angles at a point– vertically opposite angles
• identify and name alternate, corresponding and cointerior angles when atransversal crosses two or more lines
• establish and apply angle relationships for parallel lines, ie alternate andcorresponding angles are equal, cointerior angles are supplementary
• apply the angle relationships above to solve problems, giving a reason for theirsolution.
56
Mathematics Years 9–10 Syllabus — Intermediate Course
9 6 2 0 0 I n t M a t h s 9 - 1 0 p t 1 1 0 / 9 / 9 6 4 : 1 9 P M P a g

57
Intermediate Course — Core
G3: Geometrical Facts, Properties and Relationships
Applications, suggested activities and sample questions
i) Angles
Students could:
◊ draw pairs of parallel lines with the transversal cutting the lines at differentangles, find the size of the angles and draw conclusions about the anglerelationships which exist in parallel lines
◊ find the size of as many angles as possible inthe diagram shown, giving reasons
◊ from diagrams such as these, identify any congruent, complementary orsupplementary angles, and find the size of the angles marked by thepronumeral.
60°
40° x°
y° y°y°x°z° 100°
45°30°x°x°
9 6 2 0 0 I n t M a t h s 9 - 1 0 p t 1 1 0 / 9 / 9 6 4 : 1 9 P M P a g
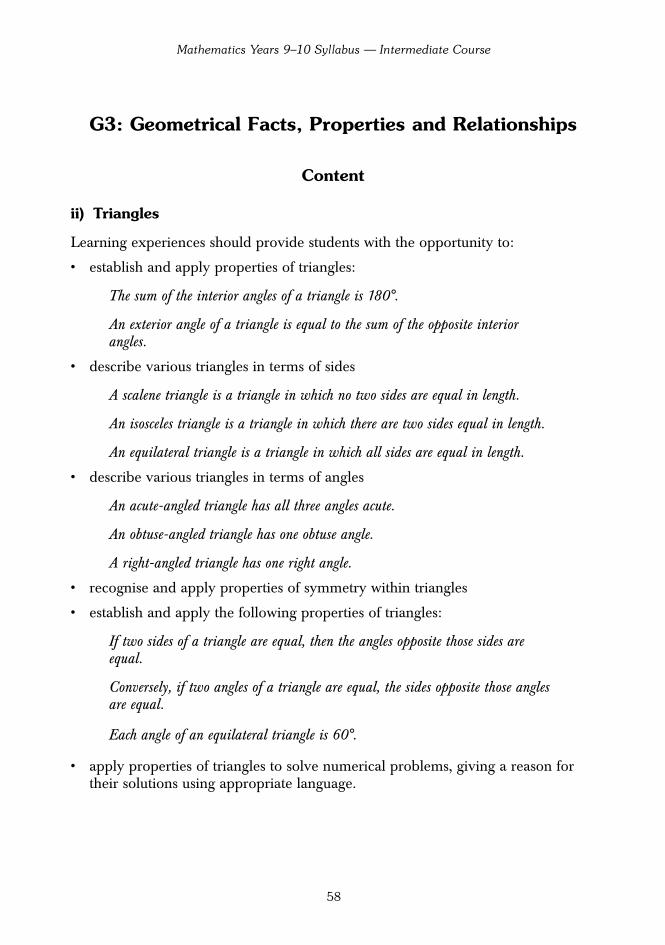
G3: Geometrical Facts, Properties and Relationships
Content
ii) Triangles
Learning experiences should provide students with the opportunity to:
• establish and apply properties of triangles:
The sum of the interior angles of a triangle is 180°.
An exterior angle of a triangle is equal to the sum of the opposite interiorangles.
• describe various triangles in terms of sides
A scalene triangle is a triangle in which no two sides are equal in length.
An isosceles triangle is a triangle in which there are two sides equal in length.
An equilateral triangle is a triangle in which all sides are equal in length.
• describe various triangles in terms of angles
An acute-angled triangle has all three angles acute.
An obtuse-angled triangle has one obtuse angle.
A right-angled triangle has one right angle.
• recognise and apply properties of symmetry within triangles
• establish and apply the following properties of triangles:
If two sides of a triangle are equal, then the angles opposite those sides areequal.
Conversely, if two angles of a triangle are equal, the sides opposite those anglesare equal.
Each angle of an equilateral triangle is 60°.
• apply properties of triangles to solve numerical problems, giving a reason fortheir solutions using appropriate language.
58
Mathematics Years 9–10 Syllabus — Intermediate Course
9 6 2 0 0 I n t M a t h s 9 - 1 0 p t 1 1 0 / 9 / 9 6 4 : 1 9 P M P a g

59
Intermediate Course — Core
G3: Geometrical Facts, Properties and Relationships
Applications, suggested activities and sample questions
ii) Triangles
Students could:
◊ generate and classify triangles which satisfy a given condition, eg producetriangles which have two sides equal
◊ investigate which types of triangles have angle bisectors that are axes of symmetry
◊ comment on multiple classifications of triangles, eg could a triangle be scaleneand obtuse at the same time, or isosceles and obtuse, or right-angled and obtuse,or equilateral and obtuse?
◊ consider the result of changing one aspect of a triangle to produce another triangle
◊ answer questions like:a) an isosceles triangle has a side 10 cm and an angle 25°. What might the
triangle look like?b) find the size of the
angles marked x inthe followingdiagrams and write a sentence to explain how you found the size of themarked angle, giving a reason for the result
◊ write down as much information as possible about this triangle
◊ construct the three possible triangles in which one side is 5 cm andtwo angles are 90° and 60°
◊ given that a triangle has three axes of symmetry and a side length 4 cm, drawand describe the triangle
◊ in a triangle, investigate the relationship between the size of an angle and thelength of the side opposite, eg the side opposite the largest angle is the longest side
◊ answer questions like:a) find the value of x and y in the diagram below and give reasons. What
conclusions can you draw?
(Sample response)x = 66° because it is opposite the other angle which is 66°.
Angle y and 114° are on a straight line so y is 66°.
AB and AC must be equal because triangle ABC is isosceles.
50°60°x° x°
115°30°
x°y°
x°
72° 36°
x y 114°B
E
A
D66° C
9 6 2 0 0 I n t M a t h s 9 - 1 0 p t 1 1 0 / 9 / 9 6 4 : 1 9 P M P a g

G3: Geometrical Facts, Properties and Relationships
Content
iii) Quadrilaterals
Learning experiences should provide students with the opportunity to:
• establish and apply the following:
The sum of the interior angles of a quadrilateral is 360°.
• recognise and describe various quadrilaterals:
A trapezium is a quadrilateral in which one pair of opposite sides is parallel.
A parallelogram is a quadrilateral in which both pairs of opposite sides areparallel.
A rhombus is a quadrilateral in which both pairs of opposite sides are paralleland all sides are equal in length.
A rectangle is a quadrilateral in which both pairs of opposite sides are paralleland all four angles are right angles.
A square is a quadrilateral in which four sides are equal and all four angles areright angles.
• apply the following properties of quadrilaterals:
Parallelogram (opposite sides and angles equal, diagonals bisect each other).
Rhombus (diagonals bisect each other at right angles, diagonals bisect the anglesthrough which they pass).
Rectangle (diagonals are equal).
• apply properties of quadrilaterals to solve numerical problems, justifying thesolution using appropriate language.
60
Mathematics Years 9–10 Syllabus — Intermediate Course
9 6 2 0 0 I n t M a t h s 9 - 1 0 p t 1 1 0 / 9 / 9 6 4 : 1 9 P M P a g

61
Intermediate Course — Core
G3: Geometrical Facts, Properties and Relationships
Applications, suggested activities and sample questions
iii) Quadrilaterals
Students could:
◊ establish that the sum of the interior angles of aquadrilateral is 360° by drawing in a diagonaland recognising that the quadrilateral is madeup of two triangles and that the sum of the angles of the quadrilateral is equal tothe sum of the angles of the two triangles
◊ design and use a diagram or flowchart to ask a series of questions that will allowclassification of different quadrilaterals
◊ generate and classify shapes that satisfy a given condition (eg adjacent sidesequal)
◊ determine the common properties for shapes with equal diagonals that bisecteach other and consider what happens if a further constraint is added, eg thediagonals meet at right angles
◊ explore the types of quadrilaterals formed if:
a) two intersecting diagonals bisect each otherb) two intersecting diagonals bisect each other at right anglesc) the diagonals do not bisect each other
◊ relate properties of rhombuses to the geometrical constructions for drawing the:
– perpendicular from a point to a line– bisector of an interval– bisector of an angle– perpendicular to a line from a point within a line
◊ given a geometrical question which has too much information, identifyredundant information. Given a question which does not have enoughinformation, they could work out what extra information is needed to answerthe question
(continued)
9 6 2 0 0 I n t M a t h s 9 - 1 0 p t 1 1 0 / 9 / 9 6 4 : 1 9 P M P a g

G3: Geometrical Facts, Properties and Relationships
Content
iv) Polygons
Learning experiences should provide students with the opportunity to:
• establish and apply the following:
The interior angle sum of a polygon with n sides is 180(n – 2)°.
The sum of the exterior angles of a polygon is 360°.
• find the interior and exterior angles of a given regular polygon
• apply the above relationships to solve numerical problems involving polygons,justifying the solutions using appropriate language.
62
Mathematics Years 9–10 Syllabus — Intermediate Course
9 6 2 0 0 I n t M a t h s 9 - 1 0 p t 1 1 0 / 9 / 9 6 4 : 1 9 P M P a g

63
Intermediate Course — Core
G3: Geometrical Facts, Properties and Relationships
Applications, suggested activities and sample questions
iii) Quadrilaterals (continued)
Students could:
◊ answer questions like:a) for the parallelogram here, the line AE is
perpendicular to a diagonal. What two angles couldbe given so that the sizes of all angles in the diagramcan be found? Explain your reasoning
b) decide what additional information might be neededto find the size of angle x in the diagram
c) decide what items of information need not have beengiven in order to find the value of the unknownangles in the diagram
◊ discuss whether a square is a rectangle, or a parallelogram is a trapezium.
iv) Polygons
Students could:
◊ show, by tearing off the corners and arranging them in a spiral, that the anglesof a heptagon add to 2.5 revolutions
◊ draw various polygons (equilateral triangle, square, pentagon, hexagon, octagonetc) and, by dissection into triangles, find the angle sum of each. They coulddevelop a rule that describes the relationship between the number of sides of apolygon and its angle sum (computer software such as LOGO or othercommercially available geometrical software can enhance this activity)
◊ investigate the sum of the exterior angles for various polygons and generalise arule for this sum
◊ compare perimeters of inscribed and circumscribed polygons to approximatethe length of the circumference of a circle (this is how Archimedes developedan approximation for π)
◊ use their knowledge of regular polygons to explain why regular hexagonstessellate but some other regular polygons may not. They could determinewhich regular polygons tessellate
◊ find the size of the interior angles in a regular pentagon
◊ find the number of sides of a regular polygon if the exterior angles are each 45°
◊ determine whether there is a regular polygon whose exterior angles are all 15°.
A
E
123° x°
45° x°
y° 135°
9 6 2 0 0 I n t M a t h s 9 - 1 0 p t 1 1 0 / 9 / 9 6 4 : 1 9 P M P a g

G4: Congruence
Content
i) Congruence of general figures
Learning experiences should provide students with the opportunity to:
• demonstrate understanding that two figures are congruent when one figure canbe superposed on the other so that they coincide exactly
• demonstrate understanding that such superpositions can be achieved by asequence of translations, rotations and/or reflections
• demonstrate understanding that when two figures are congruent, matchinglengths and angles are equal.
64
Mathematics Years 9–10 Syllabus — Intermediate Course
9 6 2 0 0 I n t M a t h s 9 - 1 0 p t 1 1 0 / 9 / 9 6 4 : 1 9 P M P a g

65
Intermediate Course — Core
G4: Congruence
Applications, suggested activities and sample questions
i) Congruence of general figures
Students could:
◊ investigate congruence in a variety of patterns used by other cultures (eg tapacloths, Aboriginal designs, Indonesian ikat designs, Islamic designs, designs usedin ancient Egypt, Persia, window lattice, woven mats and baskets)
◊ fold and cut plane shapes in various ways to form a given number of congruentparts
◊ consider the effect of reflections, rotations and translations on congruent figures
◊ decide whether figures are congruent and whichtransformations might have been performed to convertone figure to another, eg for the figures shown.
1 2 21
9 6 2 0 0 I n t M a t h s 9 - 1 0 p t 1 1 0 / 9 / 9 6 4 : 1 9 P M P a g

G4: Congruence
Content
ii) Congruence of triangles
Learning experiences should provide students with the opportunity to:
• determine what information is needed to show that two triangles are congruent,ie:
If the three sides of one triangle are respectively equal to the three sides ofanother triangle, then the two triangles are congruent (SSS).
If two sides and the included angle of one triangle are respectively equal to twosides and the included angle of another triangle, then the two triangles arecongruent (SAS).
If two angles and one side of one triangle are respectively equal to two anglesand the matching side of another triangle, then the two triangles are congruent(AAS).
If the hypotenuse and a second side of one right-angled triangle are respectivelyequal to the hypotenuse and a second side of another right-angled triangle, thenthe two triangles are congruent (RHS).
• apply the four congruence tests above to solve numerical exercises
• justify that two given triangles are congruent, using congruence tests fortriangles.
66
Mathematics Years 9–10 Syllabus — Intermediate Course
9 6 2 0 0 I n t M a t h s 9 - 1 0 p t 1 1 0 / 9 / 9 6 4 : 1 9 P M P a g

67
Intermediate Course — Core
G4: Congruence
Applications, suggested activities and sample questions
ii) Congruence of triangles
Students could:
◊ experiment to suggest sets of minimum conditions under which triangles will becongruent. This could be approached by having students construct triangleswith particular measurements for sides and angles, and testing whether they arecongruent by superposing
◊ consider a question where information is given that two sides of one triangle areequal to two sides of the other, and decide what further information is neededin order to say that the two triangles are congruent
◊ investigate whether a triangle can be copied with the following techniques:– using compasses and drawing the three sides– using a protractor only and transferring the three angles– using two sides and any angle– using two angles and any one side
◊ decide which triangles are congruent from a set of triangles and explain why, eg:
◊ answer questions like:
a) use the information in the diagram b) in the diagram below, O isto show that ∆ABC ≡ ∆ACD. the centre of the circle and What can you say about the AD = DB. Show that figure ABCD? ∆AOD is congruent to ∆BOD.
(Sample answer)
The triangles are congruent because there is a pair of equal sides shown, a common side and a pair of equal angles included. (SAS)
A60° 40°
7cm C
B
E60° 40°
7cm 7cm
F
G
H40°
60°
I
J
DB
C
A
DA B
O
9 6 2 0 0 I n t M a t h s 9 - 1 0 p t 1 1 0 / 9 / 9 6 4 : 1 9 P M P a g

Number
N1: Number and computation skillsN2: Consumer arithmetic
N3: IndicesN4: Ratio and rates
Considerations
The skills developed in this strand have links with other units of work and can betaught in context. Students will be able to refine these skills throughout the course.The skill of approximation should be practised throughout the course, withstudents continually encouraged to look at their answers and ensure that they makesense in the context of the questions.
Students should understand the distinction between a number and anapproximation to it. They should be able to use numbers in exact form or asapproximations, depending on the context and the requirements of the question.When converting from recurring decimals to fractions, students need only considersingle-digit recurring decimals.
Algebra is introduced as generalised number. A firm basis of understanding inNumber is essential for students to help develop clear understanding and confidentapplication of algebraic concepts.
Consumer arithmetic includes applications of basic number skills of money,percentages, decimal fractions and formulae. Examples that reflect current wageand salary conditions and commercial practice should be used. Students will needpractice in using weekly, fortnightly and monthly PAYE tax tables. It is notintended that students calculate superannuation using a ‘series’ approach, butrather, understand that it is a deduction from gross income. It is not expected thatthe compound interest formula be used, rather that compound interest is to beconsidered only over a small number of time periods using an iterative approach.Consumer arithmetic provides an opportunity for students to gain an appreciationof the usefulness of spreadsheets. Prepared spreadsheets provide a tool that willgive quick results when items are varied (eg interest rate, time period etc).
Students need to be aware that different representations of numbers are needed inparticular contexts (eg scientific notation for very large or small numbers). Theyshould be confident in using different representations of numbers and have anappreciation of the size of such numbers.
68
Mathematics Years 9–10 Syllabus — Intermediate Course
9 6 2 0 0 I n t M a t h s 9 - 1 0 p t 1 1 0 / 9 / 9 6 4 : 1 9 P M P a g

Students should already be competent in using scientific calculators from theMathematics Years 7–8 course. In this syllabus, calculators are not treated as aseparate topic, and students should be introduced to new keys on their scientificcalculators as they need them. However, it is most important that studentsmaintain and develop their mental arithmetic skills. They should be encouragednot to rely on their calculators for every calculation, but should choose the mostefficient means for answering questions. Students should recognise that differentscientific calculators may require different sequences of keys, and should beconfident in using their own calculators.
The topic of Indices is dealt with in this strand where consideration of the indexlaws are introduced through numerical applications. Index work with algebraicexpressions is considered in the section on Algebraic statements (see Algebra).
The time spent on ratio should be determined by the experience, confidence andcompetence with ratio that students have already had. The midpoint of an intervalis introduced here as an application of ratio. Rates should be considered in thecontext of real-life situations and can be linked to other topics such asmeasurement, consumer arithmetic and graphs.
69
Intermediate Course — Core
9 6 2 0 0 I n t M a t h s 9 - 1 0 p t 1 1 0 / 9 / 9 6 4 : 1 9 P M P a g

N1: Number and Computation Skills
Content
i) Rational numbers
A rational number is the ratio of two integers where b ≠ 0.
Learning experiences should provide students with the opportunity to:
• identify integers from a given list of rational numbers
• explain why all integers are rational numbers
• use the notation for recurring decimals
(eg = 0.3333 …, = 0.241241241 …)
• express fractions as terminating or recurring decimals
• express simple recurring decimals (eg ) as fractions.0.3̇
0.2̇41̇0.3̇
ab
70
Mathematics Years 9–10 Syllabus — Intermediate Course
9 6 2 0 0 I n t M a t h s 9 - 1 0 p t 1 1 0 / 9 / 9 6 4 : 1 9 P M P a g

71
Intermediate Course — Core
N1: Number and Computation Skills
Applications, suggested activities and sample questions
i) Rational numbers
Students could:
◊ investigate families of fractions, such as thirds, writing the fractions as decimals
◊ choose integers and rational numbers from a list of numbers, eg 5, 2.7, 4.555 …,, , , 3 × 10⁴, 26%, –2.35, π, 2:3, , , etc
◊ write fractions such as , , and as recurring decimals
◊ check that arithmetic operations involving rational numbers always result inrational numbers, eg 5.9 ×
◊ write as a fraction.0.1̇
27
16
57
13
29
-4725
15
272
9 6 2 0 0 I n t M a t h s 9 - 1 0 p t 1 1 0 / 9 / 9 6 4 : 2 0 P M P a g

N1: Number and Computation Skills
Content
ii) Calculation and number sense
Learning experiences should provide students with the opportunity to:
• recognise the need for negative numbers and perform calculations involvingthem
• order common fractions, decimals, integers, and percentages
• choose and sequence arithmetic operations correctly to solve a problem
• convert between fractions, decimals and percentages
• perform calculations involving fractions, integers, decimals and percentagesusing: – mental techniques– calculator techniques – written techniques as appropriate
• use the symbols <, >, ≤, ≥, ≠, ≈ as convenient devices for expressing numericalinequalities
• interpret and use the language of percentages in everyday contexts
• interpret and apply commonly used and efficient numerical techniques, eg anincrease by 15% is the same as 115% of the number
• restate word problems symbolically in terms of the operation(s) needed
• use appropriate representations of numbers for particular contexts
• check whether the answer makes sense in context
• solve problems that involve the above skills.
72
Mathematics Years 9–10 Syllabus — Intermediate Course
9 6 2 0 0 I n t M a t h s 9 - 1 0 p t 1 1 0 / 9 / 9 6 4 : 2 0 P M P a g

N1: Number and Computation Skills
Applications, suggested activities and sample questions
ii) Calculation and number sense
Students could:
◊ consider real-life applications of negative numbers, such as temperature
◊ place negative numbers (including fractions and decimals) on a number line andhave an idea of their relative size
◊ answer questions like:a) find three numbers between and b) what are the next three numbers in the sequence 1.3, 0.65, 0.325?c) two fractions, in lowest terms and with different denominators, have a
difference of . What could the numbers be?
◊ give ready responses to conversions between common fractions, decimals andpercentages, eg 10% is , or 0.1
◊ find and interpret examples of decimals, fractions, percentages fromnewspapers, advertising, food labels, sport results, TV news and judge theaccuracy of the use of the numbers
◊ without calculation, use the symbols < , > , = to complete statements such as:
344 ×1.3 � 246, 830 ÷ 0.9 � 830, and explain their results
◊ answer questions like: a) of a number is 22. What is the number?b) what number, when divided by 0.8, gives 16?c) find the wholesale price of an item which sells at $650 if the selling price is
130% of the wholesale priced) find the original price of an article discounted by 20% if the discounted price
is $48e) find how many years it will take for a tree with a diameter of 20 mm to reach
50 mm if the diameter growth rate is 4.3 mm per year
◊ use mental arithmetic to square numbers, eg all the numbers up to 15
◊ state what ‘increased by 200%’ means and give an example where it might beused appropriately
◊ explain how to use the calculator to find (continued)
1.62 + 3.12
45
110
38
15
18
73
Intermediate Course — Core
9 6 2 0 0 I n t M a t h s 9 - 1 0 p t 1 1 0 / 9 / 9 6 4 : 2 0 P M P a g
N1: Number and Computation Skills
Content
74
Mathematics Years 9–10 Syllabus — Intermediate Course
9 6 2 0 0 I n t M a t h s 9 - 1 0 p t 1 1 0 / 9 / 9 6 4 : 2 0 P M P a g

N1: Number and Computation Skills
Applications, suggested activities and sample questions
ii) Calculation and number sense (continued)
Students could:
◊ investigate by trial and error a problem like: ‘After pressing the +, √ keys and twonumbers on the calculator, the result was 13. What numbers could they havebeen?’
◊ identify results which are obviously wrong (eg an answer of 9.1 kg for the averageweight of new-born babies, or investing $1000 for 5 years and receiving $25 000)
◊ identify situations where redundant information is given, eg: when shopping fornew clothes, Joe spent $52 on jeans, $22.50 on a shirt, $12.95 on a belt andreceived $12.50 change from $100. Of the money spent, what percentage wasspent on the shirt? What information was not needed to answer this question?
75
Intermediate Course — Core
9 6 2 0 0 I n t M a t h s 9 - 1 0 p t 1 1 0 / 9 / 9 6 4 : 2 0 P M P a g
N1: Number and Computation Skills
Content
iii) Approximation
Learning experiences should provide students with the opportunity to:
• estimate the results of calculations to check the reasonableness of calculations
• decide on an appropriate level of accuracy for results of calculations
• use the language of estimation appropriately, including: – rounding– approximate– estimate– exact– level of accuracy
• round numbers sensibly, including expressing numbers correct to a specifiednumber of decimal places
• provide exact answers rather than decimal approximations as appropriate
• determine the effect of truncating or rounding during calculations on theaccuracy of the results of computations.
76
Mathematics Years 9–10 Syllabus — Intermediate Course
9 6 2 0 0 I n t M a t h s 9 - 1 0 p t 1 1 0 / 9 / 9 6 4 : 2 0 P M P a g

N1: Number and Computation Skills
Applications, suggested activities and sample questions
iii) Approximation
Students could:
◊ estimate the size of the result of calculations (eg 4.8 × 58.2 is about 5 × 60 or 300)
◊ make approximations, eg the result of 8.6 × 84.4 is between 8 × 80 and 9 × 90or between 640 and 810
◊ consider large numbers such as Australia’s Gross Domestic Product (GDP), orcrowd sizes etc, and discuss the level of accuracy that is used in differentcontexts
◊ estimate the result of multiplying and dividing by decimals, using a number lineif necessary, eg 6.2 ÷ 0.75 can be represented in the following way:
How many times will the block of length 0.75 fit in the distance up to 6.2?
◊ answer questions like: a) a number is rounded to 2.15. What could the number have been? What is
the smallest the number could have been? Discuss the largest number thatcan be rounded to 2.15.
b) seven people have a restaurant meal. They decide to share the bill of $187.45equally. Discuss the level of accuracy needed for the result and explain howto use rounding off to find the amount each person pays
◊ recognise that calculators show approximations to repeating decimals, eg = 0.66666667 or = 0.6666666
◊ consider the effects of rounding inappropriately (eg rounding the area of a roommeasuring 2.73 m × 4.14 m to 3 m × 4 m if working out the area for tiling)
◊ answer the following two questions and compare the results:
a) the formulae for the circumference and area of a circle are C= πd and A= πr2
respectively. The circumference of a circle is 11 cm. Find the radius, givingyour answer to one decimal place. Find the area of the circle, giving theanswer to one decimal place
b) the formulae for the circumference and area of a circle are C= πd and A= πr2
respectively. The circumference of a circle is 11 cm. Find the area of thecircle, giving the answer to one decimal place.
23
23
0 1 2 3 4 5 6
77
Intermediate Course — Core
9 6 2 0 0 I n t M a t h s 9 - 1 0 p t 1 1 0 / 9 / 9 6 4 : 2 0 P M P a g

N2: Consumer Arithmetic
Content
i) Earning
Learning experiences should provide students with the opportunity to:
• interpret and use the language of earning (eg wage, salary, commission,piecework, overtime, net income)
• calculate wages, salary, piecework, commission and overtime for various timeperiods
• calculate net earnings considering deductions such as taxation and superannuation.
ii) Interest
Learning experiences should provide students with the opportunity to:
• calculate simple interest on investments and loans using the formula I = PRTwhere R =
• calculate compound interest on investments and loans (over a small number oftime periods) using repetition of the simple interest formula.
r100
78
Mathematics Years 9–10 Syllabus — Intermediate Course
9 6 2 0 0 I n t M a t h s 9 - 1 0 p t 1 1 0 / 9 / 9 6 4 : 2 0 P M P a g

N2: Consumer Arithmetic
Applications, suggested activities and sample questions
i) Earning
Students could:
◊ using class data, investigate and use rates of pay from students’ part-time jobs,or jobs advertised in the newspaper, to make calculations for wages or salariesincluding overtime, superannuation and taxation
◊ investigate and make calculations for other payments such as bonuses andholiday loadings.
ii) Interest
Students could:
◊ find the interest payable by reading a prepared table
◊ compare the interest rates for different types of savings accounts
◊ use a prepared spreadsheet to calculate interest and costs when using a creditcard
◊ use a prepared spreadsheet to compare simple and compound interest, egcompare the interest earned on $10 000 invested at 8% simple interest perannum for 5 years, and 8% per annum compounded annually over the sametime period
◊ verify bank charges from bank statements
◊ answer questions like:a) if the simple interest over 3 years on $50 000 is $8000, what is the interest
rate?b) Juan borrowed $1200 at 1.5% simple interest per month. Which is the best
estimate of the interest charges for six months: $20, $100, $200 or $1800?
79
Intermediate Course — Core
9 6 2 0 0 I n t M a t h s 9 - 1 0 p t 1 1 0 / 9 / 9 6 4 : 2 0 P M P a g

N2: Consumer Arithmetic
Content
iii) Sales
Learning experiences should provide students with the opportunity to:
• calculate profit and loss on purchases
• calculate percentage discount on items.
iv) Consumer problems
Learning experiences should provide students with the opportunity to:
• identify best buys
• find the value of an item after a certain time period of depreciation orappreciation over a small number of time periods
• calculate and compare the cost of purchasing using different methods ofpayment, including:– cash– lay-by– buying on terms– loan
• interpret and use step graphs and conversion graphs related to consumerarithmetic.
80
Mathematics Years 9–10 Syllabus — Intermediate Course
9 6 2 0 0 I n t M a t h s 9 - 1 0 p t 1 1 0 / 9 / 9 6 4 : 2 0 P M P a g
81
Intermediate Course — Core
N2: Consumer Arithmetic
Applications, suggested activities and sample questions
iii) Sales
Students could:
◊ investigate advertisements relating to sales that may be vague or misleading (eg100% off)
◊ consider whether the purchase price of an item will be the same when: i) a fixed percentage mark-up is added to the cost price and then a 10%
discount is given or ii) the 10% discount is taken from the cost price and then the fixed percentage
mark-up is added
◊ calculate the amount of mark-up for different items given a fixed profit margin
◊ answer questions like: a shop owner marks everything up by 30% and the sellingprice of an article is $72. What is the cost price and the profit on this article?
iv) Consumer problems
Students could:
◊ devise and compare strategies to determine best buys in a realistic context
◊ calculate the most economical way to buy items given a number of options
◊ answer questions like: a new computer depreciates by 30% per year. If it costs$2000 new, what will it be worth in 3 years?
◊ investigate credit cards and terms as methods of payment and compare the totalamounts paid
◊ interpret step graphs for situations such as: phone rates, taxi fares, parking rates
◊ interpret and draw conversion graphs for situations such as: comparison ofAustralian currency to an overseas currency, hours of work to weekly pay
◊ investigate the costs involved in running a car, going on an overseas trip,providing food for the family for a week
◊ plan a disco to raise $100, estimating costs and a reasonable ticket price. Makegraphs of costs ($) versus number of people, and on the same axes graph income($) versus number of people. Use the graphs to determine how many tickets needto be sold to break even, and the number of tickets for a profit of $100.
◊ use prepared data from banks to draw and interpret a conversion graph forrepayments on a loan of $100 000 for a fixed rate of interest over different timeperiods.
9 6 2 0 0 I n t M a t h s 9 - 1 0 p t 1 1 0 / 9 / 9 6 4 : 2 0 P M P a g

N3: Indices
Content
In this section on indices only numerical expressions with indices are considered. A furthersection on indices with algebraic expressions occurs in Algebraic Statements (see Algebra).
i) Index notation
Learning experiences should provide students with the opportunity to:
• write xn in expanded form where x > 0, n > 0
• use appropriate language to describe numbers written in index form, eg base,power, exponent, index
• use patterns of indices or other approaches to establish the meaning of the zeroindex and negative indices and to demonstrate the reasonableness of thedefinitions:
x0 = 1 and x–m = , where x > 0, m > 0
• translate numbers to index form (integral indices) and vice versa
• use indices expressed in expanded form to establish the index laws:
xa × xb = xa+b, xa ÷ xb = xa–b, (xa )m = xam
• use a calculator in a variety of ways to verify the index laws (integral indices).
ii) Applying the index laws
Learning experiences should provide students with the opportunity to:
• use the following results for positive and negative integral indicesxa × xb = xa+b , xa ÷ xb = xa–b , (xa)m = xam
• apply these generalisations to numerical expressions
• use index laws to define fractional indices for square and cube roots (eg since,
for x positive, = x, and since , )
• use a calculator in a variety of ways to verify the index laws (fractional indicesfor square and cube roots)
• solve numerical problems involving indices.
x3 = x1
3x3( )3= xx = x
1
2x( )2
1xm
82
Mathematics Years 9–10 Syllabus — Intermediate Course
9 6 2 0 0 I n t M a t h s 9 - 1 0 p t 1 1 0 / 9 / 9 6 4 : 2 0 P M P a g
N3: Indices
Applications, suggested activities and sample questions
i) Index notation
Students could:
◊ write numbers such as the following in expanded form: 23, (–4)2, 105, 3 × 24,
◊ use patterns with indices such as 34, 33, 32, 31, 30 to illustrate the zero index
◊ consider patterns like 54, 53, 52, 51, 50, 5–1, 5–2 to illustrate the use of the negativeindex, and to write terms with negative indices as fractions
◊ explain why 32 × 34 ≠ 96
◊ consider a series of statements about indices, deciding which are true or false, eg
1024 = 210, 8 = 24, 3–2 = , 4–1 = , 2(3)–1 = , –28 = (–2)8
◊ decide whether statements like 2–1 > 1, 1 < 3–1 are true or false
◊ explain the difference between 2 × 32, (2 × 3)2 and 22 × 3
◊ evaluate 2 × 3–1, 4 × 32 etc and pay attention to the number to which the indexrelates
◊ write expressions like 23 × 24, 56 ÷ 54 and (26)3 in expanded form and henceexpress the result in index form
◊ use a calculator to evaluate questions involving indices like 47 × 43, 34 × 3–2, 86 ÷ 89,(43)4 and compare the results obtained with those obtained by using the index laws.
ii) Applying the index laws
Students could:
◊ find pairs of terms, expressed in index form, which can be multiplied or dividedto give 27, 70, 34, etc
◊ simplify expressions like: , , (3 × 22)4,
◊ write , asexpressions with fractional indices
◊ find the value of
◊ consider problems such as the historical puzzle on grains of rice: ‘One grain ofrice is placed on the first square of the chessboard, 2 on the second, 4 on thethird etc. How many grains will be on the last square?’
41
3 × 41
3 × 41
3
535
104 × 10-2
(103)22–4 × 25
23
67
62 × 63
16
12
19
103
5
83
Intermediate Course — Core
9 6 2 0 0 I n t M a t h s 9 - 1 0 p t 1 1 0 / 9 / 9 6 4 : 2 0 P M P a g

N3: Indices
Content
iii) Scientific notation
Learning experiences should provide students with the opportunity to:
• express numbers in scientific notation
• enter and read scientific notation on the calculator
• use index laws to make order of magnitude checks for numbers in scientificnotation
• convert numbers expressed in scientific notation to ordinary form
• order numbers expressed in scientific notation
• solve problems involving numbers in scientific notation.
84
Mathematics Years 9–10 Syllabus — Intermediate Course
9 6 2 0 0 I n t M a t h s 9 - 1 0 p t 1 1 0 / 9 / 9 6 4 : 2 0 P M P a g

N3: Indices
Applications, suggested activities and sample questions
iii) Scientific notation
Students could:
◊ explain the difference between 2 × 10⁴ and 24, particularly with reference tocalculator displays
◊ express the distances from Earth to different stars in scientific notation andorder the numbers from smallest to largest
◊ recognise and interpret calculator displays in scientific notation
◊ investigate nanotechnology (the technology of very small machines where partsmay measure only a few micrometres), making comparisons between the size ofcomponents
◊ make a reasonable estimate for the thickness of paper, converting a decimalestimate to scientific notation
◊ answer questions like:a) have you lived for a million seconds?b) how long ago was a million minutes?c) order the following numbers from smallest to largest: 3.24 × 10³, 5.6 × 10⁻²,
6, 9.8 × 10⁻⁵, 1.2 × 10⁴, 2.043, 0.0034, 5.499 × 10²
◊ use the distance between the Sun and Earth to work out the time it takes light toreach Earth from the Sun. Compare this value with that for other stars.
85
Intermediate Course — Core
9 6 2 0 0 I n t M a t h s 9 - 1 0 p t 1 1 0 / 9 / 9 6 4 : 2 0 P M P a g

N4: Ratio and Rates
Content
i) Ratio
Learning experiences should provide students with the opportunity to:
• use a ratio to describe the relationship between two quantities which are directlyproportional
• simplify ratios
• divide a quantity into a given ratio
• use a ratio to calculate one quantity from another
• use the unitary method to solve ratio problems
• find a point which divides an interval in the ratio 1:1 (ie the midpoint of theinterval).
86
Mathematics Years 9–10 Syllabus — Intermediate Course
9 6 2 0 0 I n t M a t h s 9 - 1 0 p t 1 1 0 / 9 / 9 6 4 : 2 0 P M P a g

N4: Ratio and Rates
Applications, suggested activities and sample questions
i) Ratio
Students could:
◊ examine equivalence of 2:3, , 66.6%
◊ answer questions like:a) a mix for fixing the ridge-capping on a roof is given as 1 part cement to 5
parts sand and a half part of lime. What does this mean?b) a kilogram of seed is to be shared between two areas, one of 20 m2 and the
other 30 m2. How much seed will be needed for each area?c) the cost of fuel for a trip is $360 if the car averages 8.3 L/100 km. If the car
is carrying a heavy load, the average fuel consumption is 10.9 L/100 km.How much extra would fuel cost if the car does the same trip with a heavyload?
◊ find the scale factor (ratio) between an object and an image of it
◊ use a person’s height to estimate the scale of a photograph of the person
◊ convert a recipe for six people to a recipe for ten
◊ answer questions like: two partners invested in a business in the ratio 4:9. Thesmaller investment was $12 000. What was the other investment?
◊ find the point which divides the following intervals in the ratio 1:1i) (1,1) and (5,1) ii) (2,1) and (2,7) iii) (2,1) and (4,6)
◊ establish that the midpoint of an interval joining two points is found by takingthe average of the x values and the average of the y values
◊ find possible endpoints of an interval if the midpoint of the interval is (1,3).
23
87
Intermediate Course — Core
9 6 2 0 0 I n t M a t h s 9 - 1 0 p t 1 1 0 / 9 / 9 6 4 : 2 0 P M P a g

N4: Ratio and Rates
Content
ii) Rates
Learning experiences should provide students with the opportunity to:
• calculate rates in a variety of contexts, eg measurement, consumer arithmetic etc
• convert from one rate to another, eg from km/h to m/s
• use rates to solve problems
• draw and interpret travel graphs.
88
Mathematics Years 9–10 Syllabus — Intermediate Course
9 6 2 0 0 I n t M a t h s 9 - 1 0 p t 1 1 0 / 9 / 9 6 4 : 2 0 P M P a g

N4: Ratio and Rates
Applications, suggested activities and sample questions
ii) Rates
Students could:
◊ count the pulse and the number of breaths taken in 1 minute and calculate thenumber of heartbeats/breaths
◊ investigate the rate of population growth in different countries
◊ work out routine questions on price, speed, scale etc
◊ convert speeds in metres per second to kilometres per hour, nautical miles perminute to knots
◊ answer questions like:a) while in Hawaii, a holiday-maker purchases a surfboard for US$430. Use
exchange rates from a newspaper or teletext to calculate how much is paid inA$
b) find the speed in m/s and km/h for the Olympic record for the men’s orwomen’s 100m, and compare this figure to the speed for the 200m, 400m,800m, 3000m and marathon
c) if the reaction time for a driver is 1.2 seconds, how far will the car travel inthis time if its speed is 60 km/h?
◊ interpret travel graphs such as the one shown here.
89
Intermediate Course — Core
(km)d
t (hours)
9 6 2 0 0 I n t M a t h s 9 - 1 0 p t 1 1 0 / 9 / 9 6 4 : 2 0 P M P a g

Measurement
M1: Techniques and tools for measuringM2: Pythagoras’ theorem
M3: Perimeter, area and volumeM4: Trigonometry
Considerations
Students should develop an idea of the levels of accuracy that are appropriate to aparticular situation (eg a bridge may be measured in metres to estimate thequantity of paint required, but needs to be measured far more accurately forengineering work). For students to investigate and model their world they need tobe able to measure accurately, and to be aware of the importance of accuratemeasurements in this technological age (eg electronic timing for competition meansthat the measurements of competition swimming pools and running tracks need tobe very accurate).
Students should be familiar with the most commonly used units — metres,millimetres, centimetres, kilometres, litres, millilitres, kilolitres, cubic centimetres,cubic metres, grams, kilograms, tonnes, seconds, minutes, hours, days, weeks,months, years, square centimetres, square metres and hectares — and be able toconvert between measures of length, mass, time, area, volume and capacityautomatically. These skills are reviewed here. Students should develop somefamiliarity with the use of less common units of measurement such as millennium,nautical mile, micrometre, nanometre, megametre, gigabyte and light year, butwould not be expected to convert such units from memory. There are a number ofsituations where imperial units may still be used (eg altitude for planes). Whilestudents are not expected to remember the conversions, it might be useful in somespecial situations for students to convert from imperial to metric measurementswhen given the conversion factor, so that they might estimate the size of theimperial measures used.
Estimation is a very important skill for students. They should develop the ability tomake reasonable estimates for quantities using metric units. Estimation skills canbe developed through students estimating and then measuring the quantity.
90
Mathematics Years 9–10 Syllabus — Intermediate Course
9 6 2 0 0 I n t M a t h s 9 - 1 0 p t 1 1 0 / 9 / 9 6 4 : 2 0 P M P a g

Students have already covered perimeter, area and volume of basic shapes in Years7–8. This strand extends their knowledge and skills to more complex figures andassociated problems. While it is expected that students will be able to developformulae for the perimeter, area and volume of common shapes, some formulaecannot be easily derived. These formulae will be included in a list in any externalexamination and are included with the School Certificate ExaminationSpecifications for Mathematics from 1998. In this situation, students will need tochoose the appropriate formulae and apply them.
The time spent on Pythagoras’ theorem should be determined by the students’experience, confidence and competence with it. Students use Pythagoras’ theoremto find the distance between two points on the number plane. It is assumed thatstudents are competent in plotting points on the number plane.
Trigonometry in this course should be introduced through similar triangles, withstudents calculating the ratio of two sides and realising that this remains constantfor a given angle. It is important to emphasise the real-life applications oftrigonometry in building construction, surveying and navigation etc. Students musthave access to a scientific calculator and be aware of the approximate level ofaccuracy required. The standard convention for using bearings is three-figurebearings. They should have practical experience in using clinometers for findingangles of elevation and depression, and in using magnetic compasses for bearings.Students should be encouraged to set out their solutions carefully and to usecorrect mathematical language, working and suitable diagrams.
Trigonometry reinforces ratio, enlarged triangles, Pythagoras’ theorem and scaledrawing, and has wide applications to problems in a number of areas.
91
Intermediate Course — Core
9 6 2 0 0 I n t M a t h s 9 - 1 0 p t 1 1 0 / 9 / 9 6 4 : 2 0 P M P a g

M1: Techniques and Tools for Measuring
Content
i) Measuring
Learning experiences should provide students with the opportunity to:
• demonstrate understanding of the size of common standard units
• convert readily between common units
• select a unit which is appropriate for the purpose of the measurement
• read a variety of scales on standard measuring equipment with linear scales
• read a variety of scales on standard measuring equipment with non-linear scales(eg, dials)
• measure quantities using appropriate metric units
• demonstrate familiarity with less common units of measurement.
92
Mathematics Years 9–10 Syllabus — Intermediate Course
9 6 2 0 0 I n t M a t h s 9 - 1 0 p t 1 1 0 / 9 / 9 6 4 : 2 0 P M P a g

M1: Techniques and Tools for Measuring
Applications, suggested activities and sample questions
i) Measuring
Students could:
◊ develop a clear concept of the size of the main units (eg a metre is about halfthe height of a doorway, a centimetre is the size across the little finger, a largecar windscreen is around a square metre, a kilogram is two tubs (the usual size)of margarine, reasonable walking speed is 5 km/h)
◊ give examples of things that are about the size of: a metre, centimetre, amillimetre, a gram, a kilogram, a milligram, a litre, a millilitre
◊ recognise the meaning of prefixes such as kilo, milli, centi etc
◊ convert 1.23 m to other appropriate units
◊ decide on the most appropriate unit to use when measuring a variety of items,eg kilometres for the distance walked during a full day of bushwalking, andmetres for the distance covered in running once around an athletic field, ormilligrams to measure the amount of vitamins in a piece of fruit and grams tomeasure the mass of the fruit etc
◊ use measuring equipment (ruler, tape measure, trundle wheel, measuring jugscalibrated in millilitres and litres, balance beam, scales calibrated with 10 g, 100 g and 1 kg, digital clock and analog clock, protractor, clinometer,directional compass and theodolite) to increase their competence with practicalmeasuring
◊ investigate the use of meters such as electricity meter, fuel gauge, thermometer,scales, water meter and read a variety of scales
◊ make a measuring device to suit a particular purpose
◊ discuss the use of less common units such as millennium, nautical mile,micrometre, nanometre, megametre, megabyte, gigabyte, light year, anddescribe the context in which they are used
◊ convert less common units such as those above to more common units.
93
Intermediate Course — Core
9 6 2 0 0 I n t M a t h s 9 - 1 0 p t 1 1 0 / 9 / 9 6 4 : 2 0 P M P a g

M1: Techniques and Tools for Measuring
Content
ii) Time
Learning experiences should provide students with the opportunity to:
• interpret a range of timetables and timelines
• use calculators for time calculations, by using the degrees, minutes, secondsbutton.
iii) Estimation
Learning experiences should provide students with the opportunity to:
• describe the limits of accuracy of measuring instruments and devise methods forextending these limits
• decide when it is more appropriate to estimate than to measure
• make reasonable estimates involving length, area, volume, angle, capacity,temperature, time
• recognise that all measurements are approximate.
94
Mathematics Years 9–10 Syllabus — Intermediate Course
9 6 2 0 0 I n t M a t h s 9 - 1 0 p t 1 1 0 / 9 / 9 6 4 : 2 0 P M P a g

M1: Techniques and Tools for Measuring
Applications, suggested activities and sample questions
ii) Time
Students could:
◊ use timetables to plan the most efficient journey to a given destination involvinga number of connections and modes of transport
◊ estimate distances by considering time taken to complete the distance
◊ explain the difference between 8.25 hours and 8 hours 25 minutes
◊ work out the difference between any two given times, eg between 1:32 am and10:19 pm on the same day
◊ answer questions like: If a car travels 25 km at an average speed of 55 km/h,how long (to the nearest minute) will the journey take?
iii) Estimation
Students could:
◊ consider how accurate measurements need to be in practical situations, eg whenestimating the length of a basketball court, a measurement in metres would beappropriate, but if marking out the court, measurements would need to be atleast to the nearest centimetre
◊ develop strategies for measuring lengths which are longer than the measuringequipment
◊ estimate lengths and improve estimations by measuring
◊ identify ways of improving estimations of quantities not easily measured, egfinding the height of the building by counting bricks
◊ estimate a variety of quantities, eg the amount of material needed to make askirt for a size 14, the amount of material needed to make a cylinder to hold ahalf kilo of coffee, the dimensions of the classroom, the relative area of a stateor country from a map of the country, walking/running speed in m/s and km/h,a car’s fuel consumption, crowd size
◊ discuss the accuracy of measurements and whether measurements can ever betruly accurate.
95
Intermediate Course — Core
9 6 2 0 0 I n t M a t h s 9 - 1 0 p t 1 1 0 / 9 / 9 6 4 : 2 0 P M P a g

M2: Pythagoras’ Theorem
Content
Learning experiences should provide students with the opportunity to:
• identify the hypotenuse in a right-angled triangle
• establish the relationship between the lengths of the sides of a right-angledtriangle in a practical way
• use Pythagoras’ theorem to find the length of the hypotenuse of a right-angledtriangle given the length of the two other sides
• use Pythagoras’ theorem to find the length of a side of a right-angled trianglegiven the length of the hypotenuse and another side
• use Pythagoras’ theorem to establish whether a triangle has a right angle
• use Pythagoras’ theorem to find the distance between two points on the numberplane
• use Pythagoras’ theorem to solve practical problems involving right-angledtriangles.
96
Mathematics Years 9–10 Syllabus — Intermediate Course
9 6 2 0 0 I n t M a t h s 9 - 1 0 p t 1 1 0 / 9 / 9 6 4 : 2 0 P M P a g

M2: Pythagoras’ Theorem
Applications, suggested activities and sample questions
Students could:
◊ point out the hypotenuse in right-angled triangles that are in a variety oforientations
◊ verify Pythagoras’ theorem by measuring the sides of right-angled triangles andcalculating
◊ draw squares on the sides of right-angled triangles and show that the sum of theareas of the squares on the two smaller sides equals the area of the square onthe largest side
◊ given the two smaller sides of a right-angled triangle, use Pythagoras’ theoremto find the length of the hypotenuse, egfind the value of x in the followingtriangles
◊ use knotted rope make a 3, 4, 5 triangle and show that it has a right angleopposite the longest side
◊ discuss how builders use Pythagoras’ theorem
◊ research the history of the development of Pythagoras’ theorem in othercultures
◊ research Pythagoras and write a short report about Pythagorean times
◊ find the distance between two points on a number plane, eg find the length ofthe line joining (1,4) to (–3,6)
◊ answer questions like:a) find the value of x given that the dimensions of the rectangle are length 5 cm
and width 2 cm
What dimension is not needed to work out x?
(continued)
97
Intermediate Course — Core
7cm
x5cm
x
6cm 8cm
xx
9 6 2 0 0 I n t M a t h s 9 - 1 0 p t 1 1 0 / 9 / 9 6 4 : 2 0 P M P a g

M2: Pythagoras’ Theorem
Content
98
Mathematics Years 9–10 Syllabus — Intermediate Course
9 6 2 0 0 I n t M a t h s 9 - 1 0 p t 1 1 0 / 9 / 9 6 4 : 2 0 P M P a g

M2: Pythagoras’ Theorem
Applications, suggested activities and sample questions (continued)
Students could:
◊ answer questions like:b) what are possible lengths of the other two sides of a right-angled triangle if
the hypotenuse isi) 10 ii)
◊ solve practical problems like: find the distanceabove the ground of a kite given the length ofthe string, the horizontal distance and thedistance between the person’s hand holdingthe string and the ground
◊ demonstrate that the length cm can be drawn using a right-angled isoscelestriangle, and place on a number line
◊ investigate the length of the sides of isoscelesright-angled triangles and the sides of equilateraltriangles which have been divided in half, eg:
◊ use the fact that the diagonals of the rhombus bisect each other at right anglesto enable them to apply Pythagoras’ theorem to problems, eg finding theperimeter of a rhombus given the diagonals.
22
10
99
Intermediate Course — Core
15m1.2m
h
30m
3cm
60°
1cm
2cm
9 6 2 0 0 I n t M a t h s 9 - 1 0 p t 1 1 0 / 9 / 9 6 4 : 2 0 P M P a g

M3: Perimeter, Area and Volume
Content
i) Perimeter
Learning experiences should provide students with the opportunity to:
• find the perimeter of polygons and circles
Circumference of a circle = πd (π × diameter)
• find the perimeter of composite figures involving triangles, quadrilaterals andcircles
• apply Pythagoras’ theorem and other perimeter results to solve problemsinvolving perimeter.
100
Mathematics Years 9–10 Syllabus — Intermediate Course
9 6 2 0 0 I n t M a t h s 9 - 1 0 p t 1 1 0 / 9 / 9 6 4 : 2 0 P M P a

M3: Perimeter, Area and Volume
Applications, suggested activities and sample questions
i) Perimeter
Students could:
◊ find the circumference of a circle with radius 4.2 cm
◊ investigate ways of finding the length of an arc and hence the perimeter of asector
◊ undertake an historical investigation of attempts to calculate π and experimentto produce estimates of π
◊ place π on a number line by rolling a coin along the number line which hasunits equal to the diameter of the coin
◊ find the perimeter of figures like those below (the curved shape is a semi-circle)
i)
◊ calculate the minimum length of a straw for a drink packed in a container in theshape of a rectangular prism
◊ find the perimeter of a rhombus given the diagonals.
101
Intermediate Course — Core
(All angles are right angles)9cm 5cm 3cm
12cm
5cm
8cm
4cm
ii)
9 6 2 0 0 I n t M a t h s 9 - 1 0 p t 1 1 0 / 9 / 9 6 4 : 2 0 P M P a

M3: Perimeter, Area and Volume
Content
ii) Area
Learning experiences should provide students with the opportunity to:
• explain the relationship between units of length (eg cm) and units of area (cm2)
• establish and justify formulae for finding the area of triangles, quadrilaterals(including area of a square, rectangle, parallelogram, rhombus, trapezium) andcircles
Area of a circle = πr2
• find the areas of composite figures involving triangles, quadrilaterals and circlesby dissections of composite shapes into several simpler shapes.
102
Mathematics Years 9–10 Syllabus — Intermediate Course
9 6 2 0 0 I n t M a t h s 9 - 1 0 p t 1 1 0 / 9 / 9 6 4 : 2 0 P M P a

M3: Perimeter, Area and Volume
Applications, suggested activities and sample questions
ii) Area
Students could:
◊ explain the need for ‘units2’ in the measurement of area
◊ demonstrate appreciation of the size of a square metre and hectare bymeasuring if necessary
◊ draw a variety of triangles with an area of 12 cm2
◊ use dissections and/or transformations to find the formula for the area of aparallelogram, trapezium or rhombus
◊ establish the formula for the area of a trapezium by dividing it into triangles
◊ find the area of a kite given the lengths of its diagonals
◊ verify the formula for the area of a circle by dividing a circle into small sectors
◊ find the area of the sector of the circle in the diagram
◊ when calculating the areas of thesefigures, identify and discuss anyunnecessary information
◊ for a variety of quadrilaterals, describe which measurements would be neededin order to find their areas
◊ find the area of an annulus enclosed by two circles of diameters 8 cm and 10 cm
◊ find the area of composite figures such as those in the Perimeter section
◊ undertake an investigation relating to area, eg design a car-park to hold x cars
◊ answer questions like the following:a) do rectangles with the same perimeter have the same area?b) do parallelograms with the same perimeter have the same area?c) the dimensions of a room are 3500 mm by 4200 mm and the height of the
room is 2200 mm. If the combined area of the door and windows is 5.5square metres, calculate the amount of paint needed to paint the room if 1litre of paint will cover 12 square metres of wall.
103
Intermediate Course — Core
60°
3 10 67
4 8
510
9 6 2 0 0 I n t M a t h s 9 - 1 0 p t 1 1 0 / 9 / 9 6 4 : 2 0 P M P a
M3: Perimeter, Area and Volume
Content
iii) Surface area
Learning experiences should provide students with the opportunity to:
• devise and use methods for finding the surface area of right prisms
• use formulae to find the surface area of right cylinders:
Surface area of a cylinder = 2πr2 + 2πrh.
iv) Volume
Learning experiences should provide students with the opportunity to:
• explain the relationship between units of length (eg cm) and units of volume (cm3)
• use the relationship between litres and other measures of volume (cm3 and m3)
• apply Pythagoras’ theorem to solve problems involving the volume of solidshapes
• use formulae to find the volume of right prisms and cylinders:
Volume = Ah
• use formulae to find the volume of right pyramids, cones and spheres:
Volume of a pyramid or a cone = Ah
Volume of a sphere = πr3
• dissect composite shapes into several simpler shapes so that volume can becalculated.
43
13
104
Mathematics Years 9–10 Syllabus — Intermediate Course
9 6 2 0 0 I n t M a t h s 9 - 1 0 p t 1 1 0 / 9 / 9 6 4 : 2 0 P M P a

105
Intermediate Course — Core
M3: Perimeter, Area and Volume
Applications, suggested activities and sample questions
iii) Surface area
Students could:
◊ investigate a variety of solid shapes and, using their knowledge of area, decidewhich solids they can find the surface area of, and work out the surface area ofthese solids
◊ find the surface area of a toilet roll by cutting it into a rectangle or a parallelogram
◊ find the surface area of a variety of cylindrical containers
◊ given a surface area of 3200 cm2, design the best container and describe why itis the ‘best’
◊ investigate why some Kit Kats are wrapped ‘on an angle’.
iv) Volume
Students could:
◊ demonstrate appreciation of the size of a cubic metre by building if necessary
◊ discuss the need for ‘units 3’ when measuring volume
◊ investigate the possible dimensions for a container to hold a litre of milk or akilolitre of water
◊ measure the volume of solids, both regular and irregular, by displacement of water
◊ calculate the volume of a variety of prisms, cylinders, cones, spheres andcomposite solids
◊ answer questions like:
a) if the volume of a prism is 5400 cm3, what might the dimensions be?
b) how many cubic metres of concrete would be needed to lay a slab 3000 mmby 4000 mm and 60 mm thick?
c) a tap was left dripping overnight. Find the amount of water wasted andinvestigate the drip rate and volume of the drops
d) a manufacturer wants to make a carton in the shape of a rectangular prism tohold 1000 mL of juice. They wish to use the minimum amount of materialfor the carton. Investigate the possible dimensions of the carton that will fitthese constraints. If you were the manufacturer, which carton would youchoose? Explain your choice.
(continued)
9 6 2 0 0 I n t M a t h s 9 - 1 0 p t 1 1 0 / 9 / 9 6 4 : 2 0 P M P a

M4: Trigonometry
Content
i) Right-angled triangles and trigonometry
Learning experiences should provide students with the opportunity to:
• identify the hypotenuse, adjacent side and opposite side in right-angled triangles
• demonstrate understanding that the ratio of matching sides in right-angledtriangles (such as opposite to adjacent) is constant for equal angles
• define the sine, cosine and tangent ratios for angles in right-angled triangles
• use calculators to find trigonometric ratios of angles
• use calculators to find angles given trigonometric ratios (angles to be measuredin degrees and minutes and in decimal degrees)
• use sine, cosine and tangent ratios to find the unknown sides in right-angledtriangles
• use sine, cosine and tangent ratios to find unknown angles in right-angledtriangles (angles to be measured in degrees and minutes or decimal degrees).
106
Mathematics Years 9–10 Syllabus — Intermediate Course
9 6 2 0 0 I n t M a t h s 9 - 1 0 p t 1 1 0 / 9 / 9 6 4 : 2 0 P M P a

M4: Trigonometry
Applications, suggested activities and sample questions
iv) Volume (continued)
Students could:
◊ find the volume of composite figures such as those shown.
i) Right-angled triangles and trigonometry
Students could:
◊ investigate the ratios of the sides of similarright-angled triangles, eg explore the pair oftriangles in the diagram, making statementsabout the ratios of matching sides
◊ find the value of the sine, cosine and tangent ratios for angles in right-angledtriangles
◊ use calculators to find cos 25°, tan 72.57°, sin 63°5' etc
◊ relate the tangent ratio to slope, eg for a water ski jump where the horizontaldistance is 8 m and the vertical rise is 3 m
◊ answer questions relating to right-angled triangles like: given cos A = 0.5, findthe size of angle A; given tan B = 1.8, find the size of angle B to the nearestminute
◊ find out everything they can about a right-angledtriangle like the one in the diagram.
107
Intermediate Course — Core
3cm3m7m 10cm
8cm5.2m
1.4m
3cm
1cm
62° 62°
43°
35m
9 6 2 0 0 I n t M a t h s 9 - 1 0 p t 1 1 0 / 9 / 9 6 4 : 2 0 P M P a

M4: Trigonometry
Content
ii) Applications of trigonometry
Learning experiences should provide students with the opportunity to:
• find three-figure bearings of points measured from north
• solve simple problems involving three-figure bearings
• solve problems involving angles of elevation and depression.
108
Mathematics Years 9–10 Syllabus — Intermediate Course
9 6 2 0 0 I n t M a t h s 9 - 1 0 p t 1 1 0 / 9 / 9 6 4 : 2 0 P M P a

109
Intermediate Course — Core
M4: Trigonometry
Applications, suggested activities and sample questions
ii) Applications of trigonometry
Students could:
◊ match a series of right-angled triangles to a set of written problems
◊ decide which trigonometric ratio is needed for a particular problem
◊ solve problems like: an escalator at an airportslopes at an angle of 30° and is 20 m long.Through what height would a person belifted when travelling on the escalator?
◊ investigate the lengths of the sides of thetriangles illustrated
◊ write a problem to go with a particular diagram and test the problem onanother student to see if they draw an equivalent diagram
◊ use a directional compass to obtain three-figure bearings for objects from a setpoint in their playground
◊ work with bearings, interpreting directions like 035°, 158°, 315°, drawingdiagrams from word problems and finding lengths of unknown sides in theright-angled triangles which result
◊ answer questions like: an aircraft leaves Sydney and flies 400 km on a bearingof 135°. How far south of Sydney is the plane at this time?
◊ use a clinometer to read angles of elevation and depression and find the heightsof buildings, trees etc in their school environment
◊ answer questions like: a ski slope falls120 m over a 420 m run. What is theangle of depression from the top of theslope?
20m
30°
60°45°
30°
120m420m
9 6 2 0 0 I n t M a t h s 9 - 1 0 p t 1 1 0 / 9 / 9 6 4 : 2 0 P M P a

110
Mathematics Years 9–10 Syllabus — Intermediate Course
Chance and data
CD1: Collecting and organising dataCD 2: Summarising and interpreting data
CD 3: Chance
Considerations
Within this strand, students should carry out one investigation (individually or in agroup) in which they experience the main aspects and methods of planning,organising, analysing and evaluating data. There are many suggestions for statisticalinvestigations included in the accompanying support document. When differentgroups in a class are working on different investigations, the varied questions anddata sets that arise will promote consideration of a range of different strategies foranalysing the data and drawing conclusions — strategies that are appropriate for theparticular investigations and data sets.
Many of the aspects of Collecting and organising data could be discussed as part ofthe process of student investigation. However, there are specific aspects ofdisplaying and summarising data, eg stem-and-leaf plots, which would need to betaught before students begin their investigations. While grouping of data would beneeded where investigations involve continuous data, it is not intended thatstudents spend a lot of time looking at the effect of different groupings on the shapeof the data display. Students should be given guidance on the groupings to be used.
Students should be aware of the extensive use of statistics in society. Newspapersand magazines are very useful sources and students should be able to access,interpret and criticise the use of data. They should have experience in using toolssuch as spreadsheets or statistical software packages to organise, display andanalyse their data.
It is assumed from the Mathematics K–6 and 7–8 courses that students are able touse and interpret histograms, frequency polygons, sector graphs, picture graphs,bar graphs and column graphs. The drawing of these graphs is not repeated here;however students may need to use and interpret these graphs as appropriate totheir investigation.
The scope of this course does not extend to inferential statistics. References tosamples and to drawing conclusions from sample data are included so that theseaspects will be discussed informally.
9 6 2 0 0 I n t M a t h s 9 - 1 0 p t 2 1 0 / 9 / 9 6 4 : 2 5 P M P a

The support document accompanying this syllabus includes further information onthis strand, particularly the statistical investigation and methods of displaying data,such as stem-and-leaf plots. It will be helpful to refer to this document inconjunction with the syllabus.
Students’ degree of experience with chance will vary. It is important here,especially for teachers, to consider such differences when deciding upon thestarting point for chance.
Experiments in probability provide students with the opportunity to gain aninformal notion of probability and the language of probability through experience,before moving on to theoretical probability. The use of experiments also provides alink to the data analysis in this strand. By exploring games and activities involvingchance, using computers and calculators for counting, random number generationand simulation where appropriate, students should develop the idea of outcomes ofexperiments and the notion of equally likely outcomes. For experiments having afinite number n of equally likely, mutually exclusive outcomes, the probability P (A )of a single event A is given by P (A ) = . number of outcomes that produce A
n
111
Intermediate Course — Core
9 6 2 0 0 I n t M a t h s 9 - 1 0 p t 2 1 0 / 9 / 9 6 4 : 2 5 P M P a

CD 1: Collecting and Organising Data
Content
i) Defining the question
Learning experiences should provide students with the opportunity to:
• formulate key questions for a problem of general interest in order to investigateissues that can be answered by the collection, organisation, display and analysisof data
• refine the key questions (if necessary).
ii) Designing the investigation
Learning experiences should provide students with the opportunity to:
• distinguish between a sample and the population, recognising the differencebetween sampling and taking a census
• design a simple questionnaire to answer key questions, trial and improve it tohelp collect appropriate data or present a plan for an experiment that involvesmeasurements, including making comparative trials
• consider the suitability of sampling as a procedure for their investigation
• plan how data will be recorded.
iii) Collecting data
Learning experiences should provide students with the opportunity to:
• collect data from a variety of sources
• ensure that data are collected as consistently and fairly as possible
• recognise that collecting data from an atypical group may result in data whichare non-representative of the general population.
112
Mathematics Years 9–10 Syllabus — Intermediate Course
9 6 2 0 0 I n t M a t h s 9 - 1 0 p t 2 1 0 / 9 / 9 6 4 : 2 5 P M P a

113
Intermediate Course — Core
CD 1: Collecting and Organising Data
Applications, suggested activities and sample questions
i) Defining the question
Students could:◊ talk about statistical situations they have experienced◊ decide upon the problem to be investigated and make clear statements on
specific questions to be answered◊ discuss what questions need to be asked in order to investigate the problem and
refine the statement of the problem if necessary.
ii) Designing the investigation
Students could:◊ discuss the difference between a census and a sample, and illustrate with
examples of where samples and census are used◊ consider different ways of presenting questions, eg open questions, yes/no
questions, tick-boxes, response scales of (say) 1 to 5◊ trial a few questions to test whether they are understood and serve the intended
purpose◊ investigate whether the wording of the questions encourages appropriate
responses (eg do they have more than one meaning, can they be answered via asingle response, do they encourage a particular response?)
◊ identify the target population to be investigated◊ discuss bias, representativeness of the sample chosen and other issues that may
affect the interpretation of the results◊ decide whether data will be recorded using an organised table or list, or using
some other method.
iii) Collecting data
Students could:◊ collect data for the problem that they are investigating◊ discuss factors that may affect the consistency of the data, including whether the
chosen group is representative, eg finding the average height of secondaryschool students by only obtaining data on the heights of Year 7 students
◊ explore some of the various methods of data collection and recording, orexplore sources of data, both historical and contemporary (eg census, tallysticks, sport and weather data, computer networks, church records, GuinnessBook of Records, ATSIC, Australian Bureau of Statistics).
9 6 2 0 0 I n t M a t h s 9 - 1 0 p t 2 1 0 / 9 / 9 6 4 : 2 5 P M P a

CD 1: Collecting and Organising Data
Content
iv) Organising and displaying data
Learning experiences should provide students with the opportunity to:
• check raw data for obvious and gross errors
• select and use an appropriate method to organise data, using grouped intervalswhere necessary
• organise data into frequency tables, using a format suitable for analysis and anyavailable tools
• organise data into cumulative frequency tables
• display data in:– dot plots– stem-and-leaf plots
• make sensible statements on the distinctive features of displays (outliers,clusters, general shape of data displays)
• choose appropriate techniques to display and summarise data.
114
Mathematics Years 9–10 Syllabus — Intermediate Course
9 6 2 0 0 I n t M a t h s 9 - 1 0 p t 2 1 0 / 9 / 9 6 4 : 2 5 P M P a

115
Intermediate Course — Core
CD 1: Collecting and Organising Data
Applications, suggested activities and sample questions
iv) Organising and displaying data
Students could:
◊ consider the raw data and identify any scores that cannot be valid and removethem from the data set, eg a score of 12 beats/minute as someone’s pulse rate
◊ with guidance, decide upon the most appropriate grouping for the organisationof a data set
◊ collaborate in planning how to organise measurement data to answer specificquestions
◊ having gathered data, use a scientific calculator, graphics calculator and/orspreadsheets, databases or other appropriate software to organise the data anddraw graphs
◊ identify any scores from the organised data that are very different from the maindata set and explain their inclusion
◊ make quickly produced dot plots in order to explore data initially
◊ display data in a stem-and-leaf plot after consideration of the appropriate stemfor the data
◊ recognise that outliers are scores which are a long way away from the maingroup of scores and identify any of these in sets of scores
◊ decide, from a stem-and-leaf plot, whether the scores are clustered together,whether the shape of the display indicates possible skewing of scores, or anyparticular tendency in the data
◊ decide on the most appropriate type(s) of display from a histogram, stem-and-leaf plot, polygon, or other type of graph
◊ change the type of display to see if a different impression is given of the shapeof the data display.
9 6 2 0 0 I n t M a t h s 9 - 1 0 p t 2 1 0 / 9 / 9 6 4 : 2 5 P M P a

CD 2: Summarising and Interpreting Data
Content
i) Measures of location and spread
Learning experiences should provide students with the opportunity to:
• find the mean ( ), mode, median and range of a set of scores
• describe the advantages of using different methods of summarising information(mean, mode and median)
• use stem-and-leaf plots to find the median
• use stem-and-leaf plots on the same scale to compare two sets of data.
x
116
Mathematics Years 9–10 Syllabus — Intermediate Course
9 6 2 0 0 I n t M a t h s 9 - 1 0 p t 2 1 0 / 9 / 9 6 4 : 2 5 P M P a

117
Intermediate Course — Core
CD 2: Summarising and Interpreting Data
Applications, suggested activities and sample questions
i) Measures of location and spread
Students could:
◊ order data and find the middle score (median) for a small set of scores, find themedian from a table
◊ estimate the median graphically for grouped data
◊ answer questions like: a) the mean of a set of five scores is 12. What might the scores have been?b) the range of a set of eight scores is 10 and the mode is 3. What could the
scores be?c) a small company pays the following annual salaries to its employees:
$120 000, $52 000, $36 000, $25 000 and $14 000. Find the mean andmedian of these salaries and discuss which is likely to provide a moreaccurate indication of most of the employees’ salaries
◊ compare the mean, mode and median of various sets of data and makedecisions about which is (or are) the most appropriate measure(s) to summarisethe information
◊ having gathered data, use a scientific calculator, graphics calculator and/orspreadsheets or other appropriate software to analyse the data and calculate theappropriate summary statistics
◊ consider two sets of data, such as heights of girls and boys in a particular year,and draw stem-and-leaf plots or double column graphs and bar graphs tocompare the data.
9 6 2 0 0 I n t M a t h s 9 - 1 0 p t 2 1 0 / 9 / 9 6 4 : 2 5 P M P a

CD 2: Summarising and Interpreting Data
Content
ii) Interpreting displays of data
Learning experiences should provide students with the opportunity to:
• interpret and report on a range of visual displays of data (eg dot plots;histograms; frequency polygons; sector, picture, bar and column graphs; stem-and-leaf plots, tables and diagrams), including using summary statistics(measures of location and spread)
• pay attention to the scales on the axes when interpreting graphs
• compare different representations of the same data and comment on theappropriateness and effectiveness of various displays
• identify and describe graphs of data that are misleading.
118
Mathematics Years 9–10 Syllabus — Intermediate Course
9 6 2 0 0 I n t M a t h s 9 - 1 0 p t 2 1 0 / 9 / 9 6 4 : 2 5 P M P a
CD 2: Summarising and Interpreting Data
Applications, suggested activities and sample questions
ii) Interpreting displays of data
Students could:◊ interpret a range of displays of data as found in the media◊ interpret information from lists of figures (eg about the comparative
achievement in mathematics by males and females, the length of fibres from thefleeces of two breeds of sheep)
◊ find displays of data where irregular scales are used on the axes and discuss theeffect of this on their impression of the data
◊ display data in at least two different ways and decide on the most appropriatedisplay
◊ make comparisons and judgements about information (eg 20% of students inYear 9 are taller than 160 cm but only 10% of students in Year 8 are taller than160 cm)
◊ decide, from a stem-and-leaf plot, whether the scores are clustered together,whether the shape of the display indicates possible skewing of scores, or anyparticular tendency in the data
◊ interpret stem-and-leaf plots and histograms, such as those below showing theheights of 30 Year 9 students, and compare the two displays
◊ identify the distinctive features of data as evident from graphs and summarystatistics, such as outliers, clusters of scores and the shape of the distribution, egfor the histograms below
◊ find examples of displays of data where the data has been misrepresented anddecide how to display the same data to give the right impression of the data.
f f f f
score score score score
f
123456
137 142 147 152 157Class centres (cm)
162 167 172 177
14151617
13
0 0 1 2 3 5 5 7 8 8 91 2 2 4 5 6 6 8 9 95 7 96
0 2 2 3 9
119
Intermediate Course — Core
9 6 2 0 0 I n t M a t h s 9 - 1 0 p t 2 1 0 / 9 / 9 6 4 : 2 5 P M P a

120
Mathematics Years 9–10 Syllabus — Intermediate Course
CD 2: Summarising and Interpreting Data
Content
iii) Evaluating results
Learning experiences should provide students with the opportunity to:
• find, interpret and criticise published statistical information from differentsources (eg media)
• evaluate statements that have been made about situations represented by a datadisplay
• interpret displays that show two sets of data and make comparisons
• draw informal conclusions based on sample data, appreciating that summarystatistics may vary from sample to sample
• report on their conclusions from their investigations.
9 6 2 0 0 I n t M a t h s 9 - 1 0 p t 2 1 0 / 9 / 9 6 4 : 2 5 P M P a

CD 2: Summarising and Interpreting Data
Applications, suggested activities and sample questions
iii) Evaluating results
Students could:
◊ interpret and evaluate data from their own surveys, drawing conclusions whichcan be justified
◊ consider other statistical investigations which look at similar problems (ifavailable), and discuss the effect of their samples on these results
◊ report orally and in writing on their investigations, discussing what wasinvestigated, how the investigation was planned and the data collected, thedisplay and analysis of the data, and the conclusions that can be drawn
◊ write a letter to the newspaper summarising the results of an investigation,suggesting the implications, and explaining and justifying conclusions.
121
Intermediate Course — Core
9 6 2 0 0 I n t M a t h s 9 - 1 0 p t 2 1 0 / 9 / 9 6 4 : 2 5 P M P a

CD 3: Chance
Content
i) Informal concept of chance
Learning experiences should provide students with the opportunity to:
• order simple events from least likely to most likely
• use language associated with chance events appropriately
• place informal expressions of chance on a scale of 0 to 1
• explain the meaning of a probability of 0, and 1 when there are finitely manypossible outcomes.
12
122
Mathematics Years 9–10 Syllabus — Intermediate Course
9 6 2 0 0 I n t M a t h s 9 - 1 0 p t 2 1 0 / 9 / 9 6 4 : 2 5 P M P a

123
Intermediate Course — Core
CD 3: Chance
Applications, suggested activities and sample questions
i) Informal concept of chance
Students could:
◊ draw up a list of events (eg rain, snow, trip overseas, holiday on 25 December,living over the age of 92, counting to a million in a minute) and define thechance of each event happening from a list of chance words such as certain,probable, impossible, not very likely etc
◊ investigate the use of chance language in the printed media. They could collectwords of chance and organise them from most likely to least likely and thenassign the words an associated probability between 0 and 1
◊ comment on statements of chance from newspapers or magazines
◊ by considering the texts of different authors, investigate the frequency ofcommon words like ‘a’ and ‘that’. Can this method distinguish between differentauthors?
◊ use the language of chance in statistical reports (eg it is more likely for a certainevent to occur than another event)
◊ describe events that would have a probability of 0.5, 0 and 1.
9 6 2 0 0 I n t M a t h s 9 - 1 0 p t 2 1 0 / 9 / 9 6 4 : 2 5 P M P a

CD 3: Chance
Content
ii) Simple experiments
Learning experiences should provide students with the opportunity to:
• define an experiment to investigate a situation involving chance where there ismore than one possible outcome
• list all possible outcomes
• repeat the experiment a number of times and record the outcomes
• estimate probabilities from experimental data using relative frequencies
• explain the effect on probability estimates as the number of trials increases
• assign probabilities to simple events by reasoning about equally likely outcomes.
124
Mathematics Years 9–10 Syllabus — Intermediate Course
9 6 2 0 0 I n t M a t h s 9 - 1 0 p t 2 1 0 / 9 / 9 6 4 : 2 5 P M P a

125
Intermediate Course — Core
CD 3: Chance
Applications, suggested activities and sample questions
ii) Simple experiments
Students could: ◊ investigate chance situations, eg throwing a die, tossing a coin, drawing a card
from a pack, spinning a wheel, tossing thumbtacks, drawing discs from a bag,matching names and pictures
◊ prepare an organised list of the sample space for the experiment ◊ estimate the relative frequency of an event by performing a series of trials and
recording the number of times the event occurs. They could use the result topredict the relative frequency of the event in the future, eg tossing a coin a largenumber of times and then using the observed proportion to predict heads in thefuture
◊ graph the results of a probability experiment, eg toss a coin 100 times and graphthe proportion of heads obtained in 10, 20, … 100 tosses of the coin, discussingany tendencies in the graph
◊ discuss the idea of randomness and decide whether all results are equally likelyfor an experiment, ie that each result has an equal chance of happening
◊ use random generators (coins, dice, cards) to develop the notion of equallylikely events and simulate probability situations
◊ make a spinner that has the two colours, red and blue, where the result will beblue 3 out of 5 times on average
◊ design a four-coloured circular spinner that would give one colour twice thechance of being chosen as any one of the other colours
◊ design a probability device to produce a specified relative frequency◊ use technology to generate random numbers and simulate probability
experiments◊ for randomly chosen local telephone numbers, decide what is the relative
frequency of numbers ending in 9◊ estimate the probability of an event by considering the relative frequency of
events◊ estimate, by sampling, the probability of drawing a red counter from a bag
containing an unknown number of red and green counters◊ discuss and decide whether outcomes of a list of experiments are equally likely,
eg spinning a tennis racquet to determine ‘rough’ or ‘smooth’ in order to start agame, selecting the winner of a lottery, choosing a job applicant for anemployment position from six people interviewed.
9 6 2 0 0 I n t M a t h s 9 - 1 0 p t 2 1 0 / 9 / 9 6 4 : 2 5 P M P a

CD 3: Chance
Content
iii) Probability
Learning experiences should provide students with the opportunity to:
• express probabilities using fractions, decimals and percentages
• use published data to assign probabilities to events
• solve simple probability problems
• describe complementary events
• solve simple probability problems by reasoning about complementary events
• describe the difference between relative frequency and theoretical probability ina simple experiment, eg rolling a die.
126
Mathematics Years 9–10 Syllabus — Intermediate Course
9 6 2 0 0 I n t M a t h s 9 - 1 0 p t 2 1 0 / 9 / 9 6 4 : 2 5 P M P a

127
Intermediate Course — Core
CD 3: Chance
Applications, suggested activities and sample questions
iii) Probability
Students could:
◊ find the probability of events such as drawing a black card from a deck ofplaying cards
◊ make up some probability questions for a particular situation, eg choosing aletter at random from the word MATHEMATICS. Students could swapquestions with another person in the group and, once the questions areanswered, discuss the solutions
◊ comment critically on statements involving probability, eg ‘Since there are 26letters in the English language, the probability that a person’s name starts withX is 1 in 26’, ‘Since traffic lights can be red, amber or green, the probability thata light is red is ’
◊ suggest complementary events for given events, eg what is the complementaryevent for getting an even number after rolling a die, or for drawing a red cardfrom a deck of playing cards?
◊ answer questions like: a) what is the chance of winning a prize in the $2 lottery?b) what is the chance of not winning any prize in the $2 lottery?c) what is the probability of obtaining at least a value of 5 when rolling a die?
◊ consider the assumptions made in comments like: 30% of the population isunemployed, so the probability of being unemployed is 0.3
◊ discuss the fairness of a chosen game of chance, considering the chances ofwinning or losing in the long term
◊ consider a game involving chance and answer questions on probability such asthe following:a) in a game where a six must be rolled on a die before starting the game, what
is the probability of starting, on the first roll of the die?b) in Scrabble, find the chances of drawing a Z from the tiles on the first draw.
13
9 6 2 0 0 I n t M a t h s 9 - 1 0 p t 2 1 0 / 9 / 9 6 4 : 2 5 P M P a

Algebra
A1: Generalising patterns and problem solvingA2: Algebraic statementsA3: Linear relationships
A4: Graphs
Considerations
Algebra is introduced and developed through patterns and problem solving. Thefirst section, A1, considers patterns and then general problems that the studentsshould be able to investigate using a range of strategies, and which can begeneralised symbolically. In this way, students see the need for algebra and moveon into investigating it further.
Algebra has strong links with all the other strands in this syllabus, particularly whensituations are to be generalised symbolically. Students need to be encouraged to usethe most efficient and appropriate technique from a range of strategies, and tointegrate their knowledge and skills from other strands, to solve problems. Theapproach continues that of the Mathematics 7–8 syllabus, ie algebra is developedthrough the use of patterns, where students continue a numerical or geometricpattern and generalise a rule, in words or symbols. This should emphasise forstudents that the pronumerals or ‘letters’ stand for numbers rather than items (eg acould stand for the number of apples but not the apples themselves). Each student’sknowledge of order of operations and basic number laws should be used to developskills and confidence in algebraic manipulation. The time spent on reviewing theYears 7–8 work should be determined by the level of competence of the class.
Graphing is a powerful tool that enables algebra to be visualised. The emphasisshould be on developing students’ intuitive knowledge of the shape of the graphsof different relationships (eg linear, parabolic and simple hyperbolic) and theirunderstanding of the effects on the graphs of making a change to the relationship(eg adding or subtracting a constant, multiplying by a constant). Students can usemathematical templates, computer graphing software or graphical calculators astools to help in graphing and comparing graphs of relationships. Spreadsheets areuseful tools for teaching algebra skills since formulae can easily be entered,variables changed and results given immediately.
Algebra with fractions should be confined to addition and subtraction of algebraicfractions with numerical denominators and monomial numerators, along withmultiplication and division of simple fractions. The examples given in theapplications of the A2 and A3 sections indicate the depth of treatment intended.
128
Mathematics Years 9–10 Syllabus — Intermediate Course
9 6 2 0 0 I n t M a t h s 9 - 1 0 p t 2 1 0 / 9 / 9 6 4 : 2 5 P M P a

The intention of this syllabus is that the introduction of indices occurs withnumbers initially (see N3). In this strand, students will extend their experience ofindices to questions involving pronumerals.
Formal treatment of equations should be introduced through practical problemsolving. Students should be able to write an equation to show a simple relationshipbetween pairs of numbers and choose from a number of methods to identifyunknown values in equations, such as guess, check and improve, analytic,‘backtracking’ (reverse flow charts) and ‘do the same thing to both sides’. Solutionsshould be set out clearly, logically and carefully, and students should be able toexplain their solutions. Students should be able to use the ‘=’ sign appropriately, ieusually only one equals sign per sentence when solving equations. They shouldcheck their solutions as a matter of course, and consider whether a solution makessense within the context of the question. Inequalities should be restricted to thelinear type.
The final section of A2, which requires solutions arising from substitution intoformulae, is probably best treated after students have completed some work onequations contained in the section on Linear relationships.
Some students assume that any expression (eg 3 – 2(a + 5)) must equal zero, andget into the habit of solving this ‘equation’. The difference between an expressionand an equation should be emphasised.
129
Intermediate Course — Core
9 6 2 0 0 I n t M a t h s 9 - 1 0 p t 2 1 0 / 9 / 9 6 4 : 2 5 P M P a

130
Mathematics Years 9–10 Syllabus — Intermediate Course
A1: Generalising Patterns and Problem Solving
Content
i) Generalising patterns
Learning experiences should provide students with the opportunity to:
• identify patterns in number sequences and extend the patterns
• explain and describe patterns using appropriate language
• replace written sentences describing patterns with algebraic expressions
• construct rules to describe simple patterns using symbols
• extend a pattern by substituting into a rule in words or symbols.
9 6 2 0 0 I n t M a t h s 9 - 1 0 p t 2 1 0 / 9 / 9 6 4 : 2 5 P M P a

A1: Generalising Patterns and Problem Solving
Applications, suggested activities and sample questions
i) Generalising patterns
Students could:
◊ extend number sequences such as 2, 4, 6, …; 3, 5, 7, …; or 1, 4, 9, …, describethe pattern in words and write a rule to describe how the next value in thesequence is found. They could use these rules to find the 10th, 20th and 40thnumber
◊ extend a geometric pattern such as the oneillustrated and explain in their own wordshow to calculate the number of matchsticks needed to make a particularnumber of squares. The rule could be described in words and symbols
◊ verify generalisations for number patterns and extend the number patterns bysubstituting into the rule, for example:
–4, –3, –2, … can be expressed as n – 5, for n = 1, 2, …
3, 6, 9, … can be expressed as 3n, for n = 1, 2, …
9, 8, 7, … can be expressed as 10 – n, for n = 1, 2, …
5, 8, 11, … can be expressed as 3n + 2, for n = 1, 2, …
1, 4, 9, … can be expressed as n2 for n = 1, 2, …
◊ extend the pattern and generalise the following:
20, 19, 18, …
1000, 990, 980, …
–1, 1, 3, 5
◊ answer questions like: the number of matchsticks needed to build a particularpattern is given by the rule N = 2z + 1, where N is the number of matchsticksand z is the number of triangles. Write this rule in your own words and drawthe pattern. How many matchsticks would be needed to build eight triangles? Ifthere were 99 matchsticks, how many triangles would there be?
131
Intermediate Course — Core
9 6 2 0 0 I n t M a t h s 9 - 1 0 p t 2 1 0 / 9 / 9 6 4 : 2 5 P M P a

132
Mathematics Years 9–10 Syllabus — Intermediate Course
A1: Generalising Patterns and Problem Solving
Content
ii) Generalising solutions to problems
Learning experiences should provide students with the opportunity to:
• try a number of strategies to solve unfamiliar problems such as:
– using a table– drawing a diagram– looking for patterns– working backwards– simplifying a problem– trial and error
• solve non-routine problems by generalising the solution symbolically
• report on the process of obtaining a solution (oral and written), including detailsabout interpreting the problem, the plan, how the generalisation was developedand the result checked
• compare and contrast different methods of solution.
9 6 2 0 0 I n t M a t h s 9 - 1 0 p t 2 1 0 / 9 / 9 6 4 : 2 5 P M P a

133
Intermediate Course — Core
A1: Generalising Patterns and Problem Solving
Applications, suggested activities and sample questions
i) Generalising patterns
Students could:
◊ look for patterns in Pascal’s Triangle in rows and diagonals of the triangle andgeneralise the results
◊ investigate problems like the following and generalise the solutions:– the number of squares on a chessboard– the angle sum of a polygon– the number of handshakes needed so that everybody shakes hands with
everybody else– the number of additional creases made with each additional fold when
folding a strip of paper once, twice, three times etc.
9 6 2 0 0 I n t M a t h s 9 - 1 0 p t 2 1 0 / 9 / 9 6 4 : 2 5 P M P a

A2: Algebraic Statements
Content
i) Algebraic skills
Learning experiences should provide students with the opportunity to:
• use pronumerals to stand for numbers
• translate oral or written statements into algebraic statements and vice versa
• evaluate algebraic expressions by substitution
• represent equivalent algebraic expressions, including using concrete materials ordiagrams
• use simple algebraic conventions involving the four operations
• recognise like algebraic terms and collect like terms to simplify expressions
• remove grouping symbols and simplify the resulting expression
• identify common factors and hence factorise expressions.
134
Mathematics Years 9–10 Syllabus — Intermediate Course
9 6 2 0 0 I n t M a t h s 9 - 1 0 p t 2 1 0 / 9 / 9 6 4 : 2 5 P M P a

135
Intermediate Course — Core
A2: Algebraic Statements
Applications, suggested activities and sample questions
i) Algebraic skills
Students could:
◊ answer questions like: three matchboxes contain an unknown but equal numberof matchsticks. There are some additional loose matchsticks. Draw diagrams torepresent algebraic expressions such as the following: 3n + 4, 2n + 1, 2(n + 3),3(n + 1) – 2, where n is the number of matchsticks contained in each box
◊ write the following as algebraic expressions: 2 less than x, three times a numberless six, 5 more than twice n, 7 less than half a, 15 less than negative m, onethird of the product of x and 24
◊ write an algebraic expression for: think of a number, multiply it by two andthen add seven
◊ translate expressions like , [(3 × m ) + 4], 5 – 2a or 4 + into words
◊ work in pairs or small groups to explain expressions by using flowcharts, eg:
◊ make substitutions into algebraic expressions, eg if x = 3 and y = 7, find thevalue of 2x – y, 4xy, 3 + (x – y), , 3(4x + 3y)
◊ draw a diagram using rectangles and an array of dots to show equivalences suchas 3(n + 2) = 3n + 6
◊ verify that 9 × (3 + 7) = 9 × 3 + 9 × 7 = 90 and use this to remove the bracketsin 9 × (a + 7) or 9(a + 7)
◊ distinguish between 3(a + b) and 3a + b and explain the difference
◊ answer questions like: a rectangular garden has one side 3 metres longer thanthe other. Write two different expressions for the perimeter
(continued)
xy6
a3
b4
Input Intermediate step Output
3 4 × 3 (4 × 3) ÷ 3
6 4 × 6 (4 × 6) ÷ 3
2 4 × 2 etc× 4b 4b ÷ 3
4b3
9 6 2 0 0 I n t M a t h s 9 - 1 0 p t 2 1 0 / 9 / 9 6 4 : 2 5 P M P a
A2: Algebraic Statements
Content
ii) Indices with algebraic expressions
Indices are confined to integers.
Learning experiences should provide students with the opportunity to:
• apply the index lasw to expressions involving pronumerals
• simplify algebraic expressions that contain indices.
136
Mathematics Years 9–10 Syllabus — Intermediate Course
9 6 2 0 0 I n t M a t h s 9 - 1 0 p t 2 1 0 / 9 / 9 6 4 : 2 5 P M P a
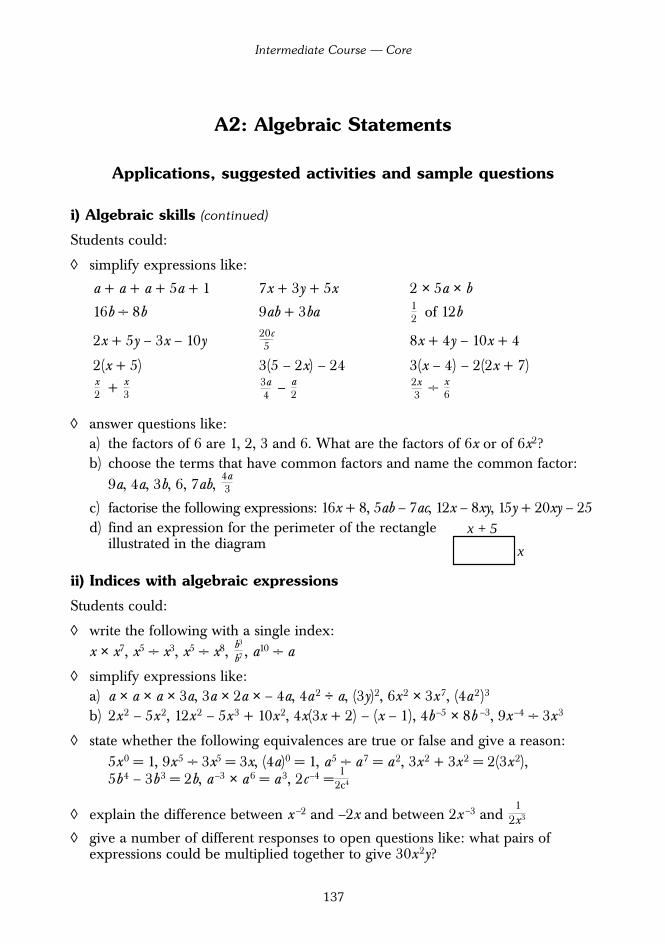
137
Intermediate Course — Core
A2: Algebraic Statements
Applications, suggested activities and sample questions
i) Algebraic skills (continued)
Students could:
◊ simplify expressions like:
a + a + a + 5a + 1 7x + 3y + 5x 2 × 5a × b
16b ÷ 8b 9ab + 3ba of 12b
2x + 5y – 3x – 10y 8x + 4y – 10x + 4
2(x + 5) 3(5 – 2x) – 24 3(x – 4) – 2(2x + 7)
+ – ÷
◊ answer questions like:a) the factors of 6 are 1, 2, 3 and 6. What are the factors of 6x or of 6x2?b) choose the terms that have common factors and name the common factor:
9a, 4a, 3b, 6, 7ab,
c) factorise the following expressions: 16x + 8, 5ab – 7ac, 12x – 8xy, 15y + 20xy – 25d) find an expression for the perimeter of the rectangle
illustrated in the diagram
ii) Indices with algebraic expressions
Students could:
◊ write the following with a single index:x × x7, x5 ÷ x3, x5 ÷ x8, , a10 ÷ a
◊ simplify expressions like:a) a × a × a × 3a, 3a × 2a × – 4a, 4a2 ÷ a, (3y)2, 6x2 × 3x7, (4a2)3
b) 2x2 – 5x2, 12x2 – 5x3 + 10x2, 4x(3x + 2) – (x – 1), 4b–5 × 8b –3, 9x–4 ÷ 3x3
◊ state whether the following equivalences are true or false and give a reason:5x0 = 1, 9x5 ÷ 3x5 = 3x, (4a)0 = 1, a5 ÷ a7 = a2, 3x2 + 3x2 = 2(3x2), 5b4 – 3b3 = 2b, a–3 × a6 = a3, 2c–4 =
◊ explain the difference between x –2 and –2x and between 2x –3 and
◊ give a number of different responses to open questions like: what pairs ofexpressions could be multiplied together to give 30x2y?
12x3
12c4
b3
b7
x + 5
x
4a3
x6
2x3
a2
3a4
x3
x2
20c5
12
9 6 2 0 0 I n t M a t h s 9 - 1 0 p t 2 1 0 / 9 / 9 6 4 : 2 5 P M P a

138
Mathematics Years 9–10 Syllabus — Intermediate Course
A2: Algebraic Statements
Content
iii) Formulae
Learning experiences should provide students with the opportunity to:
• solve equations arising from substitution into formulae.
9 6 2 0 0 I n t M a t h s 9 - 1 0 p t 2 1 0 / 9 / 9 6 4 : 2 5 P M P a

A2: Algebraic Statements
Applications, suggested activities and sample questions
iii) Formulae
Students could:
◊ solve the equations that result from substitution into formulae, eg:a) if A = L × W, find L if A = 150 and W = 20 b) if E = mv 2 and E = 64, m = 4, find v where v > 0
c) if A = πab, find A if a = 4 and b = 6; also find a if A = 75 and b = 6
◊ solve problems like:
a) a rectangular box has dimensions x, y and z. The distance D from the topcorner of the box to the opposite bottom corner is given by the formula D = . Find D for a box by measuring the dimensions of the box(eg a juice container)
b) the area of a circle can be found by using the formula A = . Use thisformula to find the area of a circle with diameter 12 cm and verify the resultby using the formula A = πr 2.
πd 2
4
x2 + y2 + z2
12
139
Intermediate Course — Core
9 6 2 0 0 I n t M a t h s 9 - 1 0 p t 2 1 0 / 9 / 9 6 4 : 2 5 P M P a

140
Mathematics Years 9–10 Syllabus — Intermediate Course
A3: Linear Relationships
Content
i) Relationships
Learning experiences should provide students with the opportunity to:
• generate linear relationships from problems and describe them using tables,graphs and symbols
• from the table of a linear relationship, describe the relationship in symbols.
ii) Equations
Learning experiences should provide students with the opportunity to:
• generate and solve linear equations that arise from linear relationships
• use algebraic expressions to write equations from a written description
• decide whether a suggested value is a solution to a linear equation bysubstitution
• use analytical methods to solve a range of linear equations, including equationsthat involve brackets and fractions (numerical denominators)
• check solutions, ensuring that the result makes sense in context
• solve problems involving linear equations.
9 6 2 0 0 I n t M a t h s 9 - 1 0 p t 2 1 0 / 9 / 9 6 4 : 2 5 P M P a

141
Intermediate Course — Core
A3: Linear Relationships
Applications, suggested activities and sample questions
i) Relationships
Students could:
◊ consider the pattern shown, then represent the relationship between the number ofcircles and the number of intersectionpoints in a table and in symbols. Graph the relationship
◊ express in symbols a linear relationship betweena and b that represents the numbers in the table.
ii) Equations
Students could: ◊ set up equations from real situations such as taxi fares, postage and telephone
rates◊ decide on an equation to match a series of pairs of related numbers◊ use guess, check and improve to solve equations◊ use backtracking (reverse flow charts) to solve equations like + 6 = 1◊ for the relationship c = 3a , find a when c = 15; if y = 2x + 5, find x when y = 11◊ solve linear equations of the type:
3a + 7 = 22 = 5 2(x + 5) = 9 3x – 1 = x + 5
= 4 + 5 = 7 + = 5 3(2a – 5) = 2a + 5
◊ write equations for word problems (such as ‘seven more than the number is doublethe number’ as n + 7 = 2n ; ‘the rectangle is twice as long as it is wide’ as l = 2w )
◊ solve word problems that result in equations like 2x – 3 = x + 7 or 3(x + 4) = 5(x – 3)◊ compare different ways of answering questions like: the solution to
3(x + 2) = x + 4 is x = –1. Change one term or sign in the initial equation sothat the answer will be x = 4
◊ answer questions like:a) the area of a triangle is 42 cm2 and the base length is 12 cm. What is the
height of the triangle?b) a student earns $5 for the first hour of babysitting and $4 for each hour after
that. Write an equation to represent this information. If he earns $29 for ababysitting job, for how many hours did he work?
2a3
a4
x3
x − 13
2x3
z − 32
a 0 1 2 3 4
b –1 2 5 8 11
9 6 2 0 0 I n t M a t h s 9 - 1 0 p t 2 1 0 / 9 / 9 6 4 : 2 5 P M P a

A3: Linear Relationships
Content
iii) Graphs of straight lines
Learning experiences should provide students with the opportunity to:
• set up a table of values for the relationship y = mx + b
• graph equations of the form y = mx + b
• define gradient as
• find the gradient of an interval using
• identify m and b in the equation of the line y = mx + b as the gradient and y- intercept
• use the graph of the straight line to find its gradient
• from the graph of a straight line, determine its equation in the form y = mx + b
• rearrange an equation in the form ax + by + c = 0 to the form y = mx + b
• solve linear simultaneous equations by finding the point of intersection of theirgraphs.
riserun
riserun
142
Mathematics Years 9–10 Syllabus — Intermediate Course
9 6 2 0 0 I n t M a t h s 9 - 1 0 p t 2 1 0 / 9 / 9 6 4 : 2 5 P M P a

143
Intermediate Course — Core
A3: Linear Relationships
Applications, suggested activities and sample questions
iii) Graphs of straight lines
Students could:
◊ construct tables of values and use coordinates to graph straight lines, eg y = x, y = 2x – 1, y = 3 – x, y = + 2, y = , y = 5, x = – 4
◊ describe how the gradient changes for different coefficients of x, using a varietyof lines such as those above
◊ relate b to the y-intercept for a variety of lines in the form y = mx + b
◊ find the gradient of a variety of lines from the graph of the line
◊ draw a line by using just the y-intercept and gradient
◊ explain the effect on a line of changing the gradient or y-intercept
◊ draw four lines with a gradient of 2 and write down the equations of these lines
◊ find the gradient of lines where the scales on the axes are different
◊ answer questions like:a) if x + 2y = 9, what are some possible values of x and y?b) draw the line through (1,3) and (–2,4) and find its equation. Does the point
(7,13) lie on the line? What is the y value when x = 2?
◊ match graphs with particular linear relationships by inspecting the constants, egfrom a set of given graphs, students could choose graphs to match the followingrelationships: y = x, y = 2x, y = 2x + 3, y = x + 3, y = 3 – x
◊ rewrite the equation 3x + 2y = 6 in the form y = mx + b. What is the gradientand y-intercept of this line?
◊ consider questions like: graph y = 2x + 1 and y = x + 3. Find the point ofintersection of the graphs, and check your answer by substitution
◊ use graphics calculators or graphing software packages to plot pairs of lines andread off the point of intersection.
3x - 52
2x3
9 6 2 0 0 I n t M a t h s 9 - 1 0 p t 2 1 0 / 9 / 9 6 4 : 2 5 P M P a

A3: Linear Relationships
Content
iv) Inequalities
Learning experiences should provide students with the opportunity to:
• use <, >, ≥, ≤, ≠ to generate linear inequalities from problems
• find a range of values that satisfy inequalities using strategies such as guess andcheck
• solve linear inequalities analytically, including changing the direction of theinequality when multiplying or dividing by a negative number
• graph the solution to linear inequalities on a number line
• solve problems involving inequalities (in one variable).
144
Mathematics Years 9–10 Syllabus — Intermediate Course
9 6 2 0 0 I n t M a t h s 9 - 1 0 p t 2 1 0 / 9 / 9 6 4 : 2 5 P M P a

145
Intermediate Course — Core
A3: Linear Relationships
Applications, suggested activities and sample questions
iv) Inequalities
Students could:
◊ list five possible values that would satisfy the statements below:x < 11 x ≥ 17 9 ≤ x < 11
◊ write in symbols statements like: ‘a box measures at least 15 cm but no morethan 17 cm’, ‘3 times a number is always smaller than 8’, ‘4 less than twice anumber is greater than 9’
◊ find solutions to 8 + 3x ≤ 4 by guess and check methods, and discuss thenumber of possible solutions
◊ decide what values x can have in the following situations: 4x + 8 = 72, 4x + 8 < 72,4x + 8 > 72 and graph each solution on separate number lines
◊ solve inequalities such as 5 + x < 3 and graph solutions on the number line
◊ beginning with number inequalities (eg 3 < 5), establish the need to reverse thedirection of the inequality when multiplying by a negative number
◊ solve inequalities like the following and graph their solutions on the numberline: 2x – 7 > 10, 2a – 5 < a + 3, – 4y ≤ 6, 5 – 7c > 3.
9 6 2 0 0 I n t M a t h s 9 - 1 0 p t 2 1 0 / 9 / 9 6 4 : 2 5 P M P a

146
Mathematics Years 9–10 Syllabus — Intermediate Course
A4: Graphs
Content
i) Everyday graphs
Learning experiences should provide students with the opportunity to:
• sketch informal graphs to model familiar events, eg noise level within theclassroom during the lesson
• ‘tell the story’ shown by a graph by describing how one quantity varies with theother
• use the relative position of two points on a graph, rather than a detailed scale, tointerpret information
• choose appropriate scales on the vertical and horizontal axes when drawinggraphs
• compare graphs of the same simple situation, decide which one is the mostappropriate and explain why.
ii) Parabolas
Learning experiences should provide students with the opportunity to:
• generate simple quadratic relationships from problems and describe them usingtables, graphs and symbols
• graph equations of the form y = ax2 and describe the effect on the graph ofdifferent values of a
• graph equations of the form y = ax2 + c and describe the effect on the graph ofdifferent values of the constant c.
9 6 2 0 0 I n t M a t h s 9 - 1 0 p t 2 1 0 / 9 / 9 6 4 : 2 5 P M P a

147
Intermediate Course — Core
A4: Graphs
Applications, suggested activities and sample questions
i) Everyday graphs
Students could:◊ draw qualitative graphs of mood swings during a grand final football or netball
match from different points of view◊ consider the depth of water in various shaped tanks that are being filled at a
constant rate, then write a story and sketch the graph of the situation (this mightbe done by experimentation)
◊ consider questions like:a) the graph shows the hours of sleep and ages of four
students. Who is the oldest? Who is the youngest? Whogets the most sleep? Who gets the least sleep? Whichchildren get the same amount of sleep?
b) a child climbs a mountain at a steady speed and then starts to run down themountain. Choose the graph which matches this situation from the graphs below.
ii) Parabolas
Students could:
◊ investigate the possible dimensions of a rectangle if the perimeter remains fixed at18 cm. Draw up a table for length v area and graph the results. Describe the graph
◊ find an equation which describes y in terms ofx for the table of values and graph theequation
◊ using a graphics calculator or by plotting points, sketch y = x 2, y = x 2, y = 2x 2
and y = –x 2. They could compare each of the graphs and describewhat effect the constant has on the shape of the graph
◊ Consider questions like:using a graphics calculator or otherwise (eg a template), graph y = x 2. Write downas many things as you can about this graph. Graph y = x 2 + 1, y = x 2 + 2, y = x 2 – 1,and describe these graphs. Predict the equation of the graph which looks thesame but passes through (0,–2). Test the equation by substituting some pointsfrom the graph into the equation.
12
Age
Hours of sleep
AC
B
D
x 0 1 2 3 4 5
y 1 2 5 10 17 26
Speed
Time
Speed
Time
Speed
Time
Speed
Time
9 6 2 0 0 I n t M a t h s 9 - 1 0 p t 2 1 0 / 9 / 9 6 4 : 2 5 P M P a

A4: Graphs
Content
iii) Hyperbolas
Learning experiences should provide students with the opportunity to:
• generate relationships which involve reciprocity from problems
• describe relationships of the form y = (k positive), using tables and graphs.
iv) Graphs
Learning experiences should provide students with the opportunity to:
• identify graphs of straight lines, parabolas and hyperbolas
• match graphs of straight lines, parabolas and hyperbolas to the appropriateequations.
kx
148
Mathematics Years 9–10 Syllabus — Intermediate Course
9 6 2 0 0 I n t M a t h s 9 - 1 0 p t 2 1 0 / 9 / 9 6 4 : 2 5 P M P a

149
Intermediate Course — Core
A4: Graphs
Applications, suggested activities and sample questions
iii) Hyperbolas
Students could:
◊ investigate the relationship between speed and time for a constant distance of 100 km. They could set up and fill in a table for time vs speed. They could thendraw a graph and predict the equation
◊ investigate the possible dimensions of a backyard, given that the area is 200 m2
(drawing up a table of values for length v width, graphing the relationship,describing the relationship in symbols and words)
◊ graph y = , y = and y = and consider what happens to the y value as x getsvery large and what happens to the y value as x gets closer to zero.
iv) Graphs
Students could:
◊ classify the following equations as linear, quadratic or reciprocal, and describe theshape of their graphs: y = 3 – x, y = 3x, y = and y = x 2
◊ match graphs to the appropriate equations for the curves, eg match the followingequations to the graphs below: y = x 2 , y = 8, y = 2 – x, y = , y = x.1
x
2x
16x
4x
1x
y
x x
(2,2)
y
2
x2
(1,1)
y
(2,8)
y
x
(1,1)y
x
9 6 2 0 0 I n t M a t h s 9 - 1 0 p t 2 1 0 / 9 / 9 6 4 : 2 5 P M P a

9 6 2 0 0 I n t M a t h s 9 - 1 0 p t 2 1 0 / 9 / 9 6 4 : 2 5 P M P a

151
Intermediate Course — Core
Mathematical Investigations
Considerations
Investigation and problem solving are integral to the whole of this course. Inaddition to the investigation that students undertake in the Chance and data strand,it is intended that students will undertake at least one longer investigation, whichmight take up to five hours. In doing such an investigation, students would use allthe processes of Working mathematically, ie investigating, conjecturing, solvingproblems, applying and verifying, communicating and working in context. Whilestudents are using these processes throughout this course, these processes areidentified here specifically, since the choice of investigation precludes theidentification of specific content from the strands.
Students should present a written and/or verbal report on their investigation thatwould outline its processes and stages. They should be encouraged to usetechnology as an investigative tool. Such an investigation could be undertakenduring the time when the core content is being taught, that is in conjunction with atopic or strand, or when the core content is complete. This would depend on thechoice of investigation — some investigations rely on knowledge, skills andunderstanding of a particular strand, while others require students to synthesisetheir knowledge, skills and understanding of a number of strands.
The list of investigations given here and in the support document providessuggested topics and is not exhaustive. It is intended to be a guide to the types ofinvestigations students might undertake, but students might choose other problemsto investigate. Other investigations mentioned under Applications, suggested activitiesand sample questions could be developed into in-depth investigations. Students couldalso undertake an investigation which relates to a section of the Option topics,especially for Fractals and Networks.
9 6 2 0 0 I n t M a t h s 9 - 1 0 p t 2 1 0 / 9 / 9 6 4 : 2 5 P M P a

152
Mathematics Years 9–10 Syllabus — Intermediate Course
Mathematical Investigations
Content
Learning experiences should provide students with the opportunity to:
• undertake a mathematical investigation
• give a report on the investigation, which will include the following:– a description of the problem– a description of any constraints and assumptions – an explanation of how any relevant technology was used– any relevant printouts or records– a description of any problems encountered– a description of any conclusions reached– a description of any possible extensions for further investigation.
9 6 2 0 0 I n t M a t h s 9 - 1 0 p t 2 1 0 / 9 / 9 6 4 : 2 5 P M P a

153
Intermediate Course — Core
Mathematical Investigations
Applications, suggested activities and sample questions
Students could:
◊ perform one of the following investigations:
a) a soft drink can will have a volume of 375 mL. Find the dimensions that willrequire the least amount of sheet metal to construct it. Comment on itssuitability for use.
b) the LOGO procedure to polystar :N :Prepeat :P [FD 80 RT :N * 360 / :P]end
can be used to draw regular star polygons. Investigate the stars produced forvarious values of ‘N’ and ‘P’. How would you produce a star (exclude regularpolygons) with any number of points? Test your hypothesis for a star with 53points. Can a star with six points (exclude a hexagon) be drawn using thismethod? Explain
c) write a set of procedures using a programming language such as LOGO toinvestigate Spirograms. You will need a number of inputs for distances andone for the angle. Can you determine a pattern that can be used to predictwhen a design will be closed (returning to the starting point) or open (doesnot return to the starting point)? Can you determine a pattern involving therepetition factor and the order (number of distances) of the Spirograms?
d) write LOGO procedures or use a spreadsheet to simulate the tossing of acoin or a die any number of times. You should be able to type TOSSCOIN1000, for example, to obtain the number of heads and tails from 1000 tossesof a coin. Investigate what happens for various numbers of tosses
e) you are presented with two empty bags and 16 marbles, eight white and eightred. You are to distribute the marbles in the bags in any way you choose. Theonly requirement is that every marble must be placed in a bag. Next you areblindfolded so that you can no longer see the bags or the marbles in them.You are to choose a bag at random, then, if possible, choose one marble atrandom from the chosen bag. If you select a white marble, you receive $100.If not, you win nothing. How would you distribute the marbles in the bags?
f) a tray is to be made by cutting squares from the corners of a rectangularpiece of metal and folding up the side pieces. For various sized rectangles,what size squares should be cut from the corners to give a maximum volumefor the tray? (Students could experiment by making trays out of cardboard,beginning with a rectangle with dimensions like 10 cm × 5 cm)
(continued)
9 6 2 0 0 I n t M a t h s 9 - 1 0 p t 2 1 0 / 9 / 9 6 4 : 2 6 P M P a
Mathematical Investigations
Content
154
Mathematics Years 9–10 Syllabus — Intermediate Course
9 6 2 0 0 I n t M a t h s 9 - 1 0 p t 2 1 0 / 9 / 9 6 4 : 2 6 P M P a

155
Intermediate Course — Core
Mathematical Investigations
Applications, suggested activities and sample questions
Students could:
◊ perform one of the following investigations: (continued)
g) the midpoints of adjacent sides of a triangle can be joined to form anothertriangle. Investigate the ratio of the area of the new triangle to the area of theoriginal triangle for various triangles
h) the midpoints of adjacent sides of a square can be joined to form anothersquare. Investigate the ratio of the area of the new square to the area of theoriginal square for various squares
i) investigate population growth over a number of years for a population whosebreeding pattern is governed by the rule that at the end of each year thereare twice as many as at the beginning of the year. What if the populationincreased by 10% a year? What happens for other growth factors?
j) think of a number. If it is odd, triple it and add 1. If it is even, halve it. Nowstart over again with the resulting number. Keep repeating this process. Whatdid you find? Investigate other numbers
k) investigate properties of the Fibonacci sequence
l) investigate ratios of areas of different sized paper (A0, A1, A2, A3, A4, …)
m) a number and its reciprocal differ by one. Can you find the number and anyother interesting facts about it?
n) a way of showing Pythagoras’ theorem in a right-angled triangle is to drawsquares on the sides of the triangle. Investigate right-angled triangles usingother shapes (eg triangles, semi-circles) to verify Pythagoras’ theorem
o) investigate how to find the surface area of a sphere
p) investigate the golden ratio or the historical development of πq) investigate the relationship of musical harmonies and scales to mathematics.
9 6 2 0 0 I n t M a t h s 9 - 1 0 p t 2 1 0 / 9 / 9 6 4 : 2 6 P M P a

9 6 2 0 0 I n t M a t h s 9 - 1 0 p t 2 1 0 / 9 / 9 6 4 : 2 6 P M P a
Intermediate Course
Content — Options
Fractals
Networks
Mathematics of small business
Further measurement
Further algebra
Coordinate geometry and curve sketching
Further number
Further probability
9 6 2 0 0 I n t M a t h s 9 - 1 0 p t 2 1 0 / 9 / 9 6 4 : 2 6 P M P a

9 6 2 0 0 I n t M a t h s 9 - 1 0 p t 2 1 0 / 9 / 9 6 4 : 2 6 P M P a

Option 1: Fractals
IterationFractals in two dimensions
Considerations
Fractals provide students with an opportunity to experience an area of recentlydeveloped mathematics. Through the consideration of fractals, students furtherdevelop their facility in a number of other areas of mathematics, including scale,measurement, place value and computational accuracy. By investigating theperimeter and area of fractals, students could gain an intuitive understanding ofsequences and limits. Teachers may wish to investigate fractals other than thosementioned here.
Students should gain an informal understanding of an iterative process by drawingsome simple fractals to about the fourth or fifth stage (isometric grid paper wouldbe helpful). Computer programs and calculators could also be used to generatefractals.
The Chaos game could be used to generate fractals. If enough iterations are used,the result will be a Sierpinski triangle. Self-similarity occurs when parts of a figureare small replicas of the whole figure. The Sierpinski triangle could also be used toinvestigate the idea of self-similarity.
Students could investigate what happens when objects are sliced into self-similarshapes (eg a line can be cut into two intervals of equal length, a square into fourequal squares and a cube into eight equal cubes with sides half the length of theoriginal). When a two-dimensional shape is reduced by a factor of a , four of thereduced shapes will fit into the original shape. Similarly, eight of the reducedshapes will fit into the original three-dimensional shape.
12
159
Intermediate Course — Options
9 6 2 0 0 I n t M a t h s 9 - 1 0 p t 2 1 0 / 9 / 9 6 4 : 2 6 P M P a

Option 1: Fractals
Content
i) Iteration
Learning experiences should provide students with the opportunity to:
• use construction methods to produce fractals based on simple shapes such astriangles and squares
• recognise that fractals are produced using an iterative process, and to develop arule to describe the iteration process for fractals.
160
Mathematics Years 9–10 Syllabus — Intermediate Course
9 6 2 0 0 I n t M a t h s 9 - 1 0 p t 2 1 0 / 9 / 9 6 4 : 2 6 P M P a

Option 1: Fractals
Applications, suggested activities and sample questions
i) Iteration
Students could:
◊ explore the idea of iteration by using a process such as squaring modulo 100and investigate the cycle for numbers between 0 and 99, eg 722 = 5184, 5184mod 100 = 84, 842 = 7056, 7056 mod 100 = 56. Continuing this process ofsquaring modulo 100 results in the following cycle:
(Starting with other numbers will producedifferent cycles. In total there are six differentcycles produced using the squaring modulo100 iteration)
◊ draw fractals for several stages, for example the Sierpinski triangle, a fractal tree,the Von Koch snowflake or a fractal carpet illustrated below
Sierpinski triangle Fractal tree Von Koch Fractal carpetsnowflake
Stage 2 Stage 3 Stage 1 Stage 1 Stage 2
◊ use a diagram of the first three stages of a fractal to determine the rule used togenerate the fractal
◊ vary the construction algorithm of a fractal to produce another fractal, egproduce the Sierpinski triangle using another reduction factor, or vary thefractal carpet by shading only the four corner squares
◊ use LOGO software to generate fractals
◊ find other examples of fractals or shapes exhibiting self-similarity, eg thecoastline, fern leaves etc.
36
16
96568472
161
Intermediate Course — Options
9 6 2 0 0 I n t M a t h s 9 - 1 0 p t 2 1 0 / 9 / 9 6 4 : 2 6 P M P a
Option 1: Fractals
Content
ii) Fractals in two dimensions
Learning experiences should provide students with the opportunity to:
• recognise number patterns arising from fractals, by considering the number ofshapes produced at different stages of the fractal construction, and to generaterules to describe these patterns
• make sensible statements about the change in area and perimeter of fractals assuccessive iterations are taken
• recognise self-similarity in fractals.
162
Mathematics Years 9–10 Syllabus — Intermediate Course
9 6 2 0 0 I n t M a t h s 9 - 1 0 p t 2 1 0 / 9 / 9 6 4 : 2 6 P M P a

163
Intermediate Course — Options
Option 1: Fractals
Applications, suggested activities and sample questions
ii) Fractals in two dimensions
Students could:
◊ use a fractal that they have constructed (eg Sierpinski triangle, Von Kochsnowflake, fractal carpet, fractal tree or other) to investigate:– number patterns that can be found in the fractal, eg the number of shapes
produced at different stages of the fractal construction– the change in the perimeter and area of the fractal as successive iterations are
taken, eg for the Sierpinski triangle, these patterns appear:
Stage 0 Stage 1 Stage 2 Stage 3
Number of shaded triangles 1 3 9 27
Area of shaded triangles A
Perimeter of shaded triangles P
◊ investigate the pattern produced in Pascal’s triangle by shading odd numbers(this will produce the Sierpinski triangle)
◊ play the Chaos game to produce fractals (start with a large equilateral triangleand label the vertices X, Y, Z; mark a point anywhere inside the triangle). Rollthe die and move according to the following rules: If the die shows 1 or 2, movehalfway towards the vertex X; for 3 or 4 move halfway towards the vertex Y;and for 5 or 6 move halfway towards the vertex Z. Mark the new point. Startfrom this new point, roll the die and again move halfway to the appropriatevertex. Continue the process. If this process is continued a large number oftimes, the Sierpinski triangle will eventually result (this can also be simulated ona computer)
(continued)
27P16
9P4
3P2
27A64
9A16
3A4
9 6 2 0 0 I n t M a t h s 9 - 1 0 p t 2 1 0 / 9 / 9 6 4 : 2 6 P M P a

Option 1: Fractals
Content
164
Mathematics Years 9–10 Syllabus — Intermediate Course
9 6 2 0 0 I n t M a t h s 9 - 1 0 p t 2 1 0 / 9 / 9 6 4 : 2 6 P M P a
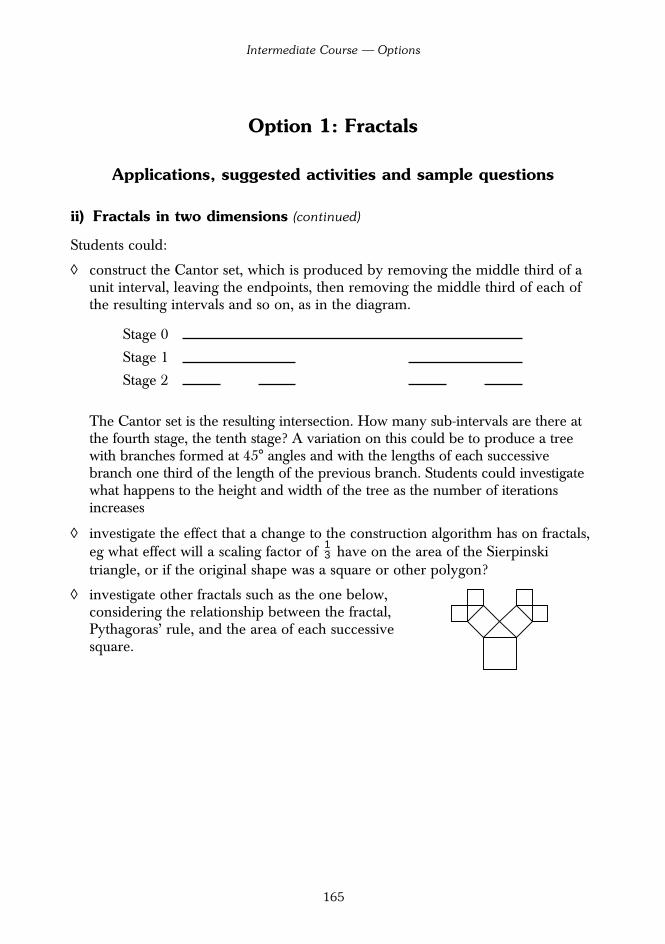
165
Intermediate Course — Options
Option 1: Fractals
Applications, suggested activities and sample questions
ii) Fractals in two dimensions (continued)
Students could:
◊ construct the Cantor set, which is produced by removing the middle third of aunit interval, leaving the endpoints, then removing the middle third of each ofthe resulting intervals and so on, as in the diagram.
The Cantor set is the resulting intersection. How many sub-intervals are there atthe fourth stage, the tenth stage? A variation on this could be to produce a treewith branches formed at 45° angles and with the lengths of each successivebranch one third of the length of the previous branch. Students could investigatewhat happens to the height and width of the tree as the number of iterationsincreases
◊ investigate the effect that a change to the construction algorithm has on fractals,eg what effect will a scaling factor of have on the area of the Sierpinskitriangle, or if the original shape was a square or other polygon?
◊ investigate other fractals such as the one below,considering the relationship between the fractal,Pythagoras’ rule, and the area of each successivesquare.
13
Stage 0
Stage 1
Stage 2
9 6 2 0 0 I n t M a t h s 9 - 1 0 p t 2 1 0 / 9 / 9 6 4 : 2 6 P M P a

9 6 2 0 0 I n t M a t h s 9 - 1 0 p t 2 1 0 / 9 / 9 6 4 : 2 6 P M P a

167
Intermediate Course — Options
Option 2: Networks
Considerations
Networks are useful for simplifying a situation where there are a number of paths,roads or routes that can be taken. There are many practical applications ofnetworks, eg mail delivery, garbage pick-up, communications networks, parceldelivery, couriers’ routes. While the intention is an introduction to networks,students should gain an appreciation of their usefulness, and gain an understandingof the requirements for networks to be connected or traversable. Some of thehistory of networks could be discussed, eg Euler’s consideration of the bridges ofKönigsberg.
Students should be able to decide whether a vertex is even or odd. An even vertexis one where an even number of edges leads to it or from it. A vertex is odd if anodd number of edges leads to it or from it. An investigative approach should beused to introduce connectedness. Eulerian paths are those which pass along everyedge of the network exactly once.
Students should appreciate that conventional maps indicate comparative distanceswhile network diagrams show only the relationships between locations. Other typesof networks could be considered, eg family trees.
9 6 2 0 0 I n t M a t h s 9 - 1 0 p t 2 1 0 / 9 / 9 6 4 : 2 6 P M P a

Option 2: Networks
Content
A network is a set of vertices in which any two vertices either are or are not connected by an edge.
A path is any sequence of edges connected end to end (a path may visit a vertex or pass alongan edge more than once).
A circuit is a path which begins and ends at the same vertex.
A network is called connected or traversable if every pair of vertices is connected by a pathbeginning at one and ending at the other.
The degree of a vertex is the number of edges connected to it.
An even vertex is one where an even number of edges leads to it or from it.
A vertex is odd if an odd number of edges leads to it or from it.
An Eulerian path is a path which passes along every edge of the network exactly once. AnEulerian circuit is a path which begins and ends at the same vertex and passes along everyedge of the network exactly once.
A Hamiltonian path is a path which visits every vertex exactly once (and which thereforecannot be a circuit). A Hamiltonian circuit is a path which begins and ends at the samevertex and visits every other vertex exactly once.
Learning experiences should provide students with the opportunity to:
• use the language of networks appropriately
• draw and interpret network diagrams arising from various practical situations
• identify the degree of a vertex, and demonstrate understanding that a networkmust have an even number of vertices of odd degree
• identify Eulerian and Hamiltonian circuits and paths
• demonstrate understanding of the conditions for a network to have an Euleriancircuit or to have an Eulerian path that is not a circuit, ie:
A connected or traversable network has an Eulerian circuit if and only if every vertex haseven degree.
A connected or traversable network has an Eulerian path which is not a circuit if andonly if exactly two vertices have odd degree.
168
Mathematics Years 9–10 Syllabus — Intermediate Course
9 6 2 0 0 I n t M a t h s 9 - 1 0 p t 2 1 0 / 9 / 9 6 4 : 2 6 P M P a

169
Intermediate Course — Options
Option 2: Networks
Applications, suggested activities and sample questions
Students could:
◊ investigate the historical Königsberg bridges problem, whose solution by Eulerwas the origin of network theory
◊ identify the physical features to be represented in a network (eg rooms in mathsblock as vertices and doors or corridors as edges)
◊ plan bus routes to connect a new housing estate to other areas
◊ investigate connectedness by drawing doodles that (a) start and finish at the same point (Eulerian circuits)
(b) start and finish at different points (Eulerian pathsthat are not circuits)
◊ interpret network diagrams used within their community, such as for railways,airlines, couriers
◊ distinguish between situations where it is useful to find circuits visiting each vertex only once, and those in which it is useful to find circuits visiting each edge only once
◊ draw networks for suburban trains, bus routes, overnight parcel deliveries
◊ identify most efficient paths and locations (eg start and finish at the bus stopwithout retracing one’s steps, locate a recycling depot, design a tour of countrytowns by a rock group)
◊ investigate some polyhedra, regular or otherwise, to see whether or not theyhave Eulerian circuits or paths through their vertices and edges
(continued)
9 6 2 0 0 I n t M a t h s 9 - 1 0 p t 2 1 0 / 9 / 9 6 4 : 2 6 P M P a

Option 2: Networks
Content
170
Mathematics Years 9–10 Syllabus — Intermediate Course
9 6 2 0 0 I n t M a t h s 9 - 1 0 p t 2 1 0 / 9 / 9 6 4 : 2 6 P M P a

171
Intermediate Course — Options
Option 2: Networks
Applications, suggested activities and sample questions
Students could: (continued)
◊ find Hamiltonian circuits through the vertices and edges of a dodecahedron (thiswas Hamilton’s original game), and generalise to other polyhedra
◊ take a small section of a street map for the local area and draw a network for it.Investigate the network for the degree of the vertices, number of edges andwhether it is connected, indicating the number of paths one could take to getfrom A to B. Are the paths Eulerian?
◊ answer questions like:
a) does the network shown have an Eulerianpath or circuit? If not, what modificationsare needed to create i) a path ii) a circuit?
b) a courier has to deliver parcels to six placesrepresented by the vertices shown. Theedges represent roads. Is it possible for herto start and finish the trip at vertex 2 (thedepot), and visit each place once?
c) a network is formed whose vertices are the squares of a chessboard andwhose edges are the moves of a knight. Show that this network has noEulerian path or circuit, but find one of the many Hamiltonian paths
◊ use network diagrams to analyse games, eg ‘Sprouts’. (This game is played bytwo or more people and begins with a number of dots or vertices, usuallybetween 3 and 10. Each player takes turns to draw edges between two vertices,placing another vertex on the new edge. A maximum of three edges is allowedfor each vertex. The last player able to draw an edge wins.)
1 2
4
6 5
3
1
5 73
46
2
9 6 2 0 0 I n t M a t h s 9 - 1 0 p t 2 1 0 / 9 / 9 6 4 : 2 6 P M P a

9 6 2 0 0 I n t M a t h s 9 - 1 0 p t 2 1 0 / 9 / 9 6 4 : 2 6 P M P a

173
Intermediate Course — Options
Option 3: Mathematics of Small Business
Paying wagesPaying taxesInvestment
Running costs of small business
Considerations
This topic is designed to give students a greater depth of experience in mattersrelating to mathematics, small business and commerce. It is intended that studentsbecome competent with the skills required for aspects of small business such aspaying wages and taxes, investments and running costs.
Students should be familiar with calculations on wages such as overtime, bonuspayments etc from the Consumer arithmetic topic of the core and be able to applythese skills to the situation of an employer calculating wages for employees.Students should also recognise that there are other forms of taxation apart fromincome tax that an employer has to calculate.
Examples given to students should reflect current practices in employmentconditions (number of hours in working week, overtime rates, rates for casuallabour) and in taxation.
Students should be competent in calculations involving the simple and compoundinterest formulae and with the use of the formula for depreciation. Students shouldbe shown how the compound interest formula is developed from consideration ofa small number of time periods. Examples that reflect current interest rates andterms and conditions of repayment should be used.
Students should be aware of a range of different ways of investing money and beable to calculate returns such as dividends for shares. Interest calculations couldprovide opportunities for the use of spreadsheets.
Students should be competent in reading tables of information and be aware of thesituations in society in which insurance is applicable. It is not intended, however,that students look at insurance as an application of series. Questions on cost ofinsurance and superannuation need to be based on current rates, which may beobtained from relevant companies.
9 6 2 0 0 I n t M a t h s 9 - 1 0 p t 2 1 0 / 9 / 9 6 4 : 2 6 P M P a

Option 3: Mathematics of Small Business
Content
i) Paying wages
Learning experiences should provide students with the opportunity to:
• calculate earnings for a small number of employees, including earningsinvolving overtime, leave loading, bonus payments, gratuities, allowances andlump sum payments, and complete time sheets or other methods
• make calculations involving deductions from wages such as superannuation andPAYE tax.
ii) Paying taxes
Learning experiences should provide students with the opportunity to:
• make calculations involving payroll tax and provisional tax
• describe and calculate sales tax, fringe benefits tax, capital gains tax.
174
Mathematics Years 9–10 Syllabus — Intermediate Course
9 6 2 0 0 I n t M a t h s 9 - 1 0 p t 2 1 0 / 9 / 9 6 4 : 2 6 P M P a

Option 3: Mathematics of Small Business
Applications, suggested activities and sample questions
i) Paying wages
Students could:
◊ use spreadsheets or other methods to calculate earnings for a small number ofemployees, and complete time sheets
◊ calculate the cost of holiday leave-loading for a business with a small number ofemployees
◊ investigate the cost involved in providing superannuation for their employees
◊ use a PAYE table to calculate the tax payable on average weekly wages foremployees.
ii) Paying taxes
Students could:
◊ calculate the amount of payroll tax to be paid after consideration of the totalwages bill for a fortnightly period
◊ research and report on the different types of current taxes for business
◊ calculate sales tax on goods such as cosmetics, books, jewellery etc
◊ investigate capital gains tax on assets relating to the business.
175
Intermediate Course — Options
9 6 2 0 0 I n t M a t h s 9 - 1 0 p t 2 1 0 / 9 / 9 6 4 : 2 6 P M P a
Option 3: Mathematics of Small Business
Content
iii) Investment
Learning experiences should provide students with the opportunity to:
• use the compound interest formula to calculate compound interest oninvestments
A = P (1 + R)n where R =
• use simple and compound interest formulae to compare interest given byfinancial institutions to businesses (I = where R = )
• calculate the effective flat rate of return on investments as a means to comparetwo different investments
• make calculations involving inflation
• describe and use the consumer price index
• calculate the dividend yield on shares.
r100
PRT100
r100
176
Mathematics Years 9–10 Syllabus — Intermediate Course
9 6 2 0 0 I n t M a t h s 9 - 1 0 p t 2 1 0 / 9 / 9 6 4 : 2 6 P M P a

177
Intermediate Course — Core
Option 3: Mathematics of Small Business
Applications, suggested activities and sample questions
iii) Investment
Students could:
◊ compare simple and compound interest, eg compare the interest earned on $10 000 invested at 8% simple interest per annum and 0.75% compoundedmonthly
◊ research and report on the different types of investment available by comparinginterest rates for businesses and also by looking at the different types ofinvestment accounts available
◊ find the effective flat rate of interest when $6000 is invested at 5.25% perannum compounding monthly for a year
◊ compare inflation rates in different countries, considering the real value of acertain amount over a fixed time
◊ investigate how the consumer price index is calculated and its effect on the rateof inflation
◊ research dividends paid to investors and determine what percentage a selecteddividend is of (a) the face value of the share; (b) the current market price
◊ find the dividend yield if a dividend of 10% is paid on the face value of $2 pershare if the current market price is $8 per share
◊ look at the price of shares of a particular company and graph its ‘progress’ overa short period of time, determining whether buying the shares would be a‘good’ investment
◊ investigate, by using prepared tables, how much the amount repaid on a loanvaries with the frequency of the payments.
9 6 2 0 0 I n t M a t h s 9 - 1 0 p t 2 1 0 / 9 / 9 6 4 : 2 6 P M P a
Option 3: Mathematics of Small Business
Content
iv) Running costs of small businesses
Learning experiences should provide students with the opportunity to:
• interpret tables of information to calculate insurance costs for cars, buildings,goods, contents of premises, persons and/or property
• determine the cost of workers’ compensation
• describe and calculate variable and fixed costs in the running of a smallbusiness
• compare different costs involved in running a business (eg renting vs buyingpremises, leasing v buying vehicles and equipment)
• calculate the depreciation of capital items and equipment.
178
Mathematics Years 9–10 Syllabus — Intermediate Course
9 6 2 0 0 I n t M a t h s 9 - 1 0 p t 2 1 0 / 9 / 9 6 4 : 2 6 P M P a

Option 3: Mathematics of Small Business
Applications, suggested activities and sample questions
iv) Running costs of small business
Students could:
◊ compare the costs of leasing or purchasing business premises and equipment
◊ determine profit for a business after deducting all running costs, and expressprofit as a percentage of turnover (sales)
◊ investigate and report on the cost of insuring a car, a business premise, or theequipment for a business, obtaining and comparing information given byinsurance companies
◊ read tables to determine the cost of workers’ compensation for a small businessthat employs a number of people
◊ investigate and report on the variable and fixed costs, considering costs such asrent, payment and maintenance of equipment, staffing and stock, for a smallbusiness (eg a lawn-mowing business, a take-away food business, a shop/store, afactory with less than 10 employees)
◊ investigate a situation such as: you are going to start a small business whichinvolves making a product to sell. Prepare a business report that discusses whattype of product you are going to manufacture, whether you are making thisproduct at home or in a small factory, the production costs involved, labourcosts, and expected profits (which will be determined by the selling price of theproduct)
◊ calculate the depreciated value, after three years, of machinery originally costing$20 000, if the rate of depreciation is 15% per annum.
179
Intermediate Course — Core
9 6 2 0 0 I n t M a t h s 9 - 1 0 p t 2 1 0 / 9 / 9 6 4 : 2 6 P M P a

Option 4: Further Measurement
Further trigonometrySurveyingNavigation
Navigation on land
Considerations
The first section of this option involves further trigonometry, where students areintroduced to trigonometry of non-right-angled triangles. While the proofs of thesine, cosine and area rule may be shown to students, they would not be expectedto reproduce them. Students should be able to choose the correct formula for aparticular problem and apply the formula correctly. Such formulae will be given tostudents in any external examination at this level. The ambiguous case (wherethere are two possible results using the sine rule) should be avoided. Problemsgiven to students should be practical in nature and, in general, diagrams should begiven to students in this course.
This option moves on to surveying and navigation, as practical applications ofmeasurement, including trigonometry.
Students should have some practical experience of the surveying methods that theywill encounter in this option. Other methods of surveying could be discussed, suchas optical, electronic and aerial methods, along with the appropriateness of suchmethods and their orders of accuracy. The section on surveying requires studentsto apply the sine, cosine and area rules from trigonometry and to work with three-figure bearings. This may need to be revised if students are not competent with thiswork.
The work on navigation should be centred on navigational charts. Students shouldbe encouraged to use the language of navigation (eg parallels of latitude, meridiansof longitude, great circles, poles, tropics, principal compass points, nautical milesand knots) appropriately. A globe can be used to show great and small circles andencourage understanding of navigation. This can be used in conjunction with a flatmap of the world. The distortions could be discussed. Students should plotjourneys by locating up to five positions. Back bearings and simple problemsinvolving speed, distance and time should be encountered.
180
Mathematics Years 9–10 Syllabus — Intermediate Course
9 6 2 0 0 I n t M a t h s 9 - 1 0 p t 2 1 0 / 9 / 9 6 4 : 2 6 P M P a
A practical approach to navigation on land would enable students to develop someorienteering skills, through following a course in a park or in the school grounds.Teachers could make use of local SES personnel, and members of the class whobelong to Scouts, Guides or orienteering clubs, or who are experienced inbushwalking and reading maps. Students could also investigate surveyingequipment such as the Global Positioning System, which gives very accuratereadings for latitude and longitude.
181
Intermediate Course — Core
9 6 2 0 0 I n t M a t h s 9 - 1 0 p t 2 1 0 / 9 / 9 6 4 : 2 6 P M P a

Option 4: Further Measurement
Content
i) Further trigonometry
The proofs of the sine, cosine and area rules are not examinable but should be done with thestudents if appropriate.
Learning experiences should provide students with the opportunity to:
• establish and use the relationship between the sine and cosine ratios ofcomplementary angles in right-angled triangles
• express the tangent ratio in terms of sine and cosine
• use a calculator to find the trigonometric ratios of obtuse angles
• draw graphs of the sine and cosine curves for 0° ≤ A ≤ 180°
• solve angle and length problems using the sine rule in acute- and obtuse-angledtriangles
Sine rule : = =
• solve angle and length problems using the cosine rule in acute- and obtuse-angled triangles
Cosine rule: c 2 = a2 + b2 – 2ab cos C, cos C =
• use the area formula to find the area of a triangle
Area = ab sin C.12
a2 + b2 - c 2
2ab
csin C
bsin B
asin A
182
Mathematics Years 9–10 Syllabus — Intermediate Course
9 6 2 0 0 I n t M a t h s 9 - 1 0 p t 2 1 0 / 9 / 9 6 4 : 2 6 P M P a

Option 4: Further Measurement
Applications, suggested activities and sample questions
i) Further trigonometry
Students could:
◊ verify that the sine ratio divided by the cosine ratio gives the tangent ratio for anumber of angles in right-angled triangles
◊ discuss why cos 25° = sin 65°
◊ consider questions like: sin 40° = cos x°. Find the value of x°
◊ use a calculator to compare sin 10° with sin 170°, sin 20° with sin 160°, sin 30°with sin 150° etc and use the results to draw the graph of sin x for 0° ≤ x ≤ 180°(similarly for cos x)
◊ investigate the graphs of the sine and cosine curves between 0° and 180° (thiscould be done using a graphics calculator or computer graphing package ifavailable)
◊ use the sine and cosine rule to find approximationsfor sides and angles in non-right-angled triangles, egfind the size of angle θ in the triangle shown here
◊ find the area of any triangle given sufficient information (eg in the aboveexample)
◊ using the cosine rule, find the largest angle in a triangle by recognising therelationship between the lengths of the sides and the size of the angles
◊ find the area of a regular hexagon with sides 5 cm
◊ measure triangles and find their areas, discussing the different methods possible
◊ investigate what happens to the area rule when one of the angles is 90°
◊ investigate what happens to the sine rule when one of the angles is 90°
◊ investigate what happens to the cosine rule when one of the angles is 90°.
183
Intermediate Course — Core
82
71°
θ
63
9 6 2 0 0 I n t M a t h s 9 - 1 0 p t 2 1 0 / 9 / 9 6 4 : 2 6 P M P a

Option 4: Further Measurement
Content
ii) Surveying
Learning experiences should provide students with the opportunity to:
• choose and use the most appropriate method of measuring horizontal lengths
• draw a perpendicular to a fixed line using a variety of methods and understandthe geometrical justification of each method
• mark out right angles on the ground
• measure horizontal angles using available instruments such as an alidade and acompass
• use a traverse survey (offset method) to obtain the measurements necessary toconstruct a scale drawing of a shape, using the field notebook method to recordthe measurements
• use the radial method to construct a scale drawing of a shape, using both theplane table and compass to measure the angles
• find the perimeter and area of a shape using a scale drawing obtained from theoffset method and the radial method
• construct scale drawings from sets of measurements obtained by triangulationand calculate relevant lengths and angles from the diagram
• calculate the perimeter and area of a suitable shape using a sketch and theappropriate trigonometric formula.
184
Mathematics Years 9–10 Syllabus — Intermediate Course
9 6 2 0 0 I n t M a t h s 9 - 1 0 p t 2 1 0 / 9 / 9 6 4 : 2 6 P M P a

Option 4: Further Measurement
Applications, suggested activities and sample questions
ii) Surveying
Students could:
◊ mark out a field in the school grounds and use a variety of techniques to surveythe field
◊ use a variety of methods to make a scale drawing of an irregular shaped fieldthat has been marked out
◊ use triangulation to find the length of an inaccessible boundary
◊ use field book entries to mark out a shape on the ground
◊ given a practical problem, decide on the most appropriate survey technique andthe best method to obtain perimeter and area
◊ answer questions like:a) use these field book entries to make a scale drawing and
find the perimeter and area of the shape
b) this sketch is the result of a radialsurvey. Use trigonometry to findthe area and perimeter of the field
c) use a plane table and triangulation toproduce a scale drawing of a fieldsimilar in shape to the one shown.
185
Intermediate Course — Core
410m
440m
365m311°
237° 123°
046° N
270m
S
PQ
R
B46
24 3322 21
17 120A
9 6 2 0 0 I n t M a t h s 9 - 1 0 p t 2 1 0 / 9 / 9 6 4 : 2 6 P M P a

Option 4: Further Measurement
Content
iii) Navigation
Learning experiences should provide students with the opportunity to:
• recognise that Earth is approximately a sphere and identify the important partsof a sphere
• explain the use of parallels of latitude and meridians of longitude to determineand record the position of a point on Earth’s surface
• recognise a chart as a flat representation of the curved surface of Earth
• describe the advantages and disadvantages of using a Mercator Projection(where the lines of latitude and longitude appear at right angles)
• define and use units such as nautical mile and knot
• use the latitude scale of a chart to calculate distances (1° = 60 n miles on a greatcircle)
• locate a position on a chart given its latitude and longitude, and determine thelatitude and longitude of a given point on a chart
• use the compass rose to solve problems involving bearings
• describe the difference between true north and magnetic north, and change truebearings to magnetic bearings and vice versa
• fix positions using a transit fix, a cross-bearing fix, and a vertical angle andcompass fix
• plot courses on a chart by locating a number of positions from suppliedinformation.
186
Mathematics Years 9–10 Syllabus — Intermediate Course
9 6 2 0 0 I n t M a t h s 9 - 1 0 p t 2 1 0 / 9 / 9 6 4 : 2 6 P M P a

187
Intermediate Course — Core
Option 4 : Further Measurement
Applications, suggested activities and sample questions
iii) Navigation
Students could:
◊ from a wire model of the earth, identify the important parts of a sphere such asthe centre, radius, diameter, great circles and small circles
◊ relate the great circles and small circles on a sphere to the parallels of latitudeand meridians of longitude
◊ investigate the history of navigation and the use of various map projections
◊ use a globe and cylinder to investigate the Mercator Projection and consider thedistortions that occur
◊ draw a scale diagram to find the position and bearing of a boat from a set ofwritten instructions
◊ convert distances in nautical miles to kilometres, and knots to km/h, and viceversa
◊ answer questions like:a) what distance would be represented by a latitude difference of 3°?b) convert a compass bearing of 160° to a true bearing if the magnetic variation
is 8° Ec) find cities or towns that have the same longitude as Tamworthd) what is the difference in latitude between Bangkok and Newcastle?e) two cities have a difference in latitude of 20°. What could they be? How far
apart are these cities?f) find the city that is closest to the position 32°S, 142°E
◊ give a report on how the Endeavour was navigated to Botany Bay. Explain anydifferences in methods used for navigation today
◊ make up a course for a navigational chart to locate buried treasure at aparticular position.
9 6 2 0 0 I n t M a t h s 9 - 1 0 p t 2 1 0 / 9 / 9 6 4 : 2 6 P M P a

Option 4: Further Measurement
Content
iv) Navigation on land
Learning experiences should provide students with the opportunity to:
• orient a topographical map by compass
• read a topographical map
• orient a map by physical features
• use a compass proficiently
• navigate a simple course
• use nature’s compass (sun or stars) to find the four main compass points.
188
Mathematics Years 9–10 Syllabus — Intermediate Course
9 6 2 0 0 I n t M a t h s 9 - 1 0 p t 2 1 0 / 9 / 9 6 4 : 2 6 P M P a
Option 4 : Further Measurement
Applications, suggested activities and sample questions
iv) Navigation on land
Students could:
◊ name and describe the main parts of a compass
◊ explain what a compass bearing is, and set and follow one
◊ explain what a back bearing is, and calculate and check one
◊ pay attention to scale, legend, symbols and contour lines when reading atopographical map
◊ give a written or verbal description of an area after reading and interpreting atopographical map for the area
◊ understand and use grid references
◊ make a simple map
◊ set up and use simple courses around school grounds or local parks
◊ read and interpret pen and paper courses on grid paper with protractors
◊ have excursions to parkland where semi-permanent courses are set up
◊ trace out the following course at a park:1) walk 20 m north2) walk 35 m on a bearing 120°3) walk 22 m on a bearing 200°
Students could take a bearing to the starting position and measure the distanceback to this position, and then draw a representation of this course on paper
◊ obtain a local street map and describe how to travel from the school to the postoffice, giving grid references and compass bearings
◊ locate the direction south using the Southern Cross and the pointers.
189
Intermediate Course — Core
9 6 2 0 0 I n t M a t h s 9 - 1 0 p t 2 1 0 / 9 / 9 6 4 : 2 6 P M P a

Option 5: Further Algebra
Simultaneous equations
Quadratic and related expressions
Quadratic equations
Graphs of parabolas
Considerations
Students have already been introduced to algebra in Years 7–8 and extended theircompetence and knowledge in the core of this course. This option extends theiralgebraic competence and understanding to include simultaneous linear equationsand quadratic equations.
When dealing with the section on Quadratic and related expressions, it should benoted that some non-quadratic expressions such as 3a2b and 2xy – 3y + 2x – 3 havebeen included. When working with quadratic expressions, students should developoperational facility with expansions and factorisations of common expressions(binomial squares, difference of squares) so that they give ready responses.
Students can continue to use mathematical templates, computer graphing software orgraphical calculators as tools to help in graphing and comparing graphs ofrelationships. This option further develops students’ competence with graphs ofrelationships to include parabolas of the type y = ax 2 + bx + c. Further experiencewith graphs of relationships involving circles with centre the origin and simple cubicsis provided in Option 6: Coordinate geometry and curve sketching, whilst experience withexponential relationships is provided in Option 7: Further number.
It should be stressed to students that solutions to equations (in this option,simultaneous and quadratic equations) should be set out clearly, logically andcarefully, and that they should be able to explain their solutions. Only linearsimultaneous equations should be considered. Students should be able to use the‘=’ sign appropriately, ie usually only one equals sign per sentence when solvingequations. They should check their solutions as a matter of course, and considerwhether their solution makes sense within the context of the question.
190
Mathematics Years 9–10 Syllabus — Intermediate Course
9 6 2 0 0 I n t M a t h s 9 - 1 0 p t 2 1 0 / 9 / 9 6 4 : 2 6 P M P a

Students should realise that if ab = 0 then there are two possible solutions, either a = 0 or b = 0, and relate this idea to the solution of quadratics. Students will notbe expected to prove the quadratic formula, and the proof of the formula shouldonly be given to students at teachers’ discretion. It is important that students canuse this formula to find the zeros of a quadratic expression and the roots of aquadratic equation.
Since this option relates to Option 7: Further number, students would benefit fromcompleting sections of that option, particularly those on real numbers and surds,before studying this option.
191
Intermediate Course — Core
9 6 2 0 0 I n t M a t h s 9 - 1 0 p t 2 1 0 / 9 / 9 6 4 : 2 6 P M P a

Option 5: Further Algebra
Content
i) Simultaneous equations
Learning experiences should provide students with the opportunity to:
• generate linear simultaneous equations from problems
• find values that satisfy pairs of simultaneous equations using non-algebraicmethods such as guess and check, setting up tables, looking for patterns
• solve simultaneous equations algebraically using the analytical methods ofsubstitution and elimination
• check the solutions
• solve problems involving simultaneous equations.
192
Mathematics Years 9–10 Syllabus — Intermediate Course
9 6 2 0 0 I n t M a t h s 9 - 1 0 p t 2 1 0 / 9 / 9 6 4 : 2 6 P M P a

Option 5: Further Algebra
Applications, suggested activities and sample questions
i) Simultaneous equations
Students could:
◊ use guess and check or other methods to solve problems like:
a) at the school disco there were 52 more girls than boys. Total attendance was420. How many boys and girls attended?’
b) a zoo enclosure contains wombats and emus. If there are 50 eyes and 80legs, find the number of emus and wombats
◊ solve and check the solutions to linear simultaneous equations like:
a) x + y = 3 and x – y = 1b) 3x – 4y = 2 and 2x – y = 3c) y = 2x + 5 and y = x – 3
◊ answer questions like:
a) write a story connecting the equations 2x + y = 8 and x + 2y = 7. Draw thegraphs of the two lines and find the values of x and of y that satisfy bothequations at the same time.
b) draw graphs of y = 2x – 3 and y = 3x – 4, and use the graphs to solve 3x – 4 = 2x –3.
193
Intermediate Course — Core
9 6 2 0 0 I n t M a t h s 9 - 1 0 p t 2 1 0 / 9 / 9 6 4 : 2 6 P M P a

Option 5: Further Algebra
Content
ii) Quadratic and related expressions
Learning experiences should provide students with the opportunity to:
• generate quadratic expressions from problems
• evaluate quadratic expressions by substitution
• expand and simplify the product of expressions which result in a quadraticexpression
• recognise and apply the special products
(a + b)(a – b) = a 2– b 2
(a ± b)2 = a 2 ± 2ab + b 2
• recognise expressions that are perfect squares and be able to complete thesquare
• factorise expressions including the use of:
– common factors– difference of two squares– perfect squares– trinomials – grouping in pairs for four-term expressions
• simplify expressions involving algebraic fractions.
194
Mathematics Years 9–10 Syllabus — Intermediate Course
9 6 2 0 0 I n t M a t h s 9 - 1 0 p t 2 1 0 / 9 / 9 6 4 : 2 6 P M P a
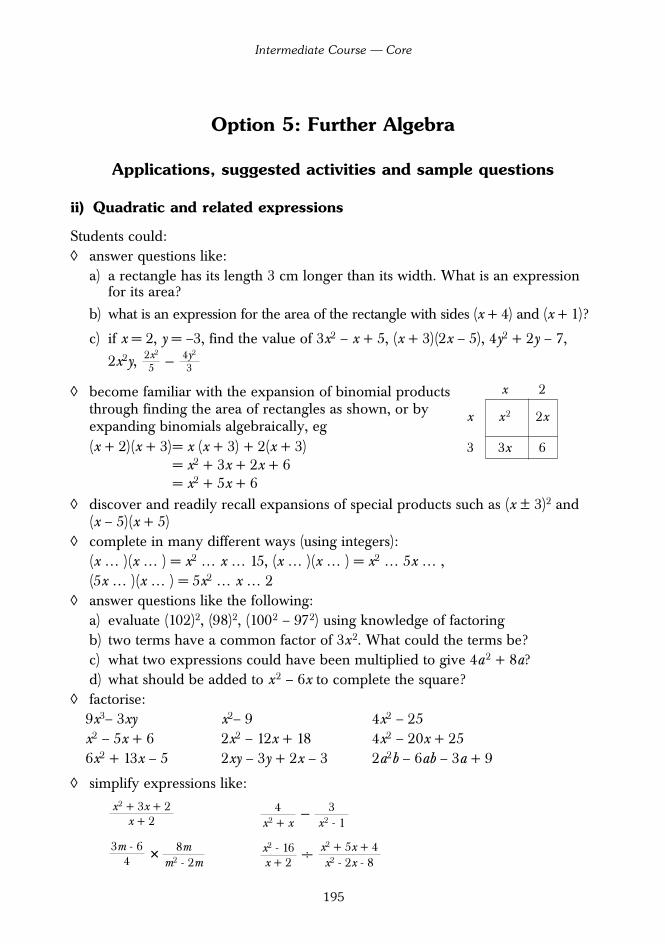
195
Intermediate Course — Core
Option 5: Further Algebra
Applications, suggested activities and sample questions
ii) Quadratic and related expressions
Students could:◊ answer questions like:
a) a rectangle has its length 3 cm longer than its width. What is an expressionfor its area?
b) what is an expression for the area of the rectangle with sides (x + 4) and (x + 1)?
c) if x = 2, y = –3, find the value of 3x2 – x + 5, (x + 3)(2x – 5), 4y2 + 2y – 7,
2x2y, –
◊ become familiar with the expansion of binomial productsthrough finding the area of rectangles as shown, or byexpanding binomials algebraically, eg (x + 2)(x + 3)= x (x + 3) + 2(x + 3)
= x2 + 3x + 2x + 6= x2 + 5x + 6
◊ discover and readily recall expansions of special products such as (x ± 3)2 and (x – 5)(x + 5)
◊ complete in many different ways (using integers):(x … )(x … ) = x2 … x … 15, (x … )(x … ) = x2 … 5x … , (5x … )(x … ) = 5x2 … x … 2
◊ answer questions like the following:a) evaluate (102)2, (98)2, (1002 – 972) using knowledge of factoringb) two terms have a common factor of 3x2. What could the terms be?c) what two expressions could have been multiplied to give 4a2 + 8a?d) what should be added to x2 – 6x to complete the square?
◊ factorise:9x3– 3xy x2– 9 4x2 – 25x2 – 5x + 6 2x2 – 12x + 18 4x2 – 20x + 256x2 + 13x – 5 2xy – 3y + 2x – 3 2a2b – 6ab – 3a + 9
◊ simplify expressions like:
–
× ÷ x2 + 5x + 4x2 - 2x - 8
x2 - 16x + 2
8mm2 - 2m
3m - 64
3x2 - 1
4x2 + x
x2 + 3x + 2x + 2
4y2
32x2
5
x 2
x x2 2x
3 3x 6
9 6 2 0 0 I n t M a t h s 9 - 1 0 p t 2 1 0 / 9 / 9 6 4 : 2 6 P M P a

Option 5: Further Algebra
Content
iii) Quadratic equations
Learning experiences should provide students with the opportunity to:
• generate quadratic equations which arise from quadratic relationships
• solve equations of the form ax 2 = c
• solve quadratic equations using – quadratic factors– completion of the square– the quadratic formula x =
• check the solutions of quadratic equations
• compare and contrast different methods of solving quadratic equations
• solve problems involving quadratic equations.
–b ± b2 – 4ac
2a
196
Mathematics Years 9–10 Syllabus — Intermediate Course
9 6 2 0 0 I n t M a t h s 9 - 1 0 p t 2 1 0 / 9 / 9 6 4 : 2 6 P M P a

Option 5: Further Algebra
Applications, suggested activities and sample questions
iii) Quadratic equations
Students could:
◊ find an equation that describes y in terms of xas for the table of values shown:
◊ solve quadratic equations by a variety of methods including guess, check andimprove
◊ solve equations like: 3x2 = 4 x2 – 5x = 6 x2 – 8x – 4 = 02x(x + 4) = 0 x(x – 3) = 4 (y – 2)2 = 9
◊ answer questions like:a) if 5a × 6b = 0, what values must a or b (or both) take?b) a circle has an area of 3.5 cm2. What is its radius and diameter?c) solve x 2 – 4x + 3 = 0 in as many different ways as possible
◊ solve word problems that result in equations like 2x 2 – 5x – 3 = 0
◊ after solving a number of quadratic equations, discuss the possible number ofroots for any quadratic equation.
197
Intermediate Course — Core
x 0 1 2 3 4 5
y 1 2 5 10 17 26
9 6 2 0 0 I n t M a t h s 9 - 1 0 p t 2 1 0 / 9 / 9 6 4 : 2 6 P M P a
Option 5: Further Algebra
Content
iv) Graphs of parabolas
Learning experiences should provide students with the opportunity to:
• find the x- and y-intercepts for the graph of y = ax2 + bx + c , given a, b and c
• graph y = ax2 + bx + c , given a, b and c, using the available technology
• find the coordinates of the vertex of a parabola by :
– finding the midpoint of the x-intercepts and substituting– completing the square– using the formula
• identify and use features of parabolas and their equations to assist in sketchingquadratic relationships, eg x- and y-intercept, vertex, axis of symmetry andconcavity
• determine a possible equation, given a graph which shows some of thesefeatures.
198
Mathematics Years 9–10 Syllabus — Intermediate Course
9 6 2 0 0 I n t M a t h s 9 - 1 0 p t 2 1 0 / 9 / 9 6 4 : 2 6 P M P a

Option 5: Further Algebra
Applications, suggested activities and sample questions
iv) Graphs of parabolas
Students could:
◊ draw the graph of a quadratic relationship by plotting points, factorising andfinding the x- and y-intercepts, using the graphics calculator and/or computergraphing packages
◊ graph y = (x – 2)2 and y = (x – 2)2 + 3, describing what effect adding 3 has hadon the original graph
◊ investigate the graphs of parabolas of the form y = (x – a)2 and y = (x – a)2 + K
◊ answer questions like: if a parabola cuts the x axis at 0 and 2, what might theequation be?
◊ find the axis of symmetry for the parabola y = x2 – 6x + 8 and use it to find thevertex. Draw the graph, clearly marking the vertex and the x- and y-intercepts
◊ sketch the graphs of y = x2 + 6x – 7 and y = 2x2 + 12x – 14, comparing the twographs and describing the differences between them
◊ from a graph of a parabola, with the main features clearly marked, discuss andpredict the equation of a curve, using computer graphing software if available
◊ look for parabolic shapes in the environment, eg the path taken by a ball whenthrown, satellite dishes, car headlights.
199
Intermediate Course — Core
9 6 2 0 0 I n t M a t h s 9 - 1 0 p t 2 1 0 / 9 / 9 6 4 : 2 6 P M P a

9 6 2 0 0 I n t M a t h s 9 - 1 0 p t 2 1 0 / 9 / 9 6 4 : 2 6 P M P a

Option 6: Coordinate Geometry and CurveSketching
Distance, gradient and midpointEquation of a straight line
Parallel and perpendicular linesCoordinate exercises
Curve sketching
Considerations
Students have already had experience with finding the distance between two pointsand the midpoint of an interval informally in the core of this course. In this option,they formalise these skills to establish and use formulae for finding distance andmidpoint. When assessing this option, teachers may decide to provide studentswith the appropriate formulae.
Students have also had experience in drawing straight lines and reading off thegradient from an equation in the form y = mx + b. Again in this option, this work isformalised. Students establish and use a formula for finding the gradient of aninterval joining two points and develop the notion of the gradients of parallel andperpendicular lines. They have further experience with the general form of astraight line (ax + by + c = 0) and should be able to convert from this form to themore familiar form of the straight line (y = mx + b), which will facilitate graphingand finding further information about the line.
In this option, students also use their knowledge and skills in coordinate geometryto solve some problems to the level of difficulty indicated by the examples in theapplications.
Students need a firm grounding in curve sketching if they are to proceedsuccessfully to the more academic 2 unit course in Year 11. The curve sketchingsection of this option is designed to encourage students to investigate thetransformations (vertical and horizontal translations and reflections) that are madeto a curve by the inclusion of a constant term in the appropriate place in theoriginal equation. In this way the option relates to the transformations studied inYears 7 and 8. Graphics calculators or graphics software on computers can facilitatethe exploration of the effects of the inclusion of a constant in different positions.
It is assumed that students undertaking the curve sketching section of this optionwould have already completed the relevant sections of Option 5 on sketchinggraphs of parabolas.
201
Intermediate Course — Core
9 6 2 0 0 I n t M a t h s 9 - 1 0 p t 2 1 0 / 9 / 9 6 4 : 2 6 P M P a

Option 6: Coordinate Geometry and Curve Sketching
Content
i) Distance, gradient and midpoint
Learning experiences should provide students with the opportunity to:
• establish and use the distance formula
• establish and use the midpoint formula
• establish and use the gradient formula.
202
Mathematics Years 9–10 Syllabus — Intermediate Course
9 6 2 0 0 I n t M a t h s 9 - 1 0 p t 2 1 0 / 9 / 9 6 4 : 2 6 P M P a

Option 6: Coordinate Geometry and Curve Sketching
Applications, suggested activities and sample questions
i) Distance, gradient and midpoint
Students could:
◊ verify the distance formula by finding the length of the hypotenuse of a right-angled triangle, eg the hypotenuse of a triangle formed by joining the points(0,0), (3,0), (0,4)
◊ find two points on the number plane that are 5 units apart
◊ find the distance between two points that lie in a horizontal or vertical linewithout using the distance formula
◊ explain the midpoint formula
◊ estimate the gradient of a line from a graph
◊ describe what ‘gradient’ means. When will a line have a negative gradient?
◊ find the length, midpoint and gradient of the interval joining any two points, eg(–1,3) to (2,7)
◊ answer questions like:a) find two possible points which would form an interval with a gradient of 2.
Find the equation of the line. Compare your equation with other students’equations and discuss any observations which you can make
b) the equation of a line is 3x + 2y + 6 = 0. Write down everything you canabout this line.
203
Intermediate Course — Core
9 6 2 0 0 I n t M a t h s 9 - 1 0 p t 2 1 0 / 9 / 9 6 4 : 2 6 P M P a

Option 6: Coordinate Geometry and Curve Sketching
Content
ii) Equation of a straight line
Learning experiences should provide students with the opportunity to:
• describe the equation of a line as a relationship between the x and y coordinatesof any point on the line
• find the equation of a line passing through a point with a given gradient using:
y = mx + b
y - y1 = m(x - x1)
• find the equation of a line passing through two points
• recognise and find the equation of a line in the general form ax + by + c = 0.
iii) Parallel and perpendicular lines
Learning experiences should provide students with the opportunity to:
• explain that two lines are parallel if their gradients are equal
• describe two lines as perpendicular if the product of their gradients is –1
• find the equation of a line that is parallel or perpendicular to a given line.
204
Mathematics Years 9–10 Syllabus — Intermediate Course
9 6 2 0 0 I n t M a t h s 9 - 1 0 p t 2 1 0 / 9 / 9 6 4 : 2 6 P M P a

Option 6: Coordinate Geometry and Curve Sketching
Applications, suggested activities and sample questions
ii) Equation of a straight line
Students could:
◊ recognise equations which result in the graph of a straight line from a list ofequations
◊ describe the equation of a line given the gradient and a point on the line, eggradient of – and x-intercept –3
◊ find the equation of the line joining pairs of points, eg (3,–5) and (–1,4)
◊ draw three lines through the point (1,3) and write down the equations
◊ draw four lines with a gradient of and write down the equations
◊ rearrange equations like y = + 5 in the form ax + by + c = 0
◊ rearrange equations like 3x – 2y + 6 = 0 to the form y = mx + b, read off thegradient and y-intercept and graph the line.
iii) Parallel and perpendicular lines
Students could:
◊ investigate conditions for lines to be parallel or perpendicular
◊ answer questions like: on the number plane, draw a series of lines that areparallel and find the gradient of each line. What do you notice about thegradients?
◊ answer questions like:a) find the equations of the lines that are parallel/perpendicular to y = 5x + 3
and pass through the point (2,5)b) the line through (1,2) and (4,6) is met by another line that is perpendicular to
it. Give the general form for the equation of the second line.
◊ discuss the equations of graphs that can be superposed by a translation orreflection through the y-axis onto each other, eg consider the graphs y = 2x, y = –2x and y = 2x + 1 and describe the transformation that would superposeone graph onto the other.
x2
13
12
205
Intermediate Course — Core
9 6 2 0 0 I n t M a t h s 9 - 1 0 p t 2 1 0 / 9 / 9 6 4 : 2 6 P M P a
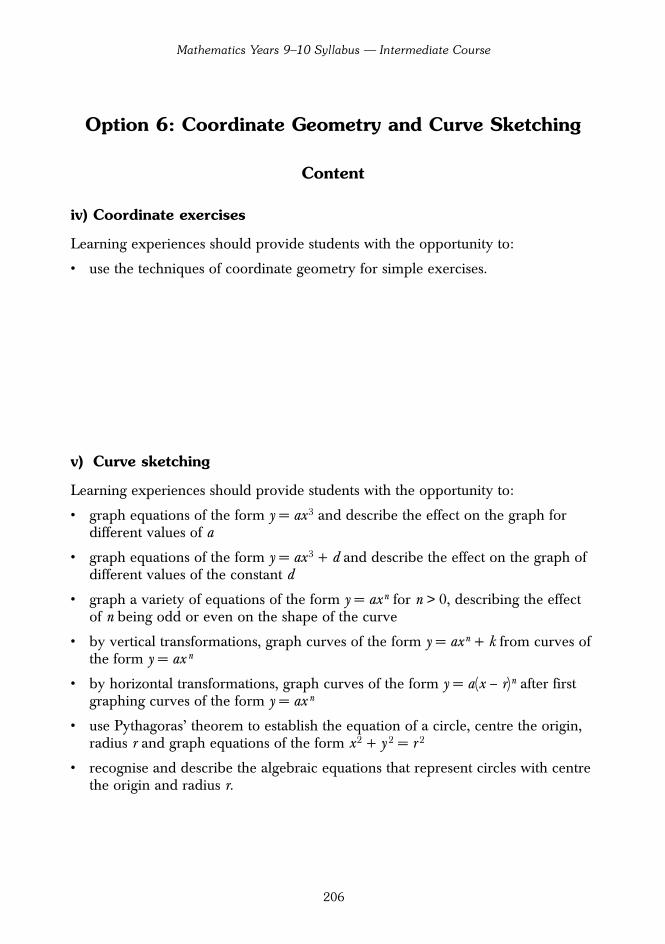
Option 6: Coordinate Geometry and Curve Sketching
Content
iv) Coordinate exercises
Learning experiences should provide students with the opportunity to:
• use the techniques of coordinate geometry for simple exercises.
v) Curve sketching
Learning experiences should provide students with the opportunity to:
• graph equations of the form y = ax3 and describe the effect on the graph fordifferent values of a
• graph equations of the form y = ax3 + d and describe the effect on the graph ofdifferent values of the constant d
• graph a variety of equations of the form y = axn for n > 0, describing the effectof n being odd or even on the shape of the curve
• by vertical transformations, graph curves of the form y = axn + k from curves ofthe form y = ax n
• by horizontal transformations, graph curves of the form y = a(x – r)n after firstgraphing curves of the form y = ax n
• use Pythagoras’ theorem to establish the equation of a circle, centre the origin,radius r and graph equations of the form x2 + y 2 = r 2
• recognise and describe the algebraic equations that represent circles with centrethe origin and radius r.
206
Mathematics Years 9–10 Syllabus — Intermediate Course
9 6 2 0 0 I n t M a t h s 9 - 1 0 p t 2 1 0 / 9 / 9 6 4 : 2 6 P M P a

207
Intermediate Course — Core
Option 6: Coordinate Geometry and Curve Sketching
Applications, suggested activities and sample questions
iv) Coordinate exercises
Students could:◊ show that the triangle formed by joining the points (0,0), (2,3), (4,0) is isosceles◊ find the length of an altitude and the area of the triangle, given the vertices of
an isosceles triangle◊ draw any quadrilateral on the number plane, join the midpoints of each side
and find out everything they can about the new quadrilateral that has beenformed
◊ use the vertices of the rectangle (0,0), (5,0) (5,3) and (0,3) to investigate theproperties of the diagonals of rectangles
◊ answer questions like: if a parallelogram has vertices (0,0), (4,0) and (1,3), find apossible fourth vertex.
v) Curve sketching
Students could:◊ sketch y = x 3 and consider questions like:
a) what happens to the value of y as x becomes very large or very small?b) what happens near and at x = 0?c) is there a y value for every x value? Is there an x value for every y value?
◊ from the sketch of the curves represented by y = x2, sketch the curverepresented by y = (x – 2)2, y = (x – 1)2, y = (x + 4)2, y = (x – 1.5)2 and describethe effect on the graph of y = x 2 of the constant a when y = (x – a)2
◊ sketch y = x3 and hence the curve y = x3 – 3 and y = (x – 3)3
◊ investigate the graphs of y = x4, y = x4 + 1, y = x4 – 1, y = (x – 2)4, y = (x + 3)4
◊ using Pythagoras’ theorem, investigate the equation representing all points thatare 3 units from the origin
◊ show that the coordinates of all points on the circle, centre the origin and radius2, satisfy the equation x 2 + y 2 = 4
◊ recognise the equation for circles with centre the origin from a list of equations◊ from the graph of a circle with centre the origin, describe the equation◊ by translation or Pythagoras’ theorem, investigate the equation that represents
all points that are 2 units from the point (2,–3)◊ recognise equations like x 2 + y 2 = 16 as equations representing circles and
describe the centre and radius for each.
9 6 2 0 0 I n t M a t h s 9 - 1 0 p t 2 1 0 / 9 / 9 6 4 : 2 6 P M P a

9 6 2 0 0 I n t M a t h s 9 - 1 0 p t 2 1 0 / 9 / 9 6 4 : 2 6 P M P a

Option 7: Further Number
Real numbersSurdsIndices
Exponential relationships
Considerations
Students will have been introduced to rational numbers and their representation asterminating or recurring decimals in the core of this course. In this option studentsfurther develop their knowledge of the number system by considering surds. Theylearn to operate with surds and recognise that the results of some operations withsurds result in rational numbers.
Students’ competence with indices is further developed through extending theirunderstanding of fractional indices and relating indices to surds. This option alsoprovides students with experience in exponential relationships and their graphs.
Some areas of this option include specific reference to symbolic application ofnumber concepts. Students will need to be competent with the Number and Algebrastrands from the core of this course to ensure that they have the necessary skills forthese topics.
Students should recognise that surds are irrational numbers and that any decimalrepresentation of a surd is an approximation. They should be happy to leaveanswers in surd form or as approximations, depending on the context and therequirements of the question.
This option relates strongly to Option 5: Further algebra, particularly when studentsare finding the solution of quadratic equations.
209
Intermediate Course — Core
9 6 2 0 0 I n t M a t h s 9 - 1 0 p t 2 1 0 / 9 / 9 6 4 : 2 6 P M P a

Option 7: Further Number
Content
i) Real numbers
Real numbers are represented by points on the number line.
Irrational numbers are real numbers that are not rational.
Some students might benefit from seeing the proof that √2 is irrational in the developmentof their understanding of irrationals.
Learning experiences should provide students with the opportunity to:
• demonstrate understanding that real numbers are represented as points on thenumber line
• demonstrate understanding that real numbers can be expressed in decimal form
• demonstrate understanding that not all real numbers are rational
• use compasses and a straight edge to construct simple rationals and surds on thenumber line.
210
Mathematics Years 9–10 Syllabus — Intermediate Course
9 6 2 0 0 I n t M a t h s 9 - 1 0 p t 2 1 0 / 9 / 9 6 4 : 2 6 P M P a

211
Intermediate Course — Core
Option 7: Further Number
Applications, suggested activities and sample questions
i) Real numbers
Students could:
◊ investigate how many real numbers are represented by points on the numberline between any two points
◊ write a variety of real numbers (fractions, percentages, ratios, integers, surds, π)as decimals or decimal approximations
◊ place rational and irrational numbers on the number line by estimation
◊ investigate the history of the calculation of π
◊ choose integers, rationals and irrationals from a list of reals, eg 5, –2.7, , ,3 × 104, 26%, π, 2:3, , , , ,
◊ construct , , , and othersimple surds on the number line
◊ place π on a number line by rolling a coin along the number line that has unitsequal to the diameter of the coin
◊ check that arithmetic operations involving irrational numbers do not alwaysresult in irrational numbers (eg )
◊ discuss how to construct and on the number line.3 22 2
3 × 12
,– 26,3,2
,5 50
2– 100
2,, 93839
725
24.5̇
9 6 2 0 0 I n t M a t h s 9 - 1 0 p t 2 1 0 / 9 / 9 6 4 : 2 6 P M P a

Option 7: Further Number
Content
ii) Surds
Learning experiences should provide students with the opportunity to:
• use the following results for x, y > 0:
= x = , = . or × ,
• use the four operations of addition, subtraction, multiplication and division tosimplify surds
• rationalise the denominator of surds of the form
• demonstrate understanding that is undefined when x < 0, = 0 when x = 0, and is the positive square root when x > 0.x
xx
a b
c d
x
y= x
yyxyxxyx2x( )2
212
Mathematics Years 9–10 Syllabus — Intermediate Course
9 6 2 0 0 I n t M a t h s 9 - 1 0 p t 2 1 0 / 9 / 9 6 4 : 2 6 P M P a
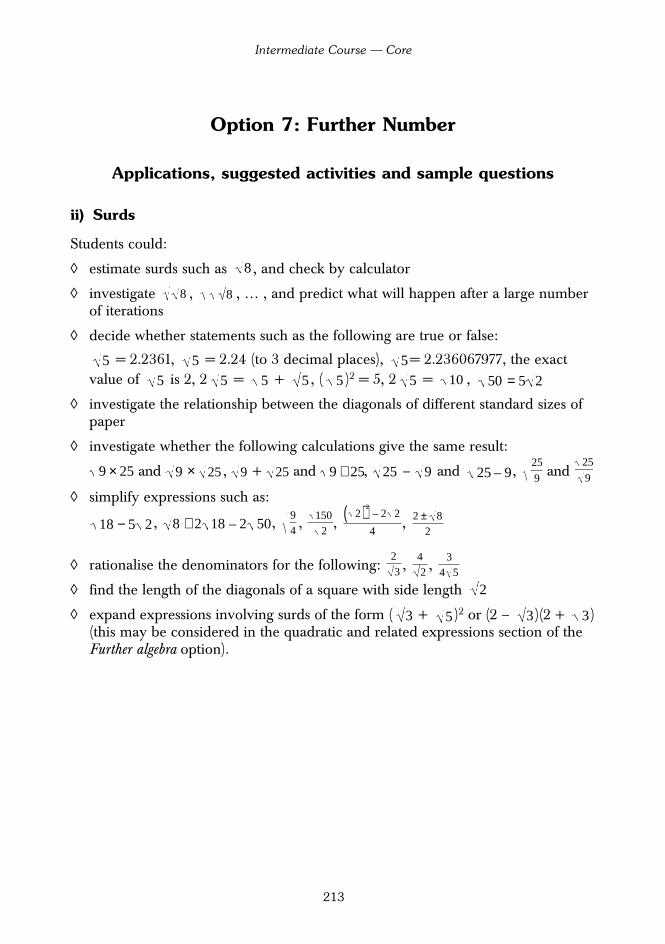
Option 7: Further Number
Applications, suggested activities and sample questions
ii) Surds
Students could:
◊ estimate surds such as , and check by calculator
◊ investigate , , … , and predict what will happen after a large numberof iterations
◊ decide whether statements such as the following are true or false:
= 2.2361, = 2.24 (to 3 decimal places), = 2.236067977, the exactvalue of is 2, 2 = + , ( )2 = 5, 2 = ,
◊ investigate the relationship between the diagonals of different standard sizes ofpaper
◊ investigate whether the following calculations give the same result:
and × , + and , – and , and
◊ simplify expressions such as:
, , , , ,
◊ rationalise the denominators for the following: , ,
◊ find the length of the diagonals of a square with side length
◊ expand expressions involving surds of the form ( + )2 or (2 – )(2 + )(this may be considered in the quadratic and related expressions section of theFurther algebra option).
3353
2
34 5
42
23
2 ± 82
2( )2– 2 2
4
1502
948 + 2 18 – 2 5018 − 5 2
25
9
25
925 – 99259 + 252592599 × 25
50 = 5 210555555555
88
8
213
Intermediate Course — Core
9 6 2 0 0 I n t M a t h s 9 - 1 0 p t 2 1 0 / 9 / 9 6 4 : 2 6 P M P a

Option 7: Further Number
Content
iii) Indices
Learning experiences should provide students with the opportunity to:
• use the index laws to define fractional indices
• translate expressions in surd form to expressions in index form and vice versa
• solve algebraic problems involving indices.
iv) Exponential relationships
Learning experiences should provide students with the opportunity to:
• generate exponential relationships arising from practical problems
• use tables and graphs to describe relationships of the form y = a x (where a and xare positive integers)
• describe the features of the graph of y = a x (where a and x are positive integers),including discussion of intercepts and asymptotes.
214
Mathematics Years 9–10 Syllabus — Intermediate Course
9 6 2 0 0 I n t M a t h s 9 - 1 0 p t 2 1 0 / 9 / 9 6 4 : 2 6 P M P a

215
Intermediate Course — Core
Option 7: Further Number
Applications, suggested activities and sample questions
iii) Indices
Students could:
◊ use index rules to simplify expressions like:
◊ write , … as expressions with fractional indices and discussthe pattern
◊ use index rules to explain why
◊ write expressions like , in index form and simplify if possible
◊ write expressions like , , … without fractional indices and simplify
◊ find values of a and b given that (xa)3b = x
◊ explain why =
◊ find some values that x, p and q could take if = 2
◊ solve problems like: a sheet of A4 paper is folded in half, forming two regions.This folding is repeated as many times as possible. Investigate how the numberof regions increases for each new fold and generalise the number of regions forn folds.
iv) Exponential relationships
Students could:
◊ investigate the number of creases formed by repeatedly folding a piece of paperin half, set up a table of values, sketch the relationship and find a rule whichrelates the number of times it is folded to the number of creases. Use the rule topredict the number of creases after 15 folds
◊ graph the relationships y = 2x, y = 3x and describe the curves, considering the y-intercepts and what happens as x becomes very large (positive) and when x isnegative.
xp
q
2 28 = 23
2 = 2( )3= 23
82
3321
5
p4x
18 = 3 2
52 , 53 , 54 , 555
811
4 × 811
4 × 811
4 × 811
4
9 6 2 0 0 I n t M a t h s 9 - 1 0 p t 2 1 0 / 9 / 9 6 4 : 2 6 P M P a

9 6 2 0 0 I n t M a t h s 9 - 1 0 p t 2 1 0 / 9 / 9 6 4 : 2 6 P M P a

Option 8: Further Probability
ProbabilityProbability problems with compound events
Considerations
Students will have been introduced to probability in the core of this course. Thisintroduction involved an experimental approach and was restricted to probabilityof one-stage events. The first section of this option is a review of theoreticalprobability to ensure that students are confident with assigning probabilities to one-stage events and can calculate probability for complementary events.
Through this option, students should become more competent with theoreticalprobability for one-stage events. Students could further develop the concept ofprobability by exploring games and activities involving chance, using computersand calculators for counting, random number generation and simulation whereappropriate.
This option takes probability further so that students have experience with two-stage events and learn to organise their information about events into treediagrams or organised lists. Students should find probabilities for two-stage eventsfrom lists or tree diagrams which describe the whole sample for a fairly smallnumber of outcomes. The notion of independent events should be discussed sothat students have an understanding that for two or more events which areindependent, the occurrence or non-occurrence of one in no way affects theoccurrence or non-occurrence of the others. It is not the intention of this optionthat students will use the multiplication rules for the probability of independent ordependent events.
217
Intermediate Course — Core
9 6 2 0 0 I n t M a t h s 9 - 1 0 p t 2 1 0 / 9 / 9 6 4 : 2 6 P M P a

Option 8: Further Probability
Content
i) Probability
Learning experiences should provide students with the opportunity to:
• express probabilities using fractions, decimals and percentages
• use published data to assign probabilities to events
• solve probability problems by reasoning about complementary events.
218
Mathematics Years 9–10 Syllabus — Intermediate Course
9 6 2 0 0 I n t M a t h s 9 - 1 0 p t 2 1 0 / 9 / 9 6 4 : 2 6 P M P a

219
Intermediate Course — Core
Option 8: Further Probability
Applications, suggested activities and sample questions
i) Probability
Students could:
◊ find the probability of events such as drawing an ace from a deck of playing cards
◊ make up some probability questions for a particular situation, eg: what is theprobability of choosing a mathematics workbook from a stack of similarworkbooks? They could swap questions with another person in the group. Oncethe questions are completed, they could discuss the solutions
◊ comment critically on statements involving probability, eg since there are 10digits in the number system, the probability that a person who lives locally hasa phone number that starts with 9 is one in 10
◊ answer questions like: a) what is the probability of not selecting a prime number in a random
selection of a number from 1 to 20?b) what is the probability that a number chosen at random between 1 and 100
inclusive is i) divisible by 5 ii) not divisible by 5 iii) not divisible by 6?
9 6 2 0 0 I n t M a t h s 9 - 1 0 p t 2 1 0 / 9 / 9 6 4 : 2 6 P M P a

Option 8: Further Probability
Content
ii) Probability problems with compound events
Learning experiences should provide students with the opportunity to:
• distinguish informally between dependent and independent events
• describe all possible outcomes for two-stage events by constructing organisedlists, tables and/or tree diagrams
• simulate two-stage probability experiments that include sampling with andwithout replacement
• assign probabilities to compound events based on information from a table,diagram or graph
• solve probability problems involving two independent events.
220
Mathematics Years 9–10 Syllabus — Intermediate Course
9 6 2 0 0 I n t M a t h s 9 - 1 0 p t 2 1 0 / 9 / 9 6 4 : 2 6 P M P a

Option 8: Further Probability
Applications, suggested activities and sample questions
ii) Probability problems with compound events
Students could:
◊ discuss efficient ways of describing all possible outcomes, eg using a list, table,or tree diagram to decide the total number of ways of matching threephotographs of babies to three adults
◊ consider an experiment involving two stages, eg drawing two counters from abag containing three blue, four red and one white counter, write down thesample space and find the probability of an event such as obtaining two bluecounters
◊ discuss the implications of probability in games of chance involving more thanone stage
◊ make up a game of chance that is unfair, explain why it is unfair, and thenmodify it to ensure fairness in the long term
◊ identify dependent and independent pairs of events from a selection of pairs, eg– a person wearing glasses and a person having big feet– a person who works hard and a person who succeeds in their career– a pair of fours rolled with two dice and an ace of hearts drawn from a pack
of cards
◊ give examples of independent events and dependent events
◊ discuss questions like: a) the four children in a family are all boys. What is the probability that the
next child will be a boy?b) a die is rolled twice and the numbers added. What events will give a
probability of ?
◊ use technology to generate random numbers and hence simulate two-stageprobability experiments
◊ use a two-way table to assign probabilities, eg the table here represents data collected on 300 athletes and compares height withweight. Use the table to find the probabilityof choosing a light, short athlete from this population given that all people have the same chance of being chosen.
HeavyHeight
WeightLight
TallShort
70 50
20160
120 180
90210
300
19
221
Intermediate Course — Core
9 6 2 0 0 I n t M a t h s 9 - 1 0 p t 2 1 0 / 9 / 9 6 4 : 2 6 P M P a

222
Mathematics Years 9–10 Syllabus — Intermediate Course
9 6 2 0 0 I n t M a t h s 9 - 1 0 p t 2 1 0 / 9 / 9 6 4 : 2 6 P M P a