mathematics 41c - exeter...mathematics 41c mathematics department phillips exeter academy exeter, nh...
TRANSCRIPT
Mathematics 41C
Mathematics DepartmentPhillips Exeter Academy
Exeter, NHAugust 11 2017

Problem Set 1 Math 41C
1. Big Red Taxi charges a fixed amount of $2.40 plus $3.10 per mile. Big Blue Taxi onlycharges for mileage at a rate of $3.50 per mile. Write equations expressing the amountof the fare as a function of the distance traveled for each of the cabs, and sketch graphsof the functions on the same set of axes. What is common to these two functions?What is different? What can you say about the rate of change of each fare function?
2. A college savings account grows at an annual rate of 4.5%. Write an equation expressingthe amount in the account t years after an initial deposit of $5000.00, and obtain agraph of the function. Compare this function with the functions in number 1. Howare they similar? How are they different? [Hint: consider what is constant in eachfunction.]
3. A function f is called even if it has the property that f(−x) = f(x) for all x-valuesin the domain. What does this property tell us about the appearance of the graph ofy = f(x) ? Show that C(x) = 2x+2−x
2is an even function. Give other examples of even
functions.
4. A function f is called odd if it has the property that f(−x) = −f(x) for all x-valuesin the domain. What does this property tell us about the appearance of the graphy = f(x)? Show that C(x) = 2x−2−x
2is an odd function. Give other examples of odd
functions.
August 11 2017 1 Phillips Exeter Academy
Problem Set 1 Math 41C
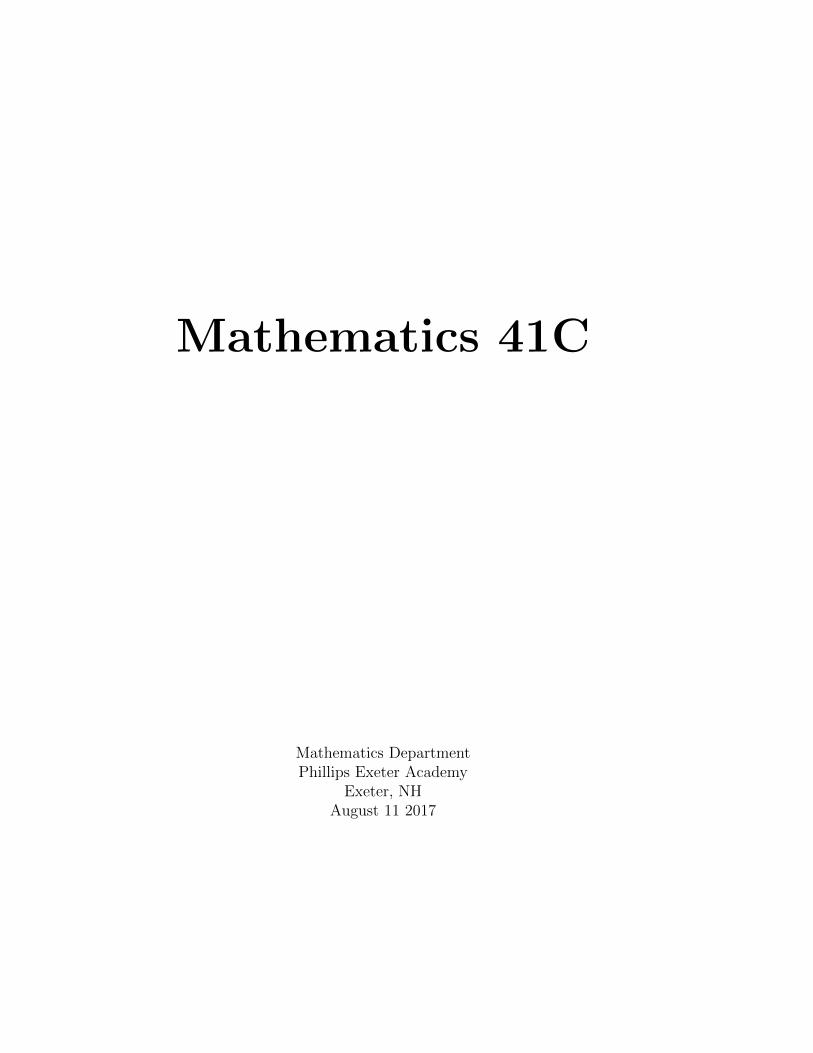
5. Choose from the following equations: y = x2, y = x3, y = x5, y = x4, y = −x,y = x,y =
√x, y = 1
x, y = sin(x), y = cosx, y = tan(x), y = x1/3 and y = log(x) to
describe each of the graphs below.
−4 −3 −2 −1 1 2 3 4
−4
−3
−2
−1
1
2
3
4
x
y
Function A
−4 −3 −2 −1 1 2 3 4
−4
−3
−2
−1
1
2
3
4
x
y
Function B
−4 −3 −2 −1 1 2 3 4
−4
−3
−2
−1
1
2
3
4
x
y
Function C
−4 −3 −2 −1 1 2 3 4
−4
−3
−2
−1
1
2
3
4
x
y
Function D
−4 −3 −2 −1 1 2 3 4
−4
−3
−2
−1
1
2
3
4
x
y
Function E
−4 −3 −2 −1 1 2 3 4
−4
−3
−2
−1
1
2
3
4
x
y
Function F
August 11 2017 2 Phillips Exeter Academy
Problem Set 1 Math 41C
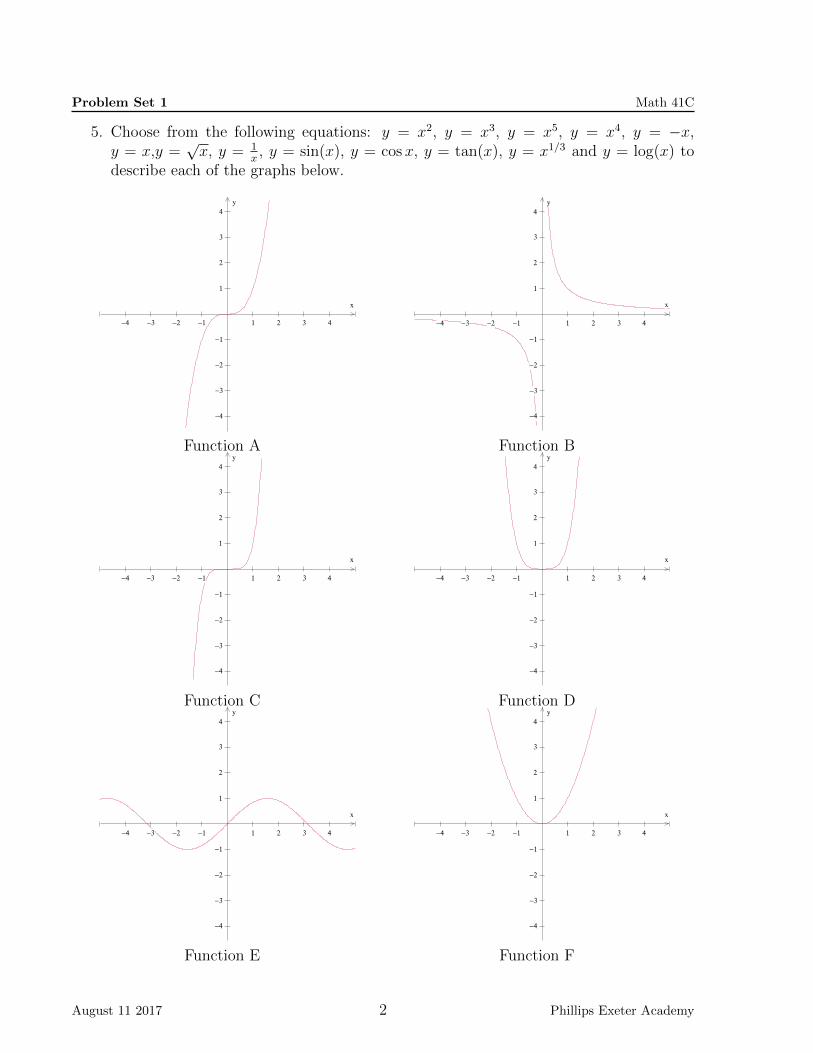
6. Choose from the following equations: y = x2, y = x3, y = x5, y = x4, y = −x,y = x,y =
√x, y = 1
x, y = sin(x), y = cosx, y = tan(x), y = x1/3 and y = log(x) to
describe each of the graphs below.
−1 1 2 3 4 5
−4
−3
−2
−1
1
2
3
x
y
Function A
−1 1 2 3 4 5
−4
−3
−2
−1
1
2
3
x
y
Function B
−4 −3 −2 −1 1 2 3 4
−4
−3
−2
−1
1
2
3
4
x
y
Function C
−4 −3 −2 −1 1 2 3 4
−4
−3
−2
−1
1
2
3
4
x
y
Function D
−4 −3 −2 −1 1 2 3 4
−4
−3
−2
−1
1
2
3
4
x
y
Function E
−4 −3 −2 −1 1 2 3 4
−4
−3
−2
−1
1
2
3
4
x
y
Function F
August 11 2017 3 Phillips Exeter Academy

Problem Set 1 Math 41C
7. The graph of y = f(x) is shown below. Write an equation for each of the followinggraphs in terms of f(x). For instance, a possible answer could look like y = f(x+2)+3.
−4 −3 −2 −1 1 2 3 4 5 6 7 8 9
−6
−5
−4
−3
−2
−1
1
2
3
4
5
6
x
y
y = f(x)
−4 −3 −2 −1 1 2 3 4 5 6 7 8 9
−6
−5
−4
−3
−2
−1
1
2
3
4
5
6
x
y
Function A
−4 −3 −2 −1 1 2 3 4 5 6 7 8 9
−6
−5
−4
−3
−2
−1
1
2
3
4
5
6
x
y
Function B
−4 −3 −2 −1 1 2 3 4 5 6 7 8 9
−6
−5
−4
−3
−2
−1
1
2
3
4
5
6
x
y
Function C
−9 −8 −7 −6 −5 −4 −3 −2 −1 1 2 3 4
−6
−5
−4
−3
−2
−1
1
2
3
4
5
6
x
y
Function D
August 11 2017 4 Phillips Exeter Academy
Problem Set 1 Math 41C
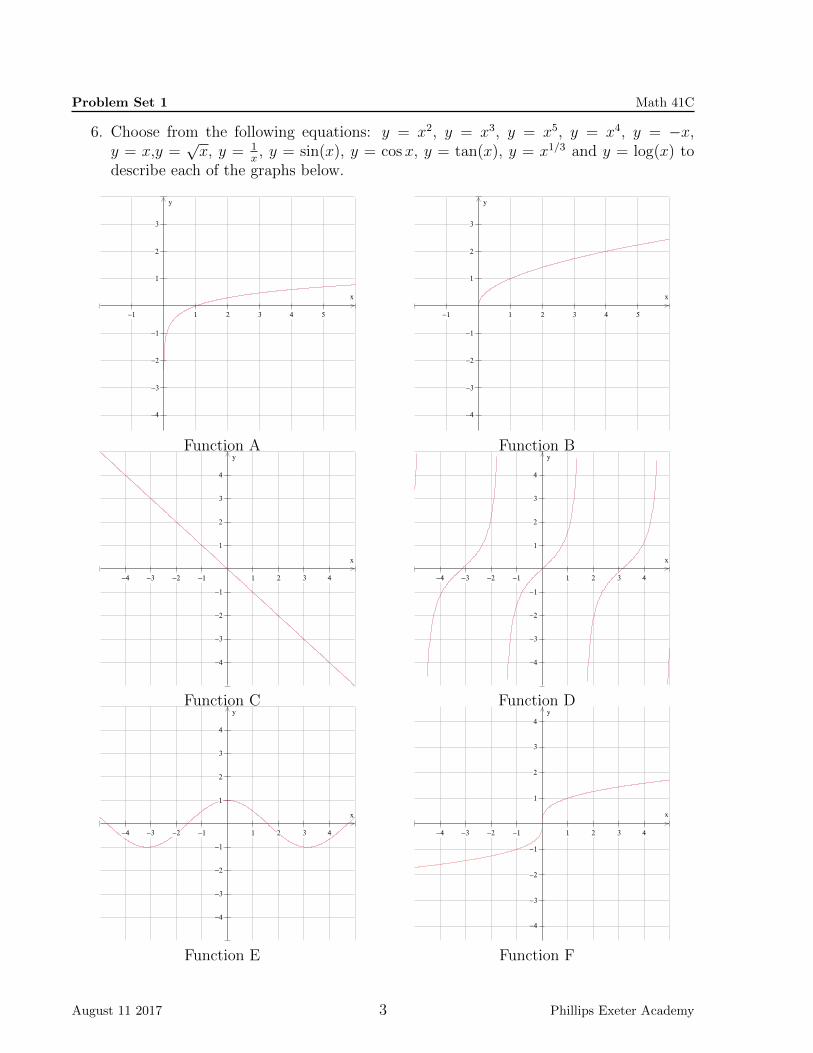
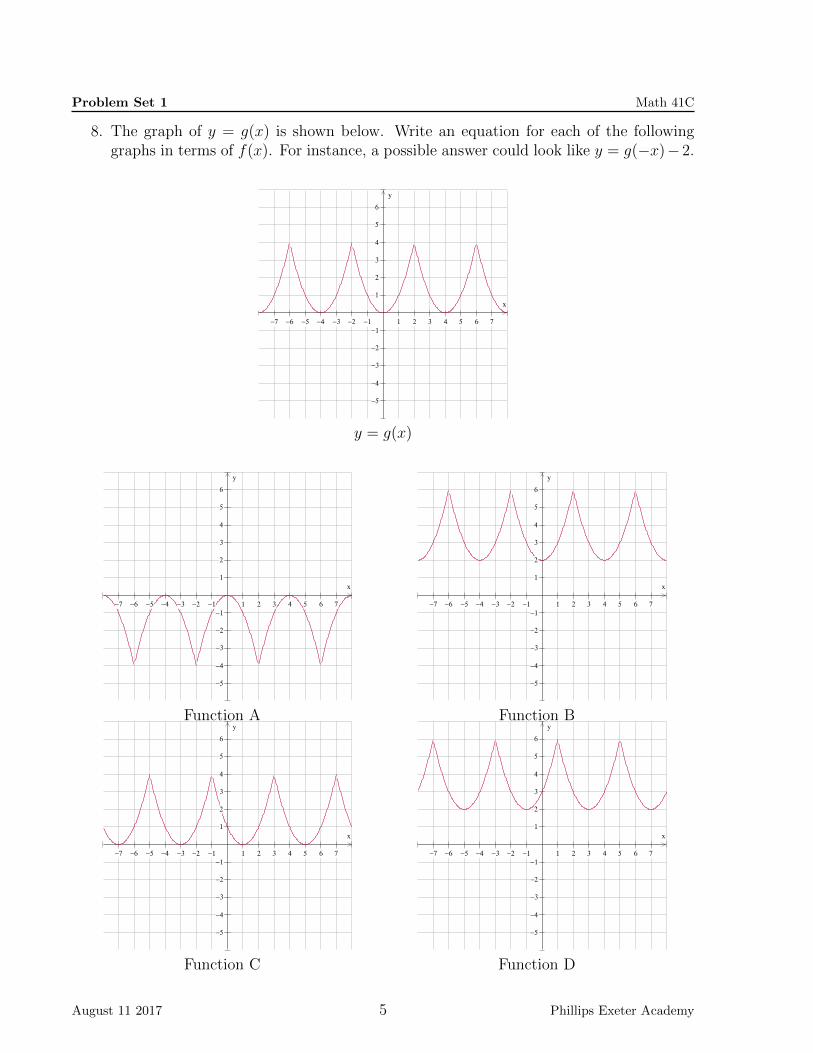
8. The graph of y = g(x) is shown below. Write an equation for each of the followinggraphs in terms of f(x). For instance, a possible answer could look like y = g(−x)− 2.
−7 −6 −5 −4 −3 −2 −1 1 2 3 4 5 6 7
−5
−4
−3
−2
−1
1
2
3
4
5
6
x
y
y = g(x)
−7 −6 −5 −4 −3 −2 −1 1 2 3 4 5 6 7
−5
−4
−3
−2
−1
1
2
3
4
5
6
x
y
Function A
−7 −6 −5 −4 −3 −2 −1 1 2 3 4 5 6 7
−5
−4
−3
−2
−1
1
2
3
4
5
6
x
y
Function B
−7 −6 −5 −4 −3 −2 −1 1 2 3 4 5 6 7
−5
−4
−3
−2
−1
1
2
3
4
5
6
x
y
Function C
−7 −6 −5 −4 −3 −2 −1 1 2 3 4 5 6 7
−5
−4
−3
−2
−1
1
2
3
4
5
6
x
y
Function D
August 11 2017 5 Phillips Exeter Academy

Problem Set 1 Math 41C
9. After being dropped from the top of a tall building, the height of an object is describedby h(t) = 400− 16t2.
(a) Sketch a graph that shows the height on the vertical axis and time on the horizon-tal axis. Pay attention to the scale. Lable the h-intercept A and the t-interceptB.
(b) Draw line segment AB and find its slope. What does the slope of AB tell youabout the falling object?
(c) Let C be the point when t = 2 and D be the point when t = 2.1, and draw theline segment CD. What does the slope of CD tell you about the falling object?
(d) If the height of the object dropped from the tall building were given by H(t) =450 − 16t2 instead of h(t) = 400 − 16t2 how would your answers to (b) and (c)change, if at all?
10. Let g(x) = x+ 32−x and f(x) = 3x+ 4x2.
(a) Use algebra to find simplified expressions for g(x+1), g(5−x), f(2x) and f(2x−1).
(b) use algebra to solve f(x) = 0, g(x) = 1, f(x− 1) = 5 and g(x+ 1) = 2.
11. How many solutions are there to the equation x2 = 2x? Find all of them.
12. (Continuation) From the solutions, which x-value is largest? Which is largest forx2 = 1.5x? What about x2 = 1.1x?
13. Suppose we compare the graphs of y = x2 and y = 1.01x. The first is a parabola,and the second is an exponential function with a growth rate of 1%. Which functionis greater for x = 100? x = 1000? x = 10, 000? Based on these observations, whichfunction grows faster in the long run?
14. (Continuation) Make a conjecture about which is the faster growing function: a powerfunction y = xn, where n is a positive integer, or y = bx where b > 1.
15. Which is best, to have money in a bank that pays 9 percent annual interest, one thatpays 9/12 percent monthly interest, or one that pays 9/365 percent daily interest? Abank is said to compound its annual interest when it applies a fraction of its annualinterest to a fraction of a year.
16. (Continuation) Inflation in the country of Syldavia has reached alarming levels. Manybanks are paying 100 percent annual interest, some banks are paying 100/12 percentmonthly interest, a few are paying 100/365 percent daily interest, and so forth. Tryingto make sense of all of these promotions, Milou decides to graph the function E, givenby E(x) =
(1 + 1
x
)x. What does this graph reveal about the sequence vn = E(n) =(
1 + 1n
)n, where n is a positive integer? Calculate the specific values: v1, v12, v365 and
v31536000.
August 11 2017 6 Phillips Exeter Academy

Problem Set 1 Math 41C
17. (Continuation) The sequence in the previous problem has a limiting value. This se-quence is so important that a special letter is reserved for the limiting value (as isdone for π). We write e = limn→∞
(1 + 1
n
)n. The limn→∞ means ”as n approaches
∞” or ”as n gets very large”. For some additional work with this sequence, use yourcalculator to evaluate limn→∞
(1 + 0.09
n
)n. Make up a story to go with the question.
August 11 2017 7 Phillips Exeter Academy

Laboratory 1: Finite Differences Math 41C
1. (a) Make a table of values where column 1 is x = 0, 1, 2, . . . , and y = x2 by filling inthe second column in the chart shown below.
x y = x2 Diff1 Diff2
0 0 1 21 1 32 43456
(b) Fill in the third column in the table by recording difference between successivey-values. Is there a pattern to the column of differences? Do the values in thiscolumn fit a linear function? Explain. As a check, fill in the fourth column thatshows the differences of the differences, also known as second differences. Howdoes this column relate to the linear function you found for the first differences?
(c) What is a simple formula for the sum of the first n odd numbers?
2. Carry out the same calculations as in number 1, but replace y = x2 with a quadraticequation y = ax2 + bx + c, where you choose the coefficients a, b and c. Is the newcolumn of first differences linear? Share your results with the rest of the class. Fillin the table below from the results of your classmates. How does the number in thesecond differences relate to the coefficient of x2?
a b c Diff2
3. Now set up a table of differences for y = x3. Fill in columns for first, second and thirddifferences. What patterns do you notice? How does this compare with the results forthe quadratic functions you have worked with?
August 11 2017 8 Phillips Exeter Academy
Laboratory 1: Finite Differences Math 41C
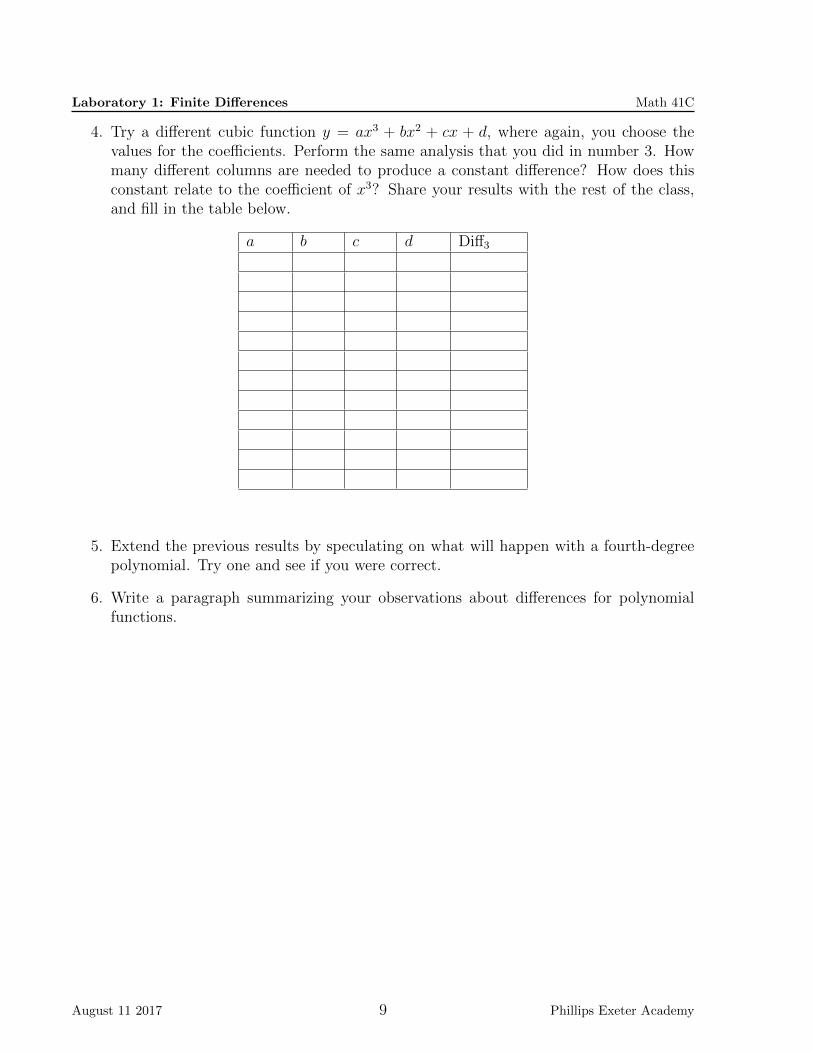
4. Try a different cubic function y = ax3 + bx2 + cx + d, where again, you choose thevalues for the coefficients. Perform the same analysis that you did in number 3. Howmany different columns are needed to produce a constant difference? How does thisconstant relate to the coefficient of x3? Share your results with the rest of the class,and fill in the table below.
a b c d Diff3
5. Extend the previous results by speculating on what will happen with a fourth-degreepolynomial. Try one and see if you were correct.
6. Write a paragraph summarizing your observations about differences for polynomialfunctions.
August 11 2017 9 Phillips Exeter Academy
Problem Set 2 Math 41C
1. Using a strategy like the one you used in Lab 1, create a table of differences for thefunction y = 2x. You should see that the difference of consecutive y-values neverbecomes 0, but does behave in a predictable way. Repeat for y = x3 and y = 1.2x.Describe how differences for an exponential function behave compared to differencesfor a polynomial function.
2. Given a function f , each solution of the equation f(x) = 0 is called a zero of f . Withoutusing a calculator, find the zeros of each function.
a. s(x) = sin(3x) b. L(x) = log5(x− 3) c. r(x) =√
2x+ 5 d. p(x) = x3 − 4x
3. The zeros of the function Q are −4, 5 and 8. Find the zeros of the given functions.
a. f(x) = Q(4x) b. t(x) = Q(x− 3) c. k(x) = Q(2x− 5) d. j(x) = 3Q(x+ 2)
4. Suppose we know the following about the function f(x). The domain is −10 ≤ x ≤ 15,the range is −20 ≤ y ≤ 15, the x-intercepts are at x = −1 and x = 7, the y-interceptis at y = 10. For each function, identity the domain, the range, and x-intercepts andthe y-intercept, if possible. If there is not enough information to identify any feature,explain why this is the case.
a. g(x) = −2f(2x) b. m(x) = f(x+5)−1 c. k(x) = f(2−x) d. t(x) = f(2x)+6
5. The point (4, 16) is on the graph of f(x) = x2. Treating (x, x2) as an arbitrary pointon the graph of f(x) = x2, the fraction x2−16
x−4represents the slope between two points
on the graph. Find the value of the slope when x is close to 4. How does the slopebehave as x gets closer and closer to 4? Repeat for the point (−4, 16).
6. The point A(0, 1) is on the graph of f(x) = 2x. If B(x, 2x) is any other point on thegraph of f(x) = 2x, then the fraction 2x−1
x−0represents the slope between the two points
A and B on the graph. Find the value of the slope when x is close to 0. How does theslope behave as x gets closer and closer to 0?
7. The first few terms of the Fibonacci sequence are 1, 1, 2, 3, 5, 8, 13, . . . , and each suc-cessive term is the sum of the two previous terms. Make a table of differences for thissequence. What patterns do you notice in the first differences? The second differences?And so on?
8. We have now discussed problems with differences and slopes for various functions.These problems are actually about rates of change, specifically how a function changeswith respect to its independent variable. The change of a function can be thought ofas another function, which for now, we will call the rate-of-change function. Use yourexperience and intuition to respond to the following:
(a) Describe the rate of change for y = 3x+ 1? Describe the rate-of-change functionfor any linear function?
(b) Describe the rate-of-change function for a parabola.
(c) Describe the rate-of-change function for an exponential function.
August 11 2017 10 Phillips Exeter Academy

Problem Set 2 Math 41C
9. Which description matches the graph below?
10. Use the graph to tell the story of Hannah’s water consumption.
11. Use the graph to tell the story of Albert’s gas use over the week.
c©2011 MARS University of Nottingham; http://opi.mt.gov/pdf/CCSSO/InterpTimeDistance.pdf; source for problems 9, 10 and 11.
August 11 2017 11 Phillips Exeter Academy

Problem Set 2 Math 41C
12. Sketch a graph of the rate-of-change function for Tom’s distance from home given thegraph in number 9.
13. Sketch a graph of distance (in miles) from Exeter versus time (in hours) or a car tripyou take on a Sunday afternoon from PEA to Deerfield Academy, which is about 120miles away. Some of the time you will be driving in towns, most of the time you willbe on highways, and you will want to make a stop to eat some lunch about midwaythrough your trip. Next, sketch a graph of the rate-of-change function that correspondsto your distance vs. time graph.
14. The half-life of ibuprofen in the bloodstream is about 2 hours. This means that after 2hours of being consumed, only 100 mg of the 200 mg of ibuprofen taken will remain inthe bloodstream. After another 2 hours (4 hours total) only 50 mg will remain in thebloodstream. A patient is prescribed 200 mg of ibuprofen to be taken every 4 hours.Fill in the following table, which records the amount of ibuprofen in the patient’s bodyhours after the initial dose is consumed.
Elapsed time in hours 0 2 4 6 8 10 12 14 16Mg of ibuprofen in the body 200 100 250
15. Suppose a herd of goats currently number 25. Consider two possible fates of growthfor the herd.
(a) The population increases by 10 goats per year.
(b) The population increases by 20 % per year.
Compare the size of the herd over time for these two growth scenarios.
16. Sketch the graph of a function that has a positive rate of change that is always increas-ing.
17. The graph of y = f(2x − 5) is obtained by applying first a horizontal translationand then a horizontal compression to the graph of y = f(x). Explain. Is it possible toachieve the same result by applying first a horizontal compression and then a horizontaltranslation to the graph of y = f(x)?
18. A driver was overheard saying, ”My trip to New York City was made at 80 kilometersper hour.”Do you think the driver was referring to an instantaneous speed or an averagespeed? What is the difference between these two concepts?
19. (Continuation) Let R(t) denote the speed of the car after t hours of driving. Assumingthat the trip to New York City took exactly five hours, draw a careful graph of aplausible speed function R. It is customary to use the horizontal axis for t and thevertical axis for R. Each point on your graph represents information about the trip; beready to explain the story behind your graph. In particular, the graph should displayreasonable maximum and minimum speeds.
August 11 2017 12 Phillips Exeter Academy

Laboratory 2: Rate of Change From Data Math 41C
1. Consider the following scenarios:
(a) A ball is tossed softly from one person to another, tracing out a curved path thatrises to a maximum height in the middle of the path. There are two componentsto the path –one is the height of the ball above the ground, and the other is thehorizontal distance from the person tossing the ball.
(b) A pendulum starts at a angle of about 60 deg from vertical. There are two compo-nents to the path of the pendulum – one is the height of the pendulum bob abovethe horizontal line through the equilibrium position, and the other is the horizon-tal displacement from equilibrium. (The equilibrium position is the position ofthe pendulum bob at rest.)
(c) A weight is attached to the end of a spring that is suspended from a hook. Whenthe weight is pulled down from its equilibrium position and then released, itoscillates up and down. There is only one component to this path.
You will complete this activity for at least two of the above scenarios, the first one andat least one of the next two: Choose one of scenarios, and think about the shape thata distance versus time graph should have. If you chose a scenario that involves twomotion components, consider the shape of each. Then use the Video Physics app toobtain a graph of the phenomenon described. If you chose a scenario that involves twomotion components, graph both. In addition, obtain a picture of the rate-of-changegraph for each motion.
2. (Continued) Examine the graphs you obtained above and explain the shapes of boththe motion graphs and the associated rate-of-change graphs.
3. The following graph illustrates the temperature of a fresh cup of coffee as it cools.Sketch a graph of the rate-of-change curve of this cooling curve.
−5 5 10 15 20 25 30
50
100
150
200
Time (minutes)
Temperature (F)
August 11 2017 13 Phillips Exeter Academy
Laboratory 2: Rate of Change From Data Math 41C
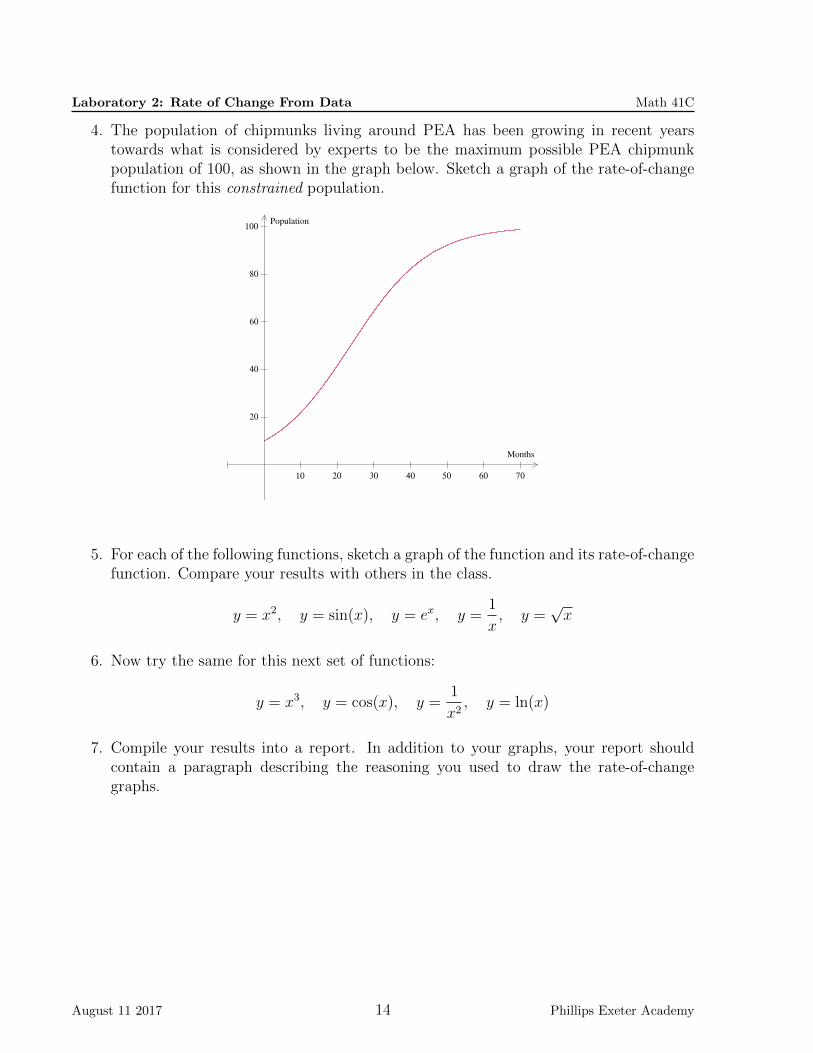
4. The population of chipmunks living around PEA has been growing in recent yearstowards what is considered by experts to be the maximum possible PEA chipmunkpopulation of 100, as shown in the graph below. Sketch a graph of the rate-of-changefunction for this constrained population.
10 20 30 40 50 60 70
20
40
60
80
100
Months
Population
5. For each of the following functions, sketch a graph of the function and its rate-of-changefunction. Compare your results with others in the class.
y = x2, y = sin(x), y = ex, y =1
x, y =
√x
6. Now try the same for this next set of functions:
y = x3, y = cos(x), y =1
x2, y = ln(x)
7. Compile your results into a report. In addition to your graphs, your report shouldcontain a paragraph describing the reasoning you used to draw the rate-of-changegraphs.
August 11 2017 14 Phillips Exeter Academy

Problem Set 3 Math 41C
1. Using a technique similar to what you used in Lab 2, sketch the rate of change functionfor each of the following.
y = arctan (x) y = e−x2
y = 2x
2. The equation V (t) = 8000(0.95)t tells the volume in cubic centimeters of a shrinkingballoon that is losing 5 percent of its helium each day.
(a) Calculate V (0). What does the value tell you about the graph? What does thevalue tell you about the balloon?
(b) Calculate V (10). What does the value tell you about the graph? What does thevalue tell you about the balloon?
(c) Find t so that V (t) = 5000. Describe the balloon at this moment.
(d) Calculate V (14)−V (12)14−12
.What does the value of the fraction tell you about the graph?What does this value tell you about the balloon?
(e) Calculate V (14)−V (13)14−13
. What does this value tell you about the balloon?
5000
t
V
V (t) = 8000(0.95)t
August 11 2017 15 Phillips Exeter Academy

Problem Set 3 Math 41C
3. Two different graphs for y = f(x) are shown. For each, sketch a graph of the reciprocalfunction y = 1
f(x).
−6 −5 −4 −3 −2 −1 1 2 3
−3
−2
−1
1
2
x
y
Function A
−2 −1 1 2 3 4 5
−3
−2
−1
1
2
3
4
5
6
7
x
y
Function B
4. The function g(x) = sec(x) is the secant function and is defined as the reciprocal ofthe cosine function. Similarly, h(x) = csc(x) is the cosecant function and is defined asthe reciprocal of the sine function. Without using technology and working in radians,draw accurate graphs of these two reciprocal functions on the interval −2π ≤ x ≤ 2π.It might help to sketch y = sin(x) and y = cos(x) first.
5. What single word describes a function f that has the property f(x) = f(x + 60) forall values of x?
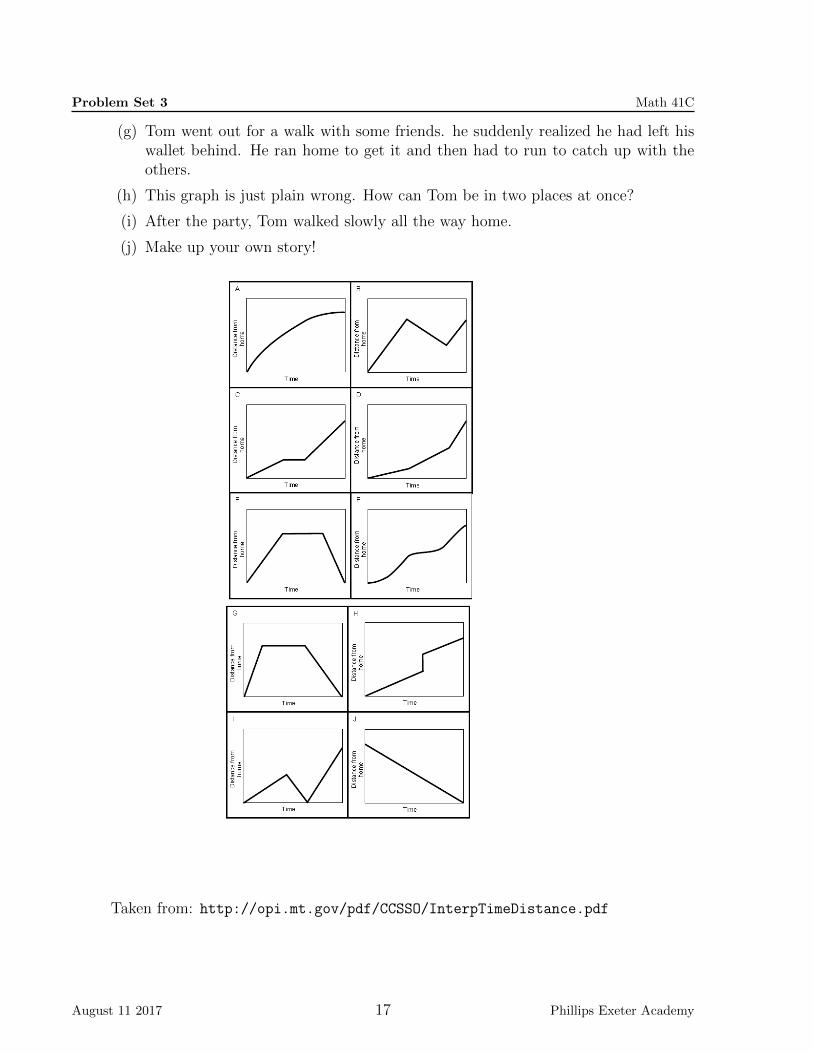
6. Match the following descriptions with the 10 distance vs. time graphs on the followingpage.
(a) Tom ran from his home to the bus stop and waited. He realized that he hadmissed the bus so he walked home.
(b) Opposite Tom’s home is a hill. Tom climbed slowly up the hill, walked across thetop, and then ran quickly down the other side.
(c) Tom skateboarded from his house, gradually building up speed. He slowed downto avoid some rough ground, but then speeded up again.
(d) Tom walked slowly along the road, stopped to look at his watch, realized he waslate, and then started running.
(e) Tom left his home for a run, but he was unfit and gradually came to a stop!
(f) Tom walked to the store at the end of his street, bought a newspaper and thenran all the way back.
August 11 2017 16 Phillips Exeter Academy
Problem Set 3 Math 41C
(g) Tom went out for a walk with some friends. he suddenly realized he had left hiswallet behind. He ran home to get it and then had to run to catch up with theothers.
(h) This graph is just plain wrong. How can Tom be in two places at once?
(i) After the party, Tom walked slowly all the way home.
(j) Make up your own story!
Taken from: http://opi.mt.gov/pdf/CCSSO/InterpTimeDistance.pdf
August 11 2017 17 Phillips Exeter Academy

Problem Set 3 Math 41C
7. Water is flowing into each container at a constant rate. As the volume increases theheight of the water also increases. Match each graph of height versus time with itscontainer.
Taken from: http://www.projectmaths.ie/workshops/WS_4_NR/show_5.pdf
8. When logarithms are calculated using e as the base, they are called natural, and writteny = ln(x) instead of y = loge(x). Graph y = ex and y = ln(x) on the same set of axes.Recall that exponential functions and logarithmic functions with the same base areinverse functions.
(a) Consider the ordered pairs from both curves. How are they related? Hence, howare the functions related?
(b) What are the axis intercepts for the two curves? Find a way to estimate the slopeof the tangent lines to the curves at the intercepts. The slope of the tangent lineto a curve at a point is the slope of the curve at that point.
9. Sketch the graph of a function that has the characteristic that its rate-of-change islinear. How does your graph compare with the graphs of your classmates?
10. Sketch the graph of a function whose rate of change is always positive. Do the samefor a function whose rate of change is always negative. Are your graphs related in anyway?
11. For which of the following functions can it be said f(a+ b) = f(a) + f(b) for all a andb in the domain of the given function?
(a) f(x) = 3x
August 11 2017 18 Phillips Exeter Academy

Problem Set 3 Math 41C
(b) f(x) = −x+ 5
(c) f(x) =√x
(d) f(x) = x2
(e) f(x) = 1x
(f) f(x) = 2x
12. Part of the graph of y = f(x) is shown below. Draw the rest of the graph given
a. f is an even function; b. f is an odd function.
13. Find a function for which f(x+ a) = f(x)f(a) for all numbers x and a.
14. On the graph of y = f(x), it is given that (−2, 5) is the highest point, (2,−7) is thelowest point, and x = −4, x = 1 and x = 3 are the x-intercepts. Find the highest andlowest points on the graph as well as the x-intercepts of the curves.
a. y = 3f(2x) b. y = f(x− 5) + 8.
15. The point (0, 1) is the y-intercept on the graph of y = bx for b > 0. When x is close to0, bx−1
x−0represents the slope of y = bx at its y-intercept. Fill in the missing entries in
the following table.
b Slope of y = bx at its y-intercept0.0750.51.5235.0815
August 11 2017 19 Phillips Exeter Academy

Problem Set 3 Math 41C
16. (Continuation) Make a scatterplot with values of b on the horizontal axis and the valueof the slope of y = bx on the vertical axis. The shape of the scatterplot suggests asimple relationship between the slope and the value of b using a familiar function.
17. (Continuation) What is the slope of y = ex at (0, 1)? How does this value fit withinthe values in the table?
18. Is the graph of k(x) = x− x2 an even function, and odd function, or neither? How doyou know?
19. Is the graph of t(x) = x3 + x an even function, an odd function, or neither? How doyou know?
20. After being dropped from the top of a tall building, the height of an object is describedby h(t) = 400− 16t2, where h(t) is measured in feet and t is measured in seconds.
(a) How many seconds did it take for the object to reach the ground? Use a graphingapp to obtain a graph of height vs. time in a suitable window.
(b) What is the height of the object when t = 2? What is the height of the objectwhen t = 4? Use algebra to obtain an equation for the line that goes through thetwo points you just calculated. Add your line to the graph of height vs. time. Aline that is determined by two points on a curve is known as a secant line.
(c) What is the average rate at which the height of the object is changing between 2and 4 seconds after it is dropped? How does this rate relate to the slope of thesecant line?
21. (Continuation) How fast is the height of the object changing at the instant 2 secondsafter being dropped? Explain why this rate of change is given by the difference quotienth(t)− h(2)
t− 2, where t is a time very close to 2 seconds. Verify that the closer t is to 2,
the closer the rate of change is to −64. We can summarize this situation by writing
limt→2
(h(t)− h(2)
t− 2
)= −64. The notation lim
t→2is read as “the limit as t approaches 2”.
This limit is known as the instantaneous rate of change when t = 2.
22. (Continuation) What is an equation for the tangent line to the curve at the point witht = 2? How is the slope of the tangent related to the instantaneous rate of change atthat point?
(a) Use a graphing app to graph the curve h(t) = 400−16t2 together with the tangentline at t = 2.
(b) Gradually zoom in on the point with t = 2. What do you notice about the curveand the tangent line as you zoom in? Continue zooming in until you can nolonger see a difference between the curve and the tangent line. The appearanceof the curve and the tangent line as being virtually identical on a small intervalrepresents a property of the curve called local linearity.
August 11 2017 20 Phillips Exeter Academy

Problem Set 3 Math 41C
23. (Continuation) Suppose we now drop the object from a taller building, so that theinitial height is 600 ft, thus h(t) = 600 − 16t2. What is the height of the object attime t = 2? Find the instantaneous rate of change of the height at t = 2, and findthe equation of the tangent line to the curve at the point where t = 2. How do youranswers compare with your results for the problem with initial height 400 ft? Explain.
August 11 2017 21 Phillips Exeter Academy

Laboratory 3: From Rate of Change to Derivative Math 41C
1. Using a graphing app to view the function f(x) = sin(x) over an appropriate domain,where x is in radians. (You many change your mind about what is appropriate as youwork through this lab.)
2. Create a new function g(x) where
g(x) =f(x+ 0.001)− f(x)
0.001.
Notice that for a given x-value, g(x) describes the average rate-of-change of f(x) onthe interval [x, x+0.001]. Obtain a graph of g(x). This average rate-of-change functionis an approximation for the instantaneous rate-of-change function, which we call thederivative and often denote f ′(x). This average rate-of-change function can help usboth understand and find an equation for the derivative.
3. (Continuation) Have you seen a function that looks like g(x) before? Make a guess asto which well-known function is the derivative of f(x) = sin(x). Verify or debunk yourguess by graphing it on the same axes as the approximation function g(x).
4. Repeat steps 1 through 3 above for each function in the list:
y = x2, y = x3, y = cos(x), y = ex, y =1
x, y =
1
x2, y = ln(x), y =
√x
Make sure to keep a record of your results including a sketch of each function and itsderivative along with their equations.
5. Write a brief report summarizing what you have learned in this lab. Include a tablelisting all of the function equations and your guess for each derivative. Note anypatterns you see, generalizations you might be willing to make and any result thatsurprised you.
August 11 2017 22 Phillips Exeter Academy
Problem Set 4 Math 41C
1. Use the results of Lab 3 to find a point on the graph of y = ln(x) where the slope is 1.Where is the slope equal to 2? 1/3?
2. Use a graphing app to graph the function y = bx−5bx+3
. What happens to the y-valuesas x increases without bound (approaches ∞)? What happens to the y-values as xdecreases without bound (approaches −∞)?
3. Use the results of Lab 3 to find three points on the graph of y = sin(x) where the slopeis 1
2.
4. Use the results of Lab 3 to find the slope of the function f(x) = x2 at x = −32, and
then write the equation of the line tangent to f(x) = x2 at x = −32. Use a graphing
app to graph y = f(x) and this tangent line on the same axes.
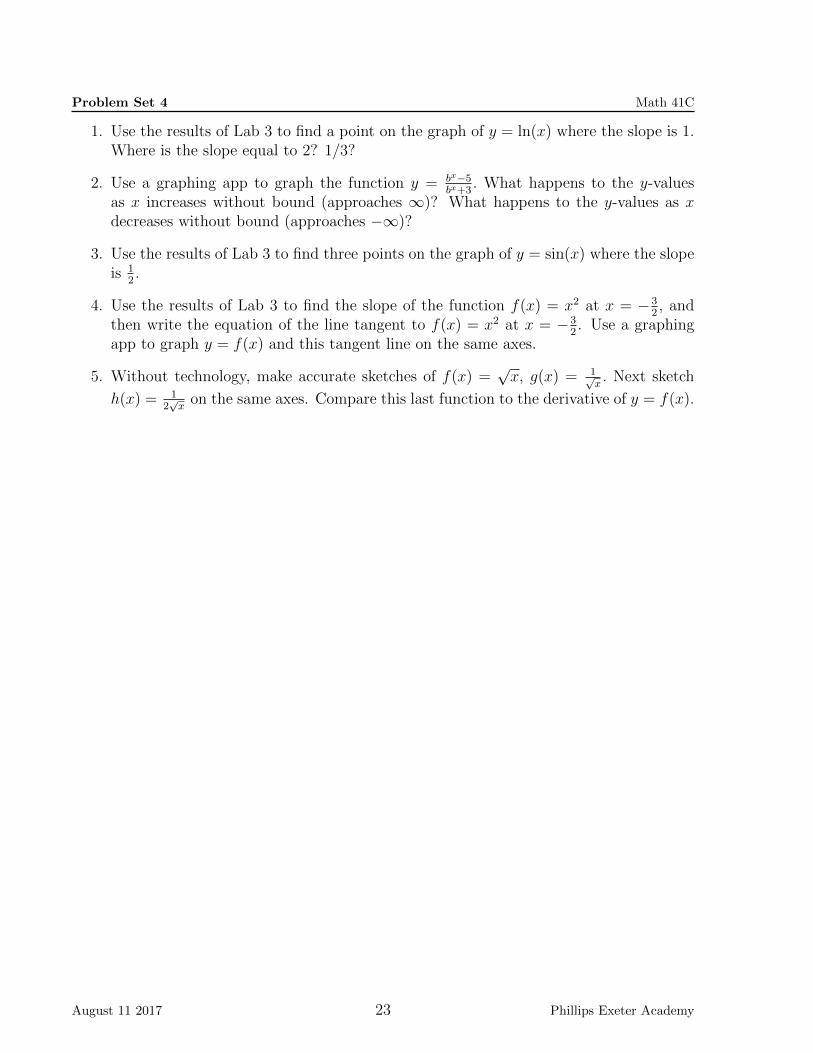
5. Without technology, make accurate sketches of f(x) =√x, g(x) = 1√
x. Next sketch
h(x) = 12√x
on the same axes. Compare this last function to the derivative of y = f(x).
August 11 2017 23 Phillips Exeter Academy

Problem Set 4 Math 41C
6. Match the graphs with the descriptions:
Source: http://www.projectmaths.ie/workshops/WS_4_NR/show_5.pdf
7. Use the results of Lab 3 to find the slope of the function f(x) = 1x
at x = 52, and then
write the equation of the line tangent to f(x) = 1x
at x = 52. Use a graph app to graph
y = f(x) and its tangent line on the same axes.
8. Decide which of the following equations are graphed below:
y = sin(2x), y = cos(0.5x), y = sin(−0.5x), y = cos(−2x), y = sin(3x)
−7 −6 −5 −4 −3 −2 −1 1 2 3 4 5 6 7
−1
1
x
y
A
−7 −6 −5 −4 −3 −2 −1 1 2 3 4 5 6 7
−1
1
x
y
B
−7 −6 −5 −4 −3 −2 −1 1 2 3 4 5 6 7
−1
1
x
y
C
August 11 2017 24 Phillips Exeter Academy
Problem Set 4 Math 41C
9. The expression sin(t+h)−sin(t)h
can be written as sin(t+∆t)−sin(t)∆t
, in which h is replaced by∆t. The symbol ∆ (the Greek letter capital delta) is chosen to represent the worddifference. It is customary to refer to ∆t as the change in t. The corresponding changein sin(t) is sin(t+ ∆t)− sin(t), which can be abbreviated ∆ sin(t). Notice that ∆ sin(t)
depends on t as well as ∆t. The ratio sin(t+∆t)−sin(t)∆t
= ∆ sin(t)∆t
is called a difference
quotient. Working in radian mode, calculate ∆ sin t and ∆ sin(t)∆t
for t = 0.48 and thefollowing values of ∆t:
a. ∆t = 0.1 b. ∆t = 0.01 c. ∆t = 0.001.
What do you notice about the values of these difference quotients?
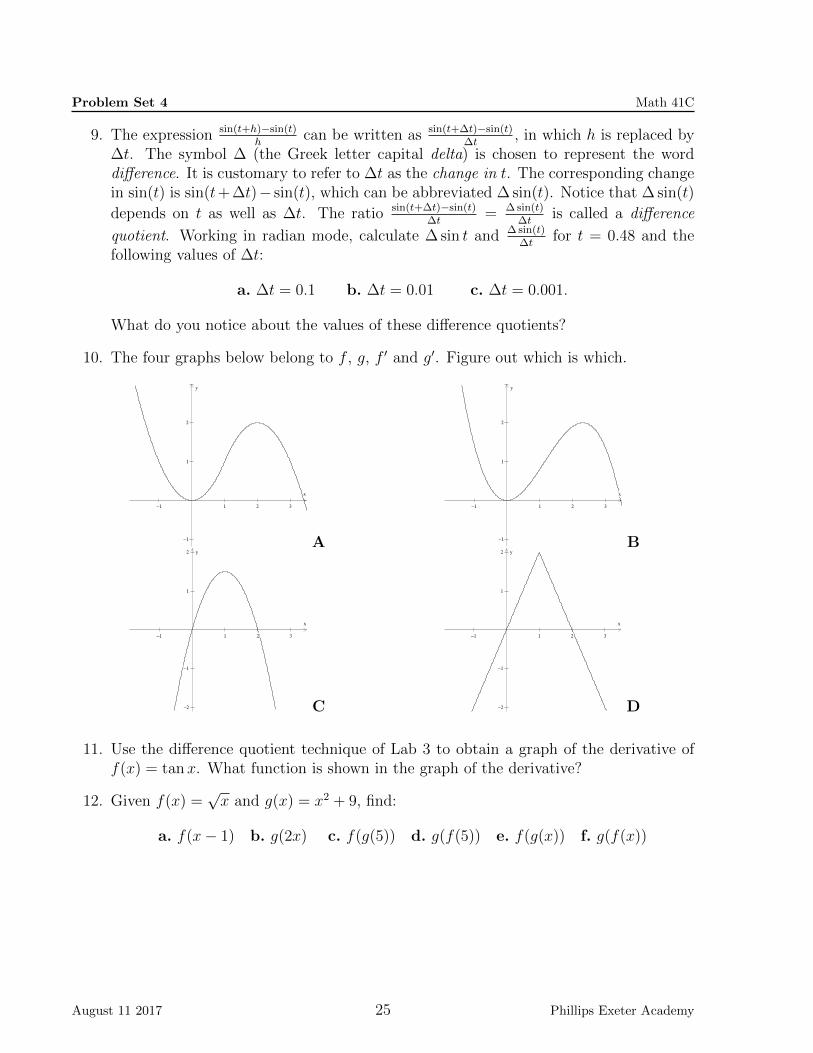
10. The four graphs below belong to f , g, f ′ and g′. Figure out which is which.
−1 1 2 3
−1
1
2
x
y
A
−1 1 2 3
−1
1
2
x
y
B
−1 1 2 3
−2
−1
1
2
x
y
C
−1 1 2 3
−2
−1
1
2
x
y
D
11. Use the difference quotient technique of Lab 3 to obtain a graph of the derivative off(x) = tan x. What function is shown in the graph of the derivative?
12. Given f(x) =√x and g(x) = x2 + 9, find:
a. f(x− 1) b. g(2x) c. f(g(5)) d. g(f(5)) e. f(g(x)) f. g(f(x))
August 11 2017 25 Phillips Exeter Academy

Problem Set 4 Math 41C
13. Match the graphs with the descriptions:
Source: http://www.projectmaths.ie/workshops/WS_4_NR/show_5.pdf
14. The function p defined by p(t) = 3960(1.02)t describes the population of Dilcue, NorthDakota, t years after it was founded.
(a) Find the founding population.
(b) At what rate was the population growing ten years after the founding?
(c) At what annual rate has the population of Dilcue been growing?
15. On the graph y = f(x) shown below, draw lines whose slopes are
(a) f(7)−f(3)7−3
(b) limh→0
f(6+h)−f(6)h
(c) f(7)7
(d) limh→0
f(h)h
August 11 2017 26 Phillips Exeter Academy
Problem Set 4 Math 41C
1
1x
y
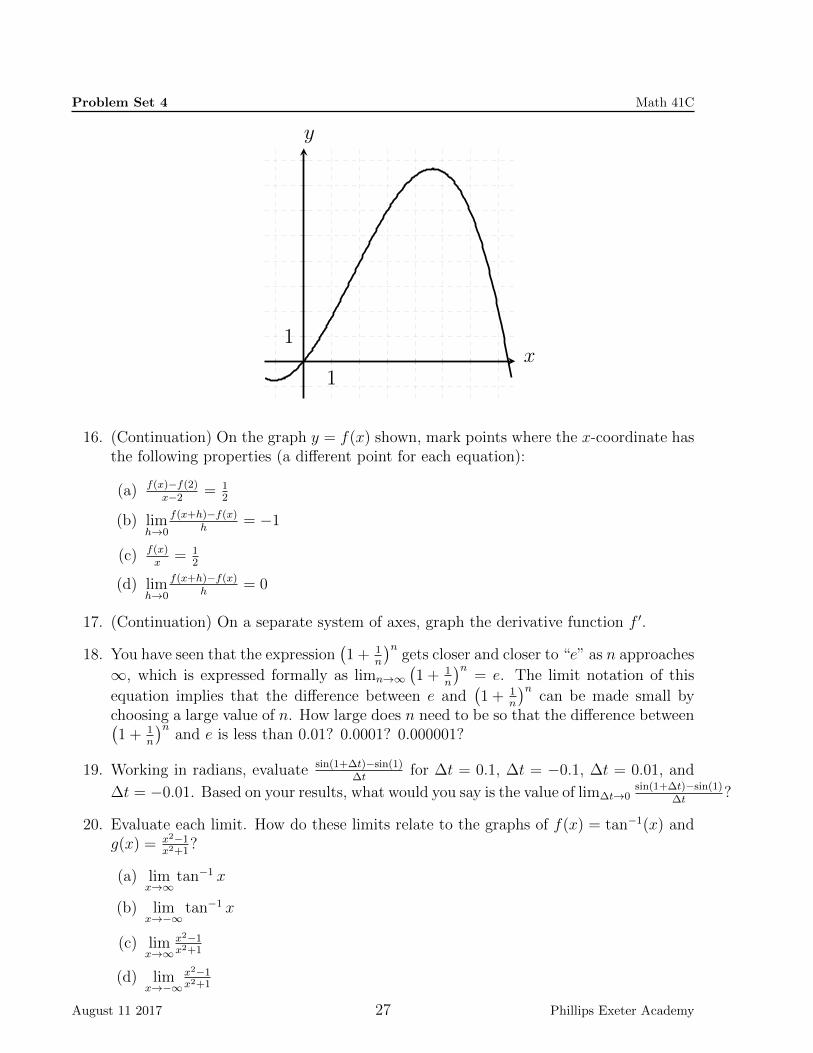
16. (Continuation) On the graph y = f(x) shown, mark points where the x-coordinate hasthe following properties (a different point for each equation):
(a) f(x)−f(2)x−2
= 12
(b) limh→0
f(x+h)−f(x)h
= −1
(c) f(x)x
= 12
(d) limh→0
f(x+h)−f(x)h
= 0
17. (Continuation) On a separate system of axes, graph the derivative function f ′.
18. You have seen that the expression(1 + 1
n
)ngets closer and closer to “e” as n approaches
∞, which is expressed formally as limn→∞(1 + 1
n
)n= e. The limit notation of this
equation implies that the difference between e and(1 + 1
n
)ncan be made small by
choosing a large value of n. How large does n need to be so that the difference between(1 + 1
n
)nand e is less than 0.01? 0.0001? 0.000001?
19. Working in radians, evaluate sin(1+∆t)−sin(1)∆t
for ∆t = 0.1, ∆t = −0.1, ∆t = 0.01, and
∆t = −0.01. Based on your results, what would you say is the value of lim∆t→0sin(1+∆t)−sin(1)
∆t?
20. Evaluate each limit. How do these limits relate to the graphs of f(x) = tan−1(x) andg(x) = x2−1
x2+1?
(a) limx→∞
tan−1 x
(b) limx→−∞
tan−1 x
(c) limx→∞
x2−1x2+1
(d) limx→−∞
x2−1x2+1
August 11 2017 27 Phillips Exeter Academy

Problem Set 4 Math 41C
21. The tangent line to a function can be thought of as a linear approximation for thefunction at a point. Find the equation of the tangent line to y =
√x at x = 9 and
graph both y =√x and the linear approximation function. What value does this
linear approximation give for√
8.9?√
9.1?√
10? Use a calculator to compare theapproximate values with the actual values. Interpret your results. Be sure to look ata graph of the curve and the line.
22. Find a linear approximation for y = sinx around (0, 0). Compare the values of thelinear approximation with the actual values of sinx at x = π
4and x = π
2. What is the
percentage error of the approximation in each case?
23. Write a paragraph reflecting upon the concepts average rate of change, instantaneousrate of change, slope of secant, slope of tangent, and local linearity.
August 11 2017 28 Phillips Exeter Academy
Laboratory 4: Linear Approximation Math 41C
Part 1
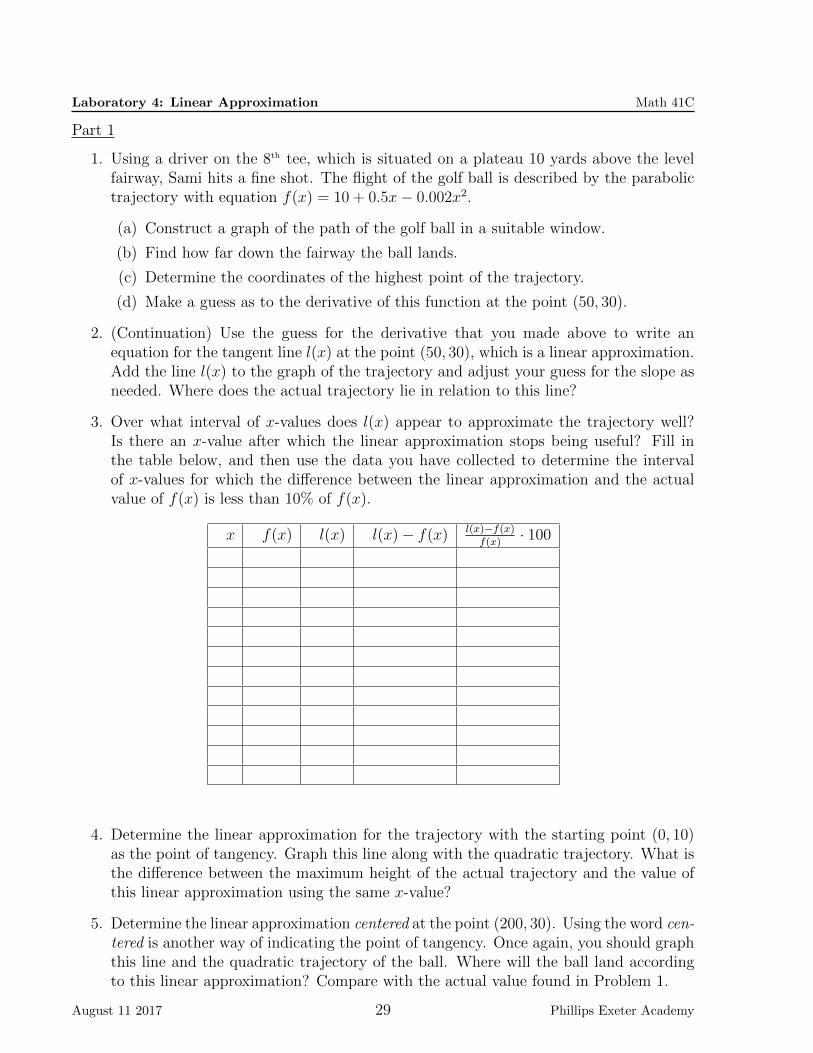
1. Using a driver on the 8th tee, which is situated on a plateau 10 yards above the levelfairway, Sami hits a fine shot. The flight of the golf ball is described by the parabolictrajectory with equation f(x) = 10 + 0.5x− 0.002x2.
(a) Construct a graph of the path of the golf ball in a suitable window.
(b) Find how far down the fairway the ball lands.
(c) Determine the coordinates of the highest point of the trajectory.
(d) Make a guess as to the derivative of this function at the point (50, 30).
2. (Continuation) Use the guess for the derivative that you made above to write anequation for the tangent line l(x) at the point (50, 30), which is a linear approximation.Add the line l(x) to the graph of the trajectory and adjust your guess for the slope asneeded. Where does the actual trajectory lie in relation to this line?
3. Over what interval of x-values does l(x) appear to approximate the trajectory well?Is there an x-value after which the linear approximation stops being useful? Fill inthe table below, and then use the data you have collected to determine the intervalof x-values for which the difference between the linear approximation and the actualvalue of f(x) is less than 10% of f(x).
x f(x) l(x) l(x)− f(x) l(x)−f(x)f(x)
· 100
4. Determine the linear approximation for the trajectory with the starting point (0, 10)as the point of tangency. Graph this line along with the quadratic trajectory. What isthe difference between the maximum height of the actual trajectory and the value ofthis linear approximation using the same x-value?
5. Determine the linear approximation centered at the point (200, 30). Using the word cen-tered is another way of indicating the point of tangency. Once again, you should graphthis line and the quadratic trajectory of the ball. Where will the ball land accordingto this linear approximation? Compare with the actual value found in Problem 1.
August 11 2017 29 Phillips Exeter Academy
Laboratory 4: Linear Approximation Math 41C
Part 2
1. Referring to the golf ball trajectory f(x) = 10+0.5x−0.002x2, suppose that the laws ofphysics (in particular, those regarding the force of gravity) were suddenly suspended atthe moment when the ball reaches its highest point. What path would the ball followfrom that point forward? Write a new function, which will be a piecewise function,that describes the entire trajectory. Graph your result.
2. Does your new function have the property of local linearity at all points on the curve?Did you check the point that corresponds to the moment that gravity ceased to exist?Make sure to confirm your answer by zooming in on your graph.
3. Change the second half of your piecewise function to the linear function y = −0.1x +53.75. This new piecewise function is parabolic when x < 125 and linear when x > 125.Does it possess the property of local linearity at all points? Did you check x = 125?Which of the two piecewise functions you created, the one in Problem 1 or the one inProblem 3, has a well-defined linear approximation centered at x = 125? Why?
Part 3
Summarize what you have learned in this lab about linear approximations. You shouldbe sure to describe what a linear approximation is, how you create a linear approximation(including a formula if you found one), how to visually and numerically determine an intervalwhere you are confident in that approximation, and in what situations a linear approximationdoes not exist.
August 11 2017 30 Phillips Exeter Academy

Problem Set 5 Math 41C
1. Consider the function f(x) = x2.
(a) Find the slope of the line between the points (3, f(3)) and (3 + ∆x, f(3 + ∆x))for ∆x = 0.5, ∆x = 0.1, ∆x = 0.05, and ∆x = 0.01. What happens to the slopeas ∆x approaches zero? Use a limit to write this result.
(b) Obtain an expression for f(3+∆x)−f(3)∆x
by substitution using f(x) = x2, then sim-plify this expression using algebra. Use the result to evaluate the limit expressionlim∆x→0
f(3+∆x)−f(3)∆x
.
2. For f(x) = x2, simplify the expression f(x+∆x)−f(x)∆x
, then use the result to evaluate
lim∆x→0f(x+∆x)−f(x)
∆x. What does this limit tell you about the derivative of the function
f(x) = x2?
3. For f(x) = x2−3x, simplify the expression f(x+∆x)−f(x)∆x
, then use the result to evaluate
lim∆x→0f(x+∆x)−f(x)
∆x. What does this limit tell you about the derivative of the function
f(x) = x2 − 3x?
4. In the quadratic functions of the three previous problems, why did you need to simplifythe expressions before evaluating the limits?
5. Evaluate the following limits by zooming in on a graph showing both the numeratorfunction and the denominator function.
(a) limx→0
sin 3xx
(b) limx→1
x2−1x−1
6. (Continuation) (a) Use algebra to evaluate limx→1x2−1x−1
by first simplifying the ratiox2−1x−1
. (b) Compare the graphs of f(x) = x2−1x−1
and g(x) = x + 1, and the domains ofeach function.
7. Use difference quotients with small intervals to graph an approximation for the slopeof the graph of y = ex. Compare the slope graph to the original graph. What doesthis tell you about the value of the slope of y = ex at any point on the curve?
8. (Continuation) Determine the function that gives the slope at any point on the graphof
(a) y = 3ex
(b) y = ex−3
9. Make a table listing what you have discovered are the derivatives for the followingexpressions:
x2, x3, sin x, cos x, ex, 1x, 1x2 , ln x,
√x
August 11 2017 31 Phillips Exeter Academy
Problem Set 5 Math 41C
10. In our previous work we have often used a difference quotient to represent the rate ofchange of a function. Write a paragraph explaining your understanding of the limit ofa difference quotient as an expression of the derivative of f(x):
f ′(x) = lim∆x→0
f(x+∆x)−f(x)∆x
The expression on the right side of the equation above is known as the limit definitionof the derivative.
11. A linear function has the form L(x) = mx + b where m and b are constants (that is,the values of m and b do not depend on the value of x). What is the derivative L′(x)?Use algebra and the limit definition of the derivative to show how to go step-by-stepfrom L(x) to L′(x).
12. Consider the absolute value function y = |x|, which can be defined as y =
{x if x ≥ 0,−x if x < 0.
(a) When a function is piecewise defined, we need to consider the derivative of eachpiece separately. What is the derivative of each “half” of the function? What isthe derivative at x = 0? How do you know?
(b) To gain insight into part (a), zoom in on the graph of y = |x| around (0, 0). Doyou see local linearity? Explain how the picture relates to the derivative or lackof a derivative for this function.
13. Tell how the slope of the curve y = 3x at its y-intercept compares to the slope of thecurve y = 2 · 3x at its y-intercept. What can you say about the slopes at other pairs ofpoints on these curves that have the same x-values?
14. (a) If your last name begins with A through M, draw the graph of y = sinx for−2π ≤ x ≤ 2π, working in radians. If your last name begins with N through Z,draw the graph of y = sinx for −360 ≤ x ≤ 360, working in degrees. Now findthe slope of your curve at the origin. Is your answer for the slope consistent withwhat you know is the derivative of sinx at x = 0?
(b) Compare your answers with the your classmates’ answers. Does it make a dif-ference if you are working in radians as opposed to degrees? [Your results willsuggest why we use radian measure for angles when we are using the tools ofcalculus.]
15. (Continuation) Working in radians, evaluate limx→0sinxx
. Interpret your answer.
August 11 2017 32 Phillips Exeter Academy

Problem Set 5 Math 41C
16. Consider the piecewise-defined function f(x) =
{−x+ 4 if x < 0,x2 + 4 if x ≥ 0.
(a) Is this function differentiable everywhere? Explain. When a function fails to havea derivative at a point, it is said to be nondifferentiable at that point.
(b) Adjust the linear part of f so that the answer to (a) is the opposite of what youfound.
(c) Now adjust the quadratic part of f instead so that the answer to (a) is the oppositeof what you found.
17. Why does limx→a
f(x)− f(a)
x− arepresent the same value as lim
h→0
f(a+ h)− f(a)
h?
18. How do the slopes of the curves y = m sinx and y = sinx compare at the origin?Working in radians, also compare the slope of the curve y = m sinx at (π, 0) with theslope of y = sinx at (π, 0). Is it possible to compare slopes for other points on thesetwo curves?
19. The IRS tax formula for married couples is a piecewise-linear function, which in 2014was as follows:
T (x) =
0.10x for 0 ≤ x ≤ 181501815 + 0.15(x− 18150) for 18150 < x ≤ 7380010162.50 + 0.25(x− 73800) for 73800 < x ≤ 14885028925 + 0.28(x− 148850) for 148850 < x ≤ 22685050765 + 0.33(x− 226850) for 226850 < x ≤ 405100109587.50 + 0.35(x− 405100) for 405100 < x ≤ 457600127962.50 + 0.396(x− 457600) for 457600 < x
This function indicates the tax T (x) for each nonnegative taxable income x.
(a) What is the tax for a couple whose taxable income is $50,000? $100,000? $300,000?
(b) What is the meaning of “I’m in the 25% tax bracket”? What about the 33%bracket? Why does each piece (except for the first) of T begin with a number(1815 for example)?
(c) Draw a rough sketch of the graph of T using pencil and paper.
(d) Explain why T ′(x) makes sense for all but six positive values of x. For these sixvalues, why is T nondifferentiable?
(e) Graph the derivative function T ′. How many distinct values are there in the rangeof T ′?
20. Find the average rate of change for y = x2 between x = 0 and x = 2. Is there apoint with the x-value in the interval (0, 2) where the instantaneous rate of change isthe same as the average rate of change over the interval? Explain and find the point.Verify your calculations with a graph.
August 11 2017 33 Phillips Exeter Academy

Problem Set 5 Math 41C
21. (Continuation) How would you explain your answer to the previous problem with slopesand lines?
22. Find an approximate value for F (2.3) given only the information F (2.0) = 5.0 andF ′(2.0) = 0.6. Explain how this problem uses a linear approximation.
23. An investment account is set up with an initial deposit of $1000, and it grows at anannual rate of 5%.
(a) Write an equation for the amount A in the account as a function of time t inyears.
(b) Find the doubling time for this account, the time it takes for the amount in theaccount to double.
(c) If you solved part (b) with algebra, you had to solve the equation 2 = (1.05)t.Explain. Since you are solving for an exponent, you would need to use logarithmssince a logarithm is the inverse of an exponential; thus, the logarithm of anexponential expression yields an exponent. For this particular equation, ln 2 =t ln 1.05 (Why?) Complete the work of finding the doubling time t from thisequation.
(d) In part (c) we happened to use a logarithm with base e, but we could have usedany base logarithm. We often use base e or base 10 logarithms because thosefunctions are readily available on calculators. What if we had used a base 1.05logarithm applied to both sides of the equation 2 = (1.05)t? What equation wouldwe get for t?
(e) The solutions in parts (c) and (d) suggest the equality ln 2ln 1.05
= log1.05 2. Verifythat this is true.
24. (Continuation) The equation a = bx can be solved for x using the two approachesshown in the previous problem.
(a) Write out two possible solutions, one using a logarithm with a base c, the otherusing a logarithm with a base b.
(b) Equate the two expressions for x in part (a) to yield the change of base formula:
logb a =logc a
logc b.
August 11 2017 34 Phillips Exeter Academy

Laboratory 5: Transformations and Derivatives Math 41C
1. (Vertical shift) Graph the function f(x) = x2 and the tangent line to f(x) at x = 1.Now choose three values for a constant k and graph the functions fk(x) = x2 + k onthe same axes as f(x). Notice that the new functions are vertical shifts of the originfunction. Consider how a vertical shift by k units affects the equation of the tangentline at x = 1, and write equations for the tangent lines at x = 1 for your new functionsfk(x). Check your conclusions by adding the lines to your graph.
2. (Continuation) What do all of the tangent lines have in common? How does youranswer relate to the derivative of fk(x) = x2 + k at x = 1?
(a) What is the derivative of fk(x) = x2 + k at x = 1?
(b) In general, how do the derivatives of a function and a vertical shift of that function,obtained by adding a constant to the function, relate to each other?
(c) Find the derivatives of the following functions.
i. y = x2 + 5
ii. y = −2 + cos(x)
iii. g(x) = f(x) + k
3. (Vertical stretch/shrink) Graph the function f(x) = sin(x) and the tangent line to f(x)at x = π/4. Choose three values for a constant k, and on the same set of axes, graphthe functions fk(x) = k sin(x). Notice that the new functions are vertical stretches (orshrinks) of the original function. Consider how a vertical stretch by k units affects theequation of the tangent line at x = π/4, and write equations for the tangent lines atx = π/4 for your new functions fk(x). Check your conclusions by adding the lines toyour graph.
4. (Continuation) What do all of the tangent lines have in common? How does youranswer relate to the derivative of fk(x) = k sin(x) at x = π/4?
(a) What is the derivative of fk(x) = k sin(x) at x = π/4?
(b) In general, how do the derivatives of a function and a vertical stretch or shrink ofthat function, obtained by multiplying the function by a constant, relate to eachother?
(c) Find the derivatives of the following functions.
i. y = 5x2
ii. y = −2 cos(x)
iii. g(x) = k · f(x)
5. (Horizontal shift) Graph the function f(x) =√x and the tangent line to f(x) at x = 4.
Choose three values for a constant k, and on the same set of axes, graph the functionsfk(x) =
√x− k. Notice that the new functions are horizontal shifts of the original
function. Consider how a horizontal shift by k units affects the equation of the tangentline at x = 4, and write equations for the tangent lines at x = 4 for your new functionsfk(x). Check your conclusions by adding the lines to your graph.
August 11 2017 35 Phillips Exeter Academy

Laboratory 5: Transformations and Derivatives Math 41C
6. (Continuation) What do all of the tangent lines have in common? How does youranswer relate to the derivative of fk(x) =
√x− k at x = 4?
(a) What is the derivative of fk(x) =√x− k at x = 4?
(b) In general, how do the derivatives of a function and a horizontal shift of thatfunction, obtained by subtracting a constant from the x value, relate to eachother?
(c) Find the derivatives of the following functions.
i. y = (x+ 5)2
ii. y = cos(x− π
4
)iii. g(x) = f(x− k)
7. (Horizontal stretch/shrink) Graph the function f(x) = cosx and the tangent line tof(x) at x = π
2, which is the smallest positive x-intercept of the graph. Choose three
values for a constant k, and on the same set of axes, graph the functions fk(x) =cos(kx). Notice that the new functions are horizontal stretches (shrinks) of the originalfunction. Consider how a horizontal shift by k units affects the location of the smallestpositive x-intercept of the function, and write equations for the tangent lines at theseintercepts. Check your conclusions by adding the lines to your graph.
8. (Continuation) How does the x-intercept shift as k changes? What do all of the tangentlines have in common? How does your answer relate to the derivative of fk(x) = cos(kx)at x = π
2?
(a) What is the derivative of fk(x) = cos (kx) at x = 4?
(b) In general, how do the derivatives of a function and a horizontal stretch of thatfunction, obtained by multiplying x by a constant, relate to each other?
(c) Find the derivatives of the following functions.
i. y =√
5x
ii. y = sin(2x)
iii. g(x) = f(kx)
9. Write a paragraph which summarizes your understanding of the relationship, whichyou have explored in this lab, between the derivatives of function and a simple trans-formation of that same function.
August 11 2017 36 Phillips Exeter Academy
Problem Set 6 Math 41C
1. Find the values of the expressions limh→0
eh − 1
hand lim
k→1
ln k
k − 1. Show that each value can
be interpreted as a slope, and thus as a derivative.
2. Each of the following represents a derivative. Use this information to evaluate eachlimit.
(a) limh→0
(x+ h)2 − x2
h(b) lim
h→0
1
h
(sin(π
6+ h)− sin
(π6
))(c) lim
x→a
ex − ea
x− a
3. In previous labs and problem sets, we learned that the derivative of y =√x is dy
dx= 1
2√x.
In this problem we will see how to obtain this derivative from the limit definition ofthe derivative.
(a) Explain why√x has the following limit expression as its derivative.
limh→0
√x+ h−
√x
h
(b) Re-express the limit formula in part (a) by using the technique of multiplying thenumerator and denominator by the same expression
√x+ h+
√x. Simplify and
cancel common factors.
(c) Taking the limit at h approaches 0 of the expression in part (b), obtain theexpression for the derivative of
√x.
4. Find the approximate values for both g(2.1) and g(1.85), given that g(2.0) = −3.5 and(a)g′(2.0) = 10.0 (b) g′(2.0) = −4.2.
5. What is the formula for the linear approximation for a function f(x) at x = a? Writeout in words what you think the linear approximation means. Include the followingterms in your paragraph: slope of linear approximation, slope of tangent line, instan-taneous rate of change, and derivative.
6. Find the derivatives of the following functions that have undergone a combination oftransformations. Your answers should look like “f(x) = ...”, or “y′ = ...”, or a similarform.
(a) y = e2x−2
(b) p = 3960 · e0.15t + 5280
(c) g(x) = 5x+2
(d) y = 1 + 3√x− 4
(e) y = −1 + cos(3x+ π)
(f) h(x) = (5x+ 1)3
7. After being dropped from the top of a tall building, the height of an object is describedby y = 400 − 16t2, where y is measured in feet and t is measured in seconds. Find aformula for the rate of descent (in feet per second) for this object. Your answer willdepend on t. How fast is the object falling after 2 seconds?
August 11 2017 37 Phillips Exeter Academy

Problem Set 6 Math 41C
8. Calculate derivatives for A(r) = πr2 and V (r) = 43πr3. The resulting functions A′ and
V ′ should look familiar. Could you have anticipated their appearance? Explain.
9. (Continuation) If a is a number, then f ′(a) is the derivative of f(x) evaluated at a. Thismeans that to find f ′(a), you first determine a formula for f ′(x) and then substitutethe value of a for x.
(a) Find the values of A′(2) and V ′(2).
(b) Explain the geometric meaning of the quantities found in part (a).
10. Interpret the diagram as a velocity-time graph for an object that is moving along anumber line. The horizontal axis represents time (in seconds) and the vertical axisrepresents velocity (in meters per second).
(a) The point (9.0,-1.8) is on the graph. Find it in the diagram and describe whatis going on around that point. In particular, what is the significance of the sign?Choose three other conspicuous points on the graph and interpret them.
(b) Suppose the object starts its journey when t = 0 at a definite point P on thenumber line. Use the graph to estimate the position of the object (in relation toP ) two seconds later.
1 2 3 4 5 6 7 9
-2-1
12345
11. (Continuation) On a separate set of axes, sketch the derivative of the function whosegraph appears above. Interpret your graph in this context.
12. You have found the derivatives of power functions, two of which are as follows: (i) thederivative of f(x) = x2 is f ′(x) = 2x, and (ii) the derivative of g(x) = x3 is g′(x) = 3x2.
(a) What do you think is a formula for the derivative of a power function y = xn?
(b) Look at the graphs of some other power functions (such as x4, x−2,√x, and so on)
and their derivatives. [Desmos is an app that allows you to graph the derivativewhen the operator d
dxis applied to a function of x.] See if your guess from part
(a) is correct, and if not, modify your formula.
August 11 2017 38 Phillips Exeter Academy

Problem Set 6 Math 41C
13. The linear approximation for (1 + x)k:
(a) Find the linear approximation for (1 + x)2 centered at a = 0. Verify graphicallythat you have indeed found the tangent line approximation for this function.
(b) Find the linear approximation for (1 + x)3 centered at a = 0. Verify graphically.
(c) Find the linear approximation for√
1 + x centered at a = 0. Verify graphically.
(d) Justify the linear approximation formula (1 + x)k ≈ 1 + kx.
14. Illuminated by the parallel rays of the setting Sun, Andy rides alone on a merry-go-round, casting a shadow that moves back and forth on a wall. The merry-go-roundtakes 9 seconds to make one complete revolution, Andy is 24 feet from its center, andthe Sun’s rays are perpendicular to the wall. Let N be the point on the wall that isclosest to the merry-go-round.
(a) Interpreted in radian mode, f(t) = 24 sin(2π9t) describes the position of the shadow
relative to N . Explain.
(b) Calculate the speed (in feet per second) of Andy’s shadow when it passes N , andthe speed of the shadow when it is 12 feet from N .
15. Find the derivative of ln(3x). Explain why this function can be viewed as a verticalshift or a horizontal shrink of the function lnx. Show that both approaches lead tothe same derivative.
16. Find the derivative of ex+5. Explain why this function can be viewed as a horizontalshift or a vertical stretch of the function ex. Show that both approaches lead to thesame derivative.
17. Recall the change-of-base formula for logarithms: logb a = logc alogc b
. Apply this formula to
rewrite the following logarithms in terms of natural logarithms.
(a) log2 x
(b) log10(x+ 3)
(c) log3(x2)
18. (Continuation) Use the strategy in the previous number to find the derivative formulafor any base logarithm function by answering parts (a)-(c) below.
(a) What is the derivative of lnx? What is the derivative of lnxln 3
? What is thederivative of log3 x?
(b) Rewrite logb x in terms of lnx by using the change-of-base formula.
(c) Find the derivative of logb x by using the expression found in part (b).
(d) Find the derivatives of the expressions given in the previous problem log2 x,log10 (x+ 3), and log3 (x2).
August 11 2017 39 Phillips Exeter Academy

Problem Set 6 Math 41C
19. By now you know that the derivative of y = ex is y′ = ex. To find the derivative ofother exponential functions, such as 2x, it is helpful to rewrite the exponential as abase e exponential. This can be accomplished by recognizing that 2 is equal to somepower of e or in symbols, 2 = ek.
(a) Find the exact solution for k in the equation 2 = ek using natural logarithms.
(b) Using your previous answer, show how to rewrite 2x as ekx.
(c) Find the derivative of 2x by finding the derivative of the equivalent expressionekx.
(d) Write a general formula for the derivative of bx, for any base b > 0.
20. (Continuation) Find the derivatives of the following functions.
(a) y = 2x+5
(b) A = 1000 · (1.05)t
(c) T = 68 + 132 · (0.9)t
21. Simple harmonic motion. An object is suspended from a spring, 40 cm above a labo-ratory table. At time t = 0 seconds, the object is pulled 24 cm below its equilibriumposition and released. The object bobs up and down thereafter. Its height y above thelaboratory table is described, with t measured in radians, by y = 40− 24 cos(2πt).
(a) What is the period of the resulting motion?
(b) Find the average velocity of the object during the first 0.50 second of motion.
(c) Find the instantaneous velocity of the object when t = 0.25 second. Find a wayof convincing yourself that the object never moves any faster than it does at thisinstant.
August 11 2017 40 Phillips Exeter Academy

Laboratory 6: Addition Rule and Product Rule for Derivatives Math 41C
In the previous lab we investigated what happens to a tangent line to the graph of a functionwhen we apply basic transformations to the function, the tangent line being the linearapproximation for the curve near the point of tangency. The concept of local linearityplayed a large role in Lab 6, and we will again use this concept to gain insight into thederivative of the sum of two functions and the derivative of the product of two functions.
Part 1: The Addition Rule for Derivatives
1. Find an equation for l(x), the linear approximation for f(x) = x2 + 1 at P = (1, 2).
Find an equation for m(x), the linear approximation for g(x) =1
xat Q = (1, 1). Graph
these four functions in a window that includes P and Q.
2. Now graph the sum functions s(x) = f(x) + g(x) and r(x) = l(x) + m(x). What doyou notice about s(x) and r(x) near x = 1? What does this suggest about the linearapproximation for s(x) near the point with x = 1?
3. Choose another x-value, find P and Q, and consider the linear approximations to f(x)and g(x) in the same way that you did in problems 1 and 2 above.
4. Consider the following related question: If you have two linear functions, how does theslope of the sum function relate to the slopes of the linear functions?
5. We know from our previous work that the general equations for the linear approxima-tions for two functions f and g centered at x = a are f(x) ≈ f ′(a)(x− a) + f(a) andg(x) ≈ g′(a)(x− a) + g(a). How can these two equations be combined to find a linearapproximation for the function s(x) = f(x) + g(x) centered at the point with x = a?What is the slope of this linear approximation for s(x)? How does this slope relate tothe derivatives of f(x) and g(x) at x = a?
6. Write a statement for the Addition Rule relating the derivative of s(x) to the derivativesof f(x) and g(x) .
7. Apply the Addition Rule to find the derivatives of the following functions.
(a) y = x2 +1
x(b) y = x+ sinx
Part 2: The Product Rule for Derivatives
1. Find an equation for l(x), the linear approximation for f(x) = e−x at P = (1, e−1).Find an equation for m(x), the linear approximation for g(x) = x2 at Q = (1, 1).Graph these four functions in a window that includes P and Q.
2. Now graph the product functions p(x) = f(x) · g(x) and q(x) = l(x) ·m(x). What doyou notice about p(x) and q(x) near x = 1? What does this suggest about the linearapproximation for p(x) near the point with x = 1? What type of function is q(x)?How does this product compare with p(x) near x = 1? Explain.
August 11 2017 41 Phillips Exeter Academy
Laboratory 6: Addition Rule and Product Rule for Derivatives Math 41C
3. What is the exact value of p(1)? Use your graph to find the approximate value of theslope of the curve p(x) at x = 1. Use this point and the approximate slope to write anequation for the tangent line to p(x) at the point with x = 1. Name this tangent linethe function L(x).
4. The exact value of the slope of the linear approximation for p(x) is 1 · (−e−1) + e−1 · 2.How close is this number to your guess? Verify that your slope in number 3 is ap-proximately this value. How does this slope relate to f and g and their derivativesat x = 1? Now make a conjecture about how the derivative of p(x) relates to f(x),g(x), f ′(x), and g′(x). Whereas you do not yet know how to find the derviative of theproduct function p(x) (and thus the slope p′(1)), you can find the derivative of q(x),which approximates p(x) near x = 1. This value q′(1) gives you the exact value of theslope of L(x).
5. Work through the following steps to investigate your conjecture about the derivativeof the product of two functions.
(a) Write the formulas for the linear approximations of the functions f and g centeredat the points with x = a.
(b) Multiply the linear approximations of the functions f and g from part (a). Noticethat this is a quadratic function since it is the product of two linear functions.
(c) Verify that the derivative of the quadratic in part (b) is the linear expression2f ′(a)g′(a)(x− a) + f(a)g′(a) + f ′(a)g(a). What is the value of this expression atthe point of tangency x = a? Explain why this is also the value of p′(a).
(d) Write a general formula for the derivative of p(x), where p is the product of f andg. Compare your formula with the Product Rule for derivatives (which you canlook up). Adjust your formula as necessary.
6. Investigate the derivative of p(x) algebraically and graphically.
(a) Use the Product Rule to find the derivative of p(x) = x2e−x.
(b) Graph both p(x) and its derivative on the same set of axes.
(c) Does your graph of the derivative seem reasonable compared to the shape of p(x)?If not, modify your derivative formula. Explain how the shape of p′(x)makes sense.
7. Apply the Product Rule to find derivatives of the following functions.
(a) y = x sinx
(b) m(x) = (x+ 1)ex
Part 3: SummarySummarize in a paragraph what you have learned in this lab. You should reflect upon theAddition Rule and the Product Rule, and how you understand those procedures. You shouldalso consider how the range of derivatives you can calculate has been expanded by these tworules.
August 11 2017 42 Phillips Exeter Academy
Problem Set 7 Math 41C
1. If y = sinx, then the derivative equation y′ = cosx can also be expressed with thenotation dy
dx= cosx. Show where this notation comes from by writing a limit that
relates dydx
and ∆y∆x
. Is dydx
a ratio of two numbers in the usual sense? The form dydx
forthe derivative is known as Leibniz notation.
2. Oscillations about a line.
(a) Graph the functions f(x) = x+ sinx and g(x) = x.
(b) Find the derivative of f .
(c) What is the slope of the graph of f at the points where f(x) = g(x)?
(d) Which of the following characteristics apply to the graph of f? (1) periodic; (2)always increasing; (3) alternately increasing and decreasing; (4) non-decreasing;(5) rotated sinusoidal; (6) horizontal tangent at x values equal to odd multiplesof π
3. Find the derivative of each of the following functions.
(a) f(x) = x+ lnx
(b) g(t) = 3t− 5 sin t
(c) L(x) =√
4− x(d) P (t) = 12 + 4 cos (πt)
4. A quadratic function F is defined by F (x) = ax2 + bx + c, where a, b, and c areconstants and a is nonzero. Find the derivative of F , and then find the value of x thatmakes F ′(x) = 0. The corresponding point on the graph y = F (x) is special. Why?
5. Find a function that fits the description f ′(t) = −0.42f(t). There are many from whichto choose.
6. Find the derivatives of the following functions: (a) y = A · ex; (b) y = ex+C. [Assumethat A and C are constants.] For which of these functions is it true that dy
dx= y?
7. Given that f is a differentiable function and that the value of c does not depend on x,explain the following differentiation properties:
(a) If g(x) = f(x− c), then g′(x) = f ′(x− c).(b) If g(x) = c · f(x), then g′(x) = c · f ′(x).
(c) If g(x) = f(cx), then g′(x) = c · f ′(cx).
August 11 2017 43 Phillips Exeter Academy

Problem Set 7 Math 41C
8. The PEA Ski Club is planning a ski trip over a long weekend. They have 40 skierssigned up to go, and the ski resort is charging $180 per person. The resort manageroffers to reduce the group rate of $180 per person by $3 for each additional registrantas long as revenue continues to increase.
(a) Calculate how much money (revenue) the resort will receive if no extra studentssign up beyond the original 40. How much is the revenue if 5 extra students signup?
(b) Let x be the number of additional registrations beyond the original 40. In termsof x, write expressions for p(x), the total number of people going, and for q(x),the cost per person. Revenue is the product of the number of people and the costper person, so the revenue function is r(x) = p(x) · q(x).
(c) Use the product rule to find the derivative r′(x) in terms of p(x), p′(x), q(x), andq′(x).
(d) Find the derivative r′(x) by first multiplying out the product of p(x) and q(x), thenusing the Addition Rule. Compare your answer with the answer from part (c).What value of x yields the maximum revenue?
9. Find the derivative of each of the following functions.
(a) f(x) = x2 + x−2
(b) g(t) =√
5t
(c) y = (1 + x)n
10. A roller coaster descends from a height of 100 ft on a track that is in the shape of theparabola y = 100− 1
4x2, where y is the height in feet and x is the horizontal distance
in feet from the point of maximum height.
(a) What is the slope of the track at any point (x, y)? Where will the track run intothe ground and at what angle?
(b) To allow the ride to transition smoothly to the ground, another piece of track inthe shape of the parabola y = a (x− 40)2 is joined to the previous track and ahorizontal track at y = 0. What is the slope of this track assuming a is a constant?
(c) Using a graphing app, find an approximate value for a that fits the tracks togetherto give a smooth ride from the top to the ground.
(d) Use your knowledge of calculus to find the exact value of a that smoothly fits thetracks together.
11. An object moves along the x-axis according to the equation x(t) = 4t− t2.
(a) Obtain a graph of x(t) versus t. Explain what the height of any point above thehorizontal axis on the graph represents.
(b) Employ differentiation (which is the name of the process for finding a derivative)to find a formula for the velocity of the object.
(c) Use this derivative to find the velocity and speed of the object each time it passesthe point x = 0.
August 11 2017 44 Phillips Exeter Academy

Problem Set 7 Math 41C
12. Find the derivative of each of the following functions.
(a) y = sinx cosx
(b) A(x) = x · ex
(c) P (u) = (u+ 2)5
13. Consider the equations y′(t) = 0.12 and p′(t) = 0.12 · p(t). They say similar butdifferent things about the functions whose rates of change they are describing.
(a) For each equation, find a function with the given derivative. There are manypossible answers for each one.
(b) For each equation, find the particular function that has a value of 36 when t = 0.
14. The population of Halania is increasing at a rate of 1.3% per year while per capitaenergy consumption is increasing at a constant rate of 8× 10⁶ BTUs per year.
(a) Explain why the functions P (t) = 23(1.013)t and E(t) = 8t+ 150 are reasonablemodels for population and per capita energy consumption, where P is in millionsof people, E is in millions of BTUs, and t is in years since 2010. What are themeanings of the constants 23, 1.013, 8, and 150 in these models?
(b) Write an expression for total energy consumption T (t), which is the product ofpopulation and per capita energy consumption. Use the product rule to find thederivative of this function.
(c) How fast will total energy consumption be changing at the beginning of 2020?What is the percent change at that time?
(d) Obtain a graph of the percent change in total energy consumption. Comment onthe shape of this graph.
15. Kelly is using a mouse to enlarge a rectangular frame on a computer screen. As shownbelow, Kelly is dragging the upper right corner at 2 cm per second horizontally and 1.5cm per second vertically. Because the width and height of the rectangle are increasing,the enclosed area is also increasing. At a certain instant, the rectangle is 11 cm wideand 17 cm tall. By how much does the area increase during the next 0.1 second?Make calculations to show that most of the additional area comes from two sources – acontribution due solely to increased width, and a contribution due solely to increasedheight. Your calculations should also show that the rest of the increase is insignificant– amounting to less than 1%.
16. (Continuation) Repeat the calculations, using a time increment of 0.001 second. Asabove, part of the increase in area is due solely to increased width, and part is duesolely to increased height. What fractional part of the change is not due solely to eithereffect?
August 11 2017 45 Phillips Exeter Academy

Problem Set 7 Math 41C
17. (Continuation) Let A(t) = W (t) · H(t), where A, W , and H stand for area, width,and height, respectively. The previous examples illustrate the validity of the equation∆A = W ·∆H+H ·∆W +∆W ·∆H, in which the term ∆W ·∆H plays an insignificantrole as ∆t → 0. Divide both sides of this equation by ∆t and find limits as ∆t → 0.This will yield an equation involving derivatives that shows that the functions dA
dt, W ,
H, dWdt
, and dHdt
are related in special way. What rule does this demonstrate?
.........
......... .........
.........
............................................................... .............
[2,1.5]W
H
.
.
.
.
.
.
.
.
.
.
.
.
.
.
.
.
.
.
.
.
.
.
.
.
.
.
.
.
.
.
.
.
.
.
.
.
.
.
.
.
.
.
.
.
.
.
.
.
.
.
.
.
.
.
.
.
.
.
.
.
.
.
.
.
.
.
.
.
.
.
.
.
.
.
.
.
.
.
.
.
.
.
.
.
.
.
.
.
.
.
.
.
.
.
.
.
.
.
.
.
.
.
.
.
.
.
.
.
.
.
.
.
.
.
.
.
.
.
.
.
.
.
.
.
.
.
.
.
.
.
.
.
.
.
.
.
.
.
.
.
.
.
.
.
.
.
.
.
.
.
.
.
.
.
.
.
.
.
.
.
.
.
.
.
.
.
.
.
.
.
.
.
.
.
.
.
.
.
.
.
.
.
.
.
.
.
.
.
.
.
.
.
.
.
.
.
.
.
.
.
.
.
.
.
.
.
.
.
.
.
.
.
.
.
.
.
.
.
.
.
.
.
.
.
.
.
.
.
.
.
.
.
.
.
.
.
.
.
.
.
.
.
.
.
.
.
.
.
.
.
.
.
.
.
.
.
.
.
.
.
.
.
.
.
.
.
.
.
.
.
.
.
.
.
.
.
.
.
.
.
.
.
.
.
.
.
.
.
.
.
.
.
.
.
.
.
.
.
.
.
.
.
.
.
.
.
.
.
.
.
.
.
.
.
.
.
.
.
.
.
.
.
.
.
.
.
.
.
.
.
.
.
.
.
.
.
.
.
.
.
.
.
.
.
.
.
.
.
.
.
.
.
.
.
.
.
.
.
.
.
.
.
.
.
.
.
.
.
.
.
.
.
.
.
.
.
.
.
.
.
.
.
.
.
.
.
.
.
.
.
.
.
.
.
.
.
.
.
.
.
.
.
.
.
.
.
.
.
.
.
.
.
.
.
.
.
.
.
.
.
.
.
.
.
.
.
.
.
.
.
.
.
.
.
.
.
.
.
.
.
.
.
.
.
.
.
.
.
.
.
.
.
.
.
.
.
.
.
.
.
.
.
.
.
.
.
.
.
.
.
.
.
.
.
.
.
.
.
.
.
.
.
.
.
.
.
.
.
.
.
.
.
.
.
.
.
.
.
.
.
.
.
.
.
.
.
.
.
.
.
.
.
.
.
.
.
.
.
.
.
.
.
.
.
.
.
.
.
.
.
.
.
.
.
.
.
.
.
.
.
.
.
.
.
.
.
.
.
.
.
.
.
.
.
.
.
.
.
.
.
.
.
.
.
.
.
.
.
.
.
.
.
.
.
.
.
.
.
.
.
.
.
.
.
.
.
.
.
.
.
.
.
.
.
.
.
.
.
.
.
.
.
.
.
.
.
.
.
.
.
.
.
.
.
.
.
..
..
..
..
..
..
..
..
..
..
..
..
..
..
..
..
..
..
..
..
..
..
..
..
..
..
..
..
..
..
..
..
..
..
..
..
..
..
..
..
..
..
..
..
..
..
..
..
..
..
..
..
..
..
..
..
..
..
..
..
..
..
..
..
..
..
..
..
..
..
..
..
..
..
..
..
..
..
..
..
..
..
..
..
..
..
..
..
..
..
..
..
..
..
..
..
..
..
..
..
..
..
..
..
..
..
..
..
..
..
..
..
..
..
..
..
..
..
..
..
..
..
..
..
..
..
..
..
..
..
..
..
..
..
..
..
..
..
..
..
..
..
..
..
..
..
..
..
..
..
..........................................................................................................................................................................................................
.......................................................................................................................................
1
August 11 2017 46 Phillips Exeter Academy

Laboratory 7: Graphs and Derivatives Math 41C
1. Let y = x3− x. Find the derivative dydx
. Graph both functions on the same set of axes.
(a) What do you notice about the graph of y for those x-values where dydx
= 0?
(b) What do you notice about the graph of y for those x-values where dydx> 0?
(c) What do you notice about the graph of y for those x-values where dydx< 0?
2. Repeat Number 1 for the following functions.
(a) y = sinx
(b) y = x4 + 2x3 − 7x2 − 8x+ 12
(c) y = x+ 1x
3. An 8 × 15 rectangular sheet of metal can be transformed into a rectangular box bycutting four congruent squares from the corners and folding up the sides. The volumeV (x) of such a box depends on x, the length of the sides of the square cutouts.
(a) Use algebra to find an expression for the volume V (x). For what values of x doesV (x) make sense?
(b) Use V ′(x) to find the largest value of V (x) and the x-value that produces it.Explain your reasoning. Use a graph of V (x) to confirm your answer.
4. Write a paragraph summarizing what the values of the first derivative tell you aboutthe graph of a function. You should include in your summary the technical termsincreasing, decreasing, local maximum, and local minimum.
August 11 2017 47 Phillips Exeter Academy

Problem Set 8 Math 41C
1. The figure below shows the graph of y = f(x), where f is a differentiable function.The points P , Q, R, and S are on the graph. At each of these points, determine whichof the following statements applies:
(a) f ′ is positive (b) f ′ is negative (c) f is increasing(d) f is decreasing (e) f ′ is increasing (f) f ′ is decreasing
Q
RS
P
The graph y = f(x) is called concave up at points P and Q, and concave down atpoints R and S.
2. Use a derivative to confirm that (0, 0) and(
23, 4
27
)are locally extreme points on the
graph of y = x2−x3. Explain this terminology. Then consider the section of the curvethat joins these extreme points, and find coordinates for the point on it where the slopeis steepest.
3. Find the extreme points on y = x + 1x
by using a derivative. Confirm your answergraphically.
4. (Continuation) Find the extreme points on y = x + cx, where c is a positive constant.
Can you confirm your answer graphically? Explain.
August 11 2017 48 Phillips Exeter Academy

Problem Set 8 Math 41C
5. Suppose the revenue and cost functions (in thousands of dollars) for a manufacturerare r(x) = 9x and c(x) = x3 − 6x2 + 15x, where x is in thousands of units.
(a) What amount should be produced to generate the most profit? [Note: Profitequals revenue minus cost.]
(b) Compare the slopes of the revenue and cost functions at the x-value found in (a).
6. (Continuation) Obtain a graph of the revenue and cost functions from the previousproblem. The location of the maximum profit, which is the greatest difference betweenr(x) and c(x), appears to occur where the slopes of the two functions are equal. Usethe derivative of profit p(x) = r(x)− c(x) to show that this is true in general.
7. Use what you know about derivatives of power functions (functions of the form y = xn)to find the derivative of Q(x) = 60− 12
x√x
8. An object travels counterclockwise at 1 unit per second around the unit circle startingat the point (1,0).
(a) Write parametric equations for the position of the object in terms of t, the timein seconds. Use these equations to represent the position of the object as a vectorwith x- and y-components given as functions of time t in seconds. You can thinkof the position of the object as the tip of a vector with its tail at the origin.
(b) Find the velocity vector at the instant when the object is at each of the followingpoints: (1, 0), (0, 1), (−1, 0), (0,−1). How is the velocity vector oriented relativeto the position vector?
9. (Continuation) Find the velocity vector in terms of t for the object by taking derivativesof the x- and y-components found in part (a). Obtain a sketch of the position and
velocity vectors at the following points: (1, 0), (√
22,√
22
), and (−0.6, 0.8). Confirm thatthe velocity vector has a constant orientation relative to the position vector.
10. (Continuation) Suppose the object is actually tethered to a string of unit length as itis spun around a circle. What would happen to the object if the string suddenly brokeas the object was reaching (−0.6, 0.8)?
11. Oscillations between envelope lines.
(a) Graph the functions f(x) = x sinx, g(x) = x, and h(x) = −x. How is theoscillating curve of f related to the envelope lines g and h?
(b) Find the derivative of f .
(c) At what values of x does the graph of f touch the envelope lines? What are thex-values for the turning points of f? Are these two sets of points the same?
12. Suppose that f ′(a) = 0 and that f ′(x) changes from positive to negative at x = a.What does this tell you about the point (a, f(a)) on the graph of y = f(x)?
13. Suppose that f ′(a) = 0 and that f ′(x) changes from negative to positive at x = a.What does this tell you about the point (a, f(a)) on the graph of y = f(x)?
August 11 2017 49 Phillips Exeter Academy

Problem Set 8 Math 41C
14. Suppose that f ′(a) = 0 but that f ′(x) does not change sign at x = a. What does thistell you about the point (a, f(a)) on the graph of y = f(x)? Show a graph that hasthis property.
15. In most cases, a derivative, f ′, has its own derivative, f ′′, which is useful in manycontexts. This function is called the second derivative of f. If y = f(x), then we can
also write the second derivative as d2ydx2 . For each of the following, calculate the first
and second derivatives:
(a) y = sinx (b) s(t) = 400− 16t2 (c) g(x) = ex
x[Hint: write this as a product]
16. Obtain a graph of y = ln (1− x). What is the linear approximation centered at x = 0?
17. Calculate the derivative of each of the following functions:
(a) f(t) = t2e−t (b) g(u) = u2√u (c) y = x lnx
18. The linear equation y − 5 = m(x− 2) represents a family of lines.
(a) Describe this family of lines.
(b) What values of m will form a right triangle in the first quadrant bounded by theaxes and the line?
(c) Find expressions for the x- and y-intercepts in terms of m.
(d) Solve for the value of m that minimizes the area of the triangle described inpart (b).
19. Just as the second derivative is the derivative of the first derivative, the third derivativeis the derivative of the second derivative, and so on. For the following functions, findthe first and second derivatives, and continue finding higher derivatives until you areable to deduce a formula for the nth derivative.
(a) y = t · et (b) f(x) = xn
August 11 2017 50 Phillips Exeter Academy

Problem Set 8 Math 41C
20. Suppose that f(x) is defined for −4 ≤ x ≤ 4, and that its derivative f ′ is shown below.Use the information in this graph and the additional fact f(−1) = 3 to answer thefollowing:
(a) Is is possible that f(3) ≤ 3? Explain.
(b) Is is possible that 11 ≤ f(3)? Explain.
(c) For what x does f(x) reach its maximum value?
(d) For what x does f(x) reach its minimum value?
(e) Estimate the minimum value and make a sketch of y = f(x) for −4 ≤ x ≤ 4.
1
1
August 11 2017 51 Phillips Exeter Academy

Laboratory 8: What’s the Most Exciting Moment on the Tilt-a-Whirl? Math 41C
The Tilt-a-Whirl, shown at left, is a popular carni-val ride in which riders sit in carts that can be spunby the rider in circles, while the carts themselves aregoing around in a larger circle. The distance fromthe center of the large circle to the center of a cart’ssmall circle is 5 meters. The cart’s small circle hasa radius (from center to seat) of about one meter.It takes 12 seconds to go once around the large cir-cle. The small circles are actually controlled by theriders, but let’s suppose that a rider is spinning ata constant rate of once every three seconds.
We can describe the location (x, y) of a rider by setting up our coordinate system with thecenter of the large circle at the origin. We want to know the location of a rider as a functionof time, and we will use parametric equations where x and y are functions of time t. Recallthat in Book 3 we used parametric equations to describe the location of a point on a rotatingwheel (a Ferris wheel, for example), and we also modeled the location of a point on a wheelthat rolls along the ground. Both situations are helpful references as we model the Tilt-a-Whirl, which is like a rotating wheel — at least the large circle is — but with the addedcomplication of a small circle that spins as it rotates around the large circle.
Part 1
1. The Tilt-a-Whirl starts up and you are in one of the carts. Sketch a graph of whatyou think your path looks like as the large circle turns around its center (which is theorigin of your coordinate system), and your cart is simultaneously spinning around itssmall circle.
2. Write parametric equations for Q(x, y), where Q is the center of a cart’s small circleas the large circle turns around the origin. Use the relevant values given in the firstparagraph.
3. Write parametric equations for the motion of R(x, y), where R is a point on a cart’ssmall circle, and the motion is expressed relative to the center of the small circle.Equivalently, find the equations for R assuming the large circle is not moving. Use therelevant values given in the first paragraph of the introduction.
4. Explain why the parametric equations for P (x, y), where P represents the location ofa cart as its spins around the small circle while also rotating around the large circle,can be found by adding Q and R, as in P (x, y) = Q(x, y) +R(x, y).
5. Obtain a graph of P (x, y) using graphing technology. How does your graph comparewith the graph you sketched in number 1? Adjust your equations as necessary to geta reasonable result.
August 11 2017 52 Phillips Exeter Academy

Laboratory 8: What’s the Most Exciting Moment on the Tilt-a-Whirl? Math 41C
Part 2
6. You can create a position vector s from the origin to the point P , the magnitude ofwhich gives you the rider’s distance from the origin. The components of s are theparametric functions x(t) and y(t) that you found in Part 1 when you graphed P (x, y).Write an equation in terms of x(t) and y(t) for the magnitude of s, and graph themagnitude versus time for one 12-second revolution, 0 ≤ t ≤ 12.
7. The velocity can also be represented as a vector, which we will call v. The velocityhas a magnitude and a direction, and the components of v are the derivatives of thecomponents of s. Use calculus to find the velocity vector v = [x′(t), y′(t)].
8. The magnitude of the velocity vector is the speed of the rider, which is given by|v| =
√[x′(t)]2 + [y′(t)]2. Graph the speed over the 12-second interval of a single rev-
olution.
9. Now do the same thing for acceleration: find the acceleration vector using derivativesand graph its magnitude as a function of time.
10. You now have three graphs that you can align as functions of time, or you can plotall three on the same set of axes. Based on these graphs, as well as the graph yougenerated in Part 1, at what points on the Tilt-a-Whirl do you think riders have themost fun? Explain your reasoning.
Part 3
11. Open the accompanying Geogebra file and run the animations in the graphing windows.Compare the graph in the window at the bottom of the screen, which shows themagnitudes of the position/velocity/acceleration vectors, to the graphs you found inPart 2.
12. In the top window, you will notice a point moving around the Tilt-a-Whirl curve, aswell as vectors for position, velocity, and acceleration. The position vector has itstail at the origin, the tail of the velocity vector is anchored to the tip of the positionvector, and likewise the acceleration vector is attached to the velocity vector. Studythe animation in conjunction with the graph of the magnitudes of the vectors. Nowreconsider an earlier question: At what points on the Tilt-a-Whirl do you think ridershave the most fun?
13. Write a summary of what you have learned in this lab, especially regarding parametricequations, vectors, and their derivatives.
ExtensionAs an additional challenge, investigate what happens if you speed up the rotation of the cart.One way you can do this in the Geogebra simulation is by introducing a slider parameter tothe vector equations in place of the number 3 that corresponds to the spinning rate of thecart. If k is the parameter, then the cart spins once every k seconds instead of once every 3seconds.
August 11 2017 53 Phillips Exeter Academy

Mathematics 42C
Mathematics DepartmentPhillips Exeter Academy
Exeter, NHAugust 11 2017

Laboratory 9: Graphs and the Second Derivative Math 42C
1. Let y = x4 − x2. Find the first derivativedy
dxand the second derivative
d2y
dx2. Graph
all three functions on the same set of axes in a suitable sized window centered at theorigin.
(a) What do the values ofd2y
dx2tell you about the graph of
dy
dx? (This is an application
of the concepts of the previous lab.) You should include in your explanation wordssuch as increasing, decreasing, turning points, and so on.
(b) What do the values ofd2y
dx2tell you about the graph of y? As with the previous
lab, consider where the second derivative is positive, where it is negative, andwhere it equals zero. The terms concave up and concave down may be useful inyour description.
2. Repeat the questions of Problem (1) for the following functions.
(a) y = sinx
(b) g(x) = x4 + 2x3 − 7x2 − 8x+ 12
(c) f(x) = x+1
x
3. Fill in the blanks in the following statements based on your observations in Problems(1) and (2).
(a) If the second derivative is positive, then the first derivative isand the graph of the function is .
(b) If the second derivative is negative, then the first derivative isand the graph of the function is .
(c) If the second derivative changes sign (goes from positive to negative or negativeto positive), then the first derivative has a local and the graphof the function changes . This location on the function is calleda point of inflection.
4. Write a lab report summarizing what the values of the second derivative tell you aboutthe graph of the first derivative, and hence the graph of the function.
August 11 2017 1 Phillips Exeter Academy

Problem Set 10 Math 42C
1. What can be said about the derivative of (a) an odd function? (b) an even function?
2. Suppose that f ′′(a) = 0 and that f ′′(x) changes from negative to positive at x = a.What does this tell you about the point (a, f(a)) on the graph of y = f(x)?
3. Use derivatives to find coordinates for the inflection points on the graph of y = xe−x.Examine a graph to confirm your answers.
4. Suppose that f ′′(a) = 0 and that f ′′(x) changes from positive to negative at x = a.What does this tell you about the point (a, f(a)) on the graph of y = f(x)?
5. Composition of functions. The function h defined by h(x) = f(g(x)) is a compositionof functions in which f is composed with g. Let f(x) = sin x and g(x) = 2πx. Findexpressions for each of the following functions and their derivatives: (a) h(x) = f(g(x))(b) u(x) = g(f(x))
6. Obtain a graph of the function y = |x2 − 4| over the interval −4 ≤ x ≤ 4.
(a) What is the equation of the tangent line at the point with x = 0? If your definitionof tangent line is based upon the phrase “only one point of intersection,” then isthere another line that intersects the curve only once at the point with x = 0?
(b) Come up with a definition of tangent line that results in a unique line for x-values on the curve such that −4 ≤ x ≤ 4. You will want to consider how “locallinearity” can be used in your definition.
(c) Notice that this graph is not “smooth” at the points where x = ±2. Can youfind a unique tangent line to the curve at either of those points? Based on yourdefinition in part (b), can you say that a tangent line exists at either of thosepoints? How does the existence of a tangent line at a point rate to differentiability,the existence of the derivative at that point?
7. The second derivative of f(x) = x4 is 0 when x = 0. Does that mean the origin is aninflection point on the graph of f? Explain.
8. A plastic box has a square base and rectangular sides, but no top. The volume is 256cc. What is the smallest amount of plastic that can be used to make this box? Whatare the dimensions of the box?
9. (Continuation) The previous problem can be solved graphically without using calculustechniques, and this strategy is often used in Book 3 problems. So why do we needcalculus? Suppose you want to solve the problem in general for any volume V , not justV = 256 cc. Solve this new problem using the techniques of calculus. Your minimumsurface area and the accompanying dimensions will be given in terms of V .
10. At an inflection point, the tangent line does something unusual, which tangent linesdrawn at non-inflection points do not do. What is this unusual behavior?
11. Given the functions f(x) = ex and g(x) = 2x− 2, differentiate the following composi-tions of these functions.
August 11 2017 2 Phillips Exeter Academy
Problem Set 10 Math 42C
(a) y = f(g(x))
(b) y = g(f(x))
12. An object moves along the x-axis with its position at time t given by x = t + 2 sin t,for 0 ≤ t ≤ 2π.
(a) What is the velocity dxdt
of the object at time t?
(b) For what values of t is the object moving in the positive direction?
(c) For what values of t is the object moving in the negative direction?
(d) When and where does the object reverse its direction?
13. A windmill extracts energy from a stream of air according to the power function P (x) =2kx2(V − x), where k is a constant, V is the velocity of the wind, and x is the averageof the wind speeds in front and behind the windmill.
(a) Find the derivative of P .
(b) Use the derivative to find the value of x that maximizes the power P . Your answerwill be in terms of the parameters k and V . What is the maximum power?
(c) According to Betz’s Law, the maximum power that can be extracted from thewind is 16/27 times the power in the wind stream, which is k
2· V 3. Verify that
the value for P found in (b) is indeed 1627· k
2· V 3.
The following questions refer to the article from The Economist that follows.
14. In the second paragraph, the author states: “Nobody cares much about inflation; onlywhether it is going up or down.” How can this statement be translated into the languageof derivatives?
15. “National debt” refers to how much the government has borrowed throughout the yearsof its history. A “budget deficit” refers to how much a government spends in a yearbeyond its annual revenues (which come mainly from taxes).
(a) How is one of these related to the other by differentiation?
(b) Using the language of calculus, explain what happens to national debt if budgetdeficits are growing each year. What if the budget deficits are declining? Whatwould have to occur with budget deficits for the national debt to decrease?
16. Find three other examples in the article that involve the way things change. Translateyour examples into the language of derivatives.
17. What does an increase in the amount of change in a quantity say about the particularphenomenon? What about a decrease in the amount of change?
August 11 2017 3 Phillips Exeter Academy

Problem Set 10 Math 42C
THE TYRRANY OF DIFFERENTIAL CALCULUSd2P
dT 2> 0 = misery
from The Economist, 6 April 1991
Rates of change and the pace of decay“The pace of change slows,” said a headline onthe Financial Times’s survey of world paintsand coatings last week. Growth has been slow-ing in various countries — slowing quite quicklyin some cases. Employers were invited recentlyto a conference on Techniques for ImprovingPerformance Enhancement. It’s not enough toenhance your performance, Jones, you must im-prove your enhancement.Suddenly, everywhere, it is not the rate of changeof things that matters, it is the rate of change ofrates of change. Nobody cares much about in-flation; only whether it is going up or down. Orrather, whether it is going up fast or down fast.“Inflation drops by a disappointing two points,”cries the billboard. Which, roughly translated,means that prices are still rising, but less fastthan they were, though not quite as much lessfast as everybody had hoped.No respectable American budget director hasdiscussed reducing the national debt for decades;all talk sternly about the need to reduce the bud-get deficit, which is, after all, roughly the rateat which the national debt is increasing. Indeed,in recent years it is not the absolute size of thedeficit that has mattered so much as the trend:is the rate of change of the rate of change of thenational debt positive or negative?Blame Leibniz, who invented calculus (yes, sodid Newton, but he called it fluxions, and didhis best to make it incomprehensible). Rates ofchange of rates of change are what mathemati-cians call second-order differentials or secondderivatives. Or blame Herr Daimler. Until themotor car came along, what mattered was speed,a first-order differential. The railway age was anera of speed. With the car came the era of ac-celeration, a second-order differential: the factthat a car can do 0-60mph in eight seconds is afar more important criterion for the buyer than
that it can do 110mph. Acceleration limits arewhat designers of et fighters, rockets and racingcars are chiefly bound by.Politicians, too are infected by ever higher ordersof political calculus. No longer is it necessary tohave a view on abortion or poll taxes. Far betterto commission an opinion poll to find out whatthe electorate’s view is, then adopt that view.Political commentators, and smart-ass journal-ists, make a living out of the second-order dif-ferential: predicting or interpreting what politi-cians think the electorate thinks. Even ethicshas become infected (“You did nothing wrong,Senator, and even the appearance of it does notstink, but people might think it will appear tostink”).
Bring back the integralIt boils down to biology. There is virtually noth-ing in the human brain or the nerves that mea-sures a steady state. Everything responds tochange. Try putting one hand in hot water andthe other in cold water. After a minute put bothhands in tepid water. It will feel hot to one, coldto the other. The skin’s heat sensors measurechanges in temperature.The visual system of the from is a blank screenon which on things that move (delicious flies ordangerous enemies) show up, like shooting startsin a night sky. Human eyes have “edge detec-tors” to catch second-order differentials. Theyrespond to the places where the rate of changeof the rate of change of light hits zero — thesemark the edges of things.Soon second-order differentials will be passe,and the third order will be all the rage, withheadlines reading “inflation’s rate of increase isleveling off”, or “growth is slowing quite quickly”.Frenzy will then be a steady state. It will be hightime to reverse the slide into perpetual differen-tiation. Workers of the world, integrate!
August 11 2017 4 Phillips Exeter Academy

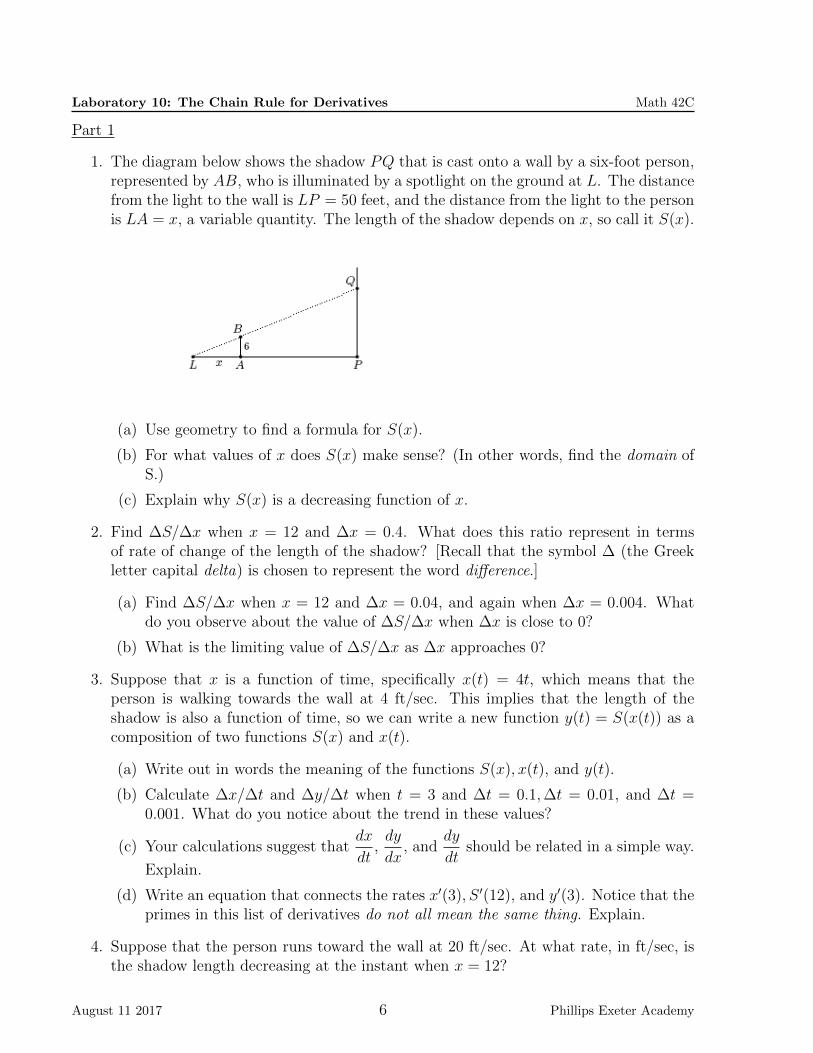
Laboratory 10: The Chain Rule for Derivatives Math 42C
Part 1
1. The diagram below shows the shadow PQ that is cast onto a wall by a six-foot person,represented by AB, who is illuminated by a spotlight on the ground at L. The distancefrom the light to the wall is LP = 50 feet, and the distance from the light to the personis LA = x, a variable quantity. The length of the shadow depends on x, so call it S(x).
(a) Use geometry to find a formula for S(x).
(b) For what values of x does S(x) make sense? (In other words, find the domain ofS.)
(c) Explain why S(x) is a decreasing function of x.
2. Find ∆S/∆x when x = 12 and ∆x = 0.4. What does this ratio represent in termsof rate of change of the length of the shadow? [Recall that the symbol ∆ (the Greekletter capital delta) is chosen to represent the word difference.]
(a) Find ∆S/∆x when x = 12 and ∆x = 0.04, and again when ∆x = 0.004. Whatdo you observe about the value of ∆S/∆x when ∆x is close to 0?
(b) What is the limiting value of ∆S/∆x as ∆x approaches 0?
3. Suppose that x is a function of time, specifically x(t) = 4t, which means that theperson is walking towards the wall at 4 ft/sec. This implies that the length of theshadow is also a function of time, so we can write a new function y(t) = S(x(t)) as acomposition of two functions S(x) and x(t).
(a) Write out in words the meaning of the functions S(x), x(t), and y(t).
(b) Calculate ∆x/∆t and ∆y/∆t when t = 3 and ∆t = 0.1,∆t = 0.01, and ∆t =0.001. What do you notice about the trend in these values?
(c) Your calculations suggest thatdx
dt,dy
dx, and
dy
dtshould be related in a simple way.
Explain.
(d) Write an equation that connects the rates x′(3), S ′(12), and y′(3). Notice that theprimes in this list of derivatives do not all mean the same thing. Explain.
4. Suppose that the person runs toward the wall at 20 ft/sec. At what rate, in ft/sec, isthe shadow length decreasing at the instant when x = 12?
August 11 2017 6 Phillips Exeter Academy

Laboratory 10: The Chain Rule for Derivatives Math 42C
Part 2
1. The diagram below shows a falling object A, which is illuminated by a streetlight Lthat is 30 feet above the ground. The object is 10 feet from the lamppost, and w feetbelow the light, as shown. Let S be the distance from the base of the lamppost to theshadow Q.
(a) Confirm that S =300
wand
dS
dw= −300
w2. What is the significance of the minus
sign in the derivative?
(b) Find ∆S when w = 9 and ∆w = 0.24. Explain why ∆S is approximately equal
todS
dw·∆w.
2. Suppose the object was dropped from 30 feet above ground. From the laws of physics
we know that the distance fallen is w = 16t2. Calculate w anddw
dtwhen t = 0.75 sec.
Calculate ∆w when t = 0.75 and ∆t = 0.01, and notice thatdw
dt·∆t ≈ ∆w.
3. The distance S from Q to the lamppost is also a function of time, so it makes sense
to calculatedS
dt. Calculate this velocity when t = 0.75 sec. Confirm that
dS
dtis in fact
equal to the product ofdS
dwand
dw
dtfor all values of t in the domain.
Part 3
1. The function defined by h(x) = (x2 + 5)2 is a composition of two functions. One of thefunctions is g(x) = x2 + 5 and the other is f(x) = x2. Confirm that h(x) = f(g(x)).You can find h′(x) by first multiplying x2 + 5 by itself, collecting like terms, and thendifferentiating term-by-term. Do so, and then confirm that h′(x) = f ′(g(x))g′(x). Thisis an example of the Chain Rule for derivatives. In what form did you encounter theChain Rule in Parts 1 and 2?
August 11 2017 7 Phillips Exeter Academy

Laboratory 10: The Chain Rule for Derivatives Math 42C
2. Another way of understanding the Chain Rule is through linear approximation. Webegin with the composite function h(x) = f(g(x)).
(a) Using the linear approximation for g(x) near x = a, show thath(x) ≈ f(g′(a)(x− a) + g(a)).
(b) Confirm thatd
dx[f(mx+ b)] = f ′(mx+ b) ·m by referring to your previous work
with derivatives of functions composed with linear functions.
(c) Hence show that h′(x) ≈ f ′(g′(a)(x − a) + g(a)) · g′(a), and thus explain thefollowing equation: h′(a) ≈ f ′(g(a)) · g′(a).
(d) How does part (c) establish the Chain Rule h′(x) = f ′(g(x))g′(x)?
3. Use the Chain Rule to find the derivative of the function h(x) =√
1− x2.
4. Write a paragraph summarizing your understanding of the Chain Rule. Be sure toinclude what types of functions you can now find the derivatives of, which you wereunable to find previously.
August 11 2017 8 Phillips Exeter Academy

Problem Set 11 Math 42C
1. If y = f(u) and u = g(x), then the Chain Rule can also be written as dydx
= dydu· dudx
.
(a) How does this notation compare with h′(x) = f ′(g(x))g′(x)? Explain how the twoforms are the same.
(b) For the function y = esinx, identify the functions f and g that are composed withf being the “outer” function and g being the “inner” function.
(c) Find dydx
using the Chain Rule.
2. The function y = e−x2
has a graph shaped like a bell curve.This function is widely usedin statistics by using various basic transformations of the graph.
(a) Confirm that the graph has a bell shape. What are the main features of thegraph?
(b) Find dydx
and d2ydx2 .
(c) Describe the concavity of the graph, and find the coordinates of any points wherethe concavity changes, the so-called points of inflection.
3. The annual government expenditures E in Geerland can be modeled as a function ofpopulation P by E(P ) = 10
√P , with units of thousands of dollars. The population is
growing and is modeled by the function P (t) = 100e0.03t, where t is in years.
(a) Express E as a function of time.
(b) Find the derivative of E with respect to time.
(c) Comment on the graphs of E(t) and E ′(t).
4. (Continuation) Suppose now the population of Geerland grows according to the func-tion P (t) = 10000− 9900e−0.03t.
(a) Graph P over a suitable domain. Why do you think this model is called con-strained growth? What is the constraint, or upper limit, on the population?
(b) Find the derivative of E with respect to time using the constrained growth modelfor population.
(c) Comment on the graphs of E and the derivative of E.
5. Find the derivatives of the following functions.
(a) H(u) = (sinu)3
(b) C(t) = et+e−t
2
(c) v(x) =√r2 − x2
(d) y = 1cosx
(e) u = (t+ 1)2 ln t
August 11 2017 9 Phillips Exeter Academy
Problem Set 11 Math 42C
6. A particle moves along a number line according to x = t4 − 4t3 + 3, during the timeinterval −1 ≤ t ≤ 4. Calculate the velocity function dx
dtand the acceleration function
d2xdt2
. Use them to help you give a detailed description of the position of the particleaccording to the following questions.
(a) At what times is the particle (instantaneously) at rest, and where does this hap-pen?
(b) During what time intervals is the position x increasing? When is x decreasing?
(c) At what times is the acceleration of the particle zero? What does this signify?
(d) What is the complete range of positions of the particle?
(e) What is the complete range of velocities of the particle?
7. For each of the following description of dydx
, what type of function is y? For example,your answer in (a) could be something like this: The derivative is a constant, thereforethe function must be .
(a) dydx
= c, where c is a constant
(b) dydx
= ky, where k is a constant
(c) dydx
= cosx
8. (Continuation) Equations involving derivatives, of which these are examples are knownas differential equations. Give a particular solution of y as a function of x for each one.Why are there many solutions for each equation?
9. If we ignore the effects of air resistance, a falling object has a constant acceleration of9.8 m/sec2.
(a) If the object falls from an initial height of 100 meters with initial velocity of 0,find equations for the velocity and height as functions of time (until the objecthits the ground). With what speed does it strike the ground?
(b) If the object falls from an initial height of 100 meters and it is initially projectedupward with a velocity of 20 m/sec, find equations for the velocity and height asfunctions of time (until the object hits the ground). What is the maximum heightand when does that occur? With what speed does it strike the ground?
August 11 2017 10 Phillips Exeter Academy

Problem Set 11 Math 42C
10. The following graph shows a line and its reflection across the line y = x. Find theimages of points A and B, then find the equation of the image line. What is therelationship between the slope of the original line and the slope of its reflection?
11. (Continuation) The figure below shows a line y = m(x−a)+a and its reflection acrossthe line y = x.
(a) Explain why the equation y = m(x− a) + a fits the line shown.
(b) Find the images of points A and B, and hence find the equation of the reflectedline.
(c) What have you shown about the relationship between the slope of a line l andthe slope of the reflection of l through y = x?
August 11 2017 11 Phillips Exeter Academy

Problem Set 11 Math 42C
12. Given the graph of a set of points (a, b), the set of points (b, a) is a reflection over whatline?
13. (Continuation) If the set of points (x, y) that satisfy the equation y = x2 is reflectedthrough the line y = x, then the resulting set of point satisfies which of the followingequations?
(a) x = y2
(b) y =√x
14. Implicit Differentiation. Find the derivative of both sides of the equation for the unitcircle equation x2 + y2 = 1. Term-by-term differentiation is straightforward for two ofthe three terms of this equation, specifically d
dx[x2] = 2x and d
dx[1] = 0.
(a) Explain how the chain rule is used in the differentiation ddx
[y2] = 2y · dydx
. Thisderivative assumes that y is an implicitly defined function of x.
(b) Put all the pieces together and solve for dydx
from the circle equation. How elsecould you have found this derivative?
15. Find the derivatives of the following functions.
(a) y = 1sinx
(b) u = (t− 1)3 ln t
(c) f(x) = ecosx
16. Sketch on the axes below the graph of the reflection of y = sinx across the line y = x.
August 11 2017 12 Phillips Exeter Academy
Problem Set 11 Math 42C
17. The function sin−1 x defines an angle whose sine ratio is x. You may recall from Book3 that for this operation to give only one angle, the range of angles has to be limited.
(a) What is the range of the function y = sin−1 x? If you are unsure, you could tryvarious sine ratios on your calculator (which are necessarily between -1 and 1,inclusive) and see what range of angles result. (Be in radian mode.)
(b) Why is the range of y = sin−1 x limited?
(c) If you start with an angle measuring 1 radian and take the sine of this angle, youget approximately 0.8415. If you then take the inverse sine of 0.8415, you getback to the 1 radian angle you started with (or nearly so depending on how youround off). In contrast, if you start with an angle measuring 2 radians and takethe sine of this angle, you get approximately 0.9093. If you then take the inversesine of 0.9093, you get approximately 1.142, which is not close to 2 radians. Whataccounts for the different results in these two examples?
18. (Continuation) What is the range of the function y = cos−1 x? This is equivalent toasking how the domain of y = cos x is restricted so that the reflection of the graphacross y = x is also a function.
19. The parametric equation (x, y) = (5 cos t, 15 sin t) traces an ellipse as t varies from 0to 2π (in radians).
(a) Confirm by graphing and by algebra that this ellipse also has equation 9x2 +y2 =225.
(b) Find the t-value that corresponds to the point (4, 9).
(c) Find the components of velocity dxdt
and dydt
, and find their values at (4, 9).
(d) On a graph of the ellipse, show the vector [dxdt, dydt
] with its tail at (4, 9) using thevalues of the components found in part (c). Use these components of velocity tofind the slope of the line tangent to the curve at (4, 9).
20. Consider the function y = tanx and its inverse y = tan−1 x.
(a) Obtain a graph of y = tanx over the domain −3π2≤ x ≤ 3π
2. This will result in
three branches of the function, each branch situated between vertical asymptotes.What are the equations of the asymptotes?
(b) Now enter a graph of y = tan−1 x on the same set of axes. Notice that only onebranch of this new function is allowed. How do you account for the appearance ofy = tan−1 x relative to the graph of y = tanx? Your explanation should includea reflection across a line, horizontal asymptotes, and limits on the domain andrange of the two functions.
21. You previously discovered the derivative formula ddx
[lnx] = 1x. This formula can also
be established through the derivative of ex, which is the inverse of ln x:
(a) starting with y = lnx, write x as a function of y, so that ey = x;
August 11 2017 13 Phillips Exeter Academy

Problem Set 11 Math 42C
(b) use implicit differentiation to show that ey dydx
= 1;
(c) solve for dydx
and substitute for y in terms of x to show that dydx
= 1x.
22. Explain why the graphs of inverse functions are related by a reflection across the liney = x.
(a) On the same system of coordinate axes, and using the same scale on both axes,make careful graphs of both y = lnx and y = ex.
(b) Let P = (a, b) be a point on the graph of y = ln x, and let Q = (b, a) be thecorresponding point on the graph of y = ex. How are the slopes of the curvesrelated at these two points? Explain.
(c) Find the slopes at P and Q by using the derivatives of lnx and ex. Confirm therelationship between the slopes of corresponding points on the graphs of theseinverse functions by letting a = 0.5, 1, and 1.5.
23. (a) Given sin θ = 0.352, it is possible to find cos θ without finding the value of θ.Show how.
(b) If sin θ = x, then what is cos θ in terms of x?
(c) Explain the equivalence of cos(arcsinx) and√
1− x2.
(d) Use implicit differentiation to find the derivative of y = sin−1 x by first rewrit-ing the equation as sin y = x. Your answer should simplify to the formuladdx
[sin−1 x] = 1√1−x2 .
August 11 2017 14 Phillips Exeter Academy

Laboratory 11: Discovering Differential Equations Math 42C
1. A ball moves along a straight path according to the linear equation y = 3t, wherethe position y from the starting point is measured in feet and time t is measured inseconds.
(a) What are the initial positions and velocity of the ball? What are the position andvelocity after the ball has rolled for 1 second?
(b) Write an equation for the velocity dydt
at time t in the form dydt
= .
(c) Determine another linear relationship between an object’s position and time, inwhich the velocity equation at time t is the same as in part (b). How have youtransformed the graph of y = 3t?
(d) The equation in part (b) represents all linear functions whose rate of change isa constant 3 ft/sec. This is an example of a differential equation. Now write adifferential equation for the rate of change of a general linear function y = mx+b.How many functions does your differential equation represent?
(e) Solve the differential equation dydx
= 10 for the particular solution that containsthe point (0, 5).
2. The height of an object dropped from a building is described by the quadratic equationh = 400− 16t2, where h is measured in feet and t is measured in seconds.
(a) What are the initial height and velocity of the object? What are these values2 seconds later?
(b) Write a differential equation for the velocity at time t.
(c) What is another quadratic equation relating an object’s height and time in whichthe velocity equation is the same as in part (b)? How have you transformed thegraph of h = 400− 16t2?
(d) Write a differential equation for the rate of change of a general quadratic functiony = ax2 + bx+ c.
(e) Solve the differential equation dhdt
= −10t for the particular solution that has aninitial height h = 150 meters.
3. The population of a town is given by exponential equation P = 4123e0.02t, where t ismeasured in years since the beginning of 2010.
(a) Determine the initial population (in 2010, which is at time t = 0) and the initialinstantaneous growth rate.
(b) Write a differential equation for the growth rate of P at any time t. Notice thatwithin this differential equation you will find P multiplied by some constant.Rewrite the differential equation in terms of P .
(c) Determine another exponential relationship in which the differential equation (interms of P ) is the same as in part (b). How have you transformed the graph ofP = 4123e0.02t?
(d) Write a differential equation for the rate of change of a general exponential func-tion with base e, initial value A, and growth rate k.
August 11 2017 15 Phillips Exeter Academy
Laboratory 11: Discovering Differential Equations Math 42C
(e) Solve the differential equation dPdt
= 0.15P for the particular solution with aninitial value of P = 225.
4. The height of a weight on a spring is given by the sinusoidal equation h = 12 sin(2πt),where h = 0 is the position of the weight when it is hanging on the spring at rest (theso-called equilibrium position).
(a) Graph this function and describe the motion of the weight. How long does it takefor one complete oscillation? How far does the weight move?
(b) Write a differential equation for the velocity at time t. Graph the velocity on thesame set of axes as the position. How are the two curves related?
(c) How can you transform the equation for h in a way that the velocity stays thesame for all values of t? What does this transformation mean in the context ofthe problem?
(d) Solve the differential equation dhdt
= 12π cos(4πt) for the particular solution withan initial height of h = 10. What is the range of values for h in your solution?
5. In questions (1) through (4), you have considered linear, quadratic, exponential, andsinusoidal functions. For which of these equations is the rate of change at time tconstant? For which of these equation is the percent rate of change at time t constant?
6. Write a paragraph summarizing what you have learned in this lab about differentialequations. Be sure to include observations about families of functions that have thesame differential equation. You will also want to incorporate the concepts of constantchange, linear change, constant percentage change, and sinusoidal change in your write-up.
August 11 2017 16 Phillips Exeter Academy

Problem Set 12 Math 42C
1. Find dydx
for each of the following functions:
(a) y = x√
1− x2 (b) y = sin(x2) (c) y = 9− cos2(90x)
2. The core temperature of a potato that has been baking in a 375◦ oven for t minutes ismodeled by the equation C = 375− 300(0.96)t. Find a formula for the rate of changeof the temperature (in degrees per minute) for this potato.
3. The equations y = 2x and y = log2 x represent inverse functions. Find the derivativesof each function, and explain how they are related.
4. A can with a volume of 1000 cc consists of a cylinder with a top and a bottom. Theheight of the can is h cm, and the radius of the top and bottom is r cm.
(a) What is the surface area of the side? What is the surface area of the top andbottom? Write out an equation for the total surface area A in terms of r and h.
(b) Explain why πr2h = 1000. Use this equation to express surface area A as afunction of r alone.
(c) Use a derivative to find the value of r that gives the minimum value of A. Confirmyour answer graphically. What is the value of h that corresponds to this r-value?How would you describe the shape of this can of minimum surface area?
5. (a) On the same system of coordinate axes, and using the same scale on both axes,make careful graphs of both y = sinx and y = sin−1 x. These graphs shouldintersect only at the origin. (Note: Be sure that your angles are measured inradians.) Why is it necessary to restrict the domain of y = sinx to −π
2≤ x ≤ π
2,
and thus to restrict the range of y = sin−1 x to −π2≤ y ≤ π
2?
(b) Let P = (a, b) be a point on the graph of y = sin x, where −π2≤ a ≤ π
2, and let
Q = (b, a) be the corresponding point on the graph of y = sin−1 x. How are theslopes of the curves related at these two points? Explain.
(c) Find the slopes at P and Q by using the derivatives of sinx and sin−1 x. Confirmthe relationship between the slopes of corresponding points on the graphs of theseinverse functions by letting a = 0.5, 1, and 1.5.
6. Find the derivatives of the following functions.
(a) L(x) = cos−1 x (Hint: use implicit differentiation.)
(b) y = x sin−1 x (Hint: use the product rule.)
7. With the help of the Chain Rule and the Power Rule, write out the derivative off(x) = (sin x)1/2. Then find a formula for the general example of this type, which hasthe form f(x) = (g(x))n.
8. Using the Chain Rule and Power Rule, show that the derivative of R(x) =1
g(x)is
R′(t) = − g′(t)
[g(t)]2. (Hint: first write R as a power function R(x) = [g(x)]−1).
August 11 2017 17 Phillips Exeter Academy

Problem Set 12 Math 42C
9. (Continuation) Quotient Rule. A function Q defined as a ratio of two functions Q(x) =f(x)
g(x)can be differentiated by first rewriting Q as a product Q(x) = f(x) · 1
g(x). Show
that Q′(x) can be written as:
d
dx
[f(x)
g(x)
]=g(x) · f ′(x)− f(x) · g′(x)
[g(x)]2
10. Sketch the graph of the reflection of y = 2x across the line y = x on the axes below.
−4 −3 −2 −1 1 2 3 4 5 6
−4
−3
−2
−1
1
2
3
4
y = x
y = 2x
11. Graph the function f(x) = x − sinx and its inverse. Although one cannot find anexplicit formula for f−1(x), one can find the value of its derivative at certain points.
(a) Find the derivative of f−1(x) at the point (π, π).
(b) Find the derivative of f−1(x) at the point (π2− 1, π
2).
12. Write a paragraph summarizing what you have learned about the relationship betweenthe derivative of a function and the derivative of the inverse function. Be sure toinclude the relationship between the graph of a function and its inverse, techniquesyou have learned for finding the derivative of an inverse function, and the connectionbetween the slope at a point on a function’s graph and the slope at the correspondingpoint on the inverse function’s graph.
13. Use implicit differentiation to find the slope of the ellipse x2 + 9y2 = 225 at (9, 4). Inother words, find dy
dxwithout first trying to solve for y as an explicit function of x.
August 11 2017 18 Phillips Exeter Academy

Problem Set 12 Math 42C
14. Let f(x) = x3, g(x) = x4, and k(x) = x7. Notice that k(x) = f(x) · g(x). Is it alsotrue that k′(x) = f ′(x) · g′(x)? Explain.
15. Use a derivative to calculate the slope of the curve y = x3 at the point (2, 8). Nowfind the slope of the curve x = y3 at the point (8, 2). How could you have found thesecond slope from the first slope without finding another derivative?
16. After first writing tanx =sinx
cosx, use the Quotient Rule to show that d
dx[tanx] = sec2 x.
(Recall that secx = 1/ cosx.)
17. Find the derivatives of the following:(a) f(x) = x3 + 3x (b) M(θ) = 8 tan(3θ) (c) H(u) = (sinu)3
18. Finddy
dxfor each of the following:
(a) y =x− 1
x+ 1
(b) y =1
cosx
(c) y = sin−1 2x
(d) y =x
x2 + 1
19. The parametric equation (x, y) = (4 tan t, 3 sec t) traces both branches of a hyperbolaas t varies from 0 to 2π (in radians).
(a) Confirm by graphing and by algebra that this hyperbola also has equation 16y2−9x2 = 144. [You will need the identity tan2 t+ 1 = sec2 t.]
(b) Find the t-value that corresponds to the point
(16
3, 5
).
(c) Find the components of velocitydx
dtand
dy
dt, and find their values at
(16
3, 5
).
(d) On a graph of the hyperbola, show the vector
[dx
dt,dy
dt
]with its tail at
(16
3, 5
)using the values of the components found in part (c). Use these components of
velocity to find the slope of the line tangent to the curve at
(16
3, 5
).
20. The equation A(t) = 6.5− 20.4t
t2 + 36models the pH of saliva in the mouth t minutes after
eating candy. The lower the pH, the more acidic is the saliva. A pH of 7 is neutral.
(a) Using a graph of this function, what is the normal pH in the mouth? How longafter eating candy does it take for the pH to return to within 0.1 of normal?
(b) After eating the candy, when is the mouth becoming more acidic? When is theacidity decreasing?
August 11 2017 19 Phillips Exeter Academy

Problem Set 12 Math 42C
(c) At what time is there a point of inflection on the graph? What interpretation canyou give to this point in the context of the problem?
21. The following questions concern the curve defined parametrically by
(x, y) = (cos t− 3 sin t, 2 cos t sin t) .
(a) Obtain a graph of this curve for 0 ≤ t ≤ 2π. In which direction is the curve sweptout as t increases?
(b) For what points on the curve isdy
dt= 0? What are the equations of the tangent
lines at those points?
(c) For what points on the curve isdx
dt= 0? What are the equations of the tangent
lines at those points?
(d) Find the slope of the curve at any point in terms of the parameter t. Use thisexpression to find the equation of the tangent line at the point with t = 1.
22. The acceleration due to gravity on the Moon is about 1.6 m/sec2.
(a) Represent the acceleration with a differential equation (DE) using the derivativeof the velocity v of a falling object on the Moon.
(b) Use the DE from part (a) to find an equation for the velocity of an object that ispropelled upward with an initial velocity of 25 m/sec.
(c) Since v =dh
dt, where h is the height of the object, you can use the result of part
(b) to write a DE for the height of the object. Solve this DE for h as a functionof t given that the initial height of the object is 3 meters.
23. Suppose the acceleration due to gravity is a constant g m/sec2, the initial velocity isv0 m/sec, and the initial height is h0 meters. As in the previous problem, write a DEfor acceleration, then use this to find the DE for velocity. Finally, solve the DE forvelocity to get an equation for h as a function of t. You should obtain this well-known
formula from physics: h = −g2t2 + v0t+ h0.
August 11 2017 20 Phillips Exeter Academy

Laboratory 12: Projectile Motion Math 42C
1. Open the Geogebra simulation in the file “Projectile motion.ggb”, which contains acatapult and a castle. Your catapult always launches the projectile with an initialvelocity of 50 m/sec, but you can adjust the angle of the launch.
(a) For which angle can you reach the furthest point on the plain? (Ignore the castlefor now.)
(b) For which angle will the projectile land on top of the closest tower? Is there an-other, much greater, angle that will also work? Make sure your answer referencesthe location and height of the tower.
2. You have seen many times in math class and probably also in physics class thattrigonometry helps decompose a vector into its vertical and horizontal components.The diagram below shows how to decompose a projectile vector, v0, that makes anangle of θ with the ground.
θ
v0 cos θ
v0v0 sin θ
(a) Explain how the three vectors are related. How are their lengths related?
(b) If we assume that gravity acts with a force of g, that the projectile is launched froman initial height of h0 and additionally that there is no air resistance, we can usethe component vectors to build parametric equations that describe the motion ofthe projectile. Convince yourself that the following parametric equations describesuch a setup.
x(t) = (v0 cos θ) t y(t) = −g2t2 + (v0 sin θ) t+ h0
(c) Throughout this lab we will use the acceleration due to gravity g = 9.81 m/sec2.Suppose we let θ = 40◦, the initial velocity v0 = 50 m/sec, and the initial heighth0 = 10 m. Write out the equations for x(t) and y(t).
(d) Graph the path of the projectile.
(e) How long does it take for the projectile to hit the ground? Where does it hit theground? What is the speed at the moment of impact?
August 11 2017 21 Phillips Exeter Academy

Laboratory 12: Projectile Motion Math 42C
3. Return to the Geogebra simulation mentioned above to answer the following questions.
(a) What are the speeds with which the projectile strikes the tower in the two solutionsfound in Problem (1b)? Is there an advantage to one launch angle over the other?
(b) Compare the slopes of the trajectories found in Problem (1b) at the moment ofimpact on the tower. Use the slopes to find the angles of impact.
4. Compile a report summarizing your results and the techniques of calculus you have usedin this lab. Be sure to discuss the main concepts of this lab and what new problemsyou can now solve. Among other things, you should be sure to note the distinctionbetween the slope of the path and the speed of the projectile.
August 11 2017 22 Phillips Exeter Academy
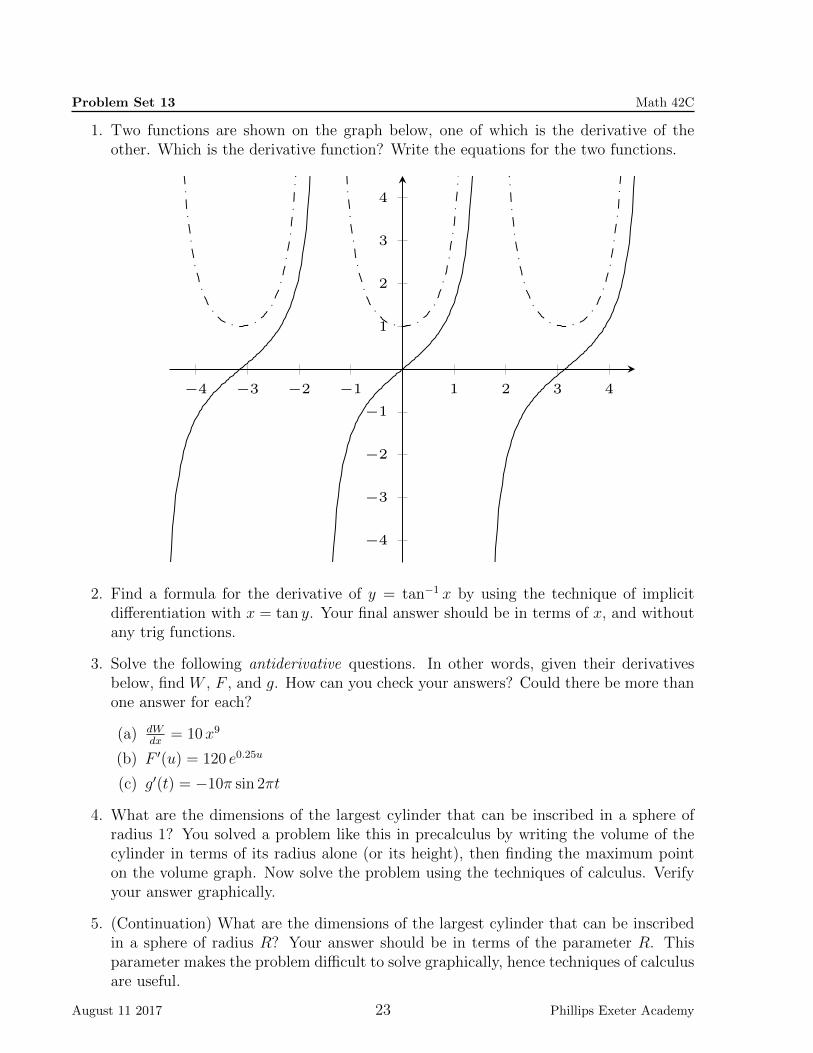
Problem Set 13 Math 42C
1. Two functions are shown on the graph below, one of which is the derivative of theother. Which is the derivative function? Write the equations for the two functions.
−4 −3 −2 −1 1 2 3 4
−4
−3
−2
−1
1
2
3
4
2. Find a formula for the derivative of y = tan−1 x by using the technique of implicitdifferentiation with x = tan y. Your final answer should be in terms of x, and withoutany trig functions.
3. Solve the following antiderivative questions. In other words, given their derivativesbelow, find W , F , and g. How can you check your answers? Could there be more thanone answer for each?
(a) dWdx
= 10x9
(b) F ′(u) = 120 e0.25u
(c) g′(t) = −10π sin 2πt
4. What are the dimensions of the largest cylinder that can be inscribed in a sphere ofradius 1? You solved a problem like this in precalculus by writing the volume of thecylinder in terms of its radius alone (or its height), then finding the maximum pointon the volume graph. Now solve the problem using the techniques of calculus. Verifyyour answer graphically.
5. (Continuation) What are the dimensions of the largest cylinder that can be inscribedin a sphere of radius R? Your answer should be in terms of the parameter R. Thisparameter makes the problem difficult to solve graphically, hence techniques of calculusare useful.
August 11 2017 23 Phillips Exeter Academy
Problem Set 13 Math 42C
6. A population grows according to the exponential function P (t) = 100e0.07t.
(a) What is the initial population? What is the population after one year? What isthe average percent growth over the first year?
(b) What is P ′(t), the instantaneous growth rate? What is the initial instantaneousgrowth rate? How does this compare with the average percent growth over thefirst year? Explain why there is a difference between these two values.
(c) The function P (t) can also be expressed as 100 (1 + r)t by substituting 1 + r fore0.07. What is the value of r? How is this related to (a) and (b)?
7. The slope of the curve y = tanx is equal to 2 at exactly one point P whose x-coordinateis between 0 and π
2. Let Q be the point where the curve y = tan−1 x has slope 1
2. Find
coordinates for both P and Q. How are these coordinate pairs related?
8. The following expressions are derivatives of which inverse trig functions?
(a)1√
1− x2(b)
1
1 + x2(c) − 1√
1− x2
9. A potato, initially at room temperature (70◦F), is placed in a hot oven (350◦F) for 30minutes. After being taken out of the oven, the potato sits undisturbed for 30 moreminutes on a plate in the same room (70◦F). Let T (t) be the temperature of the potatoat time t during the 60-minute interval 0 ≤ t ≤ 60. Draw plausible graphs of both T (t)and T ′(t). Other than T (0), you are not expected to know any specific values of T .
10. Use implicit differentiation to find the slope of the curve ey + x2 = 2 at the point(−1, 0). Obtain a graph of the curve and the tangent line at this point.
11. Alex is in the desert in a jeep, 10 km from the nearest point N on a long, straight road.On the road, the jeep can do 50 kph, but in the desert sands, it can manage only 30kph. Alex is very thirsty and knows that there is a gas station that has ice-cold Pepsi,located at point P that is 20 km down the road from N . Alex decides to drive there byfollowing a straight path through the desert to a point that is between N and P , andx km from N . The total time T (x) for the drive to the gas station is a function of thisquantity x. Find an explicit expression for T (x), then calculate T ′(x). Use algebra tofind the minimum value of T (x) and the value of x that produces it.
12. Find the derivatives of the following functions.
(a) y = tan−1 x2 (b) u =cos t
t(c) H(x) =
2x− 1
x3
13. The slope of the curve y = sinx is equal to 12
at exactly one point P whose x-coordinateis between 0 and π
2. Let Q be the point where the curve y = sin−1 x has slope 2. Find
coordinates for both P and Q.
August 11 2017 24 Phillips Exeter Academy

Problem Set 13 Math 42C
14. Given the function f(x) =lnx
x, use first and second derivatives to find the coordinates
of all maximum and minimum points, and any points of inflection. Use a graph toverify your answers.
15. If the slope of the graph y = f(x) is m at the point (a, b), then what is the slope ofx = f(y) at the point (b, a)?
16. Find the derivatives of the following functions.
(a) v = e−x sinx (b) g(t) = t1+t
(c) y = ln sin x
17. In the Assembly Hall one day, Tyler spends some time trying to figure which row givesthe best view of the screen, which is 18 feet tall with its bottom edge 6 feet above eyelevel. Tyler finds that sitting 36 feet from the plane of the screen is not satisfactory,for the screen is far away and subtends only a 24.2-degree viewing angle. (Verify this.)Sitting 4 feet from the screen is just as bad because the screen subtends the same 24.2-degree angle from this position. (Verify this also.) Find the optimal viewing distance– the distance that makes the screen seem the largest – and the angular size of thescreen at this distance. (The angle subtended by the screen has its vertex at the eyeof the viewer and angle sides formed by the top and bottom of the screen.)
18. Find the value of limh→0
ln (a+ h)− ln(a)
hwithout using a calculator.
19. The differential equationdy
dt= −1
3y2 is given.
(a) Show that y =3
tis a solution, but . . .
(b) . . . that neither y =3
t+ 2 nor y =
2
tis a solution.
(c) Find another solution to the DE.
20. After investigating the derivative of xn when n is a positive integer and determining
thatd
dx[xn] = nxn−1, we extended this Power Rule to all powers. We now have the
tools to examine this extension more critically.
(a) (Negative powers) If the power is a negative integer, we can rewrite the function
as y =1
xn, where n is a positive integer. Use the Quotient Rule to find
dy
dx, then
use the Power Rule to find the derivative of x−n (which equals 1xn
). Your answersshould agree.
(b) (Rational powers) Suppose the power is a rational number, so that y = xa/b, wherea and b are positive integers. We can rewrite the equation as yb = xa, where yis now an implicit function of x. Use implicit differentiation to solve for dy
dx, then
use the Power Rule to find the derivative of xa/b. Your answers should agree.
August 11 2017 25 Phillips Exeter Academy

Problem Set 13 Math 42C
21. Identify each of the following rules for derivatives.
(a)d
dx(uv) = u
dv
dx+ v
du
dx
(b)d
dx(un) = nun−1du
dx
(c)d
dx
(uv
)=v dudx− u dv
dx
v2
August 11 2017 26 Phillips Exeter Academy

Laboratory 13: Introducing Slope Fields Math 42C
The figure below shows the slope field for the differential equation dydx
= 2x. Each point isassigned a slope equal to the value of the derivative at that point. That slope is representedas a line segment. For example, the point (1, 1) has a segment with slope 2 because dy
dxis
2(1) = 2 at x = 2, and similarly the point (−2,−2) has a segment with slope −4. Manyother points are represented in the slope field, which allows you to visualize the behavior ofthe solutions to the differential equation. Since the derivative depends only on x, all of theslopes along vertical lines are the same. A solution curve can be drawn on this graph bychoosing a point on the curve and then sketching the curve by following the direction of theslope field (which is why it is also called a direction field).
−4 −2 2 4
−2
2
x
y
1. Slope fields can be drawn using Geogebra by employing the command SlopeField[dydx, 20].
The number 20 here represents the number of line segments shown, this can be adjustedup or down to get a better picture.
(a) Produce the slope field for dydx
= 2x by entering SlopeField [2x, 20]. Observe howthe slope field changes as you change the graphing window.
(b) Discuss the solution curve that contains the point (0, 0). Draw the solution curvewith Geogebra by entering the command SolveODE [2x, (0, 0)]. Is it what youexpected?
(c) Discuss the solution curve that contains the point (−2,−2), the draw the curvewith Geogebra.
(d) Add 2 more solution curves to your graphing window on Geogebra. What charac-teristics are shared by all of the solution curves? Do all the curves have the samegeneral behavior?
(e) Solve the differential equation dydx
= 2x by using your knowledge of derivativesto write a function y = f(x) that gives the general solution to the differentialequation. How does the general solution compare with the curves drawn in theslope field?
August 11 2017 27 Phillips Exeter Academy
Laboratory 13: Introducing Slope Fields Math 42C
2. Consider the differential equation dydx
= y.
(a) Create a slope field for this differential equation. Discuss the appearance of theslope field. In what direction can you move without changing the slopes? Why?
(b) Draw two different solution curves for the points (0, 1) and (0,−2). How do thebehaviors of these curves differ? Is there any other type of behavior that a solutioncurve can have?
(c) Solve the differential equation for an explicit function by using your knowledge ofderivatives. How does your symbolic solution give you insight into the behaviorof solution curves drawn in the slope field?
3. Consider the differential equation dydx
= sin(x). Create a graph of the slope field, drawsome solution curves, and discuss the different behaviors that the solution curves canpossess. You should also solve the differential equation and compare your symbolicsolution with your observations about the slope field.
4. One version of Newton’s law of cooling states that a hot liquid will cool at a rate thatis proportional to the difference between the temperature of the liquid and the ambienttemperature of the surroundings (such as room temperature, or the temperature insidea refrigerator). This description of change can be written as the differential equationdTdt
= k(T − A), where T is the temperature of the liquid, t is time, k is a constant ofproportionality, and A is the ambient temperature.
(a) Let A = 68◦ and k = −0.05. Create a graph of the slope field. Be sure that yourwindow spans the horizontal line y = 68. (Why?)
(b) Draw the solution curve with an initial temperature (at time t = 0) of 200◦, thencompare this curve with the solution curve for an initial temperature of 0◦. Ifnecessary change your window. What happens if the initial temperature is 68◦?
(c) This differential equation is not one that we can solve symbolically at this time;however, you can learn a lot about the solution through the visualization providedby the slope field. Describe the three qualitatively different solutions and how theydepend upon the initial temperature.
5. Summarize your results in a lab report, being sure to explain how a slope field helpsyou to visualize the qualitatively different behaviors of the solutions to a differentialequation.
August 11 2017 28 Phillips Exeter Academy

Problem Set 14 Math 42C
1. There are many functions for which f(3) = 4 and f ′(3) = −2. A quadratic example isf(x) = x2 − 8x+ 19. Find an example of such an exponential function f(x) = a · bx.
2. Use implicit differentiation to find the slope of 9x2 +y2 = 225 at (4, 9). In other words,
finddy
dxwithout first solving for y as an explicit function of x.
3. Given that P ′(t) = k · P (t) and P (0) = 2718, find P (t).
4. Finddy
dxfor each of the following curves.
(a) y = x · 2x (b) y = sin
(1
x
)(c) y =
2x
x2 − 1(d) y =
ex − e−x
2.
5. For the function y = ln (1− x), explain why y is virtually the same as −x when x isclose to zero.
6. Give an example of a function for each of the following scenarios. Compare the graphsof the two functions.
(a) The instantaneous growth rate is a constant 12%.
(b) The annual growth rate is a constant 12%.
7. Solve the following antiderivative questions. In other words, find F , g, and S.
(a) F ′(x) = 6x5 (b) g′(t) = 10 cos (5t) (c)dS
du=
1
2eu +
1
2e−u
8. A police helicopter is hovering 1000 feet above a high-way, using radar to check the speed of a car C below.The radar shows that the distance HC is 1250 feetand increasing at 66 ft/sec. Is the car exceeding thespeed limit of 65 mph? To figure out the speed of thecar, let x = FC, where F is the point on the high-way that is directly beneath H, and let z = HC.Notice that x and z are both functions t and thatz(t)2 = 10002 + x(t)2. Differentiate this equation
with respect to t. The new equation involvesdx
dtand
dz
dt, as well as x and z. The information from the
radar means thatdz
dt= 66 when z = 1250. Use this
data to calculate the valuedx
dt.
H
CF x
z
1000
August 11 2017 29 Phillips Exeter Academy

Problem Set 14 Math 42C
9. Find a function whose graph y = f(x)
(a) has negative slope, which increases as x increases;
(b) has positive slope, which decreases as x increases.
10. If 0 < f ′′(a), then the graph of y = f(x) is said to be concave up (or have positivecurvature) at the point (a, f(a)). Explain this terminology based on what is happeningwith the first derivative at (a, f(a)). If f ′′(a) < 0, then the graph of y = f(x) is saidto be concave down (or have negative curvature) at the point (a, f(a)). Explain thisterminology as well.
11. Examine the following slopefield for a certain differential equation.
(a) Sketch solution curves through the following points: (1, 1), (−4, 2), (5,−3).
(b) What do all the solutions of this differential equation seem to have in common?
12. Consider the function f(x) =
{4− 2x, for x < 1ax2 + bx, for x ≥ 1
. What values of a and b
guarantee that f is both continuous and differentiable?
13. Find the first and second derivative of each of the following functions.
(a) f(z) = z ln(z) (b) f(u) = tan−1 u (c) f(t) = e−t2
August 11 2017 30 Phillips Exeter Academy

Problem Set 14 Math 42C
14. A function g is continuous on the interval [−2, 4], with g(−2) = 5 and g(4) = 2. Itsderivatives have properties summarized in the table.
x −2 < x < 0 x = 0 0 < x < 2 x = 2 2 < x < 4g′(x) positive undefined negative 0 negativeg′′(x) positive undefined positive 0 negative
(a) Find the x-coordinates of all globally extreme points for g. Justify your answer.
(b) Find the x-coordinates of all inflection points for g. Justify your answer.
(c) Make a sketch of y = g(x) that is consistent with the given information.
15. The volume of a cube is increasing at 120 cc per minute at the instant when its edgesare 8 cm long. At what rate are the edge lengths increasing at that instant? Consider
differentiating both sides of the equation V = x3, with respect to t, to getdV
dt= 3x2dx
dt,
and then use the given values.
16. A model for the net result of the attractive and repulsive forces that exist between
two atoms is given by F (x) =c
x2+
d
x3where x is the separation distance between the
atoms, and c and d are constants.
(a) Determine values for c and d which give a maximum attraction of 1 at x = 1.
(b) Graph the force function.
(c) Determine where the graph has an inflection point. How is the force changing atthe inflection point?
17. A particle moves along a number line according to x = t4 − 4t3 + 3 during the timeinterval −1 ≤ t ≤ 4.
(a) Calculate the velocity function,dx
dt, and the acceleration function,
d2x
dt2.
(b) At what times is the particle instantaneously at rest? Where does this happen?
(c) At what times is the particle’s position x increasing? When is x decreasing?
(d) At what times is the acceleration zero? What does this signify?
(e) What is the complete range of positions of the particle?
(f) What is the complete range of velocities of the particle?
18. A rumor spreads among the students at PEA according to the differential equationdRdt
= 0.08R(1 − R), where R is the proportion of the student population who haveheard the rumor.
(a) Obtain a slopefield and a solution with initial value R(0) = 0.03. If t is in minutes,how long does it take for 99% of the students to hear the rumor?
August 11 2017 31 Phillips Exeter Academy

Problem Set 14 Math 42C
(b) Explain the shape of the solution curve and what in the differential equationcauses this characteristic shape of the logistic curve.
(c) Restricting R to the range of 0 to 1, how many different types of solution curvescan you perceive by examining the slopefield?
(d) Allowing R to go outside the range of 0 to 1, what other families of solution curvescan you perceive by examining the slopefield?
August 11 2017 32 Phillips Exeter Academy

Laboratory 14: Introducing Euler’s Method Math 42C
Given the derivativedy
dx, we have had a lot of practice finding the linear approximation for
y. We have noticed, however, that the linear approximation is generally less accurate asyou increase the distance from the center of the approximation. One method for achievinga more accurate approximation is a recursive technique known as Euler’s method.
1. The velocity of an object falling from the top of a tall building is y′ = −32t. Theheight of the building is 400 ft and the initial velocity is 0 ft/sec. We thus have theinitial point (t0, y0) = (0, 400). The linear approximation centered at this point isy = y′(0) · (t− 0) + 400, where y′(0) is the derivative at the point (0, 400) and thus theslope of the linear approximation at that point.
(a) Confirm that the value of the linear approximation one second later, where t = 1,is y = 400.
(b) If we want to approximate the function at t = 2, we could substitute t = 2into the linear approximation formula. Instead, however, we can use a two-stepapproximation method by making a new line through the point (1, 400) that isparallel to the tangent to the curve at the point with t = 1. This new line hasequation y = y′(1) · (t− 1) + 400. Confirm that the approximation from this lineat t = 2 is y = 368.
(c) Continue the process of recursively taking the result after each step and substitut-ing this point back into the linear approximation formula. Fill in the remainingy-values in the table below.
t 0 1 2 3 4 5
y 400 400 368
2. How do the approximation values in the table compare to the actual y-values? We canfind out by solving the differential equatin y′ = −32t for the curve that contains thepoint (0, 400).
(a) Explain why the general solution is y = −16t2 +C, and the particular solution isy = −16t2 + 400.
(b) Compare the approximation with the actual value at t = 5. Explain how all thisrelates to the graph below.
(c) In the graph below, the stepsize for each line segment was ∆t = 1. How wouldthe graph above look if you changed the stepsize to ∆t = 0.5? Use ∆t = 0.5 tofind the Euler’s method approximation using the spreadsheet option in Geogebra,and examine the accuracy of the approximation after 10 steps, at t = 5.
August 11 2017 33 Phillips Exeter Academy

Laboratory 14: Introducing Euler’s Method Math 42C
3. A population is changing at a rate given by the differential equationdP
dt= 0.05P . The
initial population at time t = 0 is P0 = 3140.
(a) Find the Euler’s method approximation for the population at t = 10 using astepsize of ∆t = 0.5.
(b) Solve the differential equationdP
dt= 0.05P for the particular function P (t) with
P0 = 3140. Compare the Euler’s method approximation with the actual value ofP at t = 10.
(c) Recompute the Euler’s method approximation for the population at t = 10 usinga stepsize of ∆t = 0.1. Graph on the same set of axes the function P (t) and thesequence of points generated by Euler’s method. Discuss the graph.
August 11 2017 34 Phillips Exeter Academy

Laboratory 14: Introducing Euler’s Method Math 42C
4. To make soft drinks a large 100-gallon vat is used to hold the inflow and outflow of
sugar water. The change in the amount of sugar can be expressed bydS
dt=
2000− 3S
100,
measured in tablespoons per minute.
(a) Compute the Euler’s method approximation using a stepsize of ∆t = 1 for theamount of sugar in the vat after 20 minutes. The initial amount of sugar in thevat is S(0) = 350.
(b) Graph the points found in #4a. What does this graph represent?
(c) What happens to the sugar concentration in the long run? You may want tocompute and graph the Euler’s method approximation out to an hour or more.
(d) The differential equation given in this part is not one that we can reasonablyexpect to solve at this time. How do we know that the Euler’s method approx-imation gives a fairly accurate picture of the behavior of the solution? Is ourchoice of ∆t = 1 a small enough stepsize?
(e) What do you notice if you superimpose a slopefield on the graph of the Euler’smethod points?
5. Write a summary explaining how Euler’s method works and how it can be used togenerate a numerical approximation for the solution to a differential equation. Be sureto discuss the relative certainty of your estimation with regard to stepsize. You willwant to include in your summary the general recursive pattern to Euler’s method,what the points generated by it represent, and how all this relates to the prior lab onslopefields.
August 11 2017 35 Phillips Exeter Academy

Problem Set 15 Math 42C
1. The function f(t) = (1 + r)t can be rewritten as f(t) = eαt for some number α.
(a) Letting r=0.05, calculate α. Given that t is in years, what do r and α represent?
(b) Using this value of α, sketch the graphs of y = eαt and y = 1 + αt on the sameset of axes. How are these graphs related?
(c) The linear model is attractively simple to work with, but the exponential modelslowly diverges from it. What is the largest interval of t-values for which thelinear y-value is within 99% of the exponential y-value? In other words, how longdoes it take for the linear model to diverge more than 1% from the exponentialmodel?
2. At noon, a blue sports car was 15 miles south of an intersection, heading due northalong a straight highway at 40 mph. Also at noon, a red sports car was 20 miles westof the same intersection, heading due east along a straight highway at 80 mph.
(a) The cars were 25 miles apart at noon. At what rate was this separation decreasing?
(b) At 1 pm, the cars were 65 miles apart. At what rate was this separation increasing?
(c) At what time of day were the cars closest together, and how far apart were they?
3. A population is changing at a rate given by the differential equation dPdt
= 0.12P . Theinitial population at time t = 0 is P0 = 144.
(a) Find the Euler’s method approximation for the population at t=6 using a stepsizeof ∆t = 0.2.
(b) Solve the differential equation dPdt
= 0.12P for the particular function P (t) withP0 = 144. Compare the Euler’s method approximation with the actual value ofP at t = 6.
4. Separation of variables. The circle x2 + y2 = 25 is a solution curve for the differentialequation dy
dx= −x
y.
(a) Confirm that this is true by differentiating x2 + y2 = 25.
(b) You can solve the differential equation dydx
= −xy
by putting all the x’s on one side
of the equation and all the y’s on the other side. The resulting equation y dydx
= −xcan be solved by guessing an antiderivative function for each side of the equation.In other words, what function has a derivative y dy
dx? (You will need to think about
the Chain Rule in reverse.) What function has a derivative −x?
(c) Explain why the solution curves x2 + y2 = C, where C is a constant, are allsolutions for the differential equation in this problem. Verify that the slope fieldreveals the solution curves.
5. (Continuation) Consider the differential equation dydx
= xy.
(a) Use a slope field to make a conjecture about the solutions to this differentialequation.
August 11 2017 36 Phillips Exeter Academy

Problem Set 15 Math 42C
(b) Solve the differential equation by the method of separation of variables. In otherwords, multiply both sides by y and then find the antiderivative functions foreach side of the equation. To find the general solution, you will want to includea constant in each antiderivative. What can you do when the two constants areadded or subtracted?
(c) Give a general equation for the solution curves for this differential equation.
6. A running track is made up of two parallel straightaways attached to semi-circles oneach end. The straightaways have length l and the semi-circles have radius r.
(a) Find an expression for the total length of the track in terms of l and r.
(b) Find an expression for the total area enclosed by the track.
(c) If the length of the track is 400 meters, what dimensions will make it so the trackencloses the largest possible area?
7. Write (but do not try to solve) differential equations given the following descriptionsof change.
(a) The temperature T of a cup of water placed in a freezer set to 20 degrees decreasesat a rate that is proportional to the difference between T and 20.
(b) The velocity of a car going downhill increases linearly as a function of time.
(c) The rate at which the thickness y of ice increases is inversely proportional to thethickness of the ice.
(d) A population grows at a continuous annual rate of 2%, and immigrants arrivecontinuously at a rate of 150 per year.
8. Find dydx
for each equation.
(a) y = ln (10− x)
(b) ln y = 3 ln x
(c) 2√y = 8− 0.4x
9. The parabolic arc y = 7− x− x2 defined on the interval −3.5 ≤ x ≤ 1 joins smoothlyat (1,5) to another parabolic arc y = a(x − c)2 for the interval 1 ≤ x ≤ 6. Find thevalues of a and c. Verify your answer graphically and with calculus techniques.
August 11 2017 37 Phillips Exeter Academy

Problem Set 15 Math 42C
10. A population is constrained by an upper limit 100 and is changing at the rate dPdt
=0.04(100− P ). The initial population at time t = 0 is P0 = 8.
(a) Use Euler’s method to generate values for the population from t = 0 to t = 100using a stepsize of ∆t = 1.
(b) Graph the ordered pairs (t, P ) generated with Euler’s method. Is this what youexpected for the shape of the graph?
(c) For an extra challenge, solve the original differential equation and graph the so-lution on the same set of axes as the ordered pairs from Euler’s method.
11. You have solved some separable differential equations by writing them in the formf(y) dy
dx= g(x). Show that dy
dx= 2xy2 is also of this type by writing the equation in
this form. Find the solution curve that goes through the point (5, 1). Confirm youranswer by the use of slopefields and SolveODE on Geogebra.
12. Boyle’s Law states that for a gas at constant temperature, the pressure times thevolume of the gas is constant, or PV = c.
(a) Turn this into a rate problem by taking derivatives with respect to time. In otherwords, apply the operator d
dtto both sides of the equation.
(b) If the volume is decreasing at a rate of 10 cm3/sec, how fast is the pressureincreasing when the pressure is 100 N/cm2 and the volume is 20 cm3?
13. Constrained population growth. A population P (in millions) grows in proportion tohow much more it has left to grow before it reaches its upper limit L.
(a) Fill in the blank for the differential equation that describes this population:dPdt
= k( )
(b) Let k = 0.05 and L = 100 (million). Obtain a slopefield for this differentialequation and confirm that the solution curves level off at 100.
(c) Solve this differential equation for the curve that contains the point (0, 50). (Youcan separate variables by dividing both sides of the differential equation by thefactor that you placed in the blank.)
14. Solve the differential equation dydx
= yx
by separation of variables. (You will need todivide both sides by y.) Find the particular solution that contains the point (4, 2).
August 11 2017 38 Phillips Exeter Academy

Problem Set 15 Math 42C
15. The graphic displays the temperature of the ocean water versus depth. Describe (inwords and with a graph) the rate of change of the temperature as a function of depth.http://www.windows2universe.org/earth/Water/images/sm_temperature_depth.
jpgon4/1/2015
16. Examine the slopefield shown below.
(a) Sketch solution curves through the following points: (−4,−1), (2, 2), (4,−2).
(b) What general behaviors of the solution curves can you deduce from the slopefield?
August 11 2017 39 Phillips Exeter Academy
Calculus Lab 15: Skydiving Math 43C
Previously we have simplified differential equations for a falling object by ignoring air resis-tance (such as in the lab on Projectile Motion). We begin with constant acceleration due togravity, which is represented by the differential equation
dv
dt= −g.
Confirm and explain the equations for velocity and height:
v(t) = −gt+ v0
h(t) = −g2t2 + v0t+ h0
To model the descent of a parachutist, however, we need air resistance in our model. Theforce of air resistance on a parachute is in the upward direction, which opposes the downwardforce of gravity. Air resistance increases as speed increases (up to a point) and in this lab wewill assume it is proportional to the velocity squared. The equation for acceleration is thus
dv
dt= −g + kv2.
We now have a differential equation that we cannot solve symbolically; however, we canuse Euler’s method to generate a numerical solution. The constant of proportionality is
k =CρA
2m, where C is the coefficient of air resistance, ρ is the density of air, A is the
surface area of the skydiver (before opening the parachute) or the parachute (after opening),and m is the mass of the skydiver. Assume that the skydiver jumps from a plane so theinitial downward velocity is 0, and the constants have the values g = 9.8m/sec2, C = 0.57,ρ = 1.3 kg/m3, m = 75 kg, and A = 0.7m2.
1. Use Euler’s method with a stepsize of ∆t = 0.5 to generate approximate values for thevelocity during the first 20 seconds of freefall. What are the units of velocity?
2. Discuss the shape of the graph of velocity vs. time. What is the terminal velocity ofthe skydiver in freefall? What is this velocity in km/hr?
3. Assume the parachute is opened after reaching terminal velocity, and that the surfacearea of the parachute is 30m2. Generate a new set of velocities using the freefallterminal velocity as your new initial velocity and a smaller stepsize ∆t = 0.1. Why isit necessary to use a smaller ∆t? (Hint: What happens if you use ∆t = 0.5?) Whatis the new terminal velocity of the skydiver? Express your answer in km/hr. What isthe landing speed for the skydiver? Is this reasonably “safe”?
4. Now try to put all of the velocities together in one graph by opening the parachuteafter 20 seconds. In your worksheet, you can start with A = 0.7 and ∆t = 0.5 in yourformulas and change to A = 30 and ∆t = 0.1 after 20 seconds.
August 11 2017 40 Phillips Exeter Academy
Calculus Lab 15: Skydiving Math 43C
5. You can now use the sequence of velocities to approximate the height of the skydiverat any time. Since dh
dt= v, confirm that you can use Euler’s method to approximate
the heights with the recursive equation hn = hn−1 + vn−1 · ∆t. How is this work anexample of numerical integration?
6. Generate a graph of the height vs. time of a skydiver jumping out of a plane at a heightof 1000 meters and opening the parachute after 20 seconds. Extend the calculationsuntil the skydiver lands on the ground. Explain the shape of the height vs. time graphin the context of this problem.
Write a lab report that includes an analysis of your work in the context of the problem, anexplanation of how you utilized Euler’s method, the recursive formulas you used, what youlearned about Euler’s method, and relevant graphs. As always, extensions, surprises, and“a-ha” moments are welcome.
August 11 2017 41 Phillips Exeter Academy

Problem Set 16 Math 42C
The Fundamental Theorem of Calculus. Problems 1-11 should be completed as a separateactivity, in class and for homework.
1. Use Euler’s method to approximate the function y = f(x) that has derivative dydx
=3x2+2x+1 and initial value (0, 1). Use a stepsize of ∆x = 0.5, and generate a sequenceof values from x0 = 0 to xn = 4. Fill in the table of values below.
xn−1 yn−1dy
dx
∣∣∣∣n−1
yn =dy
dx
∣∣∣∣n−1
·∆x+ yn−1
0 1 1 1.5
0.5 1.5 2.75 2.875
1.0 2.875
1.5
2.0
2.5
3.0
3.5
4.0
2. A graph of dydx
is shown below. A sequence of rectangles with a base on the x-axis, a
width of ∆x, and a corner on the dydx
curve is shown. Draw the additional rectangles upto where x = 4. Which column in the table above gives the heights of these rectangles?What product gives the area of each rectangle?
August 11 2017 42 Phillips Exeter Academy

Problem Set 16 Math 42C
0.5 1 1.5 2 2.5 3 3.5 4
10
20
30
40
50
60
3. On the set of axes below, plot the points from Euler’s method (the first few points areshown), which is an approximation for the solution curve for the differential equationdydx
= 3x2 + 2x + 1. What quantities in the first graph above correspond to the ∆yvalues in the graph below? (A representative ∆y is shown.) What is the equation forthe solution curve (which is shown)? How can you adjust Euler’s method to make theapproximation closer to the actual solution curve?
0.5 1 1.5 2 2.5 3 3.5 4
10
20
30
40
50
60
∆x∆y
4. We can generalize the previous work by letting the initial value be at the point withx0 = a and the last value be at xn = b. Complete the expressions for the first two
August 11 2017 43 Phillips Exeter Academy

Problem Set 16 Math 42C
y-value approximations:
y1 = y0 +dy
dx
∣∣∣∣0
·∆x
andy2 = y1 + .
5. Show by substitution that we can rewrite y2 as
y2 = y0 +dy
dx
∣∣∣∣0
·∆x+dy
dx
∣∣∣∣1
·∆x.
Continue the substitution pattern in the sequence of equations below.
y3 = y0 +dy
dx
∣∣∣∣0
·∆x+dy
dx
∣∣∣∣1
·∆x+ ,
y4 = y0 +dy
dx
∣∣∣∣0
·∆x+dy
dx
∣∣∣∣1
·∆x+ + ,
y5 = y0 + ,
...
yn = y0 +dy
dx
∣∣∣∣0
·∆x+dy
dx
∣∣∣∣1
·∆x+ · · ·+ dy
dx
∣∣∣∣n−1
·∆x.
Relate the last equation to the graph in number 3.
6. Verify the following equation:
yn − y0 =n−1∑k=0
dy
dx
∣∣∣∣k
·∆x
7. To improve the Euler’s method approximation above, we should make ∆x smaller.What happens to n as ∆x is reduced? What is the limit of the Euler’s method ap-proximation as ∆x approaches 0?
8. If we start with a differential equation dydx
= f(x), and we call the solution functionF (x) (so that F (x) is an antiderivative of f(x)), then y0 = F (a) and yn ≈ F (b).(Why?) Explain how we get the following equation:
F (b)− F (a) = lim∆x→0
n−1∑k=0
dy
dx
∣∣∣∣k
·∆x
August 11 2017 44 Phillips Exeter Academy

Problem Set 16 Math 42C
The expression on the right side of the equation above defines the definite integral∫ b
a
f(x) dx = lim∆x→0
n−1∑k=0
f(xk) ·∆x
where f(x) has been substituted fordy
dx.
9. The Fundamental Theorem of Calculus. The two equations in 8 can be combined toform the equation ∫ b
a
f(x) dx = F (b)− F (a)
What is the relationship between f(x) and F (x)?
10. Evaluate the integral ∫ 4
0
(3x2 + 2x+ 1) dx,
which is the integral of the function that we started with at the beginning of thisproblem set. How does the numerical value of this integral relate to antiderivatives?How is it connected to Euler’s method? What is the relationship between this integraland the graphs shown in 2 and 3?
11. Write in symbols, with explanation, the Fundamental Theorem of Calculus. How doesthis theorem link derivatives and antiderivatives? (These two “halves” of calculus areoften called Differential Calculus and Integral Calculus.)
12. Solve the following antiderivative questions and thus find F , h, and A.
(a)dF
du=
1
u2
(b) h′(t) = sin 2t
(c)dA
dx=
1
2ex − 1
2e−x
13. Find dydx
for the function defined implicitly by y = xy2 + 1.
14. Find at least two different functions S for which S ′(x) = x2.
15. Obtain a graph of the function y = cos(
1x
).
(a) Find the derivative of the function. Graph the derivative.
(b) How does the graph of the derivative explain the behavior of the graph of thefunction?
16. Find antiderivatives for the following:
(a)1
y
dy
dx
August 11 2017 45 Phillips Exeter Academy

Problem Set 16 Math 42C
(b) (sinx)2 cosx
(c) eu · u′
17. Find the derivatives of the reciprocal functions of cos, sin, and tan, namely the sec(secant), csc (cosecant), and cot (cotangent) functions.
18. What is the derivative of xπ? What is the derivative of πx? What is the derivativeof ππ?
19. Find functions with the following derivatives:
(a) 10x9
(b) x99
(c)1
2√x
(d)√x
20. (Continuation) What are the following antiderivatives, where n is some number?
(a) nxn−1
(b) xn
21. Obtain a graph of the function y = sinx2.
(a) Find the derivative of the function, and then graph the derivative.
(b) How does the graph of the derivative explain the behavior of the graph of thefunction?
August 11 2017 46 Phillips Exeter Academy

Mathematics 43C
Mathematics DepartmentPhillips Exeter Academy
Exeter, NHAugust 11 2017

Problem Set 17 Math 43C
1. Find the values of the following integrals by using antiderivatires
(a)
∫ 3
0
(x2 + 2x+ 1
)dx
(b)
∫ 1
−1
ex dx
(c)
∫ 10
1
1
xdx
2. Some of the particular solutions of the differential equation dLdt
= k(M − L) are calledlearning curves, where L is the amount of learning of a body of facts or of a particularskill.
(a) Finish the following statement: The rate of learning is proportional to . . .
(b) In a learning curve, the initial value of L is less than M . What is the shape ofthe curve? What is the significance of the parameter M?
3. Determine antiderivatives of the following:
(a)1
3x
(b)1
5 + x
(c)1
10− 0.2x
4. The following derivatives relate to the inverse trig functions sin−1 x, cos−1 x, andtan−1 x?. Find the antiderivatives and thus solve for y as a function of x in eachcase.
(a)dy
dx=
1√1− x2
(b)dy
dx=
1
1 + x2
(c)dy
dx=
−2√1− 4x2
5. The differential equation dPdt
= kP(1− P
M
) (Pm− 1)
is called the threshold model forpopulation growth. The parameter k is a constant of proportionality, M is the max-imum attainable population, and m is called the threshold value of the population(m < M). Refer to this differential equation to answer the following questions.
(a) Explain why the population will decline if the value of P exceeds M .
(b) Why does the population have to be greater than m in order to grow? Whathappens to the population if P < m?
August 11 2017 1 Phillips Exeter Academy

Problem Set 17 Math 43C
(c) Sketch a typical solution curve given an initial population P (0) = P0 such thatm < P0 < M .
6. Solve the following separable differential equation for the particular solution with initialvalue y0 = 1000.
dy
dx= 20− 0.5y
(It is tempting to add 0.5y to both sides of the equation, but the left side will not beeasy to antidifferentiate. Instead, if you divide both sides by (20− 0.5y), then the leftside will be a derivative of an ln function.)
7. How can you use calculus to determine the distance traveled by a vehicle over aninterval of time if you are given an explicit function f(t) for the speed of the vehicleat any time t?
8. The volume of a cube is increasing at 120 cc per minute at the instant when its edgesare 8 cm long. At what rate are the edge lengths increasing at that instant? (Hint:Write a formula for volume as a function of the edge length x, then differentiate bothsides with respect to time t.)
9. Falling object with no air resistance. An object is thrown upward from an initialheight h0 with initial velocity v0, where upward motion is given a positive sign anddownward motion has a negative sign. Ignore air resistance, thus acceleration is con-stant and equal to the acceleration g due to gravity.
(a) Confirm the differential equation for acceleration dvdt
= −g, and solve this equationfor v(t).
(b) Since v = dhdt
, you can now write a differential equation for dhdt
. Solve this equationfor h(t). The answer is a quadratic function commonly found in elementaryphysics textbooks.
10. Find antiderivatives of the following:
(a)√y(t) y′(t)
(b) f ′(t) sin f(t)
(c) 11+w2
dwdt
11. Not wanting to be caught exceeding the speed limit, the driver of a red sports carsuddenly decides to slow down a bit. The table below shows how the speed of the car(in feet per second) changes second by second. Estimate the distance traveled duringthis 6-second interval.
Time 0 1 2 3 4 5 6Speed 110.0 99.8 90.9 83.2 76.4 70.4 65.1
August 11 2017 2 Phillips Exeter Academy
Problem Set 17 Math 43C
12. (Continuation) The red sports car’s speed during the time interval 0 ≤ t ≤ 6 is actually
described by the function f(t) =44000
(t+ 20)2. Use this function to calculate the exact
distance traveled by the sports car.
13. Find the antiderivative of
(a) e3x
(b) e−x10
(c) Aekx, where A and k are constants
14. In years past many countries disposed of radioactive waste by sealing it in barrels anddumping it in the ocean. The acceleration of the barrel is the sum of the downwardforce of gravity, the upward force of the buoyancy of the barrel, and the drag force ofthe water that is directed opposite to the motion. The forces of gravity and buoyancyare constant, and for a 55 gallon barrel filled with 527 pounds of waste, the accelerationdue to gravity minus buoyancy is a constant 3.49 ft/sec2. The acceleration due to thedrag force is proportional to the velocity with a constant of proportionality 0.0049.Thus the differential equation for the velocity of the barrel is
dv
dt= 3.49− 0.0049v.
(a) Explain the significance of the terms in this differential equation.
(b) Solve this separable equation to find the velocity as an explicit function of t.
(c) Velocity is the derivative of position, so v =dh
dt, where h is the height of the object
above the ocean floor. Do one more antidifferentiation to find h as a function oft.
(d) A barrel is dumped in an area with an ocean depth of 300 feet. How long will ittake for the barrel to reach the ocean floor?
(e) Tests have shown that the barrels tend to rupture if they land with a velocitygreater than 40 ft/sec. Will the barrels remain intact when dropped a depth of300 feet?
Note: Since 1993, ocean dumping of radioactive waste has been banned by internationaltreaty.
15. Let f(x) = cos(ln x) and g(x) = ln(cos x).
(a) Describe the domain and range of f and g. Graphs may be helpful here.
(b) Find f ′(x) and g′(x).
16. Find the first and second derivatives of A(t) = e−t2, then find all points where A′ is
negative and A′′ is positive. What does this tell you about the graph of y = A(t)?
August 11 2017 3 Phillips Exeter Academy

Problem Set 17 Math 43C
17. The speed in ft/sec of a red sports car is given by f(t) =44000
(t+ 20)2for 0 ≤ t ≤ 6.
(a) Explain why the sums5∑
k=0
1 · f(k) and6∑
k=1
1 · f(k) are reasonable approximations
to the distance traveled by the car during this 6-second interval. Why is the truedistance between these two estimates?
(b) Explain why11∑k=0
0.5 · f(0.5k) is a better approximation than5∑
k=0
1 · f(k).
(c) Explain why119∑k=0
0.05 · f(0.05k) is an even better approximation.
(d) How is the sum in part (c) related to the Euler’s method of approximation?
18. (Continuation) The speed of a red sports car is given by f(t) =44000
(t+ 20)2for 0 ≤ t ≤ 6.
(a) Given a large positive integer n, the sumn∑k=1
6
n· f(
6k
n
)is a reasonable estimate
of the distance traveled by the sports car during this 6-second interval. Explainwhy.
(b) Another reasonable estimate isn−1∑k=0
6
n· f(
6k
n
). Compare it to the preceding.
(c) What is the significance of the expression limn→∞
n∑k=1
6
n·f(
6k
n
)? What is the value
of this expression? (You have found this value in an earlier exercise.)
19. The previous problems were about accumulating velocity to calculate the distance trav-eled by a sports car. The desired quantity is approximated to any degree of accuracyby a sum of products, specifically rate times time. The precise answer is a limit of suchsums. Using a new expression, for 0 ≤ t ≤ 6 and ∆t = 6/n, the distance traveled is∫ 6
0
f(t)dt = limn→∞
n∑k=1
f(k∆t)∆t.
The expression
∫ 6
0
f(t)dt for the precise distance traveled is read “the integral of f(t)
from t = 0 to t = 6”. The integration symbol is an elongated S - the initial letter ofsum. The symbol dt, although it does not stand for a specific value, corresponds to the∆t that appears in the approximating sum, and it identifies the integration variable.
(a) Since f(t) is an expression for velocity, you can find the value of
∫ 6
0
f(t)dt by
using an expression for distance, which is the antiderivative of f(t). Thus, the
August 11 2017 4 Phillips Exeter Academy
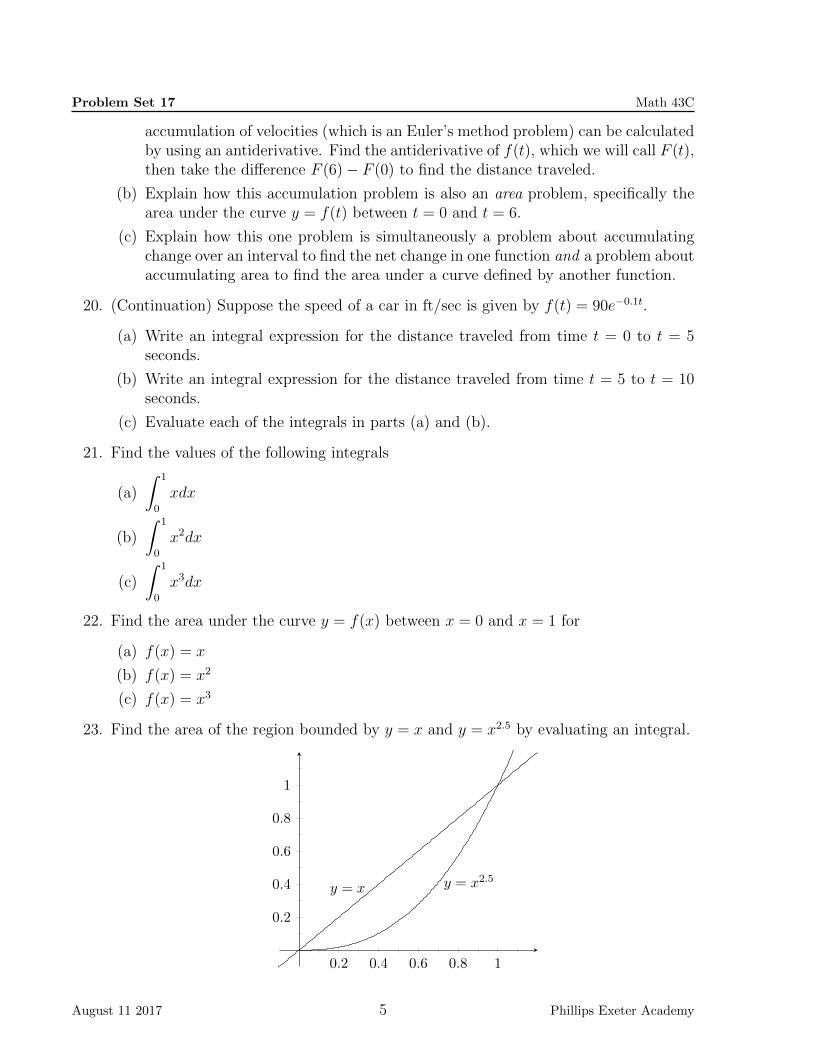
Problem Set 17 Math 43C
accumulation of velocities (which is an Euler’s method problem) can be calculatedby using an antiderivative. Find the antiderivative of f(t), which we will call F (t),then take the difference F (6)− F (0) to find the distance traveled.
(b) Explain how this accumulation problem is also an area problem, specifically thearea under the curve y = f(t) between t = 0 and t = 6.
(c) Explain how this one problem is simultaneously a problem about accumulatingchange over an interval to find the net change in one function and a problem aboutaccumulating area to find the area under a curve defined by another function.
20. (Continuation) Suppose the speed of a car in ft/sec is given by f(t) = 90e−0.1t.
(a) Write an integral expression for the distance traveled from time t = 0 to t = 5seconds.
(b) Write an integral expression for the distance traveled from time t = 5 to t = 10seconds.
(c) Evaluate each of the integrals in parts (a) and (b).
21. Find the values of the following integrals
(a)
∫ 1
0
xdx
(b)
∫ 1
0
x2dx
(c)
∫ 1
0
x3dx
22. Find the area under the curve y = f(x) between x = 0 and x = 1 for
(a) f(x) = x
(b) f(x) = x2
(c) f(x) = x3
23. Find the area of the region bounded by y = x and y = x2.5 by evaluating an integral.
0.2 0.4 0.6 0.8 1
0.2
0.4
0.6
0.8
1
y = x2.5y = x
August 11 2017 5 Phillips Exeter Academy

Lab 17: The Gini Index Math 43C
Perceived inequity in the distribution of income in our society is of ongoing concern; hence,the “Occupy” movement that began a few years ago. In this lab you will investigate how toquantify inequity in a society’s income distribution using the Gini Index.
1. Suppose our society has 25 family units with incomes listed below
197 800 177 600 14 200 17 600 28 00061 800 67 600 104 600 79 600 12 80015 400 207 200 186 600 111 400 58 60063 400 96 200 88 600 167 200 16 40018 000 65 000 58 000 38 000 48 400
Your first task is to order the population by income, and then determine the percent oftotal income that is earned by each fifth of the population. Since there are 25 incomes,each fifth will be the sum of five incomes. The lowest fifth will consist of the lowestfive incomes, the second fifth will have the next five lowest incomes, and so on. Fill inthe chart below with the sum of the incomes in each fifth in column 2, then convertthese numbers to percent of total income in column 3.
Fifth of population Aggregate Income Percent Aggregate IncomeLowest fifthSecond fifthThird fifth 316 400 15.8Fourth fifthHighest fifth
Total 2 000 000 100
2. Use the column for percent aggregate income to fill in the chart below with the cumu-lative percent of income in the lowest fifth, the lowest two fifths, and so on.
Fifths of population Cumulative Percent Aggregate IncomeLowest one-fifthLowest two-fifths 13.3
Lowest three-fifthsLowest four-fifths
All fifths 100.0
August 11 2017 6 Phillips Exeter Academy

Lab 17: The Gini Index Math 43C
3. The data in this chart is plotted as ordered pairs in the following graph with proportionof population on the horizontal axis and proportion of cumulative percent aggregateincome on the vertical axis. A curve that fits the points of a cumulative percentaggregate income distribution is known as a Lorenz curve. Why must a Lorenz curvebe increasing?
0 0.2 0.4 0.6 0.8 10
0.2
0.4
0.6
0.8
1
Aggregate Population
Agg
rega
teIn
com
eCumulative Percentage of Aggregate Income
4. (a) Sketch the Lorenz curve for a society with perfect equity of income distribution,meaning income is distributed equally throughout the population.
(b) On the same axes, sketch the Lorenz curve for a society with perfect inequity ofincome distribution, which corresponds to one household earning all the incomeand everyone else earning nothing.
5. A typical Lorenz curve lies between the extremes sketched in the previous exercise.Corrado Gini first defined the Gini index (or Gini coefficient) in 1912, and it has beenwidely used by economists since then. The Gini index is based upon the area of theregion bounded by the line of perfect equity and the Lorenz curve, as shown in thefigure below. To scale the Gini index on the interval from 0 to 1, this area is thendivided by the area bounded by the extremes of perfect equity and perfect inequity.
(a) What is the area bounded by the extremes of perfect equity and perfect inequity?Thus, what must the area bounded by the Lorenz curve be multiplied by?
(b) What is the Gini index for a society with perfect equity of income distribution?
(c) What is the Gini index for a society with perfect inequity of income distribution?
(d) Estimate the Gini index for the income distribution given above.
August 11 2017 7 Phillips Exeter Academy

Lab 17: The Gini Index Math 43C
0 0.2 0.4 0.6 0.8 10
0.2
0.4
0.6
0.8
1
Aggregate Population
Aggr
egat
eIn
com
e
Gini Index:Area Between Lorentz Curve and Line of Perfect Equity
6. We can find the area needed to calculate the Gini index (highlighted above) by findingthe area below the Lorenz curve (that is, bounded by the Lorenz curve and the x-axis)and subtracting it from the area of the triangle determined by the line y = x. You canestimate the area under the Lorenz curve without actually finding an equation for thecurve. One method is to join the successive data points with line segments and drawtrapezoids as shown in the figure below.
(a) Find the areas of the five trapezoids shown in the figure below, the first oneactually being a triangle.
(b) Use the total area of the trapezoids to determine the area of the polygonal regionbounded by the line of perfect equity and the line graph of the data points.
(c) Use this area to calculate the Gini index.
0 0.2 0.4 0.6 0.8 10
0.2
0.4
0.6
0.8
1
0.0380.133
0.292
0.532
Aggregate Population
Agg
regat
eIn
com
e
Calculating Area Using Trapezoids
August 11 2017 8 Phillips Exeter Academy

Lab 17: The Gini Index Math 43C
7. The relevant area for the Gini index can also be estimated by evaluating an integral.To do so, however, requires that we have an explicit formula L(x) for the Lorenz curve.
(a) Confirm that the area between the line of perfect equity and the Lorenz curve isgiven by ∫ 1
0
x dx−∫ 1
0
L(x) dx
(b) A reasonable, simple expression for L(x) is the power function xn. Explain.
(c) Find a value of n that gives a good fit of xn to the data points for the cumulativeaggregate income distribution. You now have an estimate for L(x).
(d) Use integrals to find the area in part (a), and hence calculate a value for the Giniindex.
8. The following table contains information on the U.S. income distribution, which ispublished each year by the U.S. Census Bureau. In your class, assign a selection of yearsspread throughout the given years from 1967 to 2014. For each year assigned, estimatethe value of the Gini index for that year. Share your results with your classmates andconsolidate all of the results into a graph of Gini index versus year. What trend doyou notice in the historical results?
9. Write a lab report with a summary of your results, observations, and interpretations.
Share of Aggregate Income Received by Each Fifth of Households: 1967 to 2014
YearShares of aggregate income
Lowest fifth Second fifth Third fifth Fourth fifth Highest fifth2014 3.1 8.2 14.3 23.2 51.22013 3.2 8.4 14.4 23.0 51.02012 3.2 8.3 14.4 23 512011 3.2 8.4 14.3 23 51.12010 3.3 8.5 14.6 23.4 50.22009 3.4 8.6 14.6 23.2 50.32008 3.4 8.6 14.7 23.3 502007 3.4 8.7 14.8 23.4 49.72006 3.4 8.6 14.5 22.9 50.52005 3.4 8.6 14.6 23 50.42004 3.4 8.7 14.7 23.2 50.12003 3.4 8.7 14.8 23.4 49.82002 3.5 8.8 14.8 23.3 49.72001 3.5 8.7 14.6 23 50.12000 3.6 8.9 14.8 23 49.81999 3.6 8.9 14.9 23.2 49.41998 3.6 9 15 23.2 49.21997 3.6 8.9 15 23.2 49.4
August 11 2017 9 Phillips Exeter Academy

Lab 17: The Gini Index Math 43C
1996 3.6 9 15.1 23.3 491995 3.7 9.1 15.2 23.3 48.71994 3.6 8.9 15 23.4 49.11993 3.6 9 15.1 23.5 48.91992 3.8 9.4 15.8 24.2 46.91991 3.8 9.6 15.9 24.2 46.51990 3.8 9.6 15.9 24 46.61989 3.8 9.5 15.8 24 46.81988 3.8 9.6 16 24.2 46.31987 3.8 9.6 16.1 24.3 46.21986 3.8 9.7 16.2 24.3 46.11985 3.9 9.8 16.2 24.4 45.61984 4 9.9 16.3 24.6 45.21983 4 9.9 16.4 24.6 45.11982 4 10 16.5 24.5 451981 4.1 10.1 16.7 24.8 44.31980 4.2 10.2 16.8 24.7 44.11979 4.1 10.2 16.8 24.6 44.21978 4.2 10.2 16.8 24.7 44.11977 4.2 10.2 16.9 24.7 441976 4.3 10.3 17 24.7 43.71975 4.3 10.4 17 24.7 43.61974 4.3 10.6 17 24.6 43.51973 4.2 10.4 17 24.5 43.91972 4.1 10.4 17 24.5 43.91971 4.1 10.6 17.3 24.5 43.51970 4.1 10.8 17.4 24.5 43.31969 4.1 10.9 17.5 24.5 431968 4.2 11.1 17.6 24.5 42.61967 4 10.8 17.3 24.2 43.6
August 11 2017 10 Phillips Exeter Academy
Problem Set 18 Math 43C
1. Sterling, a student of Calculus, was given an assignment to find the derivative withrespect to x of five functions. Below are Sterling’s five answers. For each, reconstructthe expression that Sterling differentiated, and write your answers in terms of y and x.Can you be sure that your answers agree with the questions on Sterling’s assignment?
(a) 2.54 + dydx
(b) dydx
sec2 y
(c)√
5y dydx
(d) 7y2
dydx
(e) (y − cosx)(dydx
+ sinx)
2. Displacement is the difference between the initial position and the final position of anobject. It is related to velocity by the process of antidifferentiation. Let x(t) be theposition of an object moving along a number line. Suppose that the velocity of theobject is dx
dt= 4− 3 cos 0.5t for all t. Calculate and compare
(a) the displacement of the object during the interval 0 ≤ t ≤ 2π;
(b) the distance traveled by the object during the interval 0 ≤ t ≤ 2π.
3. A jet is flying at its cruising altitude of 6 miles. Its path carries it directly over Anjali,who is observing it and making calculations. At the moment when the elevation angleis 60 degrees, Anjali finds that this angle is increasing at 72 degrees per minute. Usethis information to calculate the speed of the jet. Is your answer reasonable?
4. Because of the close connection between integrals and derivatives, integral signs areoften used to denote antiderivatives. Thus statements such as
∫x2 dx = 1
3x3 + C are
common. The term indefinite integral often appears as a synonym for antiderivative,and an integral such as
∫ 1
0x2 dx is often called definite. Evaluate the following indefinite
integrals.
(a)∫
cos 2x dx
(b)∫e−x dx
(c)∫
110(0.83)x dx
5. The density of air that is x km above sea level can be approximated by the functionf(x) = 1.225(0.903)x kg/m3.
(a) Approximate the number of kg of air in a column that is one meter square, fivekm tall, and based at sea level, by breaking the column into blocks that are onekm tall.
(b) Make another approximation by breaking the column into blocks that are onlyone meter tall. (Recall that your calculator can be used to sum a series.)
(c) Which answer is a better approximation?
August 11 2017 11 Phillips Exeter Academy

Problem Set 18 Math 43C
(d) By the way, you are calculating the mass of the column of air. To test theplausibility of your answer, re-calculate the mass assuming that its density isconstant, using both the sea-level value and the 5-km value.
6. (Continuation) It is possible to find an exact answer for the mass of the column of airby using an integral. Calculate this exact value, assuming that the base of the 5-kmtall column of air is (a) at sea level; (b) 5 km above sea level.
7. Immigration model for population growth. The population of Gravesend grows in pro-portion to its current population with a constant of proportionality 0.03. It also growsdue to a constant immigration rate of 100,000 people per year. The current populationis 10 million.
(a) Explain why the differential equation dPdt
= 0.03P + 0.1 can be used to describethe population growth in Gravesend.
(b) Use Euler’s method to estimate the population for the next 30 years. How longwill it take for the population to double its current size? When will it reach 100million?
(c) How does your Euler’s method estimate relate to the value of the definite integral∫ 30
0(0.03P (t) + 0.1) dt?
(d) You can actually find a symbolic formula for P (t) by solving the given differentialequation. (You have solved a differential equation similar to this in a previousproblem set.) Solve the differential equation, then compare the exact values fromyour solution with the estimates in part (b).
8. You have now worked through a few accumulation problems, such as finding the dis-tance traveled by a car, finding the population of a country, and finding the mass of acolumn of air. In each case the desired quantity could be approximated by a sum ofproducts — speed times time, area times height, etc. The precise answer was a limit ofsuch sums. For example, if the cross-sectional area of a water reservoir is A(x), wherex is the depth of the cross section, for 0 ≤ x ≤ b, then the volume of the reservoir is∫ b
0
A(x) dx = limn→∞
n∑k=1
A(k∆x)∆x
where ∆x = b/n.
(a) Explain the relationship between the approximating sum and the integral. Besure to include the role of each of the symbols in the equation.
(b) Write the integral for the distance traveled by a car whose speed is f(t) for0 ≤ t ≤ 6.
(c) Write an equivalent integral for the following expressions:
i. limn→∞
n∑k=1
sin
(kπ
n
)π
n
August 11 2017 12 Phillips Exeter Academy
Problem Set 18 Math 43C
ii. limn→∞
n∑k=1
(2k
n
)2
· 2
n
(d) Evaluate and interpret the two integrals from part (c).
9. Apply the Fundamental Theorem of Calculus by using an antiderivative to find the areaof the first quadrant region that is enclosed by the coordinate axes and the parabolay = 9− x2.
10. (Continuation) Write an approximating sum (called a Riemann sum) for∫ 3
0(9−x2)dx.
Draw a graphical representation that shows how the limit of a Riemann sum approachesthe value of a definite integral.
11. A standard six-sided die is rolled 5 times. What is the probability that
(a) The first roll is an ace?
(b) The first two rolls are aces?
(c) None of the rolls is an ace?
(d) At least one of the rolls is an ace?
12. “Common integration is only the memory of differentiation.” (Augustus De Morgan)Explain what you think is the meaning of this quote.
13. Use the Fundamental Theorem of Calculus to evaluate (a)∫ π
0cosx dx; (b)
∫ π0
sinx dx.
14. Being successful when using antidifferentiation to evaluate an integral often dependsupon recognizing the form of the integrand. To illustrate this remark, the followingdefinite integrals have a common form. Evaluate each of them.
(a)∫ 15
62x√
64 + x2 dx
(b)∫ π/2
0cosx
√sinx dx
(c)∫ 1
0ex√
3 + ex dx
(d)∫ e
11x
√lnx dx
15. When two six-sided dice both land showing ones, it is called snake-eyes. What is theprobability of this happening? What is the most likely sum of two dice, and what isits probability?
16. The water in a cylindrical tank is draining through a small hole in the bottom of thetank. The depth of water in the tank is governed by Torricelli’s Law : dy
dt= −0.4
√y,
where y is measured in cm and t is in seconds. (The rate constant 0.4 depends uponthe size of the cylinder and the size of the hole.)
(a) Restate Torricelli’s Law in words and without symbols.
(b) Draw a sketch of the rate of change of the depth with respect to time. Now drawa sketch of the depth of the water versus time using a starting depth of 64 cm.
August 11 2017 13 Phillips Exeter Academy

Problem Set 18 Math 43C
(c) This equation states that at the moment the water is 49 cm deep, the water levelis dropping at a rate of 2.8 cm/sec. Suppose the water is 64 cm deep; estimatethe water level a half second later.
17. (Continuation) By writing Torricelli’s Law in the form 1√ydydt
= −0.4, solve this differ-
ential equation for y as a function of t. Use the information that the starting depth is64 cm to obtain the correct particular solution.
(a) Compare y(0.5) with your estimate in the preceding questions. Was your estimatetoo high or too low? How could you have predicted this?
(b) What is the minimum time needed to empty the tank completely?
18. A coin with a 2 cm diameter is dropped onto a sheet of paper ruled by parallel linesthat are 3 cm apart. Which is more likely, that the coin will land on a line, or that itwill not? Calculate the probability that the coin will land on a line.
August 11 2017 14 Phillips Exeter Academy

Lab 18: Integration as Accumulation Math 43C
We have seen in our previous work how the accumulation of an Euler’s method approximationand the area under a curve are two views of the same problem. We have also noted that anintegral calculated using an antiderivative gives an exact value for the limit of a sum as thestep size shrinks towards zero. If an antiderivative is not known, numerical integration canbe used, as with some of the problems in this lab.
1. The speed in mph of a red sports car as the driver slows to be under the speed limitis described by s(t) = 80(0.97)t
2for 0 ≤ t ≤ 5.
(a) Complete the table below in a graphing app.
t 1 2 3 4 5s(t)
(b) Construct a speed vs. time graph.
(c) Use the points in part (a) to estimate the distance traveled during the entire 5seconds. Discuss the various strategies that you and your classmates come upwith. How does your estimate relate to the graph?
2. A conical reservoir is 12 meters deep and 8 meters in diameter.
(a) Confirm that the surface area of the water is described by A(h) =πh2
9, given that
the water is h meters deep.
(b) Complete the table below in a graphing app and construct a graph of surface areavs. depth of water.
Depth (h) 0 3 6 9 12Surface Area (A)
(c) Estimate the volume of the reservoir using the points in the table in part (b) toaccumulate surface areas for various depths. You may want to consider that thecone can be approximated with a stack of cylinders. How can you get a betterestimate? Discuss your strategy.
(d) There is a well-known formula for the volume of a cone, so you can get an exactvolume to compare with your estimates. What do your estimates, as well as theexact value, have to do with the graph of surface area vs. depth?
3. From midnight to 9 am, snow accumulates on a driveway at a rate modeled by thefunction s(t) = 7 t ecos t, where t is in hours and s is in cubic feet per hour.
(a) Obtain a graph of s(t). At about what time is the snow accumulating the fastest?
(b) Use your graph to come up with a rough estimate of the average rate of snowaccumulation, and thus estimate the total amount of snow that accumulates by9 am. Explain how this method relates to the graph of s vs. t.
August 11 2017 15 Phillips Exeter Academy
Lab 18: Integration as Accumulation Math 43C
(c) Refine your estimate of the total amount of snow by using the rate of accumulationat each hour (1 am, 2 am, and so on) to estimate the amount of snow thataccumulates during each hour. Your estimate of the total will be a sum of thesenine numbers.
(d) Further refine your estimate by using half-hour intervals of accumulation.
(e) If you continue to use smaller intervals (say minute intervals, then seconds, etc.)to calculate the accumulation of snow, is there a theoretical limit to your sum?How does this theoretical limit relate to the graph of s vs. t?
4. Can any of these three accumulation problems be solved with an antiderivative? If so,use the techniques of antiderivatives to find the exact value of an appropriate integral.
5. Write a lab report including your results, analysis of your work, and any new insightsand techniques that you have used here.
August 11 2017 16 Phillips Exeter Academy

Problem Set 19 Math 43C
1. Two real numbers are chosen at random between 0 and 10. What is the probabilitythat the sum is less than 5? greater than 10? This is a two-dimensional problem,so you will want to investigate the sum x + y in the region where 0 ≤ x ≤ 10 and0 ≤ y ≤ 10. The solution can be modeled using a ratio of areas, a technique known asGeometric Probability.
2. The derivative of a step function has only one value, and yet it could be misleading tosimply say that the derivative is a “constant function.” Why?
3. There is no general method that will find an explicit solution for every differential equa-tion, but the antidifferentiation approach can be applied to separable equations. For ex-
ample, you have seen howdy
dt= −0.4
√y can be solved by rewriting it as
1√y
dy
dt= −0.4,
then antidifferentiating both sides to obtain 2√y = −0.4t + C. Notice that there are
infinitely many solutions, thanks to the antidifferentiation constant C. Another sepa-
rable example that occurs often is illustrated bydy
dt= −0.4y. You already know that
a solution to this equation is an exponential function (which one?), but we can also
use the separable technique. We can rewrite the equation as1
y
dy
dt= −0.4, then antid-
ifferentiate both sides to obtain ln y = −0.4t+ C, which is equivalent to y = ke−0.4t.
(a) Solvedy
dt= y2 sin t by the separable technique.
(b) Solvedy
dt= y + 2 by the separable technique.
(c) Show thatdy
dt= y + 2t is not a separable equation.
4. (Continuation) Is it necessary to place an antidifferentiation constant on both sides ofan antidifferentiated equation? Explain.
5. Two real numbers between −2 and 2 are chosen at random. What is the probabilitythat the sum of their squares is greater than 1?
6. A cycloid is traced out by the parametric equation (x, y) = (t− sin t, 1− cos t).
(a) Confirm graphically that one arch of this curve is traced out by using t-valuesfrom 0 to 2π.
(b) Estimate the area under one arch of the cycloid by three different methods: (i)the average of the areas of a rectangle and a triangle; (ii) the sum of the areas offive rectangles whose heights are values on the curve; (iii) using an antiderivativeto find the area under a parabola that contains the peak and the x-intercepts ofthe arch.
(c) Which of the estimates in part (b) do you think is closest to the true area?
7. The integral∫ π
0x sinx dx is not one we can compute using the techniques we know
now by finding an antiderivative. We can, however, estimate the area under the curve
August 11 2017 17 Phillips Exeter Academy
Problem Set 19 Math 43C
y = x sinx from x = 0 to x = π by a variety of methods, a few of which are outlinedbelow.
(a) First, divide the interval from x = 0 to x = π into five subintervals using thesequence of points 0, π/5, 2π/5, 3π/5, 4π/5, π. The first subinterval is [0, π/5], thesecond subinterval is [π/5, 2π/5], and so on up to the fifth subinterval [4π/5, π].
(b) Left-hand endpoints. Approximate the area by summing up the five rectangleswith heights determined by the value of y = x sinx at the left-hand endpoints ofeach subinterval. Draw a picture of the curve and the rectangles. How well doyou think the sum approximates the actual area under the curve?
(c) Right-hand endpoints. Approximate the area by summing up the five rectangleswith heights determined by the value of y = x sinx at the right-hand endpointsof each subinterval. Draw a picture of the curve and the rectangles. How well doyou think the sum approximates the actual area under the curve?
(d) Midpoints. Approximate the area by summing up the five rectangles with heightsdetermined by the value of y = x sinx at the midpoints of each subinterval.Draw a picture of the curve and the rectangles. How well do you think the sumapproximates the actual area under the curve?
8. (Continuation) Evaluate the integral∫ π
0x sinx dx using a numerical integrator on a
calculator or some other technology. Now discuss the accuracy of the approximationsfrom the previous problem.
9. (Continuation) The area approximation with rectangles improves as the number ofrectangles increases, which means the width of each rectangle decreases. In the limitas the number of rectangles increases without bound, the sum of the areas of therectangles is exactly equal to the area. Which endpoint technique is represented byeach of the following limits? Explain.
(a) limn→∞
n−1∑k=0
(xk sinxk)(πn
), where xk = k · π
n
(b) limn→∞
n∑k=1
(xk sinxk)(πn
), where xk = k · π
n
10. Two real numbers between 0 and 4 are chosen at random. What is the probabilitythat the sum of the two numbers is greater than the product of the two numbers?
11. The acceleration due to gravity g is not constant — it is a function of the distance rfrom the center of the Earth, whose radius is R = 6.378 × 10⁶ m, and whose mass isM = 5.974× 1024 kg. You learn in physics that
g =
{GMrR−3 for 0 ≤ r < R
GMr−2 for R ≤ r
where G = 6.673× 10⁻¹¹Nm2
kg2 is the gravitational constant.
August 11 2017 18 Phillips Exeter Academy
Problem Set 19 Math 43C
(a) Sketch a graph of g as a function of r.
(b) Is g a continuous function of r?
(c) Is g a differentiable function of r?
(d) What familiar value of g is found at the surface of the earth, where r = R?
12. Show that∫ 2
11xdx and
∫ 10
51xdx have the same value.
13. (Continuation) Find the exact value of∫ 2b
b1xdx.
14. Find the area of the region bounded by y =1
1 + x2, the x-axis, and the lines x = 1
and x = −1.
15. Find the area of the “triangular” region enclosed by y = cosx, y = sinx, and x = 0.
16. Recall that the Gini index is defined as twice the area of the region between the liney = x and the Lorenz curve from x = 0 to x = 1. Suppose the equation of the Lorenzcurve for the U.S. income distribution in 1990 is L(x) = x2.36. Use L(x) to calculatethe value of the U.S. Gini index for 1990.
17. The following definite integrals have something significant in common which will allowyou to evaluate each of them by finding an antiderivative.
(a)
∫ 3
0
2x
1 + x2dx
(b)
∫ π/2
π/4
cosx
sinxdx
(c)
∫ 0
−1
ex
3 + exdx
(d)
∫ 5
4
2x+ 3
x2 + 3x− 4dx
18. Find the area of the region enclosed by the line y = x and the parabola y = 2 − x2.You will need to find the points of intersection of the line and the parabola.
August 11 2017 19 Phillips Exeter Academy

Lab 19: Geometric Probability Math 43C
In this lab we will investigate probability questions that are answered by calculating theratios of areas. Some of the areas are of geometric figures with well-known area formulas.Other regions of interest will require techniques of calculus to determine the areas.
1. A coin of radius 1 cm is tossed onto a plane surface that has been tessellated byrectangles, all of which measure 5 cm by 12 cm. What is the probability that the coinlands entirely within one of the rectangles?
2. Two numbers x and y between 0 and 1 are chosen at random.
(a) Sketch the region of the xy-plane that symbolizes the pair of numbers chosen.What is the area of this region?
(b) What is the probability that the sum is less than 12? This can be written in
symbols as P(x+ y < 1
2
). Be sure to indicate a subset of the region in part (a)
that has an area equal to the probability you wish to calculate.
(c) What is the probability that the product is less than 12? This can be written
in symbols as P(xy < 1
2
). Again, be sure to indicate a subset of the region in
part (a) that has an area equal to the probability you wish to calculate.
3. Random Quotient. If two numbers x and y between 0 and 1 are chosen at random,determine the probability of each of the following events.
(a)x
y< 1
(b)x
y< 0.25
(c)x
y< 2
(d) 10 <x
y
(e) 0.2 <x
y< 0.3
4. Random Product. If two numbers x and y between 0 and 1 are chosen at random,determine the probability of each of the following events.
(a) xy < 0.9
(b) xy > 0.5
(c) xy < 0.1
(d) 0.2 < xy < 0.3
5. Buffon’s needle problem (1777). Suppose a flat surface is marked off with parallellines spaced 5 cm apart. If a needle of length 5 cm is dropped at a random place onthe surface with a random orientation, what is the probability that the needle willlie across one of the lines? Similar to the previous problems, each drop of the needlecan be represented by two random numbers, the distance of the needle from a line(you’ll need to decide which point of the needle to use and which line) and the angleof orientation of the needle.
August 11 2017 20 Phillips Exeter Academy

Lab 19: Geometric Probability Math 43C
6. After you have worked out your answers to the problems in this lab, write a report withyour results and a summary of the main ideas common to the problems. Be sure toemphasize how the techniques and concepts of calculus are used in your calculations.
August 11 2017 21 Phillips Exeter Academy

Problem Set 20 Math 43C
1. The Fundamental Theorem of Calculus states that an integral∫ baf(t)dt can be evalu-
ated by the formula F (b)−F (a), where F is an antiderivative for f . One of the issueswe have glossed over is the assumption that an antiderivative of f actually exists. Whatmust be true of the function f in order to apply the Fundamental Theorem? Can Fbe any antiderivative of f? Explain.
2. (Continuation) Because of this close connection between integration and differentia-tion, integral signs are often used to denote antiderivatives. Thus statements such as∫x2 dx = 1
3x3 + C are common, where C is called the constant of integration. The
following notation is a helpful way to order the steps in calculating a definite integral:∫ 8
5
x2 dx =1
3x3
∣∣∣∣85
=1
3· 83 − 1
3· 53
= 129
(a) Why is there no need to insert a constant of integration in the antiderivative?
(b) Now evaluate∫e2x dx and
∫ 1
−1e2x dx.
3. Suppose a projectile is propelled vertically into the air such that the height (in meters)as a function of time (in seconds) is given by h(t) = −5t2 + 1000t.
(a) How long does it take for the projectile to return to the ground?
(b) What is the displacement of the projectile during the time it is in the air?
(c) What is the total distance traveled by the projectile?
4. (Continuation) Compare the displacement to the distance traveled for an object movingwith velocity v(t) = sin t from t = 0 to t = 2π.
5. Evaluate each definite integral
(a)∫ e
11xdx
(b)∫ 2
−2|x| dx
(c)∫ 2π
0cosx dx
(d)∫ 1
−1(ex + e−x) dx
6. Find the area of the region enclosed by the line y = x+ 2 and the parabola y = 4−x2.
August 11 2017 22 Phillips Exeter Academy
Problem Set 20 Math 43C
7. What property of a function f guarantees that
(a)∫ a−a f(x) dx = 2
∫ a0f(x) dx holds for all a?
(b)∫ a−a f(x) dx = 0 holds for all a?
Draw a graph of a typical function in each case.
8. S-I-R model. The spread of an infectious disease can be modeled by differential equa-tions that give the rate of change with respect to time of three segments of a population:S is the number of susceptibles who are not yet infected but could become infected;I is the number of people who are currently infected; and, R is the number of recov-ered people who have been infected but can no longer infect others or be reinfected.Consider the following set of coupled differential equations where a and b are positiveconstants:
dS
dt= −aSI
dI
dt= aSI − bI
dR
dt= bI
(a) Why is the sum of these three equations equal to 0?
(b) Explain each term in the equations and why they make sense.
(c) Suppose the starting values of each segment of the population are S0 = 1000,I0 = 10, and R0 = 0. On the same set of axes, sketch plausible graphs of S, I,and R versus time.
9. Evaluate each of the indefinite integrals by finding an antiderivative for each.
(a)
∫2x+ 5
x2 + 5x− 6dx
(b)
∫cos 3t dt
(c)
∫1√
1− u2du
(d)
∫sec2 2θ dθ
10. Check that F (t) = 12(t− sin t cos t) is an antiderivative for f(t) = sin2 t. Then find an
antiderivative for g(t) = cos2 t.
11. Jordan is jogging along a straight path with velocity given by a differentiable function vfor 0 ≤ t ≤ 40. The table below shows certain values of v(t), where t is in minutesand v(t) is measured in meters per minute. (As always, you should have a visualrepresentation before you as you solve this problem.)
August 11 2017 23 Phillips Exeter Academy

Problem Set 20 Math 43C
t (minutes) 0 12 20 24 40v (m/min) 0 200 240 −220 150
(a) Explain the meaning of the definite integral∫ 40
0|v(t)| dt in the context of this
problem.
(b) Find an approximate value of∫ 40
0|v(t)| dt using the given data.
12. The area of the unit circle is given by the integral 2∫ 1
−1
√1− x2 dx. Explain. Use a
geometric interpretation to find the value of this integral.
13. (Continuation) The previous integral is difficult to evaluate by finding an antiderivative;however, parameterizing the circle leads to a more accessible antiderivative.
(a) Confirm that a set of parametric equations x(t) and y(t) for a circle with radius rand center at (0, 0) is (x(t), y(t)) = (r cos t, r sin t).
(b) In the non-parametric version, the area of the circle is 2∫ r−r y dx, where y =√
r2 − x2. In the parametric version, as x goes from −r to r, the value of theangle t goes from π to 0. In the integrand, y dx changes to y(t)dx
dtdt. Explain this
transformation of the integrand.
(c) Explain and evaluate the parametric version of the area integral
2
∫ 0
π
r sin t (−r sin t)dt
.
14. For the differential equationdy
dx= x− y,
(a) obtain a graph of the slope field;
(b) add to the slope field a graph of the solution curve containing the point (0, 1);
(c) use Euler’s method with 10 steps from (0, 1) to find the value of the solution atthe point with x = 2;
(d) describe the behavior of the various types of solution curves as revealed by theslope field.
15. The velocity of an object moving back and forth on the x-axis is v(t) =1
2t3− 3t2 + 10.
(a) Find the displacement of the object from t = 0 to t = 6. How is this value relatedto area?
(b) Write a single integral that represents the total distance traveled from t = 0 tot = 6. Find the value of this integral, for which you may want to use a numericalintegrator.
(c) What must be true of the graph of the velocity if the displacement over an intervalis exactly 0?
August 11 2017 24 Phillips Exeter Academy
Problem Set 20 Math 43C
16. Evaluate an integral to find a formula, in terms of a and b, for the area enclosed bythe ellipse (x, y) = (a cos t, b sin t). Work parametrically as with the area of the circleproblem above.
17. Give two reasons why∫ baf(x) dx = −
∫ abf(x) dx should be true.
18. Write a paragraph (along with helpful graphics) explaining the relationships betweenEuler’s method, accumulating rate of change, a definite integral, and the sum of theareas of rectangles.
19. Show that the derivative with respect to x of ln |x| equals 1x, i.e. d
dx(ln |x|) = 1
x. Thus
show that∫
1xdx = ln |x|+ C is a true statement.
August 11 2017 25 Phillips Exeter Academy

Lab 20: The Normal Curve Math 43C
1. This lab is centered on flipping a fair coin 100 times and counting the number ofheads, which we will simulate with technology. First you should open the Geogebrafile named “Lab 20 simulation”. This file simulates a trials of 100 coin flips, wherethe number of heads in each trial is recorded. The value of a is controlled by a slider,which is initially set to 100. This means there are 100 trials of 100 coin tosses. Theaccompanying frequency histogram displays the number of times each number of headsoccurred. For example, the bin centered on 45 has a height equal to the number oftimes 45 heads occurred in 100 trials of 100 coin flips. Since heads is as equally likelyas tails, you might think that every trial would result in 50 heads. As the histogramshows, this is not the case. Why? Discuss the shape of the histogram.
2. Observe what happens to the frequency histogram as you increase the value of a, thenumber of trials. Does the center of the histogram shift? What about the heights ofthe rectangles? (The y-axis is fixed to the edge of the graphing window to make iteasy to adjust the height of the window without needing to shift the window.)
3. It becomes rather tedious to continually adjust the graphing window as you changethe number of trials of 100 coin flips. The alternative is a probability histogram, whichdivides the individual frequencies (which are the rectangle heights) by the total numberof trials. This causes the entire area of the histogram to remain at 1 no matter how youset the slider for the number of trials. To see this, you should highlight the probabilityhistogram and un-highlight the frequency histogram. Now gradually adjust the sliderfrom 100 to 5000 and describe the changing shape of the probability histogram.
4. As the number of trials increases, the shape of the probability histogram becomes morelike the so-called bell curve, or normal curve. The equation of the standard normalcurve is the familiar function
f(x) =1√2πe−x
2/2.
(The factor1√2π
makes the area under this curve equal to 1.) Graph this function
along with the probability histogram, then adjust the function with a horizontal shiftso that the peak of the curve aligns with the highest values of the histogram.
5. At this point you will notice that the normal curve is too tall and narrow comparedwith the histogram. You should adjust the function f with a horizontal stretch by
changing(x− 50)2
2to
1
2
(x− 50
s
)2
. (Why?) The value of s can be set by creating
a slider with a range of 1 to 10. Now as you increase s you will see the spread of thenormal curve widen as well.
6. You will also need to decrease the height of the normal curve, which can be accom-
plished by changing the factor1√2π
to1
s√
2π. This also achieves the goal of keeping
the area under the curve at 1, just as with the probability histogram. Why does theintroduction of s in two places in the formula for f keep the area under the curve at 1?
August 11 2017 26 Phillips Exeter Academy

Lab 20: The Normal Curve Math 43C
7. Write down the function f that best fits the probability histogram. Note the locationof the center of the normal curve and the value of s. In statistics, the center is calledthe mean and the spread s is called the standard deviation.
8. What is the probability that the number of heads in 100 coin flips is between 45 and 55,inclusive? One way to answer this question is by summing the areas of the histogrambars from 45 to 55. On the other hand, you can find the area under the normal curvefrom 44.5 to 55.5, which is the value of the integral∫ 55.5
44.5
1
s√
2πe−
12(x−50
s )2
dx.
We are not able to calculate this integral using an anti-derivative, but we can findthe value using numerical integration, which Geogebra implements with the commandintegral[f,44.5,55.5]. Notice that we have replaced a discrete problem (the area ofpart of the histogram) with a continuous problem (the area under the normal curve).
9. Use numerical integration to answer the following questions: What is the probabilitythat the number of heads x in 100 tosses is such that
(a) 45 ≤ x ≤ 55?
(b) 40 ≤ x ≤ 60?
(c) x > 57?
(d) x < 36?
10. Write a report summarizing your work in this lab and explaining your understandingof the various concepts introduced here.
August 11 2017 27 Phillips Exeter Academy

Problem Set 21 Math 43C
1. Water is being pumped into a pool at a rate P (t) cubic feet per hour. The table belowgives values for P (t) for selected values of t.
t 0 2 4 6 8 10 12P (t) 0 46 53 57 60 62 63
(a) Draw a graph of the ordered pairs (t, P (t)). Use the areas of trapezoids to estimatethe amount of water that was pumped into the pool during these 12 hours.
(b) Over these same 12 hours, water has been leaking from the pool at the rate ofL(t) cubic feet per hour, where L(t) = 25e−0.05t. How much water has leaked outduring the time interval 0 ≤ t ≤ 12?
(c) Use your answers to parts (a) and (b) to estimate the amount of water in the poolat time t = 12 hours.
2. A pyramid that is 12 inches tall has a base whose area is 80 square inches. The pyramidis sliced by a plane that is y inches from the vertex and parallel to the base. Let A(y)
be the area of the cross-section. Find a formula for A(y), then evaluate∫ 12
0A(y) dy.
Explain the significance of the answer.
3. You have recently (in Problem Set 18) evaluated a number of integrals of the form∫ ba
√u du. For example,
∫ e1
1x
√lnx dx is equal to
∫ 1
0
√u du, where u = lnx. Notice that
u = 1 corresponds to x = e and u = 0 corresponds to x = 1, which is why the limitson the two integrals are different. Make up an example that is equivalent to
∫ 9
4
√u du,
by replacing u by an expression f(x) of your choice. Choose corresponding integrationlimits for your dx integral, then find its value. This technique of transforming oneintegral into another that has the same value is known as integration by substitution.
4. Use integration by substitution to find the values of the following integrals.
(a)
∫ π/2
π/4
cosx
sinxdx
(b)
∫ 2π
23π
cos 1x
x2dx
5. (Continuation) What area problem is represented by the integral
∫ π/2
π/4
cosx
sinxdx?
6. The arc y =√x for 0 ≤ x ≤ 4 is revolved around the x-axis, which generates a surface
known as a paraboloid. Note that the cross-sections perpendicular to the x-axis arecircles.
(a) What is the area of the cross-section at x = 1? At x = 4? At x = r?
(b) Obtain and evaluate an integral for the volume of this paraboloid.
7. Find the exact area bounded by the x-axis and one arch of the cycloid traced by theparametric equation (x, y) = (t− sin t, 1− cos t).
August 11 2017 28 Phillips Exeter Academy

Problem Set 21 Math 43C
8. Find the value of
limn→∞
1
n
(e1/n + e2/n + e3/n + · · ·+ en/n
).
There are at least two ways to proceed.
9. Find the area bounded by the curves with equations y = x2−6x+11 and y = −12x2 + 2x+ 4.
10. The Mean-Value Theorem. Suppose that f is continuous on the interval a ≤ x ≤ b,and that f is differentiable on the interval a < x < b. Draw the graph of f , and thendraw the segment that joins P = (a, f(a)) to Q = (b, f(b)). Now consider all the linesthat can be drawn tangent to the curve y = f(x) for a < x < b. It is certain thatat least one of these lines bears a special relationship to segment PQ. What is thisrelationship?
11. The radius of a spherical container is r cm, and the water in it is h cm deep. Use anintegral
∫ h0A(z) dz to find a formula for the volume of water in the container. Check
your formula for the special cases h = 0, h = r, and h = 2r.
12. Explain the geometric significance of the result∫ R
04πx2 dx = 4
3πR3. In particular,
contrast the way in which volume was accumulated in the preceding exercise with theway in which volume is being accumulated in this example.
13. An American roulette wheel consists of slots numbered 1 to 36, half of which are redand half of which are black, plus two green slots numbered 0 and 00. The game isplayed by rolling a ball into the spinning wheel, where it comes to rest in one of the38 slots.
(a) If you place a $1 bet on red, and the ball ends up in a red slot, you win $1(meaning you get back your $1 bet plus $1). What is the probability of winningwhen betting on red?
(b) If you play red 1000 times, how much will you expect to win (or lose)? What isthe average amount you win or lose per bet? This is known as the expected valueof the game.
(c) Show that the expected value of playing red is the sum of two terms, each ofwhich is the product of a probability and an amount won or lost.
(d) Why is it that casino games generally have a negative expected value from theperspective of the player?
14. The conclusion of the Mean-Value Theorem does not necessarily follow if f is notknown to be a differentiable function. Provide an example that illustrates this remark.
15. The special case of the Mean-Value Theorem that occurs when f(a) = 0 = f(b) iscalled Rolle’s Theorem. Write a careful statement of this result. Does “0” play asignificant role?
16. Sketch a graph and shade the indicated region for each of the following integrals. Findthe value of each integral, and give an explanation of why some of the answers arepositive and some are negative.
August 11 2017 29 Phillips Exeter Academy
Problem Set 21 Math 43C
(a)
∫ 2
0
(x2 + 1
)dx
(b)
∫ 0
−2
(x2 + 1
)dx
(c)
∫ −2
0
(x2 + 1
)dx
(d)
∫ 1
0
(x2 − 1
)dx
17. Find the value of
∫ 2
−2
sinx dx, and explain the answer.
18. Given a function f , about which you know only f(2) = 1 and f(5) = 4, can you besure that there is an x between 2 and 5 for which f(x) = 3? If not, what additionalinformation about f would allow you to conclude that f has this intermediate-valueproperty?
19. In the carnival game “Chuck-A-Luck” you roll three fair dice. If you roll three 6’s youwin $5. If you roll two 6’s you win $3. If you roll one 6 you win $1, and if you rollno 6’s you lose $1.
(a) On a single play of the game, how many ways can you win $5? How many wayscan you win $3? How many ways can you win $1? How many ways can youlose $1?
(b) Show that the expected value of this game is $0.
20. Obtain a graph of the region enclosed by the positive coordinate axes, the curvey = e−x, and the line x = a, where a > 0.
(a) Write an expression for the area of this region. For what value of a is the areaequal to 0.9? equal to 0.999? equal to 1.001?
(b) The expression
∫ ∞0
e−x dx, which is defined as limb→∞
∫ b
0
e−x dx, is an example of
an improper integral. What is its numerical value, and how is this number to beinterpreted?
August 11 2017 30 Phillips Exeter Academy
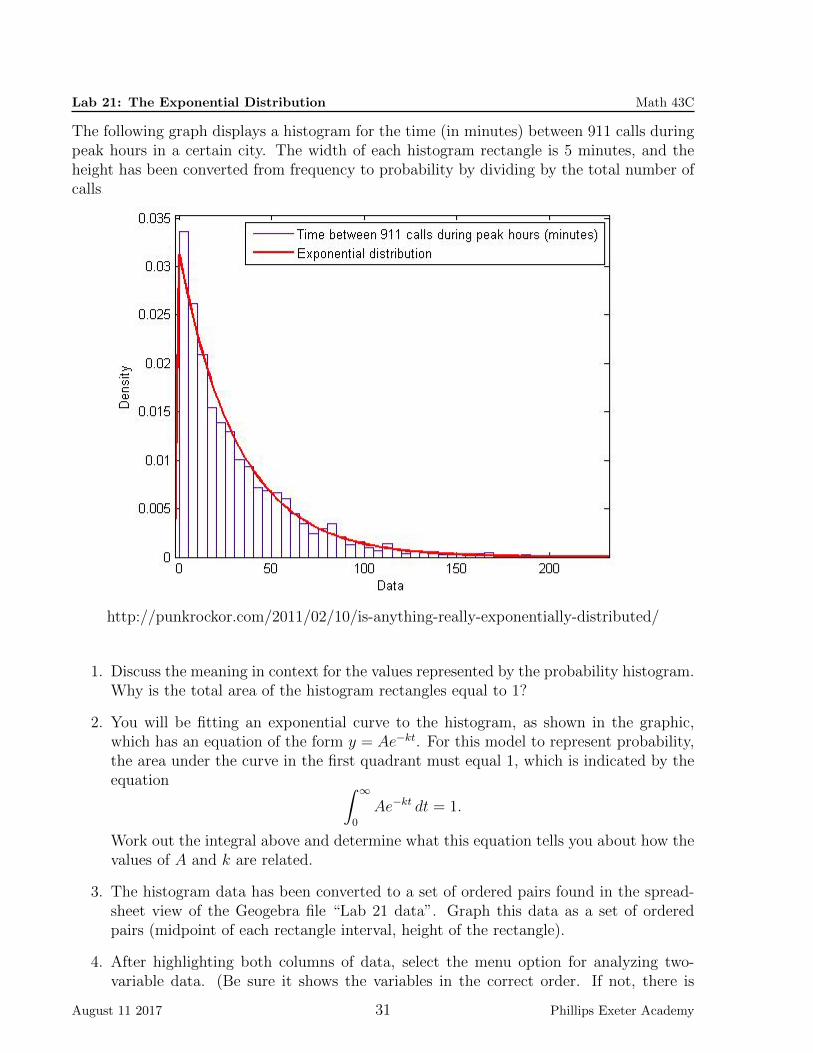
Lab 21: The Exponential Distribution Math 43C
The following graph displays a histogram for the time (in minutes) between 911 calls duringpeak hours in a certain city. The width of each histogram rectangle is 5 minutes, and theheight has been converted from frequency to probability by dividing by the total number ofcalls.
http://punkrockor.com/2011/02/10/is-anything-really-exponentially-distributed/
1. Discuss the meaning in context for the values represented by the probability histogram.Why is the total area of the histogram rectangles equal to 1?
2. You will be fitting an exponential curve to the histogram, as shown in the graphic,which has an equation of the form y = Ae−kt. For this model to represent probability,the area under the curve in the first quadrant must equal 1, which is indicated by theequation ∫ ∞
0
Ae−kt dt = 1.
Work out the integral above and determine what this equation tells you about how thevalues of A and k are related.
3. The histogram data has been converted to a set of ordered pairs found in the spread-sheet view of the Geogebra file “Lab 21 data”. Graph this data as a set of orderedpairs (midpoint of each rectangle interval, height of the rectangle).
4. After highlighting both columns of data, select the menu option for analyzing two-variable data. (Be sure it shows the variables in the correct order. If not, there is
August 11 2017 31 Phillips Exeter Academy

Lab 21: The Exponential Distribution Math 43C
an option to flip the ordered pairs.) Choose the option for exponential least squares,which will open a window with a plot of the ordered pairs, the least-squares curve, andthe equation of the curve. Record the equation of the curve that is shown.
5. Your exponential model may not fit the area requirement derived in number 2; adjustthe values of the parameters so that the area under the curve equals 1.
6. You are now able to answer probability questions about the time t between 911 callsusing an integral to represent area under the curve. Calculate the probability that
(a) t is less than 10 minutes
(b) t is more than 30 minutes
(c) t is less than an hour
7. Estimate from the graph the average time between 911 calls. This is not the averageheight of the histogram.
8. Use an integral with your exponential probability model to calculate the average timebetween 911 calls. Recall that average (or expected) value in this context can be foundby summing up the products of t times the probability of t occurring for all possiblevalues of t. Since our probability model is continuous, this results in an infinite sumthat can be represented by an integral of the form∫ ∞
0
t · P (t) dt.
Use the numerical integration command in Geogebra to calculate the average timebetween 911 calls. Compare your result with your estimate from number 7. How doesthe average compare with the parameter of your model?
9. Suppose x represents the life span (in hours) of an electrical component, and theprobability that a component fails is distributed exponentially, as described by
P (x) =1
50e−x/50.
(a) Determine the probability that a randomly selected component fails within thefirst 10 hours.
(b) Suppose you start with 1000 components. How many will fail within the first 10hours? What proportion is this? Of the remaining components, what proportionwill fail in an additional 10 hours? This result illustrates the memoryless propertyof an exponential probability distribution: The probability that a component lastsat least t hours is the same as the probability that the component lasts at least tadditional hours given that it has already lasted h hours.
(c) Determine the average life span of a component.
10. Write a report summarizing your work in this lab and explaining your understandingof the various concepts introduced here. In particular, be sure to discuss why it isthat area under the exponential curve is our quantity of interest and not the particularvalue at a point.
August 11 2017 32 Phillips Exeter Academy
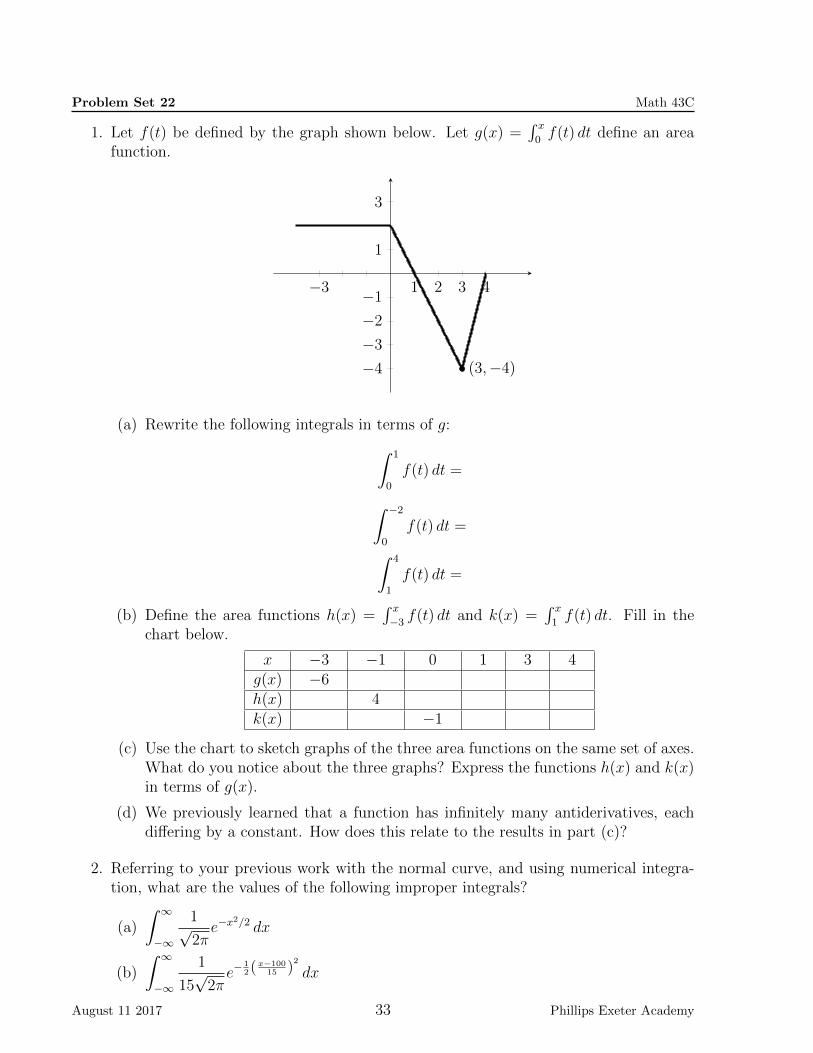
Problem Set 22 Math 43C
1. Let f(t) be defined by the graph shown below. Let g(x) =∫ x
0f(t) dt define an area
function.
−3 1 2 3 4
−4
−3
−2
−1
1
3
(3,−4)
(a) Rewrite the following integrals in terms of g:∫ 1
0
f(t) dt =
∫ −2
0
f(t) dt =∫ 4
1
f(t) dt =
(b) Define the area functions h(x) =∫ x−3f(t) dt and k(x) =
∫ x1f(t) dt. Fill in the
chart below.
x −3 −1 0 1 3 4g(x) −6h(x) 4k(x) −1
(c) Use the chart to sketch graphs of the three area functions on the same set of axes.What do you notice about the three graphs? Express the functions h(x) and k(x)in terms of g(x).
(d) We previously learned that a function has infinitely many antiderivatives, eachdiffering by a constant. How does this relate to the results in part (c)?
2. Referring to your previous work with the normal curve, and using numerical integra-tion, what are the values of the following improper integrals?
(a)
∫ ∞−∞
1√2πe−x
2/2 dx
(b)
∫ ∞−∞
1
15√
2πe−
12(x−100
15 )2
dx
August 11 2017 33 Phillips Exeter Academy

Problem Set 22 Math 43C
3. (Continuation) When you use numerical integration to calculate the previous integrals,what is the smallest interval you need to integrate over to get 99.8% of the area? Roundoff to the nearest unit.
4. Kelly completed a 250-mile drive in exactly 5 hours — an average speed of 50 mph.The trip was not actually made at a constant speed of 50 mph, of course, for there weretraffic lights, slow-moving trucks in the way, etc. Nevertheless, there must have beenat least one instant during the trip when Kelly’s speedometer showed exactly 50 mph.Give two explanations for why this assertion is true — one using a distance-versus-timegraph, and the other using a speed-versus-time graph. Make your graphs consistentwith each other.
5. (Continuation) A student drew the line that joins (0, 0) to (5, 250), and remarked thatany actual distance-versus-time graph has to have points that lie above this line andpoints that lie below it. What do you think of this remark, and why?
6. (Continuation) Another student was thinking that the area between the distance-versus-time graph and the time axis was a significant number. What do you thinkof this idea, and why?
7. Sasha took a wooden cylinder and created an interesting sculpture from it. The finishedobject is 6 inches tall and 6 inches in diameter. It has square cross-sections perpen-dicular to the circular base of the cylinder. Draw the top view and the two simplestside views of this sculpture. The volume of a thin slice of the object is approximatelyA(x)∆x, where −3 ≤ x ≤ 3. Explain.
(a) What is an equation for the base if you center it at the origin of the xy-plane?What is an equation for A(x), the area of a square cross section?
(b) What is the volume of the object?
August 11 2017 34 Phillips Exeter Academy

Problem Set 22 Math 43C
8. Integration by Parts is the name given to the Product Rule for derivatives when it isused to solve integration problems. The first step is to convert (f ·g)′ = f ·g′+g ·f ′ into
the form f(x) · g(x)
∣∣∣∣x=b
x=a
=
∫ b
a
f(x)g′(x) dx+
∫ b
a
g(x)f ′(x) dx. Explain this reasoning,
then notice an interesting consequence of this equation: If either of the integrals canbe evaluated, then the other can be too. Apply this insight to obtain the value of∫ π
0
x cosx dx.
9. (Continuation) Use integration by parts to verify the equation∫ ∞0
x · ae−ax dx =1
a,
which is the expected value of the exponential distribution
10. Let f(x) = x2 − 2. Investigate the area functions A(x) =∫ x
0(t2 − 2) dt.
(a) Evaluate integrals to fill in the following table.
x −2.0 −1.0 −0.5 0.0 0.5 1.0 2.0A(x)
(b) Plot the ordered pairs (x,A(x)).
(c) At what points do the minimum and maximum values of A(x) occur on the interval−2 ≤ x ≤ 2? Where does f(x) equal 0?
(d) What can you conclude about the functions A(x) and f(x)?
11. (Continuation) Use an antiderivative to show that the derivative of∫ x
1t2 dt is x2, which
can be written symbolically as ddx
∫ x1t2 dt = x2.
12. (Continuation) Show ddx
∫ xaf(t) dt = f(x). [Hint: Assume a function F is an antideriva-
tive of f .] This result is often called the Second Fundamental Theorem of Calculus.
13. (Continuation) We now have two Fundamental Theorems of Calculus. Explain howthey are related.
14. Let Rk be the region enclosed by the positive coordinate axes, the curve y = sec2 x,and the line x = k, where k is a number between 0 and π
2. Find the area of Rk, and
notice what happens to this area as k → π2. Explain why the expression
∫ π/20
sec2 x dxis called an improper integral. Does this expression have a numerical value?
15. Use integration by parts to find the following indefinite integrals.
(a)∫x sinx dx
(b)∫tet dt
(c)∫x lnx dx
August 11 2017 35 Phillips Exeter Academy

Problem Set 22 Math 43C
16. Evaluate the following improper integrals.
(a)
∫ ∞1
1
xdx
(b)
∫ ∞1
1
x2dx
(c)
∫ ∞1
1√xdx
17. (Continuation) For what values of p does the integral
∫ ∞1
1
xpdx have a finite value?
Explain and justify your answer.
18. The diagram shows the parabolic arc y = x2 inscribed in the rectangle −a ≤ x ≤ a,0 ≤ y ≤ a2. This curve separates the rectangle into two regions. Find the ratio of theirareas, and show that it does not depend on the value of a.
−a a
August 11 2017 36 Phillips Exeter Academy

Lab 22: Calculus and Data Analysis Math 43C
Part I: Heating Curve
1. The following table shows temperature (in degrees F) versus time (in minutes) for acold drink that is taken out of the refrigerator at time 0.
Time (min) Temperature (◦F)0 35.01 38.82 42.43 45.75 51.56 54.18 58.611 64.3
We know from previous work that a model for this data is an exponential curve thatlevels off at the ambient temperature. Enter this data in the spreadsheet of a Geogebrafile, and then obtain a graph. You will notice that we do not have enough data to easilydetermine the ambient temperature directly from the graph.
2. Rather than trying to guess the ambient temperature, we can use our calculus knowl-edge to estimate parameters of an appropriate model for the data. A differentialequation for the heating phenomenon is
dT
dt= k(A− T ),
where A, the ambient temperature, and k, the growth rate, are the parameters of themodel. Explain a rationale for this equation.
3. The differential equation above is linear in terms of the temperature T , which implies
that the ordered pairs
(T,dT
dt
)have a linear trend. We are not given values of
dT
dt,
but we can approximate each of the values with a difference quotient∆T
∆t. You should
now add to your spreadsheet a column with the values of the difference quotients.
4. Each difference quotient approximates the derivative over an interval, so each differencequotient should be paired with the average T on each interval (rather then the left-hand or right-hand T ). Make a column on the spreadsheet with the average T on eachinterval.
5. Now you are ready to make a plot of the ordered pairs that approximate
(T,dT
dt
)and fit a line to the data. Highlight the two columns with average T and with thedifference quotients, then select the menu option for analyzing two-variable data. (Besure it shows the variables in the correct order. If not, there is an option to flip theordered pairs.) Choose the linear least-squares option, which will open a window witha plot of the ordered pairs, the least-squares line, and the equation of the line.
August 11 2017 37 Phillips Exeter Academy
Lab 22: Calculus and Data Analysis Math 43C
6. The linear least-squares line has an equation of the form y = mx + b. Equate yourleast-squares equation with the differential equation above, and confirm that m = −kand b = kA.
7. Use the slope and intercept from the least-squares equation to solve for k and A.
8. Now we are ready to solve the differential equation to find a model for the data. Showthat the solution is
T (t) = A− Ce−kt,
where C is a constant of integration.
9. Substitute your values for A and k into the model T (t). The value of C can be estimatedfrom the initial value of the temperature. Graph your model along with the originaldata for time and temperature.
10. Discuss the various characteristics of your model. What is the ambient temperature?What is the meaning of k? How well does your model fit the data?
Part II: The Logistic Model for Growth
1. In this section you will fit a logistic model to the data for the total number of Star-bucks stores open at the end of each year from 1987 through 2008. Open the Geogebrafile named “Starbucks data” to find the data in the spreadsheet view (http://www.starbucks.com/about-us/company-information/starbucks-company-timeline).To make the data more manageable, insert a column for “Years since 1987” by sub-tracting 1987 from the Year column. Now obtain a plot of the set of ordered pairs(Years since 1987; Stores).
2. Discuss why a logistic model is a reasonable model for this data.
3. One of the parameters for a logistic model is the maximum number of stores. Thegraph of the given data does not show this growth limit, but as in Part I, we can use adifferential equation to estimate this parameter. Our differential equation for logisticgrowth is
dS
dt= kS
(1− S
M
),
where S is the number of stores as a function of time t, k is a growth rate, and M isthe upper limit on the number of stores. We can rewrite this equation as
1
S
dS
dt= k
(1− S
M
),
which is a linear equation with ordered pairs
(S,
1
S
dS
dt
). Create a column in your
spreadsheet for the average S on each interval (why?) and then a column for the
difference quotients∆S
∆tdivided by the average S.
August 11 2017 38 Phillips Exeter Academy
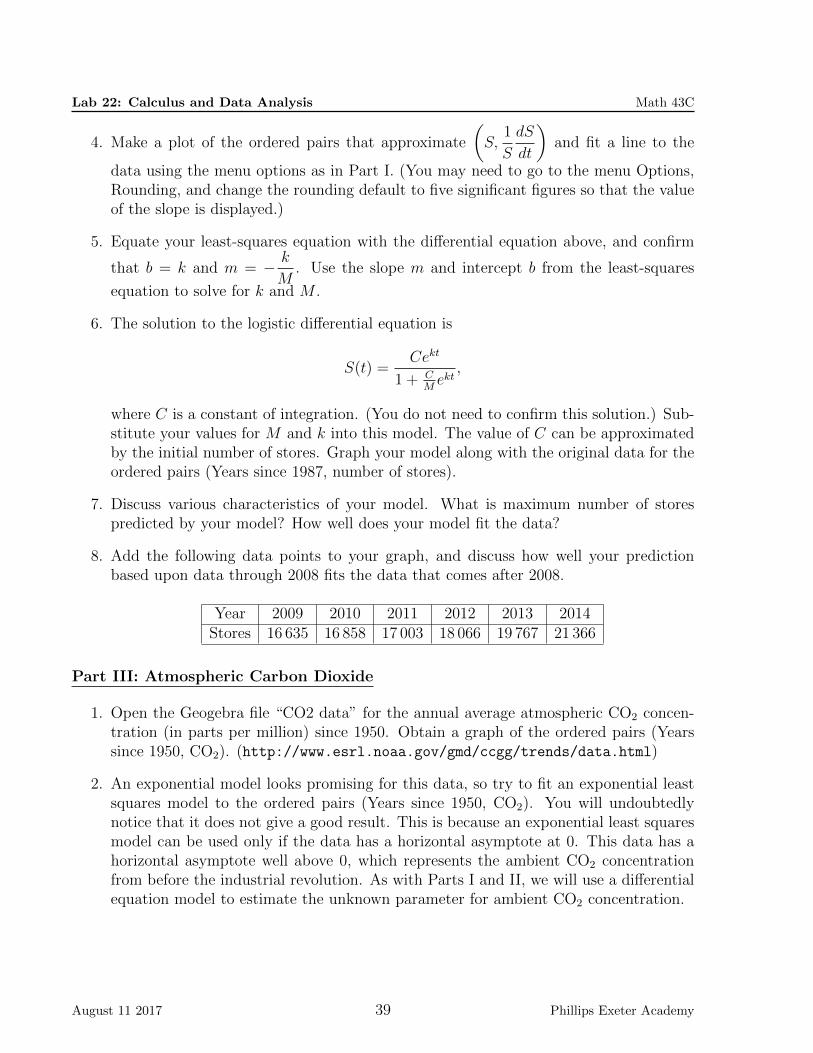
Lab 22: Calculus and Data Analysis Math 43C
4. Make a plot of the ordered pairs that approximate
(S,
1
S
dS
dt
)and fit a line to the
data using the menu options as in Part I. (You may need to go to the menu Options,Rounding, and change the rounding default to five significant figures so that the valueof the slope is displayed.)
5. Equate your least-squares equation with the differential equation above, and confirm
that b = k and m = − k
M. Use the slope m and intercept b from the least-squares
equation to solve for k and M .
6. The solution to the logistic differential equation is
S(t) =Cekt
1 + CMekt,
where C is a constant of integration. (You do not need to confirm this solution.) Sub-stitute your values for M and k into this model. The value of C can be approximatedby the initial number of stores. Graph your model along with the original data for theordered pairs (Years since 1987, number of stores).
7. Discuss various characteristics of your model. What is maximum number of storespredicted by your model? How well does your model fit the data?
8. Add the following data points to your graph, and discuss how well your predictionbased upon data through 2008 fits the data that comes after 2008.
Year 2009 2010 2011 2012 2013 2014Stores 16 635 16 858 17 003 18 066 19 767 21 366
Part III: Atmospheric Carbon Dioxide
1. Open the Geogebra file “CO2 data” for the annual average atmospheric CO2 concen-tration (in parts per million) since 1950. Obtain a graph of the ordered pairs (Yearssince 1950, CO2). (http://www.esrl.noaa.gov/gmd/ccgg/trends/data.html)
2. An exponential model looks promising for this data, so try to fit an exponential leastsquares model to the ordered pairs (Years since 1950, CO2). You will undoubtedlynotice that it does not give a good result. This is because an exponential least squaresmodel can be used only if the data has a horizontal asymptote at 0. This data has ahorizontal asymptote well above 0, which represents the ambient CO2 concentrationfrom before the industrial revolution. As with Parts I and II, we will use a differentialequation model to estimate the unknown parameter for ambient CO2 concentration.
August 11 2017 39 Phillips Exeter Academy

Lab 22: Calculus and Data Analysis Math 43C
3. Explain why the following differential equation is a reasonable model for exponentialgrowth above an ambient level A, where k is a growth constant and C is the atmosphericCO2 concentration at time t:
dC
dt= k(C − A).
4. This differential equation is linear with respect to C, so using the techniques learned
in this lab, find the least squares line that fits the ordered pairs
(C,dC
dt
).
5. Use the slope and intercept from the least squares line to estimate values for k and A.
6. Confirm that the solution to the differential equation is C(t) = A + Bekt, where B isa constant of integration, and t is years since 1950.
7. Substitute values for k and A into your model, and use C(0) to estimate a value for B.Graph your model together with the CO2 data.
8. Discuss and critique your model. What does your model suggest about future levels ofatmospheric CO2? Is it reasonable to extrapolate in this way?
Summary
Discuss the techniques introduced in this lab, especially what the three parts have in common.What problems are you able to solve with data analysis and calculus that you were unableto solve prior to this lab?
August 11 2017 40 Phillips Exeter Academy
Problem Set 23 Math 43C
1. The area function A(x) =∫ x
11tdt defines a well-known function. What is it? What
value of x gives an area of 1, which is to say A(x) = 1? For what x is A(x) = −1?
2. (Continuation) Explain graphically and algebraically why the following equation istrue:
A(b)− A(a) =
∫ b
a
1
tdt
3. (Continuation) Explain why A(km)−A(m) = ln k for any nonzero values of k and m.
4. The temperature for a typical May 15th in Exeter can be modeled by the function
T (t) = −12.1 cos( π
12t)
+ 55.5,
where t is the hours after sunrise, and 0 ≤ t ≤ 15. How do we find the averagetemperature during the nearly 15 hours of sunlight on this day?
(a) Suppose we use the temperature at the beginning of each hour to calculate theaverage. Find the value of
1
15
14∑i=0
T (ti),
where t0 = 0, t1 = 1, ..., t14 = 14.
(b) You can obtain a more accurate average by using the temperatures at half-hourintervals. Calculate the value of
1
30
29∑i=0
T (ti),
where ti = 0.5i. (What would this summation look like if we used the temperatureat the end of each half hour interval?)
(c) Confirm that the average temperature using n equally spaced times starting att0 = 0 is given by
1
n
n−1∑i=0
T (ti).
(d) The time interval used in the averaging process is ∆t =15
n. Confirm that intro-
ducing ∆t into the previous summation leads to the expression
1
15
n−1∑i=0
T (ti)∆t.
(e) The previous summation has the familiar form of a Riemann sum and an areausing left-hand endpoint rectangles. As we let n increase without bound, thesummation approaches an integral. Write out the definite integral represented by
limn→∞
1
15
n−1∑i=0
T (ti)∆t.
August 11 2017 41 Phillips Exeter Academy

Problem Set 23 Math 43C
(f) Calculate the value of this integral.
5. (Continuation) Average value. Explain why the average value of a function over aninterval a ≤ x ≤ b can be defined by the limit of a Riemann sum
limn→∞
1
b− a
n−1∑i=0
f(xi)∆x,
which equals the expression1
b− a
∫ b
a
f(x) dx.
6. The driver of a red sports car, which is rolling along at 110 feet per second, suddenlysteps on the brake, producing a steady deceleration of 25 feet per second per second.How many feet does the red sports car travel while coming to a stop?
7. To evaluate
∫ π/2
0
esinx cosx dx, Steph tried integration by parts. Was this a good idea?
8. Find the average value of sinx over one arch of the curve (from x = 0 to x = π).Compare your answer to the average of the maximum and minimum values on thisinterval.
9. The standard method for approximating an integral∫ baf(x) dx is to use a Riemann
sum. Assuming that f(x) is defined for all x in the interval [a, b], let a = x0 < x1 <x2 < · · · < xn = b be a partition of the interval [a, b]. For each subinterval [xi−1, xi],with i = 1, 2, . . . , n, choose an x∗i in that subinterval such that xi−1 ≤ x∗i ≤ xi, anddenote ∆xi = xi − xi−1. The sum
∑ni=1 f(x∗i )∆xi is called a Riemann sum of f(x) on
[a, b] with respect to the partition a = x0 < x1 < x2 < · · · < xn = b. There are differentschemes for choosing the evaluation points x∗i , and the corresponding sums are namedaccordingly. What are the schemes that correspond to left-hand sum, right-hand sum,lower sum, upper sum, and midpoint sum?
10. The trapezoidal sum is the arithmetic mean of the left and right-hand sums. Explainthe name, and show that it fits the definition of a Riemann sum when f is continuous
11. The Mean-Value Theorem for Integrals says: If f is a function that is continuous fora ≤ x ≤ b, then there is a number c between a and b for which f(c)·(b−a) =
∫ baf(x) dx.
Interpret this statement graphically, and relate it to the average value of f(x) on theinterval [a, b].
12. (Continuation) Use the First Fundamental Theorem of Calculus to show how the Mean-Value Theorem for Integrals is related to the Mean-Value Theorem for Derivatives.
13. Apply the trapezoidal method with ∆x = 0.5 to approximate∫ 3
11xdx. Your answer
will be slightly larger than ln 3. How could this have been anticipated?
August 11 2017 42 Phillips Exeter Academy

Problem Set 23 Math 43C
14. For what type of velocity function will the average value of velocity, which can be writ-
ten as1
b− a
∫ b
a
v(t) dt, equal the average of the initial and final velocities 12
(v(a) + v(b))?
In other words, under what conditions will the following equation be true?
1
b− a
∫ b
a
v(t) dt =1
2(v(a) + v(b))
15. Show that the expected value of the standard normal distribution is the center of thedistribution. In other words, confirm the following equation:∫ ∞
−∞x · 1√
2πe−x
2/2 dx = 0.
16. What is the average value of an odd function over the interval from x = −a to x = a?
17. Explain and show with a diagram the differences between the average value of a functionand the expected value of a probability distribution.
18. A model for the pH level of the saliva in the mouth t minutes after eating a piece ofcandy is given by
f(t) = 6.5− 20t
t2 + 36.
What is the average pH in the mouth during the first 10 minutes after eating a pieceof candy? During the first hour?
19. Predator/Prey Model. In a population model for lynx and hares, the lynx (predator)feeds on the hare (prey). The changes in the size of each population depend on bothpopulations because of the predator/prey interaction. The differential equation for thehare population is
dh
dt= 0.05h− 0.001hl,
and the differential equation for the lynx population is
dl
dt= −0.03l + 0.0002hl
.
(a) Write the Euler’s method equations that approximate the values of the two pop-ulations, hn and ln, in terms of hn−1, ln−1, and the stepsize ∆t. You do not needto compute any values.
(b) Explain the effect of each term in the two differential equations. In particular,consider which terms give the natural growth/decline rates in the absence of theother species and which terms are due to interaction between the species.
(c) Make a conjecture about how you think the growth and decline of one populationdepends on the other population.
August 11 2017 43 Phillips Exeter Academy
Lab 23: Predator/Prey Model Math 43C
In a population model in which a predator feeds on a prey as the primary food source,changes in the size of each population depend jointly on the number of individuals in eachspecies. A system of differential equations for lynx (predator) and hares (prey) is:
dh
dt= a · h− b · h · l
dl
dt= −c · l + d · h · l
where l represents the number of lynx, h represents the number of hares, and a, b, c, and dare constants. Solving this system symbolically is beyond this course, but we can generateapproximate values for each population by using Euler’s method.
1. Write the recursive equations that use Euler’s method to approximate the values ofthe two populations, hn and ln, in terms of hn−1, ln−1, the constants a, b, c, and d, andthe stepsize ∆t.
2. Let the initial size of the hare population be 200 and the initial lynx populationbe 50. Use the following values for the four constants: a = 0.05, b = 0.001, c = 0.03,d = 0.0002. Examine numerically and graphically the populations versus time for 200months with a stepsize of 1 month. Since the equations both involve values of hn−1
and ln−1, you will need to generate the values of the two populations in sync, bothpopulations one step at a time.
3. Discuss the relative shapes of the two graphs for lynx and hares. (It is helpful tograph both populations on the same set of axes.) Are the graphs periodic? Are theysinusoidal? What is the relationship between the peaks and valleys of the two graphs?What seem to be the values about which each population oscillates?
4. Examine the effect of small changes in the parameter values. For example, change aby a small amount and see what happens to the populations. How does the value ofeach parameter affect the graphs? What happens if you change the starting value of apopulation?
5. The rate of change dldh
of the lynx with respect to the hares can be modeled by theratio of dl
dtto dh
dt, so that
dl
dh=
dldtdhdt
.
Using the values of the parameters from number 2, obtain a graph of the slope fieldfor dl
dh. What does the slope field tell you about the relationship between l and h?
Draw a particular solution curve in the slope field using the initial values of l0 = 50and h0 = 200.
6. Each of the differential equations in this system can be factored to find ordered pairs(l, h) that make the differential equations equal to 0. One such ordered pair is (0, 0).What is another ordered pair with this property? These points are called stable points
August 11 2017 44 Phillips Exeter Academy

Lab 23: Predator/Prey Model Math 43C
since the populations will remain constant if set to those values. How does this stablepoint that is not (0, 0) relate to the graphs of the lynx and hares versus time, and alsothe slope field and solution curve for lynx verse hares?
7. Assemble your work into a report that highlights with graphs and explanations the keyconcepts of this lab. Be sure to include how the techniques of calculus were used toinvestigate the predator/prey model.
August 11 2017 45 Phillips Exeter Academy
Chemistry Labs
Mathematics DepartmentPhillips Exeter Academy
Exeter, NHAugust 11 2017

Lab Module #1: Calculus Applied to Chemistry (Differentiation Focus)
Goal: The goal of this activity is to practice applying your differentiation skills to datacollected in the chemistry lab (most specifically to determine an equivalency point). Itis assumed that you have no prior knowledge of chemistry and you are not responsible forany of the chemistry content beyond being prepared for class. The idea is that you will havea better sense of differentiation by applying your skills to data you physically collect?datayou watch changing in real time.
Background: For the purposes of this lab, an acid can be thought of as a chemical substancethat increases the concentration of H+ in solution. In our lab we will add sodium hydroxide(NaOH: a strong base) to vinegar (HC2H3O2: a common weak acid). The OH– from thebase will combine with the H+ from the acid to form water:
HC2H3O2 (aq) +NaOH (aq) → H2O (l) +NaC2H3O2 (aq)
The above reaction is known as a neutralization (water is neutral) and the physical act ofslowly adding the base to the acid is an example of a titration.
As you are adding your base to the acid you will measure the pH of the solution. Thefunction “p” is defined such that p(x) = −log(x). In our specific case pH = −log[H+]. Aless acidic solution has less H+ and a more acidic solution has more H+. A glass of winemight have a small bit of H+ such that [H+] = 10−4 and pH = 4. Lemon juice (more acidic)might have enough H+ such that [H+] = 10−2 and pH = 2. Acids have pH values less than7 and bases pH values greater than 7.
As you add the base (NaOH) to the acid (HC2H3O2) the solution becomes less and less acidic.When the number of OH– ions added exactly matches the number of HC2H3O2 moleculesoriginally in the solution you have reached the equivalency point. This is an important pointfrom a chemist’s perspective and you should take a chemistry class if you wish to knowmore. The equivalency point will correspond to a maximum in the first derivative curve ofpH versus volume — it is worth thinking about why this is the case both during and afterthe lab activity (it is a little early to worry about at this point).
Pre-Lab Questions:
1. As you add more and more base to your acid, will the pH increase or decrease? Explain.
2. A student measures the pH of human gastric acid (stomach acid) to be 2.5. What isthe H+ concentration, [H+], in the gastric acid?
3. Human blood typically maintains an H+ concentration of [4.0 × 10⁻⁸]. What is thepH of human blood? Is human blood acidic or basic?
4. May require research: What is numerical differentiation and more specifically what isNewton’s difference quotient? Can Newton’s difference quotient be used to approxi-mate a second derivative? Explain.
August 11 2017 1 Phillips Exeter Academy
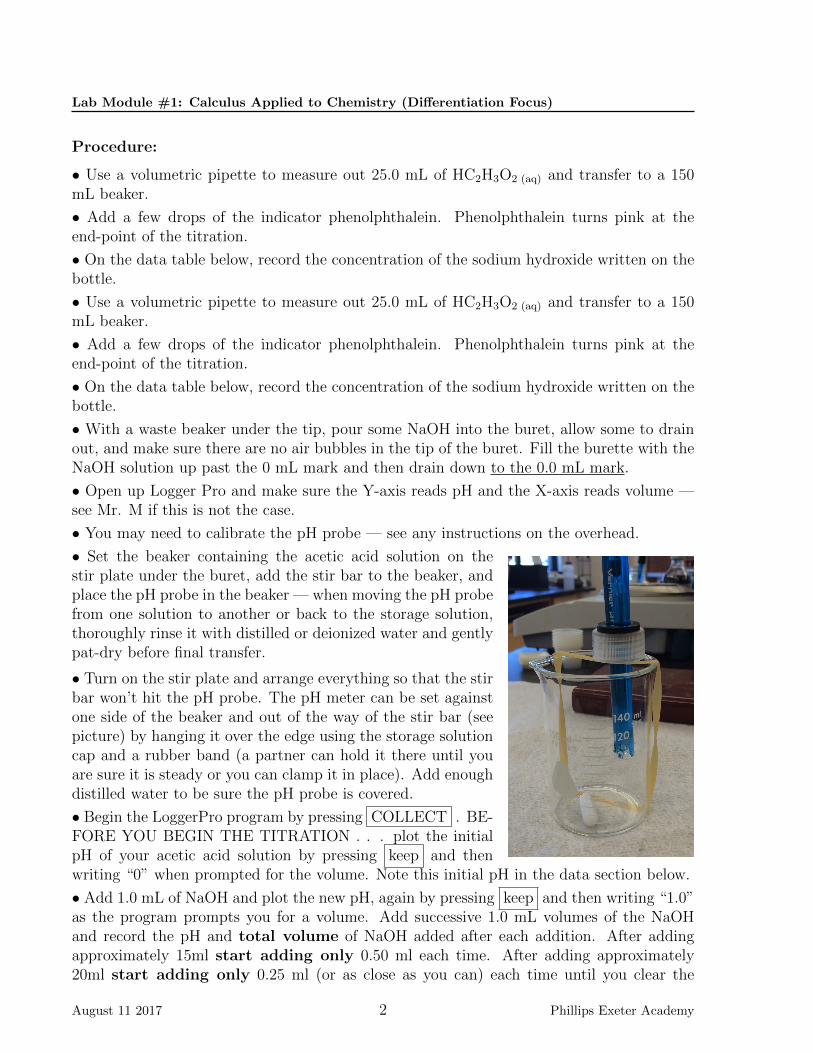
Lab Module #1: Calculus Applied to Chemistry (Differentiation Focus)
Procedure:
• Use a volumetric pipette to measure out 25.0 mL of HC2H3O2 (aq) and transfer to a 150mL beaker.
• Add a few drops of the indicator phenolphthalein. Phenolphthalein turns pink at theend-point of the titration.
• On the data table below, record the concentration of the sodium hydroxide written on thebottle.
• With a waste beaker under the tip, pour some NaOH into the buret, allow some to drainout, and make sure there are no air bubbles in the tip of the buret. Fill the burette with theNaOH solution up past the 0 mL mark and then drain down to the 0.0 mL mark.
• Open up Logger Pro and make sure the Y-axis reads pH and the X-axis reads volume —see Mr. M if this is not the case.
• You may need to calibrate the pH probe — see any instructions on the overhead.
• Set the beaker containing the acetic acid solution on thestir plate under the buret, add the stir bar to the beaker, andplace the pH probe in the beaker — when moving the pH probefrom one solution to another or back to the storage solution,thoroughly rinse it with distilled or deionized water and gentlypat-dry before final transfer.
• Turn on the stir plate and arrange everything so that the stirbar won’t hit the pH probe. The pH meter can be set againstone side of the beaker and out of the way of the stir bar (seepicture) by hanging it over the edge using the storage solutioncap and a rubber band (a partner can hold it there until youare sure it is steady or you can clamp it in place). Add enoughdistilled water to be sure the pH probe is covered.
• Begin the LoggerPro program by pressing COLLECT . BE-FORE YOU BEGIN THE TITRATION . . . plot the initialpH of your acetic acid solution by pressing keep and thenwriting “0” when prompted for the volume. Note this initial pH in the data section below.
• Add 1.0 mL of NaOH and plot the new pH, again by pressing keep and then writing “1.0”as the program prompts you for a volume. Add successive 1.0 mL volumes of the NaOHand record the pH and total volume of NaOH added after each addition. After addingapproximately 15ml start adding only 0.50 ml each time. After adding approximately20ml start adding only 0.25 ml (or as close as you can) each time until you clear the
August 11 2017 2 Phillips Exeter Academy

Lab Module #1: Calculus Applied to Chemistry (Differentiation Focus)
equivalency point. Keep adding; you can return to 1.0 ml volumes when you have reached ahigh pH that has clearly leveled out (is not significantly changing).
• After you have added a lot of base (past equivalency), add the NaOH in one more 5.0 mL
volume, keep that data point and hit STOP at a total volume of at least 25 mL NaOH added.
• When the titration is complete, hit STOP and then save your data.
• Now export your data: In logger pro select file, export data, CSV format. Save this fileon a flash drive or on the cloud or email it to yourself — you need to be able to open it inan Excel spreadsheet on your own computer.
• See Mr. M before you print the graph (he will move the x axis up to create a “negative”region). Use file, “print graph” not print. Print four copies of your pH plot (2 per partner).
Data:
• Concentration of standardized NaOH used in the titration. [NaOH] =
• The pH of the acetic acid solution before the titration began. pHHC2H3O2 =
Analysis of the Data: (Complete the following in Excel)
• Using Newton’s difference quotient and your original data, create a new data table repre-senting a numerical approximation of the first derivative. Generate a plot of this data.
• Using Newton’s difference quotient create another new data table representing a numericalapproximation of the second derivative. Generate a plot of this data.
• Print a spreadsheet showing the original data, the first derivative data, and the secondderivative data.
Questions and Analysis: (Complete the data analysis above in Excel before proceeding)
(1) What volume of added NaOH corresponds to the “equivalency point” in this titration?Explain your reasoning and all the evidence that points to this conclusion. Use calculusvocabulary whenever possible.
(2) On one of the original titration plots printed in class, graphically show a representationof Newton’s difference quotient for any two consecutive points around x (volume NaOHadded) = 10ml (or anywhere there is a nice curve). Explain how this differs from the “true”derivative? How could it be improved upon?
(3) On the other copy of the original titration plot printed in class, sketch a plot of anidealized first derivative. In a different color, sketch the plot of an idealized second derivative.Colored pencils are probably best to keep everything legible as you draw one sketch atopanother.
(4) Referencing a rate, what does the maximum in the first derivative curve physicallyrepresent? (Be sure you are referencing a rate).
(5) Explain any points of interest in the second derivative curve.
(6) Titrations are usually only examined using numerical methods. Why do you think thisis the case? Explain. Feel free to research.
August 11 2017 3 Phillips Exeter Academy

Lab Module #1: Calculus Applied to Chemistry (Differentiation Focus)
What to turn in: (Do not type anything!)(1) The answers to the pre-lab questions.(2) The two titration plots you printed in class, with the appropriate markings asrequired in the “Questions and Analysis” section above.(3) A printed spreadsheet showing the original data, the first derivative data, andthe second derivative data.(4) The answers to the each numbered item in the “Questions and Analysis” sectionabove.
Extra Credit: The early part of our titration curve can be modeled using:
pH = pKa + log
(x
original moles acid× 0.025L− x
)Where x is the number of moles of OH− added (not ml). Using the second derivative ofthe above function find an inflection point in the early part of the curve. Convert this molenumber to volume (ml) using the molarity of base solution. What do you notice about thisvalue?
August 11 2017 4 Phillips Exeter Academy

Lab Module #2: Calculus Applied to Physical Chemistry (Integration Focus)
Goal: The goal of this activity is to determine the amount of work done to compressan ideal gas in 1-step, 3-steps, 5-steps, and an infinite number of steps (a hypothetical). Itis assumed that you have limited knowledge of thermodynamics (a field that branches acrosschemistry and physics) and you are not responsible for any of the chemistry or physicscontent beyond being prepared for class. The idea is to have a better sense of integration byapplying your knowledge to data you physically collect in real time.
Background: Geometry is often useful in explaining and visualizing arithmetic. The prod-uct of two multiplied numbers, for example, can be easily visualized as the area of a rectangle.The diagrams to the right can be thought of in similar ways (3 · 4 = 12).
Let’s consider another example that involves the calcula-tion of work. The work associated with a constant force(F) applied in a straight line that changes an object?sposition (x) follows a simple equation: w = F · ∆x. Tothe right we see 3 Newtons of force constantly appliedto move an object from x = 0 meters to x = 4 meters.The work done, as shown to the right, equals 12 Newton-meters.
4
3
4
4m
3
3N
4m
12 N•m
4m
3N
3N
In the lab you will be looking at the work associated withthe compression of a gas. Assuming a constant pressure isapplied, the work done to compress the gas is the productof the pressure applied (closely related to force) and thechange in volume (closely related to a change in position):w = −Pex · ∆V . (See footnote.1) The area diagramedin the plot below represents the work associated with a two-step compression. Carefullystudy the plot (there is a lot more going on here than just areas, and this diagram is thekey to the entire lab) and think about how much work, in total, was required to compressthe gas (also pay close attention to all the notes).
Pressure
Volume
2nd compression
You immediately (sharp vertical line) apply a constant external pressure, though it is not measured until the end of the compression step—when the inside pressure reaches equilibrium with the outside (applied pressure); this is a useful idealization.
Final: This point represents the final condition of the gas after two separate compression steps. The gas ends at a higher pressure and a smaller volume. You read this plot as starting on the far right and ending here on the left.
1st
Initial: This point represents the initial condition of the gas before you apply an external pressure and compress, reducing the volume.
1The negative sign − in w = −Pex ·∆V helps account for the negative change in volume (Vf − Vi) whenyou compress a gas. Therefore the work will remain positive; you do work to compress a gas.
August 11 2017 1 Phillips Exeter Academy

Lab Module #2: Calculus Applied to Physical Chemistry (Integration Focus)
It will be important to consider the pressure you applyto the gas with each step as an approximately constantvalue (though it may not feel this way as you push down).Ideally you would simply place a particular weight onthe compression cylinder for each step. A ten-poundweight would compress the gas a certain volume and anadditional ten pounds would further compress the gas.Visualizing adding weights helps understand the idealization where the higher pressureis reached immediately and then remains constant throughout each step in yourplots of pressure vs. volume. This is an idealization and exaggerates the simplifications inw = −Pex ·∆V as applied to a real process.
Pre-Lab Questions (may well require research):
1. The work associated with a constant force (F) applied in a straight line that changesan object’s position (x) along the direction of the force follows a simple equation:w = F · ∆x. If Pressure equals Force per unit Area (F/A), show that to compress agas w = −Pex ·∆V , where ∆V is a change in volume.
2. What is the ideal gas law? Label each variable and provide units.
3. Is air, the substance you will compress in the lab tomorrow, an ideal gas? Explain.
4. What is an integral? What is the difference between a definite and an indefiniteintegral?
5. Within the context of thermodynamics, what is a reversible process? How might theconcept of a thermodynamically reversible process relate to calculus? See examplebelow.
August 11 2017 2 Phillips Exeter Academy
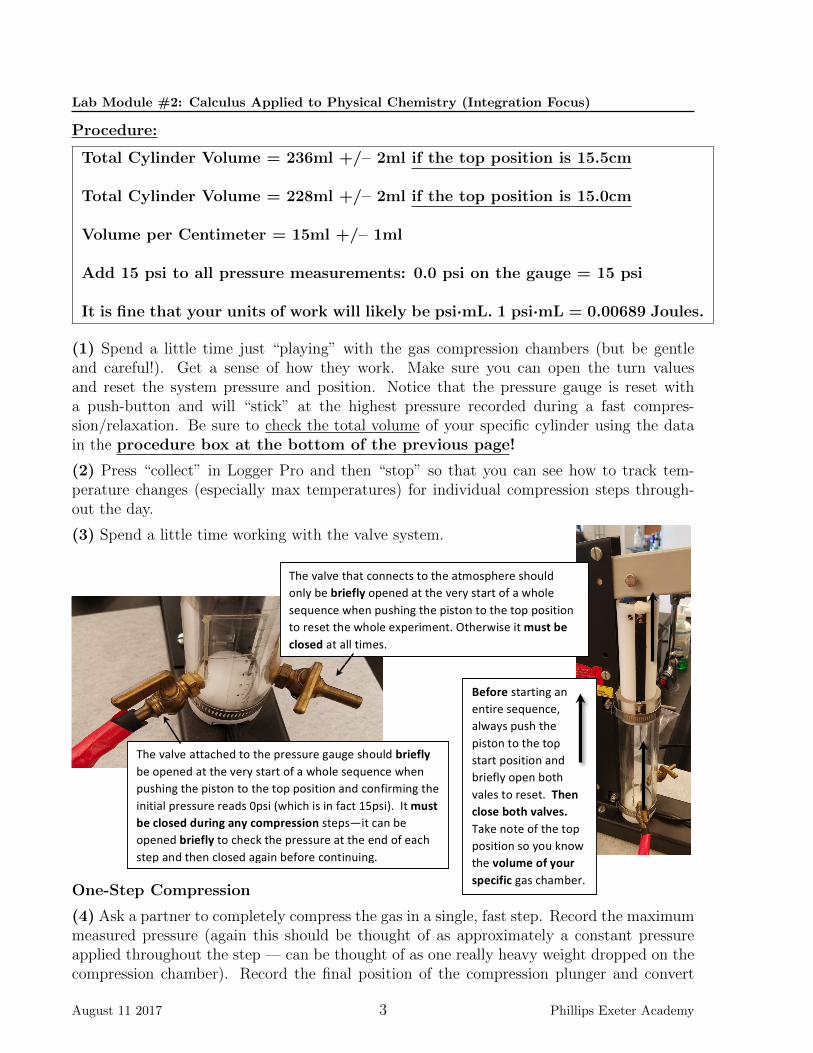
Lab Module #2: Calculus Applied to Physical Chemistry (Integration Focus)
Procedure:
Total Cylinder Volume = 236ml +/– 2ml if the top position is 15.5cm
Total Cylinder Volume = 228ml +/– 2ml if the top position is 15.0cm
Volume per Centimeter = 15ml +/– 1ml
Add 15 psi to all pressure measurements: 0.0 psi on the gauge = 15 psi
It is fine that your units of work will likely be psi·mL. 1 psi·mL = 0.00689 Joules.
(1) Spend a little time just “playing” with the gas compression chambers (but be gentleand careful!). Get a sense of how they work. Make sure you can open the turn valuesand reset the system pressure and position. Notice that the pressure gauge is reset witha push-button and will “stick” at the highest pressure recorded during a fast compres-sion/relaxation. Be sure to check the total volume of your specific cylinder using the datain the procedure box at the bottom of the previous page!
(2) Press “collect” in Logger Pro and then “stop” so that you can see how to track tem-perature changes (especially max temperatures) for individual compression steps through-out the day.
(3) Spend a little time working with the valve system.
The valve attached to the pressure gauge should briefly be opened at the very start of a whole sequence when pushing the piston to the top position and confirming the initial pressure reads 0psi (which is in fact 15psi). It must be closed during any compression steps—it can be opened briefly to check the pressure at the end of each step and then closed again before continuing.
The valve that connects to the atmosphere should only be briefly opened at the very start of a whole sequence when pushing the piston to the top position to reset the whole experiment. Otherwise it must be closed at all times.
Before starting an entire sequence, always push the piston to the top start position and briefly open both vales to reset. Then close both valves. Take note of the top position so you know the volume of your specific gas chamber.
One-Step Compression
(4) Ask a partner to completely compress the gas in a single, fast step. Record the maximummeasured pressure (again this should be thought of as approximately a constant pressureapplied throughout the step — can be thought of as one really heavy weight dropped on thecompression chamber). Record the final position of the compression plunger and convert
August 11 2017 3 Phillips Exeter Academy

Lab Module #2: Calculus Applied to Physical Chemistry (Integration Focus)
this to a final volume. Record the maximum temperature reached during the compression.
(5) On your graph paper draw a diagram analogous to the one in the background information,but for a 1-step compression. Make it large, and especially broad, so that you can later draw3- and 5-step diagrams with similar scales. The x and y axis do not need to start at (0, 0);and only the area of interest needs to be to scale.
(6) Calculate the area under your plot. What does this value represent?
(7) Integrate the function dw = −Pex ·∆V where Pex is a constant (numerically equal to themaximum pressure you recorded after adding 15psi to the gauge reading). Then show howthe result is evaluated over the volume range you recorded showing all the steps used in thethe standard notation applied to definite integrals. In what way is applying the originalfunction, dw = −Pex · ∆V , to these procedural steps an awkward use of the differentialnotation “d” (as in dw and dV)? Why can we get away with it?
Three-Step Compression (read all of 8-10 before proceeding)
(8) Ask a partner to completely compress the gas in three separate steps, stopping aftereach step and holding the plunger steady. These do not have to be exactly equal steps,just do your best.
(9) Record the maximum measured pressure after the first step. Record the position of thecompression plunger after the first step. Repeat these recordings for each subsequent step,so that you end with three sets of pressure and position data, and maximum temperatures.
(10) Convert all your position data to final volumes.
(11) Now draw a diagram on your graph paper describing the 3-step compression. Makesure the scale matches that of the 1-step diagram you drew earlier. You can always adjustand redraw these as needed.
(12) Calculate the work required to compress the gas in 3 steps.
Five-Step Compression
(13) Repeat steps 7-11, but for a 5-step compression.
Finishing Up
(14) Make sure you have finished all your graph paper plots and answered any questionsincluded in the procedure below each plot before you leave class today.
Lab Questions (again, may require research):
(1) Draw a diagram representing a compression via an infinite number of steps. Roughlysketch this diagram, it does not need to be perfect. Just imagine how the plot will changeas the number of steps increases a whole lot! Try to do this on your own before “finding”the answer.
(2) What is an isothermal process? Think about the temperature readings during thevarious compressions. Which type of compression 1-step, 3-step, or 5-step was the closest toan isothermal process?
August 11 2017 4 Phillips Exeter Academy

Lab Module #2: Calculus Applied to Physical Chemistry (Integration Focus)
(3) If you completed an essentially infinite number of steps and waited a long time aftereach step, you could approximate an isothermal compression. Explain why this makes sense.
(4) One way to think about the diagram drawn in response to question #1 at the top of thepage is to imagine that we apply a new constant pressure an infinite number of times (dropinfinitesimally small weights on the compression chamber again and again). Fortunately, wecan also imagine that the pressure changes according to the ideal gas law; Pexternal = Pinternalif the steps are infinitesimally small. Rewrite w = −Pex ·∆V in terms of differential notation“d” (as in dw and dV). Now, using the ideal gas law, rewrite the equation such thatP is in terms of only volume and nRT (each of these latter values can be thought of asessentially constant).
(5) Determine the antiderivative of the final function derived in #5 above. Remember thatnRT can all be thought of as constant under the slow, infinite step, compression.
(6) Show how the result in #5 above is evaluated over the volume range you used in thelab. The appropriate R value in J/(mole ·K) = 8.314J/(mole ·K). To compare this withyour lab data recall that 1psi · mL = 0.00689 Joules. Room temperature (T = 298K).Show your work using the standard notation applied to definite integrals. n = 0.00965moles of gas if the top position of your cylinder is 15.5cm; n = 0.00932 moles ofgas if the top position of your cylinder is 15.0cm.
(7) Does the “+C” constant of integration serve a purpose in our lab? Explain.
(8) Your calculations indicate that you did a lot more work in the 1-step than in the 5-step, and certainly more than in the hypothetical, infinite step compression. Calculate thedifference in work required to compress the air in 1-step versus an infinite number of steps.Comment on the fact that work is a “path dependent” function.
(9) The fact that energy is conserved and that the final energy of the system (the compressedgas) is the same regardless of whether it was compressed in 1-step or an infinite number ofsteps, leads to an interesting question: Where did all the extra work you did to compressthe gas in 1-step go? Comment on that question.
What to turn in: (Do not type anything!)
(1) The answers to all the pre-lab questions.
(2) All the diagramed plots completed during the lab procedure (or redrawn as needed toclear any errors). These should be on graph paper.
(3) The answers to any questions posed in the procedure. These answers should be writtenout below the respective diagram plots with which they are associated, on the exact samegraph paper pages.
(4) The answers to the final set of lab questions.
August 11 2017 5 Phillips Exeter Academy