mathematical techniques of the tipping point analysis · 1) livina & lenton, grl 2007 2) lenton...
TRANSCRIPT

Mathematical techniques
of the tipping point analysis
Valerie Livina
National Physical Laboratory, UK
Bologna, 18th January 2018

Lenton et al. PNAS, 2008
Tipping elements in the climate system
2V.Livina
Tipping point toolbox
(being developed since 2007)
▪ Anticipating: early warning of climate
tipping points (pre-tipping)
▪ Detecting: potential analysis (tipping)
▪ Forecasting: PDF & potential analysis
(post-tipping)
Valerie Livina 3
Early warning signals
Valerie Livina 4

Early warning signal model
Series is approximated by an
AR(1) process, and
exponential decay of the auto-
correlation function (ACF) is
estimated. Thus ACF-indicator
c is defined; its gradual trend
towards value 1 indicates
critical behaviour.
1 ,
exp( ), is decay rate
( 0 when 1)
n n ny cy
c t
c
Livina & Lenton, GRL 2007
Valerie Livina 5
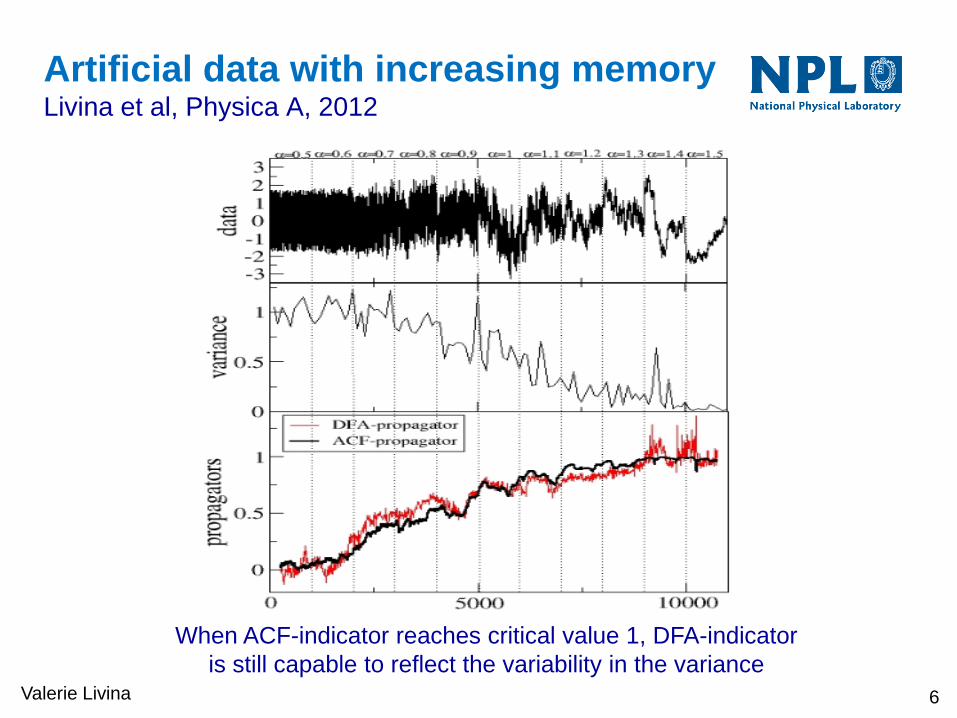
Artificial data with increasing memoryLivina et al, Physica A, 2012
When ACF-indicator reaches critical value 1, DFA-indicator
is still capable to reflect the variability in the varianceValerie Livina 6
Detecting tipping
Valerie Livina 7
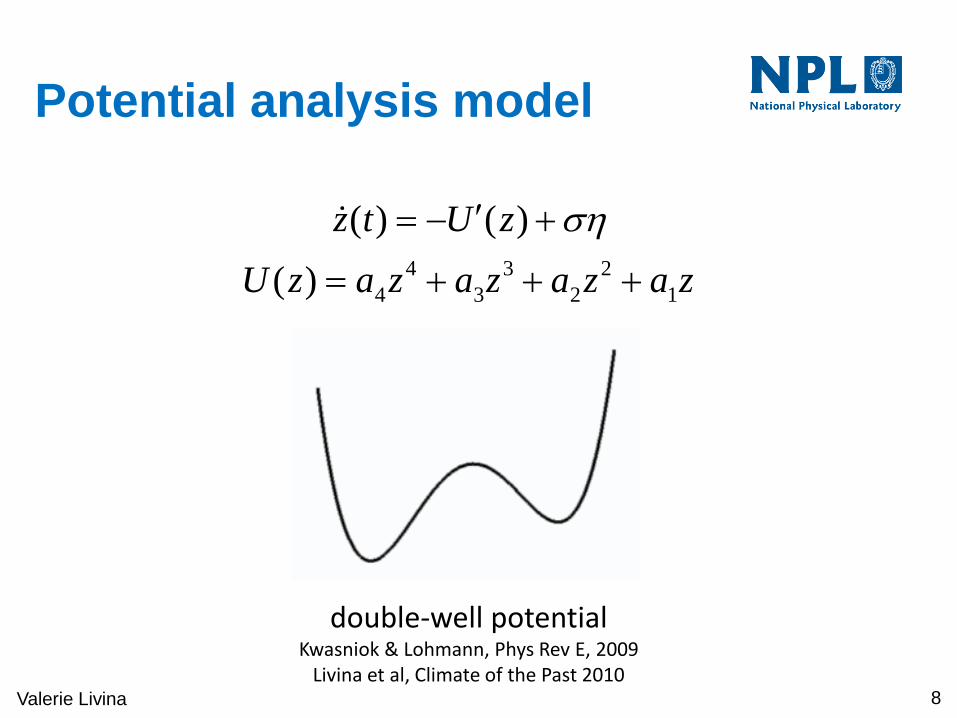
Potential analysis model
double-well potentialKwasniok & Lohmann, Phys Rev E, 2009
Livina et al, Climate of the Past 2010
4 3 2
4 3 2 1
( ) ( )
( )
z t U z
U z a z a z a z a z
Valerie Livina 8
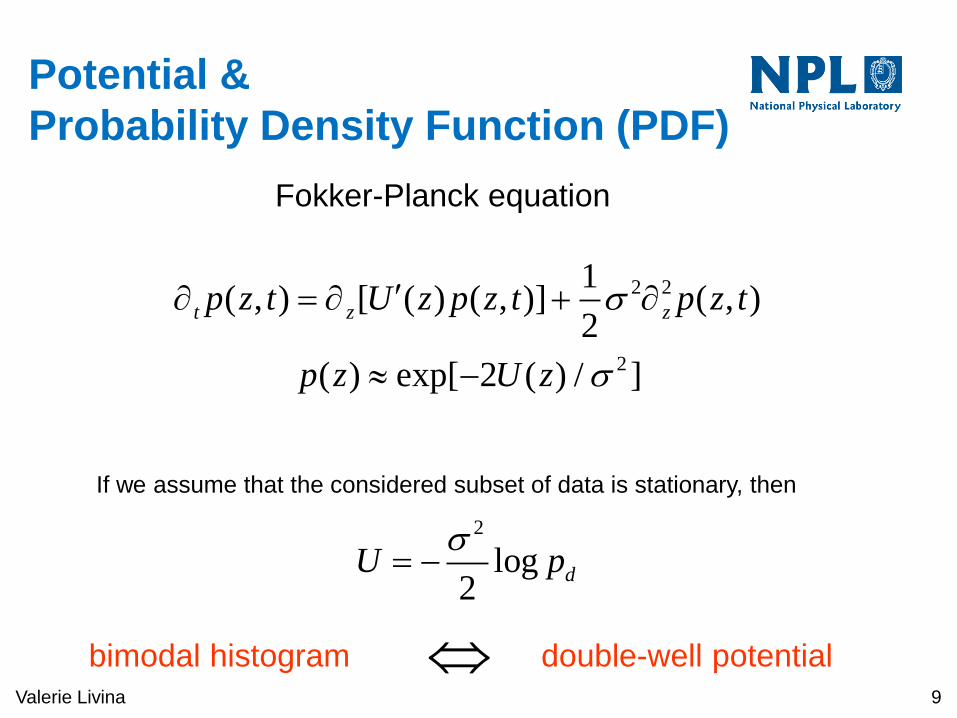
Potential &
Probability Density Function (PDF)
2 2
2
2
1( , ) [ ( ) ( , )] ( , )
2
( ) exp[ 2 ( ) / ]
log2
t z z
d
p z t U z p z t p z t
p z U z
U p
Fokker-Planck equation
If we assume that the considered subset of data is stationary, then
bimodal histogram double-well potentialValerie Livina 9
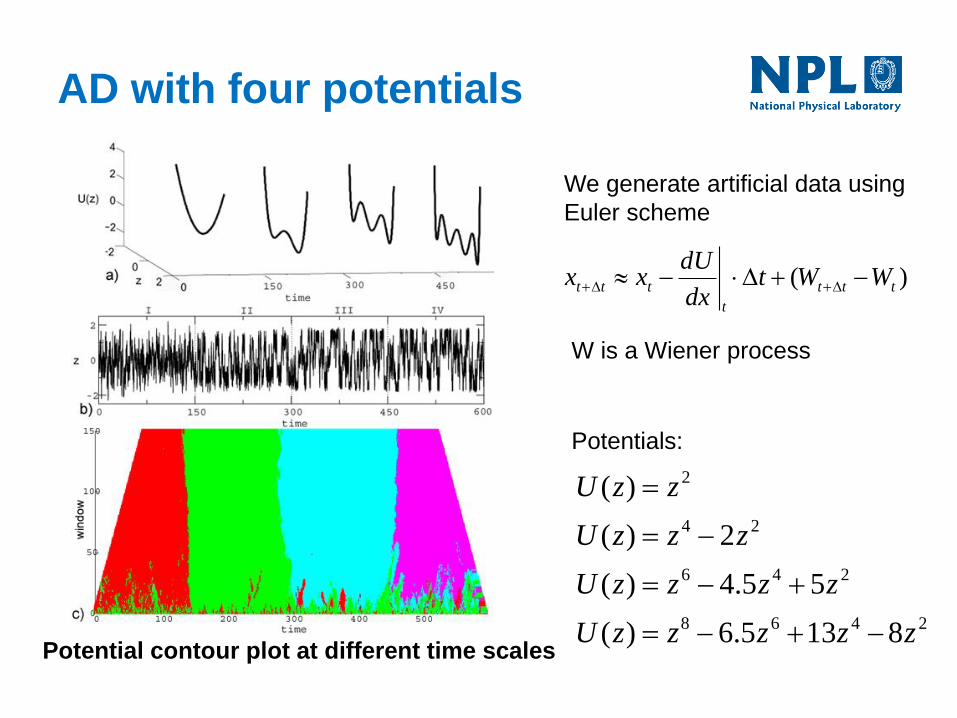
AD with four potentials
Potentials:
We generate artificial data using
Euler scheme
W is a Wiener process
Potential contour plot at different time scales
)( ttt
t
ttt WWtdx
dUxx
2468
246
24
2
8135.6)(
55.4)(
2)(
)(
zzzzzU
zzzzU
zzzU
zzU

GRIP & NGRIP temperature proxiesδ18O data: bifurcation at 25-28 kyr BP
(Livina et al, Climate of the past, 2010)
GICC05 time scale, resolution 20yr Annual resolution
Calcium data: bifurcation at 27-28 kyr BP
GR
IPN
GR
IP
GR
IPG
RIP
Forecasting
Valerie Livina 12

➢Collect coefficients of Chebyshev
approximation of PDF in sliding windows
➢Extrapolate series of the coefficients
➢Reconstruct forecast PDF
➢Simulate time series from the obtained PDF
(rejection sampling)
➢Sort the series according to historic data
(taking into account seasonality)
Potential forecast algorithm
Valerie Livina 13
Livina et al, Physica A 2013
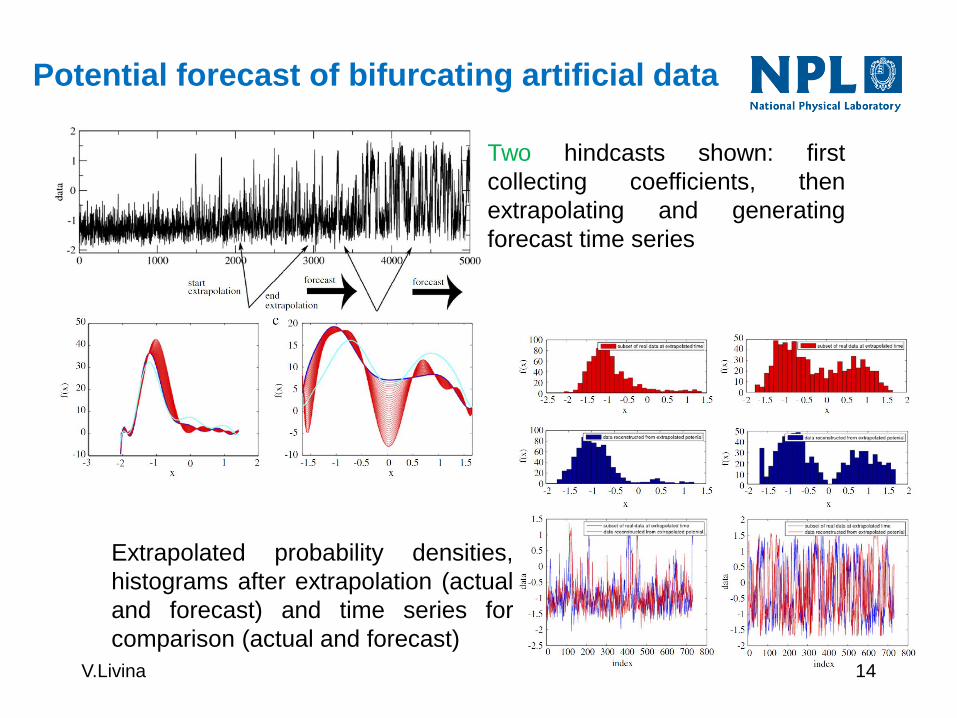
Potential forecast of bifurcating artificial data
Two hindcasts shown: first
collecting coefficients, then
extrapolating and generating
forecast time series
Extrapolated probability densities,
histograms after extrapolation (actual
and forecast) and time series for
comparison (actual and forecast)
14V.Livina
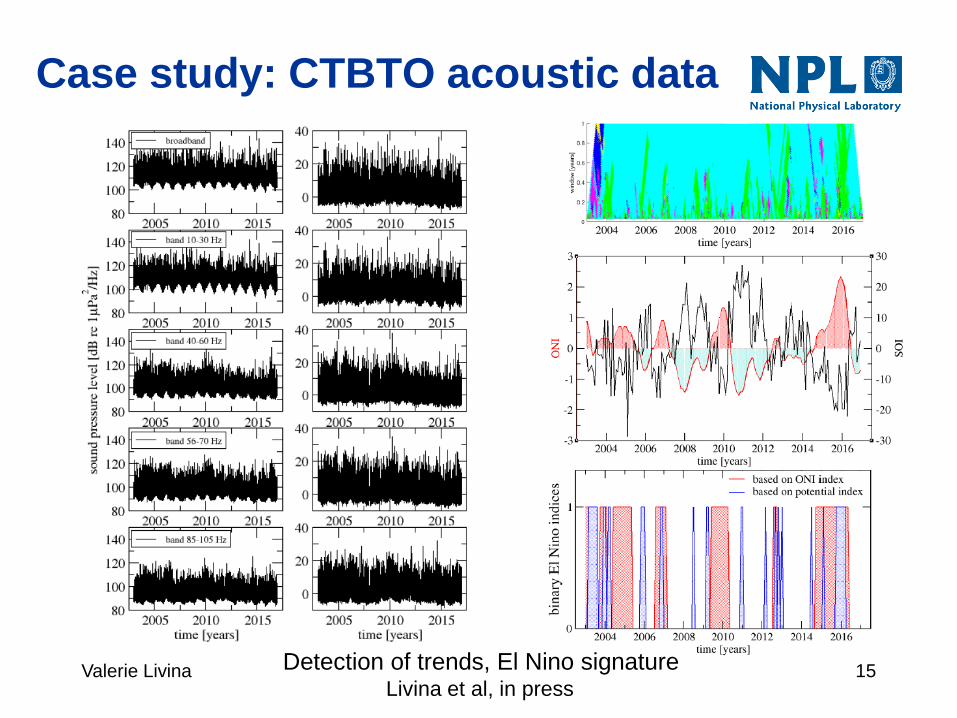
Case study: CTBTO acoustic data
Valerie Livina 15Detection of trends, El Nino signatureLivina et al, in press
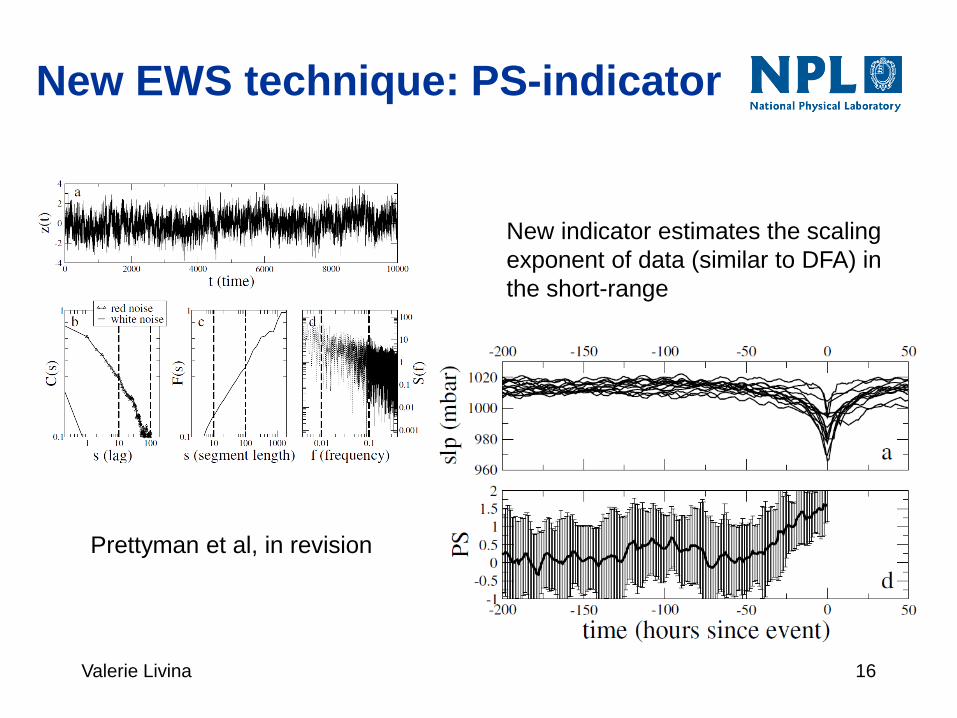
New EWS technique: PS-indicator
Valerie Livina 16
New indicator estimates the scaling
exponent of data (similar to DFA) in
the short-range
Prettyman et al, in revision
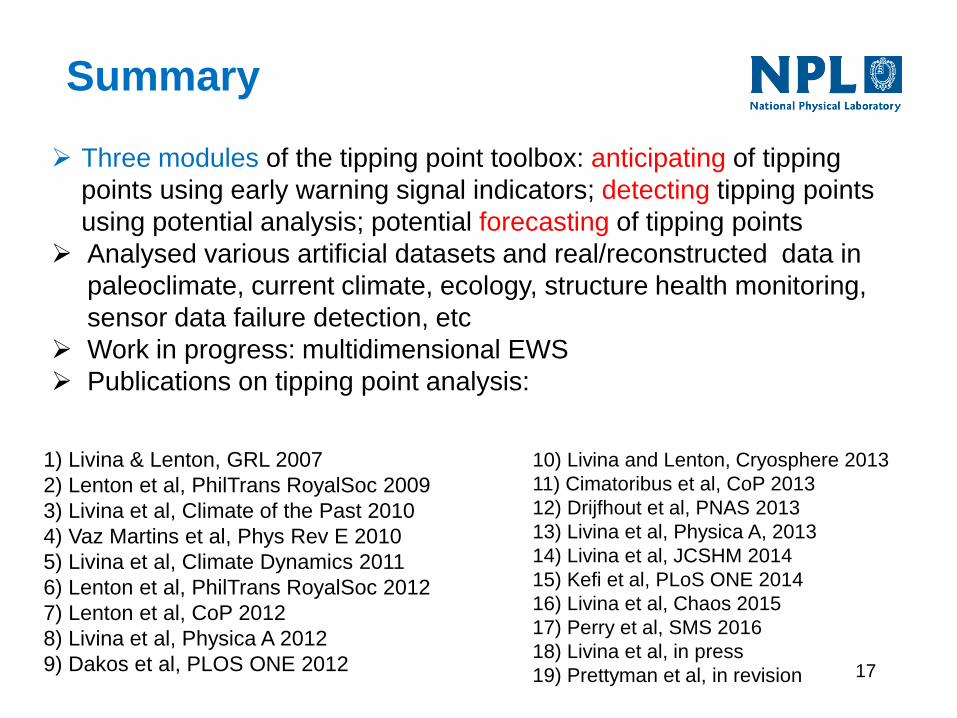
Summary
➢ Three modules of the tipping point toolbox: anticipating of tipping
points using early warning signal indicators; detecting tipping points
using potential analysis; potential forecasting of tipping points
➢ Analysed various artificial datasets and real/reconstructed data in
paleoclimate, current climate, ecology, structure health monitoring,
sensor data failure detection, etc
➢ Work in progress: multidimensional EWS
➢ Publications on tipping point analysis:
1) Livina & Lenton, GRL 2007
2) Lenton et al, PhilTrans RoyalSoc 2009
3) Livina et al, Climate of the Past 2010
4) Vaz Martins et al, Phys Rev E 2010
5) Livina et al, Climate Dynamics 2011
6) Lenton et al, PhilTrans RoyalSoc 2012
7) Lenton et al, CoP 2012
8) Livina et al, Physica A 2012
9) Dakos et al, PLOS ONE 2012
10) Livina and Lenton, Cryosphere 2013
11) Cimatoribus et al, CoP 2013
12) Drijfhout et al, PNAS 2013
13) Livina et al, Physica A, 2013
14) Livina et al, JCSHM 2014
15) Kefi et al, PLoS ONE 2014
16) Livina et al, Chaos 2015
17) Perry et al, SMS 2016
18) Livina et al, in press
19) Prettyman et al, in revision 17

Thank you