mathematical models of purine metabolism...
TRANSCRIPT

Mathematical models of purine metabolism inman
Raul Curto a, Eberhard O. Voit b, Albert Sorribas c,Marta Cascante a,*
a Departament de Bioqu�õmica i Biolog�õa Molecular, Facultat de Qu�õmiques, Universitat de Barcelona,
Ci Marti i Franques, 1, 08028 Barcelona, Catalunya, Spainb Department of Biometry and Epidemiology, Medical University of South Carolina, Charleston,
SC 29425-2503, USAc Departament de Ci�encies M�ediques B�asiques, Facultat de Medecina, Universitat de Lleida,
25198 Lleida, Catalunya, Spain
Received 27 November 1996; received in revised form 2 February 1998
Abstract
Experimental and clinical data on purine metabolism are collated and analyzed with
three mathematical models. The ®rst model is the result of an attempt to construct a tra-
ditional kinetic model based on Michaelis±Menten rate laws. This attempt is only par-
tially successful, since kinetic information, while extensive, is not complete, and since
qualitative information is di�cult to incorporate into this type of model. The data gaps
necessitate the complementation of the Michaelis±Menten model with other functional
forms that can incorporate di�erent types of data. The most convenient and established
representations for this purpose are rate laws formulated as power-law functions, and
these are used to construct a Complemented Michaelis±Menten (CMM) model. The
other two models are pure power-law representations, one in the form of a Generalized
Mass Action (GMA) system, and the other one in the form of an S-system. The ®rst part
of the paper contains a compendium of experimental data necessary for any model of
purine metabolism. This is followed by the formulation of the three models and a com-
parative analysis. For physiological and moderately pathological perturbations in me-
tabolites or enzymes, the results of the three models are very similar and consistent
with clinical ®ndings. This is an encouraging result since the three models have di�erent
structures and data requirements and are based on di�erent mathematical assumptions.
* Corresponding author. Tel.: +34-3 402 1593; fax: +34-3 402 1219; e-mail: [email protected].
0025-5564/98/$19.00 Ó 1998 Elsevier Science Inc. All rights reserved.
PII: S 0 0 2 5 - 5 5 6 4 ( 9 8 ) 1 0 0 0 1 - 9
Mathematical Biosciences 151 (1998) 1±49
Signi®cant enzyme de®ciencies are not so well modeled by the S-system model. The
CMM model captures the dynamics better, but judging by comparisons with clinical ob-
servations, the best model in this case is the GMA model. The model results are discus-
sed in some detail, along with advantages and disadvantages of each modeling
strategy. Ó 1998 Elsevier Science Inc. All rights reserved.
Keywords: Biochemical systems theory; General mass action system; Mathematical
model; Purine metabolism; S-system
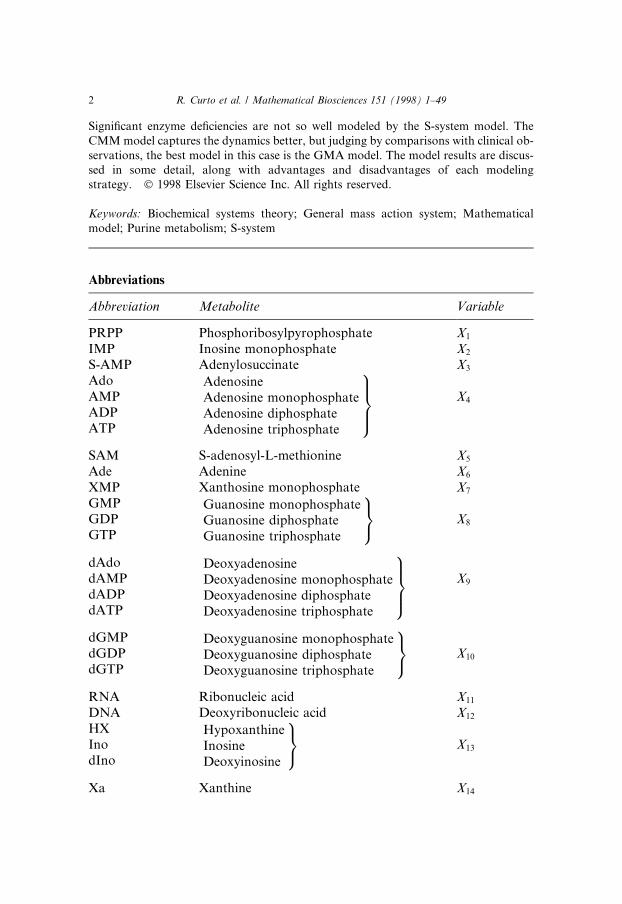
Abbreviations
Abbreviation Metabolite Variable
PRPP Phosphoribosylpyrophosphate X1
IMP Inosine monophosphate X2
S-AMP Adenylosuccinate X3
Ado AdenosineAdenosine monophosphateAdenosine diphosphateAdenosine triphosphate
9>>=>>;AMP X4
ADPATP
SAM S-adenosyl-L-methionine X5
Ade Adenine X6
XMP Xanthosine monophosphate X7
GMP Guanosine monophosphateGuanosine diphosphateGuanosine triphosphate
9=;GDP X8
GTP
dAdo DeoxyadenosineDeoxyadenosine monophosphateDeoxyadenosine diphosphateDeoxyadenosine triphosphate
9>>=>>;dAMP X9
dADPdATP
dGMP Deoxyguanosine monophosphateDeoxyguanosine diphosphateDeoxyguanosine triphosphate
9=;dGDP X10
dGTP
RNA Ribonucleic acid X11
DNA Deoxyribonucleic acid X12
HX HypoxanthineInosineDeoxyinosine
9=;Ino X13
dIno
Xa Xanthine X14
2 R. Curto et al. / Mathematical Biosciences 151 (1998) 1±49

Gua GuanineGuanosineDeoxyguanosine
9=;Guo X15
dGuo
UA Uric acid X16
R5P Ribose-5-phosphate X17
Pi Phosphate X18
Abbreviation Full name
GMA Generalized Mass ActionBST Biochemical Systems TheoryMCT Metabolic Control TheoryCMM Complemented Michaelis±MentenBW Body weight
Abbreviated¯ux
Abbreviatedenzyme
Enzyme catalyzed reaction E.C.
vprpps PRPPS Phosphoribosylpyrophosphatesynthetase
2.7.6.1.
vgprt HGPRT Hypoxanthine-guaninephosphoribosyltransferase
2.4.2.8.
vhprt HGPRT Hypoxanthine-guaninephosphoribosyltransferase
2.4.2.8.
vaprt APRT Adenine phosphoribosyl-transferase
2.4.2.7.
vden ATASE `De novo synthesis'(Amidophosphoribosyl-transferase)
2.4.2.14.
vpyr `pyrimidine synthesis' several enzymesvasuc ASUC Adenylosuccinate synthetase 6.3.4.4.vasli ASLI Adenylosuccinate lyase 4.3.2.2.vimpd IMPD IMP dehydrogenase 1.1.1.205.vgmps GMPS GMP synthetase 6.3.4.1.vampd AMPD AMP deaminase 3.5.4.6.vgmpr GMPR GMP reductase 1.6.6.8.vtrans MT `transmethylation pathway'
(Protein O-methyltransferase) 2.1.1.24.vmat MAT Methionine adenosyltransferase 2.5.1.6.vpolyam SAMD `Polyamine pathway'
(S-adenosylmethionine de-carboxylase)
4.1.1.50.
vade `Adenine oxidation' (xanthineoxidase)
1.2.1.37.
R. Curto et al. / Mathematical Biosciences 151 (1998) 1±49 3

1. Introduction
Purine metabolism constitutes a key pathway for every organism since it isat the heart of DNA and RNA synthesis and degradation and involves the pro-duction of ubiquitous metabolites like ATP. It is also clinically important be-cause of numerous diseases, ranging from gout to mental retardation, that areassociated with well-characterized enzyme defects of this pathway.
The literature contains an enormous amount of data about purine metabo-lism in di�erent species, tissues, and under di�erent metabolic and physiologi-cal conditions. Even so, there are very de®nite gaps in our knowledge about thepathway, and the complexity of the regulatory mechanisms and the large num-ber of branches in this pathway make it very di�cult to understand and predictits behavior intuitively.
A promising approach to understanding purine metabolism is the construc-tion and analysis of a mathematical model that is able to deal with large
vinuc 5NUC 50-Nucleotidase 3.1.3.5.vgnuc 5NUC 50-Nucleotidase 3.1.3.5.varna RNAP RNA polymerase (from ATP) 2.7.7.6.vgrna RNAP RNA polymerase (from GTP) 2.7.7.6.vrnaa RNAN RNases (to AMP) several enzymesvrnag RNAN RNases (to GMP) several enzymesvdgnuc 3NUC 50(30) Nucleotidase 3.1.3.31.vada ADA Adenosine deaminase 3.5.4.4.vdada ADA Adenosine deaminase 3.5.4.4.vadrnr DRNR Diribonucleotide reductase 1.17.4.1.vgdrnr DRNR Diribonucleotide reductase 1.17.4.1.vgua GUA Guanine hydrolase 3.5.4.3.vadna DNAP DNA polymerase (from dATP) 2.7.7.7.vgdna DNAP DNA polymerase (from dGTP) 2.7.7.7.vdnaa DNAN DNases (to dAMP) several enzymesvdnag DNAN DNases (to dGMP) several enzymesvhx `Hypoxanthine excretion' Non-enzymatic
stepvhxd XD Xanthine oxidase or xanthine
dehydrogenase1.2.1.37.
vxd XD Xanthine oxidase or xanthinedehydrogenase
1.2.1.37.
vx `Xanthine excretion' Non-enzymaticstep
vua `Uric acid excretion' Non-enzymaticstep
4 R. Curto et al. / Mathematical Biosciences 151 (1998) 1±49

numbers of metabolites and complex interactions. Such an approach is feasi-ble since purine metabolism constitutes an almost closed pathway in whichonly a few metabolites are products of, or substrates for, other pathways.In our model de®nition, the metabolic system consists of sixteen dependentvariables, two independent variables and thirty-seven steps; it is depicted inFig. 1.
Several approaches to modeling purine metabolism were developed in recentyears. Franco and Canela [1] designed one of the ®rst kinetic models of purinemetabolism based on data from di�erent species and tissues, with the aim ofdemonstrating the usefulness of computer simulations of complex metabolicnetworks. Heinmets [2] modeled nucleic acid synthesis from nucleotides anddeoxynucleotides, but the model parameters were not directly obtained fromexperimental data. More recently, Bartel and Holzh�utter [3] constructed amodel based on rat liver as the reference system.
The goal of the present paper is to develop an integrated model that is basedon available data and that may aid our understanding of the complex dynamicsof purine metabolism. Our reference system is the whole human body. This is adaring task, but it seems that in the long run it will be the only way to addressthe large and diverse amount of experimental and clinical data on normal andde®cient purine metabolism and potential treatments. Furthermore, it wouldappear to be restrictive to focus on a single cell type or tissue, since the path-ways of purine metabolism are distributed among several tissues at di�erent lo-cations throughout the body [4,5].
In order not to become overwhelmed with complexity, the prototype modelspresented here do not account for the physiological compartmentalization ofpurine metabolism throughout the body. This is a potentially signi®cant simpli-®cation that should be addressed in the future. However, at this point, a non-compartmental model seems to be a reasonable starting point for understand-ing some aspects the complex dynamics of purine metabolism. The future in-clusion of compartments in an overall model must be expected to be achallenge, since some pathways within purine metabolism di�er among tissuesand even at the cellular level [6]. Since there are no absolute guidelines for thechoice of a particular model, we develop three alternative models and comparethem with each other and with clinical observations. This comparison may helpfuture researchers with model selection in similar situations.
The ®rst and most signi®cant step for this comparative analysis is the assess-ment of experimental data from the literature. For this step, we collected pub-lished information on metabolite concentrations, ¯ux values, and enzymekinetics from both biochemical and clinical studies. The evaluation of this in-formation is useful not only in the context of the present paper, but it is a nec-essary prerequisite for any modeling approach to understanding purinemetabolism. Because of the importance of this step, we discuss data collectionand parameter estimation in some detail.
R. Curto et al. / Mathematical Biosciences 151 (1998) 1±49 5
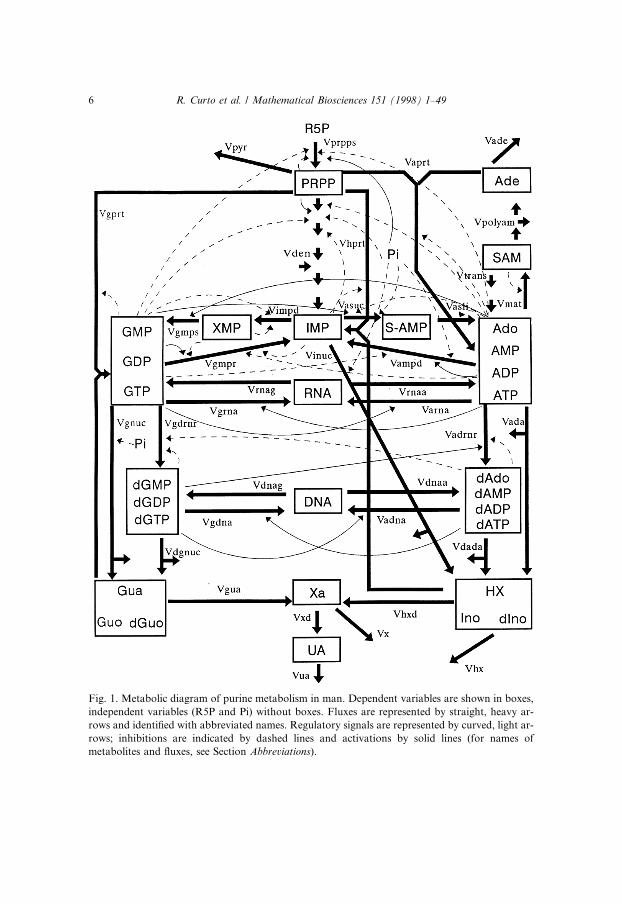
Fig. 1. Metabolic diagram of purine metabolism in man. Dependent variables are shown in boxes,
independent variables (R5P and Pi) without boxes. Fluxes are represented by straight, heavy ar-
rows and identi®ed with abbreviated names. Regulatory signals are represented by curved, light ar-
rows; inhibitions are indicated by dashed lines and activations by solid lines (for names of
metabolites and ¯uxes, see Section Abbreviations).
6 R. Curto et al. / Mathematical Biosciences 151 (1998) 1±49

The literature contains considerable information about the key processes ofthe pathway, and this information is often presented in the form of parameterssuch as KM , VMAX, and KI . This information can be directly translated into tra-ditional Michaelis±Menten or Hill rate laws. However, the published informa-tion is not complete, especially, if one restricts the search to human cells. Insome cases, the lack of information can be alleviated with direct or indirect da-ta, obtained in vivo or in vitro, that show how one variable a�ects the rate of aparticular step. While this information is insu�cient for translating these ob-servations into corresponding Michaelis±Menten equations, it can be used toformulate and parameterize power-function rate laws proposed in BiochemicalSystems Theory (BST) [7±13].
The ®rst model we analyze is a `Complemented Michaelis±Menten' (CMM)model in which as many steps of the pathway as currently possible (15 out ofthe 37) are expressed as traditional Michaelis±Menten rate laws, 10 are expres-sed as power-law rate laws, and 12 are mixed.
The other two models are formulated as canonical models within the frame-work of BST. The ®rst of these is a Generalized Mass Action (GMA) model inwhich each individual step is represented as power-function rate law. These rep-resentations are readily obtained directly from data or from the previously de®nedCMM model, with methods that are well documented in the literature [10,14].
The second power-law model is given in the form of an S-system. In thisform, in¯uxes and out¯uxes at branchpoints are aggregated into one power-law term each. This form is simpler in structure and allows analytic evaluationsof the steady-state that are not possible in other types of models. It was alsoshown in a theoretical setting [14] that S-systems capture the dynamics of pureMichaelis±Menten models better than GMA systems, if the involved metabo-lites vary within physiological ranges. If the metabolites deviate greatly fromtheir nominal values, either one of the power-law models may be more accurate[14]. Our results here con®rm that this is true for purine metabolism. For smallperturbations, the responses of the S-system model are slightly closer to CMMthan GMA, but for very large perturbations, as they occur in severe enzyme de-®ciencies, the GMA model agrees signi®cantly better with clinical observationsthan the S-system model. Reasons for this result, along with advantages and dis-advantages of the three models, are discussed in the ®nal section of the paper.
2. Mathematical representation and data requirements
A standard concept for describing the dynamics of complex systems is basedon mass balance equations of the type
�X i �Xr
j�1
cijvj; �1�
R. Curto et al. / Mathematical Biosciences 151 (1998) 1±49 7

where r is the number of processes in the system, and the processes vj are func-tions of some or all of the metabolites Xi. The parameters cij are the stoic-hiometric coe�cients of the reaction vj in the equation of metabolite Xi.These coe�cients take values: greater than 0, if vj synthesizes Xi; equal to 0,if vj has no e�ect on Xi; and lower than 0, if vj degrades Xi.
In traditional enzyme kinetics, the functions vj represent enzyme catalyzedprocesses, each of which is formulated as a rational function that relates thereaction rate with the concentrations of substrates and modulators. The sim-plest example is the Michaelis±Menten equation
vi � VMAXXj
KM � Xj; �2�
which has been the paradigm rate law for almost a century [15]. It has provenvery useful in itself and has also been used as the basis for more complicatedrate laws involving activators, inhibitors, allosteric substrates, and other mod-ulating in¯uences.
For reactions that include several substrates, products, or modulators, thetraditional rate laws become unwieldy, and this has prompted the search foralternative representations. Valid, yet mathematically convenient substitutesfor the traditional rate laws are particularly needed if the objective of the inv-estigation is the analysis of realistically sized, integrated metabolic pathwaysand their dynamic behavior. Addressing this need, BST [9,13] was developedas a mathematically rigorous modeling approach that can make use of a widevariety of data and other types of more qualitative information. In BST, eachrate is represented by a product of power-law functions. This strategy has em-pirically proven successful and is mathematically justi®ed, since it derives fromlinear approximation of the rate in logarithmic space. The power-law represen-tation is equivalent with the actual rate law at any chosen operating point, butthe two typically di�er when the system moves away from this point. Experi-ence suggests that the rate laws in BST are su�ciently accurate if the metabo-lites in the pathway remain within their physiological ranges.
For the GMA model, the rate laws are formulated as
vi � ai
Yn�m
j�1
X fijj : �3�
In this representation, n is the number of dependent variables and m the num-ber of independent variables (in the case of purine metabolism, n� 16 andm� 2), and ai is the rate constant of the reaction. The kinetic orders fij arethe normalized partial derivatives of ¯uxes with respect to the involved metab-olite or modulator concentrations; they are equivalent to elasticity coe�cientsin Metabolic Control Theory (MCT) [10,16,17]
ovi
oXj
� �0
Xj0
Vi0
� fij: �4�
8 R. Curto et al. / Mathematical Biosciences 151 (1998) 1±49

This interpretation of kinetic orders provides a straightforward procedure fortranslating traditional rate laws into GMA rate laws (see Appendix A for illus-trations).
An alternative to the GMA power-law model is an S-system model. The ra-tionale again is representation in logarithmic space of the actual and unknownrate law, but instead of approximating each step separately, all ¯uxes of synthe-sis of a given dependent variable are aggregated in only one power-law termand all ¯uxes of degradation are aggregated in one power-law term. As a result,the typical S-system equation contains two terms and reads
�X i � ai
Yn�m
j�1
X gijj ÿ bi
Yn�m
j�1
X hijj : �5�
As before, n is the number of dependent variables (16) and m the number of inde-pendent variables (2);ai and bi are the rate constants for the synthesis and degrada-tion processes of the reaction; and gij and hij are the kinetic orders of the metaboliteor modulator j in the synthesis or degradation of metabolite i, respectively.
The transition from the GMA model to the S-system model is straightfor-ward, since the S-system parameters are computed by partial di�erentiationfrom the collections of GMA terms that describe all in¯uxes or all out¯uxesfor each dependent variable
gij or hij �Xl
r�1
fir ; jvirPls�1 vis
!0
: �6�
Here, vir and vis represent the individual steps for the synthesis or degradationof the metabolite Xi, l is the number of individual steps that constitute the ag-gregated synthesis or degradation of the metabolite Xi, and the parameters fir
are the kinetic orders in GMA of the variable Xj with respect to the rth step ofsynthesis or degradation of metabolite Xi.
The maximal velocities VVIVO in the CMM rate laws and the rate constantsin the power-law models are de®ned in such a way that the steady-state concen-trations of metabolites give the desired steady-state values for ¯uxes.
3. Estimation of parameters from experimental data
It is quite evident that any in vivo parameter estimates are subject to greatuncertainty. This uncertainty is composed of two types, sometimes referred toas natural variability or Type A and true uncertainty or Type B [18]. The naturalvariability accounts for the situation that the parameter in question is uniquelygiven but unknown, whereas the true uncertainty accounts for the situationthat the parameter indeed is distributed. Clearly, both types of uncertaintyare relevant in purine metabolism, and this must be remembered when resultsare presented and interpreted.
R. Curto et al. / Mathematical Biosciences 151 (1998) 1±49 9
3.1. Steady-state operating point
The ®rst step in the estimation of parameter values is the choice of an oper-ating point, which is characterized by a set of concentrations and ¯uxes thatrepresent a physiological steady state in humans. Of course, this steady statevaries from person to person and also is a�ected by diet and the degree of phys-ical activity, and we chose a hypothetical average situation that appeared to berealistic. Sensitivity tests [19] have shown that this steady state in fact is ratherrobust and that moderate changes in kinetic parameters of the model do nota�ect the ¯uxes or concentrations much (see also below). The steady-state con-centrations are presented in Table 1, along with clinical measurements in dif-ferent tissues and with references.
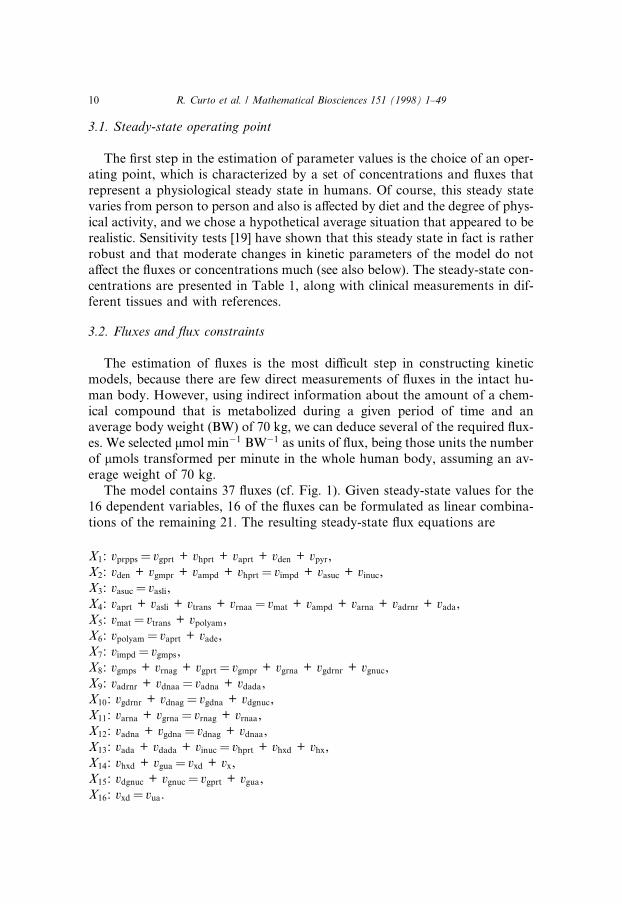
3.2. Fluxes and ¯ux constraints
The estimation of ¯uxes is the most di�cult step in constructing kineticmodels, because there are few direct measurements of ¯uxes in the intact hu-man body. However, using indirect information about the amount of a chem-ical compound that is metabolized during a given period of time and anaverage body weight (BW) of 70 kg, we can deduce several of the required ¯ux-es. We selected lmol minÿ1 BWÿ1 as units of ¯ux, being those units the numberof lmols transformed per minute in the whole human body, assuming an av-erage weight of 70 kg.
The model contains 37 ¯uxes (cf. Fig. 1). Given steady-state values for the16 dependent variables, 16 of the ¯uxes can be formulated as linear combina-tions of the remaining 21. The resulting steady-state ¯ux equations are
X1: vprpps� vgprt + vhprt + vaprt + vden + vpyr,X2: vden + vgmpr + vampd + vhprt� vimpd + vasuc + vinuc,X3: vasuc� vasli,X4: vaprt + vasli + vtrans + vrnaa� vmat + vampd + varna + vadrnr + vada,X5: vmat� vtrans + vpolyam,X6: vpolyam� vaprt + vade,X7: vimpd� vgmps,X8: vgmps + vrnag + vgprt� vgmpr + vgrna + vgdrnr + vgnuc,X9: vadrnr + vdnaa� vadna + vdada,X10: vgdrnr + vdnag� vgdna + vdgnuc,X11: varna + vgrna� vrnag + vrnaa,X12: vadna + vgdna� vdnag + vdnaa,X13: vada + vdada + vinuc� vhprt + vhxd + vhx,X14: vhxd + vgua� vxd + vx,X15: vdgnuc + vgnuc� vgprt + vgua,X16: vxd� vua.
10 R. Curto et al. / Mathematical Biosciences 151 (1998) 1±49

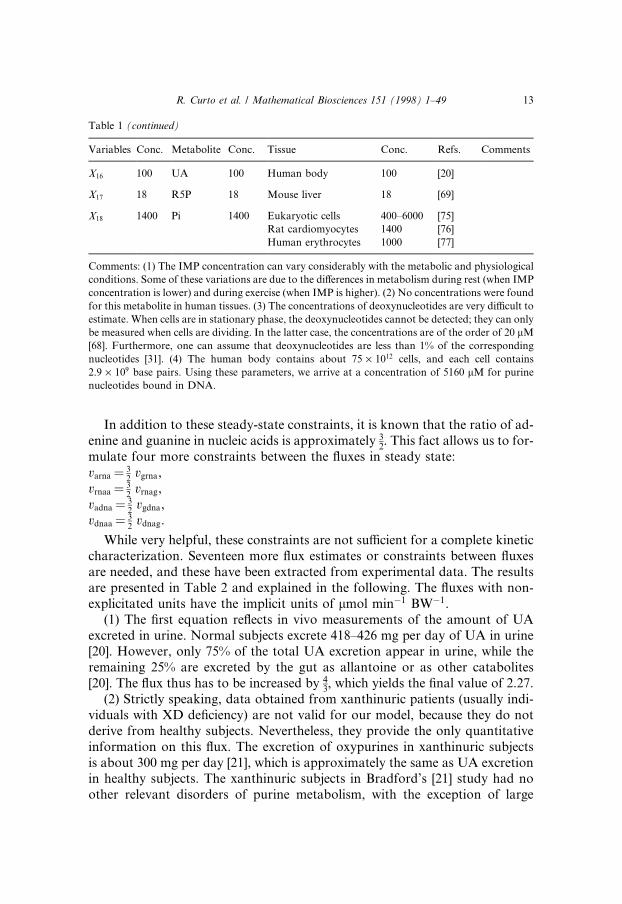
Table 1
Estimation of metabolite concentrations (units for concentrations are in lM)
Variables Conc. Metabolite Conc. Tissue Conc. Refs. Comments
X1 5 PRPP 5 Human cells 5 [55]
Human erythrocytes 2±7 [55]
Human cells <10 [56]
X2 100 IMP 100 Human liver 120±300 [57] 1
Human kidney 50±110
Human erythrocytes 5±85
Human brain 17 [58]
X3 0.2 S-AMP 0.2 Rat muscle <0.2 [59] 2
X4 2500 AMP 200 Rat muscle 93 [59]
Rat liver 270 [60]
Rat erythrocytes 37
Erlich cells 500±700 [61]
Glioblastoma 241 [58]
Human brain 242
ADP 400 Rat muscle 624 [59]
Rat liver 530 [60]
Rat erythrocytes 174
Glioblastoma 527 [58]
Human brain 788
ATP 1900 Rat muscle 5000 [59]
Rat liver 1512 [60]
Rat erythrocytes 1702
Glioblastoma 1105 [58]
Human brain 2100
Ado 0.5 General tissues 0.5 [30]
X5 4 SAM 4 Human erythrocytes 3.5 [62,63]
X6 1 Ade 1 Erlich cells 1.4 [64]
Rat liver 0.9 [60]
Rat muscle 1.3
Rat erythrocytes 1.6
Rat plasma 3.2
Human brain 4.5 [58]
Human plasma 0.07 [65]
X7 25 XMP 25 Not infected cells � [GMP] [66]
X8 400 GMP 25 Glioblastomas 22 [58]
Human brain 26
GDP 75 Human erythrocytes 33 [67]
Erlich cells 220 [64]
Glioblastoma 74 [58]
Human brain 169
GTP 300 Human erythrocytes 205 [67]
Erlich cells 350 [64]
R. Curto et al. / Mathematical Biosciences 151 (1998) 1±49 11
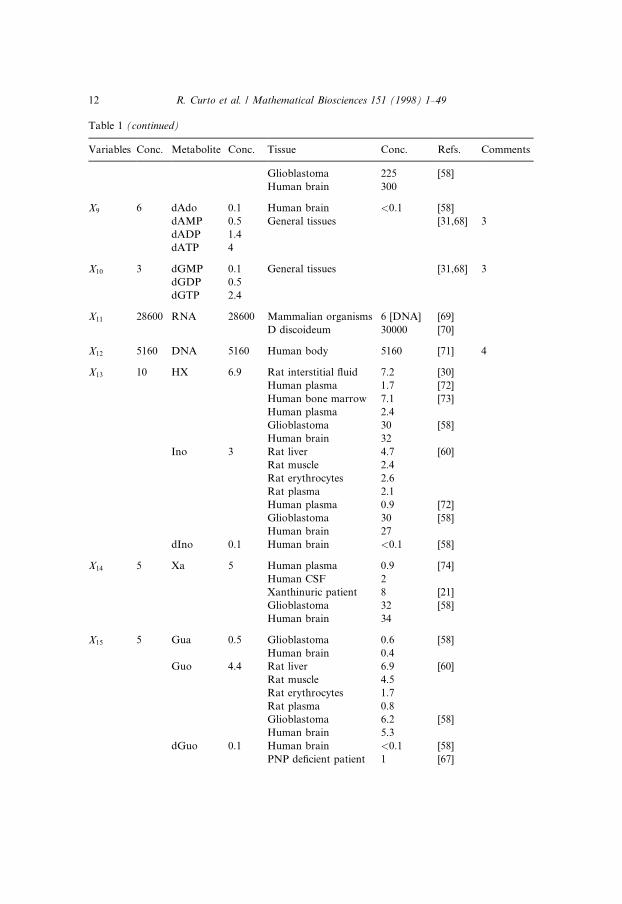
Table 1 (continued)
Variables Conc. Metabolite Conc. Tissue Conc. Refs. Comments
Glioblastoma 225 [58]
Human brain 300
X9 6 dAdo 0.1 Human brain <0.1 [58]
dAMP 0.5 General tissues [31,68] 3
dADP 1.4
dATP 4
X10 3 dGMP 0.1 General tissues [31,68] 3
dGDP 0.5
dGTP 2.4
X11 28600 RNA 28600 Mammalian organisms 6 [DNA] [69]
D discoideum 30000 [70]
X12 5160 DNA 5160 Human body 5160 [71] 4
X13 10 HX 6.9 Rat interstitial ¯uid 7.2 [30]
Human plasma 1.7 [72]
Human bone marrow 7.1 [73]
Human plasma 2.4
Glioblastoma 30 [58]
Human brain 32
Ino 3 Rat liver 4.7 [60]
Rat muscle 2.4
Rat erythrocytes 2.6
Rat plasma 2.1
Human plasma 0.9 [72]
Glioblastoma 30 [58]
Human brain 27
dIno 0.1 Human brain <0.1 [58]
X14 5 Xa 5 Human plasma 0.9 [74]
Human CSF 2
Xanthinuric patient 8 [21]
Glioblastoma 32 [58]
Human brain 34
X15 5 Gua 0.5 Glioblastoma 0.6 [58]
Human brain 0.4
Guo 4.4 Rat liver 6.9 [60]
Rat muscle 4.5
Rat erythrocytes 1.7
Rat plasma 0.8
Glioblastoma 6.2 [58]
Human brain 5.3
dGuo 0.1 Human brain <0.1 [58]
PNP de®cient patient 1 [67]
12 R. Curto et al. / Mathematical Biosciences 151 (1998) 1±49
In addition to these steady-state constraints, it is known that the ratio of ad-enine and guanine in nucleic acids is approximately 3
2. This fact allows us to for-
mulate four more constraints between the ¯uxes in steady state:
While very helpful, these constraints are not su�cient for a complete kineticcharacterization. Seventeen more ¯ux estimates or constraints between ¯uxesare needed, and these have been extracted from experimental data. The resultsare presented in Table 2 and explained in the following. The ¯uxes with non-explicitated units have the implicit units of lmol minÿ1 BWÿ1.
(1) The ®rst equation re¯ects in vivo measurements of the amount of UAexcreted in urine. Normal subjects excrete 418±426 mg per day of UA in urine[20]. However, only 75% of the total UA excretion appear in urine, while theremaining 25% are excreted by the gut as allantoine or as other catabolites[20]. The ¯ux thus has to be increased by 4
3, which yields the ®nal value of 2.27.
(2) Strictly speaking, data obtained from xanthinuric patients (usually indi-viduals with XD de®ciency) are not valid for our model, because they do notderive from healthy subjects. Nevertheless, they provide the only quantitativeinformation on this ¯ux. The excretion of oxypurines in xanthinuric subjectsis about 300 mg per day [21], which is approximately the same as UA excretionin healthy subjects. The xanthinuric subjects in Bradford's [21] study had noother relevant disorders of purine metabolism, with the exception of large
varna� 32
vgrna,vrnaa� 3
2vrnag,
vadna� 32
vgdna,vdnaa� 3
2vdnag.
Table 1 (continued)
Variables Conc. Metabolite Conc. Tissue Conc. Refs. Comments
X16 100 UA 100 Human body 100 [20]
X17 18 R5P 18 Mouse liver 18 [69]
X18 1400 Pi 1400 Eukaryotic cells 400±6000 [75]
Rat cardiomyocytes 1400 [76]
Human erythrocytes 1000 [77]
Comments: (1) The IMP concentration can vary considerably with the metabolic and physiological
conditions. Some of these variations are due to the di�erences in metabolism during rest (when IMP
concentration is lower) and during exercise (when IMP is higher). (2) No concentrations were found
for this metabolite in human tissues. (3) The concentrations of deoxynucleotides are very di�cult to
estimate. When cells are in stationary phase, the deoxynucleotides cannot be detected; they can only
be measured when cells are dividing. In the latter case, the concentrations are of the order of 20 lM
[68]. Furthermore, one can assume that deoxynucleotides are less than 1% of the corresponding
nucleotides [31]. (4) The human body contains about 75 ´ 1012 cells, and each cell contains
2.9 ´ 109 base pairs. Using these parameters, we arrive at a concentration of 5160 lM for purine
nucleotides bound in DNA.
R. Curto et al. / Mathematical Biosciences 151 (1998) 1±49 13
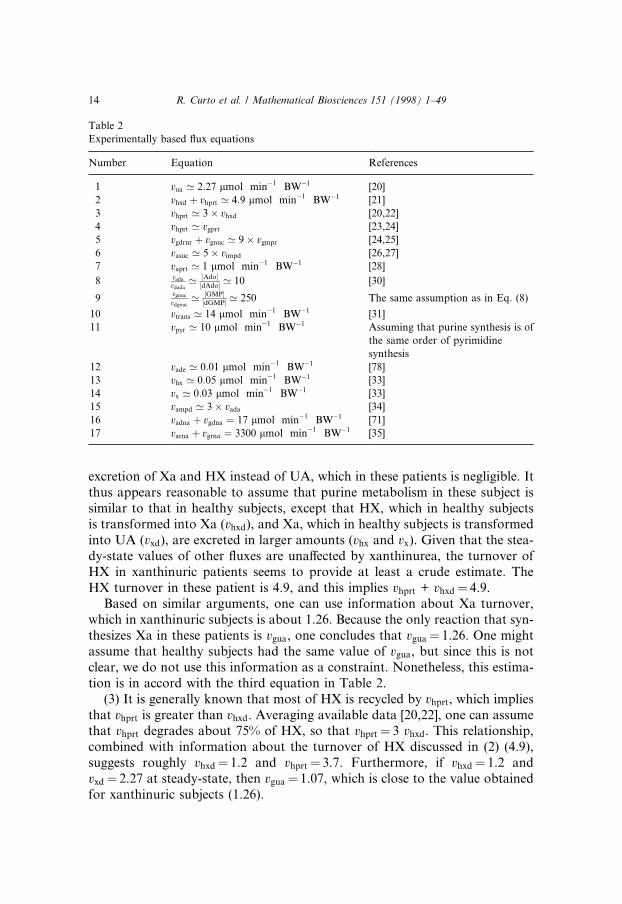
excretion of Xa and HX instead of UA, which in these patients is negligible. Itthus appears reasonable to assume that purine metabolism in these subject issimilar to that in healthy subjects, except that HX, which in healthy subjectsis transformed into Xa (vhxd), and Xa, which in healthy subjects is transformedinto UA (vxd), are excreted in larger amounts (vhx and vx). Given that the stea-dy-state values of other ¯uxes are una�ected by xanthinurea, the turnover ofHX in xanthinuric patients seems to provide at least a crude estimate. TheHX turnover in these patient is 4.9, and this implies vhprt + vhxd� 4.9.
Based on similar arguments, one can use information about Xa turnover,which in xanthinuric subjects is about 1.26. Because the only reaction that syn-thesizes Xa in these patients is vgua, one concludes that vgua� 1.26. One mightassume that healthy subjects had the same value of vgua, but since this is notclear, we do not use this information as a constraint. Nonetheless, this estima-tion is in accord with the third equation in Table 2.
(3) It is generally known that most of HX is recycled by vhprt, which impliesthat vhprt is greater than vhxd. Averaging available data [20,22], one can assumethat vhprt degrades about 75% of HX, so that vhprt� 3 vhxd. This relationship,combined with information about the turnover of HX discussed in (2) (4.9),suggests roughly vhxd� 1.2 and vhprt� 3.7. Furthermore, if vhxd� 1.2 andvxd� 2.27 at steady-state, then vgua� 1.07, which is close to the value obtainedfor xanthinuric subjects (1.26).
Table 2
Experimentally based ¯ux equations
Number Equation References
1 vua ' 2:27 lmol minÿ1 BWÿ1 [20]
2 vhxd � vhprt ' 4:9 lmol minÿ1 BWÿ1 [21]
3 vhprt ' 3� vhxd [20,22]
4 vhprt ' vgprt [23,24]
5 vgdrnr � vgnuc ' 9� vgmpr [24,25]
6 vasuc ' 5� vimpd [26,27]
7 vaprt ' 1 lmol minÿ1 BWÿ1 [28]
8 vada
vdada' �Ado��dAdo� ' 10 [30]
9vgnuc
vdgnuc' �GMP��dGMP� ' 250 The same assumption as in Eq. (8)
10 vtrans ' 14 lmol minÿ1 BWÿ1 [31]
11 vpyr ' 10 lmol minÿ1 BWÿ1 Assuming that purine synthesis is of
the same order of pyrimidine
synthesis
12 vade ' 0:01 lmol minÿ1 BWÿ1 [78]
13 vhx ' 0:05 lmol minÿ1 BWÿ1 [33]
14 vx ' 0:03 lmol minÿ1 BWÿ1 [33]
15 vampd ' 3� vada [34]
16 vadna � vgdna � 17 lmol minÿ1 BWÿ1 [71]
17 varna � vgrna � 3300 lmol minÿ1 BWÿ1 [35]
14 R. Curto et al. / Mathematical Biosciences 151 (1998) 1±49

(4) Measurements of the activity of vaprt, vhprt and vgprt reported in the liter-ature suggest that the activities of hprt and gprt are similar and that the activityof aprt is less than the other two [23,24].
(5) Between 90% and 100% of guanine nucleotides are degraded to Xa[24,25]. Even though this information is not as quantitative as we would like,it roughly suggests the constraint vgdrnr + vgnuc� 9 vgmpr.
(6) The branchpoint of IMP is most important in the regulation of purinemetabolism. It has been reported that the ratio vasuc/vimpd is close to 5 in humantissues in stationary phase, while it is close to 1 during cell proliferation [26,27].We selected a value of 5 for our system.
(7) The ¯ux vaprt was studied in an APRT de®cient patient [28]. Since thissubject presented with no other relevant disorders of purine metabolism (seebelow), one can assume that this patient synthesized the same amount ofAde as healthy subjects, but excreted it as 2,8-dihydroxyadenine instead of re-cycling it with vaprt. If this is the case, the excretion of adenine metabolites inthis patient should be equivalent to the ¯ux of vaprt in healthy subjects. Adjust-ed for BW, vaprt thus has a value of approximately 1. Other experimental data[29] yield similar results.
(8) No direct information is available about the kinetic properties of reac-tions catalyzed by ADA. However, according to Geiger and Nagy [23],ADA exhibits the same activity with Ado as with dAdo. A reasonable assump-tion is therefore, that the proportionality between vada and Ado is probably ofthe same order of magnitude as the proportionality between vdada and dAdo.This assumption leads to the statement in Table 2; its uncertainty is re¯ectedby the symbol �.
(9) No hard experimental data are available to estimate what fractions of theguanine nucleotide pool are degraded by vgnuc and vgdrnr, respectively. One maysuppose that the proportionality between these ¯uxes and the correspondingconcentrations of the guanine nucleotides and deoxynucleotides are probablyof the same order of magnitude. This assumption leads to the statement in Ta-ble 2; its uncertainty is re¯ected by the symbol �.
(10) Human S-adenosyl-L-homocysteine hydrolase, which is the last enzymein the transmethylation pathway, generates between 14 and 23 mmols of Adoin 12 h [31]. This corresponds to an average ¯ux of about 14.
(11) The ¯ux of vpyr is di�cult to estimate. One may assume that the synthe-sis of pyrimidines is approximately equal to the synthesis of purines. A reason-able value seems to be 10.
(12) vade is less than 0.07 [29], and this ¯ux is 0.01 or less [24,32]. We set thevalue as 0.01.
(13) and (14) vhx and vx for humans in vivo are about 0.05 and 0.03, respec-tively [33].
(15) [34] related the ¯uxes of vampd and vada in di�erent tissues and suggesteda ratio of about 3.
R. Curto et al. / Mathematical Biosciences 151 (1998) 1±49 15

(16) If one assumes an average human cell turnover of 15 days and takesinto account that DNA must be resynthesized during every cell cycle, one ob-tains a DNA turnover rate of 17.
(17) mRNA constitutes a mere 3% of the total RNA pool, but the turnover¯ux of the mRNA pool is about 30% of the turnover ¯ux of the total RNApool. Furthermore, the half life for mRNA in eukaryotic organisms is about30 min [35]. These data yield an RNA turnover rate of 3300. Sander et al.[36] estimated this turnover value as 0.06 assuming one mole of RNA as theentire chain of nucleotides, whereas in our model, one mole refers to a singleRNA nucleotide. For comparison, the turnover rate in Sander's analysis musttherefore be multiplied with the average length of an RNA chain. If one as-sume that the average length of an RNA chain is about 50 000, the two estima-tions are very close.
With these estimates and constraints, the system of equations has a uniquesolution for the ¯ux values at steady state; this solution is presented in Table 3.While these values have been calculated for our speci®c modeling purposes,they are interesting in themselves because they provide some insight in the dis-tribution of ¯uxes in human purine metabolism.
3.3. Estimation methods
For the CMM model, we collected as many parameters as possible from ex-perimental data in humans. Only less than half of the ¯uxes could be evaluatedin this fashion, and we were forced to complement them with other types ofrate laws. For this purpose, we estimated kinetic orders of power-law represen-tations instead of the traditional constants KM , Ki or KA.
Some of the variables in our model represent pools, rather than individualmetabolites. An example is the pool X4, which includes ATP, ADP, AMP,and Ado. This needs to be considered when only one or two of the constituents
Table 3
Steady-state ¯ux rates in man
vada� 2.1 vade� 0.01 vadna� 10 vadrnr� 0.2
vampd� 5.69 vaprt� 1 varna� 1980 vasuc � 8
vasli� 8 vdada� 0.2 vden� 2.39 vdgnuc� 0.1
vdnaa� 10 vdnag� 6.8 vgdna� 6.8 vgdrnr� 0.1
vgmpr� 0.5 vgmps� 1.6 vgnuc � 4.7 vgprt� 3.7
vgrna� 1320 vgua� 1.1 vhprt � 3.7 vhx � 0.05
vhxd� 1.23 vimpd� 1.6 vinuc � 2.68 vmat � 15
vpolyam� 1.01 vprpps� 20.79 vpyr � 10 vrnaa� 1980
vrnag� 1320 vtrans� 13.99 vua� 2.3 vx� 0.03
vxd� 2.3
Variables are listed in alphabetical order. Units are lmol minÿ1 BWÿ1.
16 R. Curto et al. / Mathematical Biosciences 151 (1998) 1±49
of such pools a�ect a rate law. For instance, we cannot directly include ATP asa variable in a kinetic rate law, because ATP is not a dependent variable in themodel. Instead, we use X4 and correct the disparity between ATP and X4 bymultiplying X4 in the rate law with the factor [ATP]/X4 at the operating point.The kinetic rate law of each reaction and its associated parameter values arepresented in next section.
Parameter values for the GMA model were obtained from kinetic data asshown in Eq. (4). In most cases, the kinetic orders were coded as `f' followedby the abbreviated name of the reaction and by the number (or abbreviatedname) of the variable that a�ects the rate of the reaction.
The only exceptions are the kinetic orders for the synthesis and degradationof nucleic acids. These are constrained by the fact that the ratio of Ade/Gua innucleic acids is essentially constant. To ensure that the kinetic parameters ofvarna and vgrna are the same, we coded them as frnap�i� (as an acronym for theenzyme RNA polymerase). Similarly, frnan�i� stands for the kinetic orders ofvrnag and vrnaa (as an acronym for the enzyme RNA nucleotidase), fdnap�i� forthe kinetic orders of vadna and vgdna (for DNA polymerase), and fdnan�i� for ki-netic orders of vdnaa and vdnag (for DNA nucleotidase). This deviation in no-menclature signi®es that the incorporation of guanine nucleotides to nucleicacids is proportional to the incorporation of adenine.
To estimate the GMA parameters in cases where the substrate or modi®er ofthe reaction is an aggregated pool, we took into account that the aggregatedpool concentration is the sum of the concentrations of the individual compo-nents and that the equilibrium between them is achieved very rapidly. For in-stance, suppose that the aggregated pool of Xj is composed of three chemicalsubstances, Xa, Xb, and Xc:
Xj � Xa � Xb � Xc;
Xa Xb Xc:
Introducing the equilibrium constants K1�Xb/Xa, K2�Xc/Xb, we can form-ulate the rapid equilibrium between the metabolites as
Xj � Xa � K1Xa � K2K1Xa � Xa�1� K1 � K1K2� � K 01Xa;
Xj � Xb � Xb=K1 � K2Xb � Xb�1� 1=K1 � K2� � K 02Xb;
Xj � Xc � Xc=K2 � Xc=�K2K1� � Xc�1� 1=K2 � 1=�K1K2� � K 03Xc:
According to Eq. (4), the parameters of interest are de®ned as
fij � ovi
oXj
� �0
Xj0
vi0
; fia � ovi
oXa
� �0
Xa0
vi0
:
fib � @vi
@Xb
� �0
Xb0
vi0
; fic � @vi
@Xc
� �0
Xc0
vi0
:
R. Curto et al. / Mathematical Biosciences 151 (1998) 1±49 17
Application of the chain rule of di�erentiation leads to
fij � ovi
oXj
� �0
Xj0
vi0
� Xj0
vi0
ovi
oXa
� �0
oXa
oXj
� �0
� ovi
oXb
� �0
oXb
oXj
� �0
�� ovi
oXc
� �0
oXc
oXj
� �0
�� ovi
oXa
� �1
K1
K1Xa
vi� ovi
oXb
� �1
K2
K2Xb
vi� ovi
oXc
� �1
K3
K3Xc
vi
and this yields, upon rearrangement of terms,
fij � fia � fib � fic:
This mathematical derivation shows that a kinetic order with respect to anaggregated pool is equal to the sum of the kinetic orders with respect to the in-dividual components of the pool.
Some steps within purine metabolism (e.g., vden, vpolyam, and vtrans) do notconsist of only one reaction, but of linear pathways, and it turned out to beimpossible to ®nd kinetic rate laws for the entire sets of reactions. Theoreticalarguments suggest estimating the parameters of these ¯uxes from the ®rst en-zyme of the pathway, as is discussed below.
First, one can argue that the kinetic orders of a ¯ux representing a linearpathway are, by de®nition, the logarithmic ¯ux gains [13] of this linear path-way. For instance, if one would construct a model of the 10 reactions that com-prise vden, one could calculate the logarithmic ¯ux gains of this pathway andsubsequently use them as kinetic orders in the overall model of purine metab-olism.
Secondly, one can justify the use of kinetic orders associated with the ®rstenzyme by evoking a fundamental equation of BST that relates ¯ux gainsand kinetic orders: �L�vi;Xk�� � �Gi� � �Gd ��L�Xi;Xk�� [37,38]. In a linear path-way, all rows in the matrix �L�vi;Xk�� are identical because all ¯uxes have thesame value in steady state. Thus, one needs to calculate only one row of thismatrix to know all logarithmic ¯ux gains of the system. Consider one step inthe linear pathway which is not modi®ed by any dependent variable of thepathway, and for which, consequently, all kinetic orders of the matrix Gd arezeros. The corresponding row of the matrix �Gd ��L�Xi;Xk�� is a row of zeros,and the logarithmic ¯ux gains correspond exactly to the row of [Gi] of thosekinetic orders of independent variables in the synthesis term of this variablethat are not a�ected by any other dependent variable. However, the only stepin the pathway that can be unmodi®ed by any dependent variable is the ®rststep, in which the substrate is an independent variable, because the substratesof all other reactions are dependent variables. This implies that in a linear path-way in which none of the dependent variables inside this linear pathway is amodi®er of the ®rst step, the logarithmic ¯ux gains of the pathway correspondexactly to the kinetic orders of the ®rst reaction. In such cases, it is justi®ed to
18 R. Curto et al. / Mathematical Biosciences 151 (1998) 1±49

substitute the linear chain of reactions with one step in which the kinetic orderscorrespond to those of the ®rst reaction. This procedure applies to vden, vpolyam,and vtrans.
The kinetic orders for the S-system model were computed with Eq. (6), usingthe previous estimates of GMA kinetic orders and the values of ¯uxes at theoperating point.
Applying these methods to published experimental data, we estimated thekinetic orders for every reaction of the pathway. The results are given in Ap-pendix A following the order of the pathway of Fig. 1. The resulting kineticorders of the GMA and S-system models are shown in Tables 4 and 5 respec-tively, the GMA rate constant and Vvivo are given in Table 6, and S-system rateconstants are given in Table 7.
4. Preliminary model evaluation
4.1. Steady-state features
With 18 variables, 37 ¯uxes, and numerous modulations, the proposed mod-els of purine metabolism are quite complicated, and a full evaluation is beyondour scope here. A rather detailed analysis of the steady-state properties can befound elsewhere [19]. This analysis demonstrates that the steady state is stable
Table 4
Values of GMA kinetic orders in alphabetical order
fada4� 0.97 fade6� 0.55 fadrnr4� 0.1 fadrnr9�)0.3
fadrnr10� 0.87 fampd4� 0.8 fampd8�)0.03 fampd18�)0.1
faprt1 � 0.5 faprt4�)0.8 faprt6� 0.75 fasuc2� 0.4
fasuc4�)0.24 fasuc8� 0.2 fasuc18�)0.05 fasli3� 0.99
fasli4�)0.95 fdada9� 1 fden1� 2 fden2�)0.06
fden4�)0.25 fden8�)0.2 fden18�)0.08 fdgnuc10� 1
fdnan12� 1 fdnap9� 0.42 fdnap10� 0.33 fgdrnr8� 0.4
fgdrnr9�)1.2 fgdrnr10�)0.39 fgmpr2�)0.15 fgmpr4�)0.07
fgmpr7�)0.76 fgmpr8� 0.7 fgmps4� 0.12 fgmps7� 0.16
fgnuc8� 0.9 fgnuc18�)0.34 fgprt1� 1.2 fgprt8�)1.2
fgprt15� 0.42 fgua15� 0.5 fhprt1� 1.1 fhprt2�)0.89
fhprt13� 0.48 fhx13� 1.12 fhxd13� 0.65 fimpd2� 0.15
fimpd7�)0.09 fimpd8�)0.03 finuc2� 0.8 finuc18�)0.36
fmat4� 0.2 fmat5�)0.6 fpolyam5� 0.9 fprpps1�)0.03
fprpps4�)0.45 fprpps8�)0.04 fprpps17� 0.65 fprpps18� 0.7
fpyr1� 1.27 frnan11� 1 frnap4� 0.05 frnap8� 0.13
ftrans5� 0.33 fua16� 2.21 fx14� 2.0 fxd14� 0.55
It should be noted that the kinetic order fdnan12 applies to vdnaa and vdnag, kinetic orders fdnap9 and
fdnap10 apply to vadna and vgdna, the kinetic order frnan11 applies to vrnaa and vrnag, and kinetic orders
frnap4 and frnap8 apply to varna and vgrna. Further details are given in text and Appendix A.
R. Curto et al. / Mathematical Biosciences 151 (1998) 1±49 19

Table 5
Values of the S-system kinetic orders (kinetic orders not presented in this table have a value of 0)
g1;1�)0.03 g1;4�)0.45 g1;8�)0.04 g1;17� 0.65 g1;18� 0.7
g2;1� 0.720 g2;2�)0.28 g2;4� 0.319 g2;7�)0.03 g2;8�)0.02
g2;13� 0.144 g2;18 �)0.06 g3;2� 0.4 g3;4�)0.24 g3;8� 0.2
g3;18�)0.05 g4;1� 0.0002 g4;3� 0.003 g4;4� 0.0042 g4;5� 0.002
g4;6� 0.0003 g4;11 � 0.988 g5;4� 0.2 g5;5�)0.6 g6;5� 0.9
g7;2� 0.15 g7;7�)0.09 g7;8�)0.03 g8;1� 0.003 g8;4� 0.00014
g8;7� 0.00019 g8;8�)0.00335 g8;11 � 0.996 g8;15� 0.001 g9;4� 0.001
g9;9�)0.0058 g9;10 � 0.017 g9;12 � 0.98 g10;8� 0.005 g10;9�)0.017
g10;10�)0.006 g10;12� 0.985 g11;4� 0.05 g11;8� 0.13 g12;9� 0.42
g12;10� 0.33 g13;2� 0.43 g13;4� 0.409 g13;9� 0.04 g13;18 �)0.19
g14;13� 0.343 g14;15� 0.236 g15;8� 0.881 g15;10� 0.02 g15;18 �)0.33
g16;14� 0.55 h1;1� 1.27 h1;2�)0.16 h1;4�)0.06 h1;6� 0.036
h1;8�)0.23 h1;13 � 0.085 h1;15 � 0.074 h1;18�)0.0092 h2;2� 0.454
h2;4�)0.15 h2;7�)0.01 h2;8� 0.126 h2;18�)0.11 h3;3� 0.99
h3;4�)0.95 h4;4� 0.054 h4;5�)0.0045 h4;8� 0.128 h4;9�)2 ´ 10ÿ4
h4;10� 8 ´ 10ÿ5 h4;18 �)0.0002 h5;5� 0.368 h6;1� 0.495 h6;4�)0.79
h6;6� 0.748 h7;4� 0.12 h7;7� 0.16 h8;2�)5 ´ 10ÿ5 h8;4� 0.049
h8;7�)0.0002 h8;8� 0.132 h8;9�)9 ´ 10ÿ5 h8;10�)2 ´ 10ÿ5 h8;18�)0.001
h9;9� 0.431 h9;10 � 0.323 h10;9� 0.413 h10;10� 0.339 h11;11 � 1
h12;12� 1 h13;1� 0.817 h13;2�)0.66 h13;13� 0.528 h14;14 � 0.568
h15;1� 0.925 h15;8�)0.925 h15;15� 0.438 h16;16� 2.21
Table 6
Values of rate constants in GMA and Vvivo in CMM for each reaction, in alphabetical order
aada� 0.001062
Vvivo �ada� � 86.1
aade� 0.01
Vvivo �ade� � 0.01
aadna� 3.2789
Vvivo �adna� � 35.7912
aadrnr� 0.0602
Vvivo �adrnr� � 0.1461
aampd� 0.02688
Vvivo �ampd� � 33.4657
aaprt� 233.8
Vvivo �aprt� � 1045.64
aarna� 614.5
Vvivo �arna� � 2414.63
aasuc� 3.5932
Vvivo �asuc� � 37.7716
aasli� 66544
Vvivo �asli� � 1636.12
adada� 0.03333
Vvivo �dada� � 79.3667
aden� 5.2728
Vvivo �den� � 1278.32
adgnuc� 0.03333
Vvivo �dgnuc� � 3300.4
adnaa� 0.001938
Vvivo �dnaa� � 0.00194
adnag� 0.001318
Vvivo �dnag� � 0.001318
agdna� 2.2296
Vvivo �gdna� � 24.338
agdrnr� 0.1199
Vvivo �gdrnr� � 2.1963
agmpr� 0.3005
Vvivo �gmpr� � 0.3005
agmps� 0.3738
Vvivo �gmps� � 0.7483
agnuc� 0.2511
Vvivo �gnuc� � 1600.22
agprt� 361.69
Vvivo �gprt� � 5601
agrna� 409.6
Vvivo �grna� � 1609.75
agua� 0.4919
Vvivo �gua� � 2.2
ahprt� 12.569
Vvivo �hprt� � 370.646
ahx� 0.003793
Vvivo �hx� � 0.003793
ahxd� 0.2754
Vvivo �hxd� � 3.51428
aimpd� 1.2823
Vvivo �impd� � 2.299
ainuc� 0.9135
Vvivo �inuc� � 181.849
amat� 7.2067
Vvivo �mat� � 42.6228
apolyam� 0.29
Vvivo �polyam� � 13.635
aprpps� 0.9
Vvivo �prpps� � 16.7
apyr� 1.2951
Vvivo �pyr� � 1.2951
arnaa� 0.06923
Vvivo �rnaa� � 0.06923
arnag� 0.04615
Vvivo �rnag� � 0.04615
atrans� 8.8539
Vvivo �trans� � 20.985
aua� 0.00008744
Vvivo �ua� � 0.0000874
ax� 0.0012
Vvivo �x� � 0.0012
axd� 0.949
Vvivo �xd� � 5.1106
20 R. Curto et al. / Mathematical Biosciences 151 (1998) 1±49

and quite robust. It is rather insensitive to changes in independent variablesand parameters, but responsive enough to deal with physiological perturba-tions. Most of the over 1000 parameter sensitivities are less than one in mag-nitude, and among the remaining sensitivities, most are between 1 and 5,predicting that a 1% alteration in a parameter value would lead to a 1±5%change in the response variable. The relatively few sensitivities that are some-what higher fall into two categories. Some are associated with the enzymePPRPS, which is known to be crucial for the dynamics of purine metabolism;these higher sensitivities are thus a correct re¯ection of a well-known fact. Afew are associated with marginal metabolites like HX, and therefore rather in-consequential. The generally low parameter sensitivities are important for an-other reason: they imply that inaccuracies in the estimation of parameter valueshave relatively minor consequences.
It may be noteworthy to comment on the quite complex stoichiometry of themodel. Of course, at the steady state, the totality of inputs must equal the to-tality of outputs, and the equations indeed re¯ect this balance of ¯uxes. Thestoichiometry is complicated, because key metabolites are composed of threedi�erent moieties, namely the purine ring, ribose, and phosphate. In numeroussteps of the pathway, one of these moieties is either attached or split o�, andthis complicates any graphical representation. In order to keep confusion toa minimum, we decided to omit phosphate moieties from the pathway diagramand focus on ribose and the purine ring (see Fig. 1). This simpli®cation doesnot a�ect the mathematical equations or any of the analyses. The equations
Table 7
Values of rate constants in the S-system model
Alpha Beta
X1 0.9 30.8182
X2 1.6914 5.6
X3 3.5932 66 544.7
X4 0.08115 612.1
X5 7.2067 9.001
X6 0.29 223.54
X7 1.2823 0.3738
X8 0.0484 408.86
X9 0.00227 3.3
X10 0.00151 2.2629
X11 1024.12 0.1154
X12 5.5085 0.00325
X13 0.10582 8.2073
X14 0.7203 0.9324
X15 0.26646 135.46
X16 0.949 0.00008744
R. Curto et al. / Mathematical Biosciences 151 (1998) 1±49 21
account for the dynamics of the relevant moieties through their mathematicalstructure and the values of their parameters.
In¯uxes of ribose and purine rings, respectively, occur in two places. Thevprpps step is the point of entry for the ribose moiety, while the vden step repre-sents entry of the purine ring. The two moieties leave the system in several pro-cesses. The ribose moiety is removed directly through the steps vpyr, vpolyam, andindirectly through the steps vada, vdada, vgnuc, vdgnuc, and vinuc. The latter steps donot involve the loss of ribose directly, but are followed by splitting steps thatoccur within aggregated metabolite pools directly downstream. These reactionsare catalyzed by purine nucleoside phosphorylase and separate the ribose moi-ety from the purine base. Purine rings leave the system through the steps vade,vhx, vx, and vua. As mentioned above, phosphate moieties are attached or re-moved in a large number of steps and even within pools.
4.2. Dynamic features
For the present evaluation, the three models (CMM, GMA, and S-system)are tested for consistency through simulations that re¯ect normal and patho-logical perturbations of purine metabolism. In particular, the purpose of theanalysis is to determine whether one, two, or all three models yielded reason-able results, as measured against some representative biochemical and clinicalobservations.
Michaelis±Menten models are often considered the standard, and they havebeen the cornerstone of kinetic analyses in vitro for almost a century. Nonethe-less, there is growing suspicion about whether these models are adequate in vi-vo [39,40]. It is not guaranteed that their underlying steady-state assumptionsare satis®ed in vivo. Relaxing the assumption of homogeneity leads to rate lawsof di�erent types [41]. Michaelis±Menten models of moderately sized pathwaysbecome rather intractable when it comes to mathematical analysis. Savageau[13] discussed the drastically increasing complexity of traditional rate laws, ifthey are a�ected by several modulators. Even analyses of essential featuresof pathways, such as steady states and their stability and sensitivities, becomeforbidding in Michaelis±Menten models of realistic, integrated pathways, whilethey are readily executed in power-law models. In the present case, we found itimpossible to design a pure Michaelis±Menten model from existing data andhad to complement it with power-law processes. These theoretical and practicalconcerns make the exploration of alternative models highly desirable.
Power-law models, whether of GMA, S-system, or Half-system type [9],have signi®cant advantages when it comes to steady-state and dynamical anal-ysis. The issue of potential concern here is that these models are developed aslocal representations of the actual rate law, which implies that their accuracyand reliability are guaranteed mathematically only for small perturbations.Even without this mathematical guarantee though, there is mounting empirical
22 R. Curto et al. / Mathematical Biosciences 151 (1998) 1±49

evidence that power-law models often provide reliable representations for quitelarge ranges of variation in substrates or modulators. These ranges sometimesspan several orders of magnitude [42±44]. Supporting and explaining these ob-servations, Savageau [40,41,45] collated several direct studies and theoreticalconsiderations [46±50] suggesting that power-law functions seem to be simple,yet adequate descriptions of processes in vivo.
It has been demonstrated several times that power-law models exhibit re-sponses very similar to Michaelis±Menten equations, if the metabolites re-main within ranges of physiological variation (e.g. Refs. [14,51]). However,it is di�cult to assess in general how the three models compare under patho-logical conditions, as they are encountered in total or severe enzyme de®cien-cies. While one could argue that such conditions should be modeled atdi�erent operating points, one would consider it an advantage if the same nu-merical model could adequately represent both physiological and pathologicalconditions.
Three representative conditions were simulated: a 10-fold increase in PRPP;PRPPS superactivity; and HGPRT de®ciency. The ®rst simulation typi®es arather large, but still physiological deviation from the normal operating point.The second condition represents a persistent alteration in one of the key en-zymes of purine metabolism. Clinically, this situation is accompanied by anoverproduction of UA and gout. Mathematically, it is implemented as a two-fold increase in the activity of the ®rst enzyme of the pathway, PRPPS (cf.Fig. 1). Such an increase is outside the typical range for which local approxi-mations are guaranteed, even though power-law models have accurately mod-eled other phenomena of a similar type and magnitude of variation. The thirdsituation exempli®es a drastic change in metabolism. Clinically, HGPRT de®-ciency is characterized by overproduction of UA and gout and, depending onthe severity of the de®ciency, by spasticity, choreoathetosis, mental retardationand self-mutilation, a symptom complex that is often referred to as Lesch±Ny-han syndrome [52]. Mathematically, the de®ciency is implemented by decreas-ing the enzyme activity 100-fold. Such a deviation is far beyond the range oflocal deviation, and thus constitutes a test for the models outside the mathe-matically guaranteed range.
4.3. Simulation of a 10-fold increase in PRPP
For this type of simulation, the models are initiated with all metabolites attheir physiological steady-state level. At time t0, the concentration of PRPP israised to a 10-fold increased value, and the models are solved numerically toshow the dynamics of the metabolic system. Representative results of this setof simulations are shown in Fig. 2. Even though the concentration of PRPPis rather drastically increased by a factor 10, the three models seem to re¯ectthe e�ects consistently. After a strong initial response (e.g., as shown in
R. Curto et al. / Mathematical Biosciences 151 (1998) 1±49 23

Fig. 2 for IMP and HX), the system returns to the original, normal steadystate.
Fig. 2 demonstrates that all three models have similar characteristics. In ac-cord with earlier studies [14], the responses of the S-system and CMM modelsresemble each other more than those of the GMA and CMM models, but thedi�erences may not be signi®cant.
Other simulations of this type were executed and produced similar results.This suggests that the three models show similar dynamics as long as the per-turbations are within a physiological range. There are no clinical data with
Fig. 2. Dynamic responses to a 10-fold increase in PRPP. At t� 10, PRPP was changed from 5 to
50 lM. Solid lines show predictions of the CMM model, dashed lines predictions of the GMA mod-
el, and dotted lines predictions of the S-system model. (a) Dynamic response of IMP (X2). (b) Dy-
namic response of hypoxanthine (X13).
24 R. Curto et al. / Mathematical Biosciences 151 (1998) 1±49

which to compare these dynamic responses quantitatively, but all observed sys-tem behaviors appear to be reasonable.
4.4. Simulation of PRPPS superactivity
To simulate PRPPS superactivity, Vvivo in the CMM model and the rateconstants in the power-law models (GMA and S-system) were increased two-fold. Some representative results are shown in Table 8, along with clinical ob-servations. Since in this case a parameter value is changed, as opposed to aninitial value in the previous set of simulations, the models assume new steadystates. Again, results from the three models are quite similar, with the two pow-er-law models being essentially indistinguishable. The results of all three mod-els appear to be supported by the few available clinical observations. This isinteresting to note, since the three models are based on di�erent types of ap-proximations and underlying assumptions. Also noteworthy is the fact thatthe issue of aggregation, which is the landmark distinction between GMAand S-system models, is inconsequential, even though the deviation from theoperating point is extensive.
4.5. Simulation of severe HGPRT de®ciency
HGPRT de®ciency was modeled by reducing the activity of the enzyme to1%. This was achieved by a 100-fold decrease in Vvivo for CMM and in the rateconstants of vhprt and vgprt for GMA. In the S-system model the de®ciency wassimulated in two di�erent ways: (i) by introducing the enzyme HGPRT as anindependent variable of the model, and (ii) by multiplying the correspondingalphas and betas of the a�ected rate laws with the de®ciency factor (0.01),raised to the aggregated kinetic order of the enzyme. As expected, both proce-dures yielded the same results.
Table 8
Predictions of concentration and ¯ux values in a simulation of PRPPS superactivity with the three
models (units are (lM) for concentrations and (lM minÿ1 BWÿ1) for ¯uxes)
Variables Operational
point
PRPPS superactivity
GMA S-system CMM Clinical Reference
PRPP 5 7.8 7.8 8.2 13±29 [79]
vden 2.39 4.7 ) a 4.8 4.7±12.4 [79]
X13 (not HX) 10 41 47 90 30 [74]
X14 or Xa 5 15 15 18 10 [74]
UA 100 131 132 126 300 [74]
a The ¯ux of vden cannot be obtained from the S-system model since it is part of the aggregated ¯ux
of PRPP degradation and IMP synthesis.
R. Curto et al. / Mathematical Biosciences 151 (1998) 1±49 25

Some representative simulation results from the three models are shown inTable 9, along with clinical measurements in Lesch±Nyhan patients. Also, crit-ical ¯uxes are modeled by all three models with reasonable accuracy, as far ascan be judged in comparison with clinical ®ndings. However, some of the newsteady-state values are unacceptable. In comparison with clinical observations,GMA performs better than either CMM or S-system. For instance, the CMMmodel overestimates the inosine concentration by about threefold and hypo-xanthine excretion by 30-fold. The reasons for this are unclear. As pertainsto the S-system, the aggregation apparently is no longer an appropriate proce-dure, and the S-system model breaks down, because of the large deviation fromthe operating point. This breakdown is not a structural all-or-nothing problem,but a gradual process, as is evident from simulations of mild HGPRT de®cien-cies, which are modeled with an accuracy similar to that in the PRPPS super-activity studies above (data not shown). In the case of severe HGPRTde®ciency, the activity approaches very small values, and this has a strong im-pact on the aggregated product of power-law functions, thereby yielding the S-system representation unsatisfactory.
One can only speculate about the apparently good quality of the GMAmodel. Even though mathematically this is a local model, it seems to capturethe dynamics of purine metabolism not just close to the chosen operating point,but over a very large range of conditions. Outside `lucky coincidence', the ®rstexplanation that comes to mind is that the power-law representation of an in-dividual reaction step or ¯ux may indeed be a valid description of the processin nature, not just in a con®ned, approximate sense, but over the entire relevant
Table 9
Predictions of concentration and ¯ux values in a simulation of HGPRT de®ciency with the three
models constructed (units are (lM) for concentrations and (lM minÿ1 BWÿ1) for ¯uxes)
Variable Operational
point
HGPRT de®ciency
GMA S-system CMM Clinical Reference
X1 or PRPP 5 7.1 11.0 7.2 ) )X13 (not HX) 10 70.6 1185.7 207 71 [80]
X14 or Xa 5 22.5 133.9 23 15 [80]
X15 (not Gua) 5 9 13.3 9.9 ) )X16 or UA 100 145.7 226.6 129 150 [81]
vgua 1.1 1.47 ) a 1.5 ) )vhxd 1.23 4.4 ) a 3.2 ) )vxd 2.3 5.3 14.0 4 7±14 [52]
vhx 0.05 0.44 ) a 1.5 0.45 [80]
vx 0.03 0.6 ) a 0.65 0.27 [80]
vua 2.3 5.3 14.0 4 7±14 [52]
a These non-aggregated ¯uxes cannot be obtained from the S-system model.
26 R. Curto et al. / Mathematical Biosciences 151 (1998) 1±49

range of physiological and pathological variation. This explanation would bein line with measurements by Kohen et al. [48,49].
4.6. Issues of aggregation
Tables 8 and 9, and Fig. 2, demonstrate that the three models show similarresults for small variations about the operating point, whereas they di�er forlarge deviations. Previous comparisons between GMA, S-system and Michael-is±Menten rate laws had shown that S-system models generally agree with Mi-chaelis±Menten models more closely than GMA models, if the metabolites andmodulators remain within physiologically relevant ranges [14]. These earlier re-sults are con®rmed here for the complex and more realistic model of purine me-tabolism, as shown with the ®rst two sets of simulations (Table 8 and Fig. 2).
For large variations, at least for those demonstrated here with the simula-tion of HGPRT de®ciency, the S-system model appears to be inferior, predict-ing metabolite concentrations that are at variance with those observedclinically and predicted by CMM and GMA (Table 9). This discrepancy canbe interpreted in two ways. On one hand, it is a consequence of violating thefundamental assumption of any Taylor approximation (which underlies theS-system model) that the variable of interest should not deviate from the oper-ating point too much, lest the quality of approximation su�ers. On the otherhand, it can be seen as a direct result of the aggregation strategy that di�eren-tiates S-system and GMA.
To evaluate the latter, let us recall the de®nitions of the S-system parametersin Eq. (6). This equation shows that the aggregated parameters in S-systemsare composed of kinetic orders of GMA (fir ), which can be expected to remainconstant from one steady state to another, and of ¯uxes (mir and mis ) which ac-tually change from one steady state to another. An example is the S-systemmodel parameter h14;14 which in fact is a function of two GMA kinetic ordersand two ¯uxes
h14;14 � fxd14vxd � fx14vx
vxd � vx:
In order to calculate the new values of h14;14 in the S-system, we need actual ¯uxvalues of vxd and vx. The S-system structure directly provides the value of vxd
which is equivalent to the synthesis of UA, but it does not provide the valueof vx because it is aggregated with vxd into the degradation of Xa. To circum-vent this problem, we introduce an ancillary variable (X19) which collects thefraction of xanthine that is degraded via the excretory pathway vx and that,in turn, is degraded by only one step (vex). vx is characterized by the same ki-netic parameters as before, and the parameters of vex are chosen to balancethe degradation of the new variable and its synthesis: fex19� 0.5 andaex� 0.009486. As to be expected, the introduction of the new variable did
R. Curto et al. / Mathematical Biosciences 151 (1998) 1±49 27

not change any other property of the model but allowed us to evaluate the ¯uxof vx in the S-system simulations.
The values of the kinetic orders used for the computation of h14;14 can befound in Table 4, and values of the ¯uxes at the operating point in Table 3.These values lead to the S-system parameter h14;14� 0.568. However, whenwe alter the model, the values of vxd and vx may change, and so does h14;14.For instance, the S-system simulation of PRPPS superactivity implies a valueof vx� 0.2832 which, together with the ¯ux vxd� 4.2643 and the kinetic ordersin Table 4 results in h14;14� 0.6403, a value which is close to the value (0.568)estimated at the operating point. In contrast, simulation of HGPRT de®ciencywith the S-system model yields vx� 21.5 which, together with the ¯ux vxd� 14and kinetic orders of Table 4, yields h14;14� 1.43, a value three times higherthan the value estimated at the operating point. This di�erence is directly re-sponsible for the large concentration of xanthine that is predicted by the S-sys-tem model. The same argument (for the kinetic order h13;13) explains the largeand unphysiological accumulation of HX predicted by the S-system model forHGPRT de®cient subjects (data not shown).
The case of HGPRT de®ciency also demonstrates that the inaccuracy in the¯ux stoichiometry of S-system models can become signi®cant for large devia-tions from the operating point. For example, we ®nd vx� 21.5 and vxd� 14.0,whereas the ¯ux of degradation of Xa is only 15.1. In the case of PRPPS super-activity, by contrast, the corresponding values in the S-system model arevx� 0.2832 and vxd� 4.2643, and the ¯ux of degradation of Xa is 4.4113, whichis reasonably consistent even for the 200% increase in the activity of PRPPS.
The GMA kinetic orders (f) also depend on the chosen operating point, andtheir values are determined by the steady state of the system. Similarly, the ki-netic parameters (KM ) in the CMM model are `apparent' KM s, and their valuescan vary with di�erent conditions of the system in vivo. It is di�cult to assesshow strongly GMA or CMM parameters are a�ected by such changes. TheGMA model, and to a lesser degree the CMM model, produces results thatare quite similar to those measured in patients. Nevertheless, only one pathwayis analyzed here, and further experimental and theoretical work is necessary toevaluate the reliability of these models in vivo.
Within the class of power-law models, S-system models have advantageswhen it comes to algebraic analysis. They are unique with respect to steady-state analysis [13] and optimization [53] and provide convenient tools for qual-itative analysis [54]. For moderate variations about the operating point, theiraccuracy is usually su�cient. Their lack of accuracy in modeling situationssuch as severe HGPRT de®ciency can be argued by asserting that an HGPRTde®cient subject constitutes a metabolic system that is vastly di�erent from nor-mal, and that a new operating point should be selected for modeling such dis-order. After all, a normal subject does not gradually become HGPRT de®cient.We tested this hypothesis by using the same S-system model for both normal
28 R. Curto et al. / Mathematical Biosciences 151 (1998) 1±49

and HGPRT de®cient subjects and adjusting the parameter values to either oneof the two steady states. As in the case of normal subjects, the S-system, theGMA, and the CMM models indeed produced very similar results for pertur-bations about the HGPRT de®cient steady state (not shown). For instance, allthree modeled perturbations in PRPP in a Lesch±Nyhan patient in a quantita-tively similar fashion.
5. Discussion
This paper served two purposes. The ®rst part was dedicated to screeningthe literature and extracting kinetic information that is necessary for any math-ematical modeling of purine metabolism. This quite laborious exercise com-prise both a conceptualization of the target system, which yield a scheme ofmetabolic relationships and regulatory signals, and an exhaustive search of rel-evant data. This process has been presented in detail so that future research canbuild upon it and replace current knowledge with new or ®ne-tuned results.
A large amount of material was collated, of which most is presented in Ap-pendix A. This material is considered an important contribution, since it is use-ful not only for reproducing our results but also for designing other models ofthis pathway. There is no doubt that much is unknown about the biochemistryof purine metabolism, and as new data become available, they can be graduallyincorporated into the parameter estimates presented here. Thus, the ®rst partof this paper is largely independent of a particular modeling framework, eventhough we concentrated on standard procedures of traditional enzyme kineticsand more modern methods of BST. Nonetheless, other modeling approacheswould require similar kinetic data.
The second part served the purpose of selecting a model for further analysis.While not shown, this was a several-year process involving numerous model re-visions and re®nements (for a detailed account, see Ref. [19]). At each stage,the current model was tested for consistency, stability, and robustness, and spe-ci®c re®nements were implemented to alleviate former problems. These re®ne-ments were usually introductions of ¯uxes or variables that had been assumedsecondary in previous versions. Particular care was applied to these re®ne-ments, in order to assure biological validity and relevance.
In this process, the analytical tools developed in BST, specially the compu-tation of parameter sensitivities and steady-state stability conditions, were fun-damental in identifying potential unrealistic assumptions in the model. While itwas not the purpose of this paper to provide detailed information about theprocess of designing the model, the process in itself revealed which variablesa�ect the global behavior of the model most signi®cantly. For example, the in-clusion of SAM, RNA and DNA turned out to be the key to improving therobustness of the model. Accounting for excretion of purines (vade, vhx, and
R. Curto et al. / Mathematical Biosciences 151 (1998) 1±49 29

vx) became critical, as it prevented the unphysiological accumulation of purinebases in several situations. By contrast, the addition of the ¯ux vpyr turned outto be almost inconsequential.
As in any modeling e�ort, we had to make several assumptions. The mostcritical are the following:
(i) The metabolites inside each pool were considered to be in equilibrium.Even though there is no real equilibrium between ATP and ADP (or otherpairs of adenylates), there is experimental evidence that the energy charge isfairly constant under di�erent physiological conditions. This suggested to con-sider ATP and ADP as if they were in equilibrium.
(ii) Several linear chains of reactions were lumped into single processes (e.g.,vden, vpolyam, and vtrans). This appeared to be legitimate, since it was demonstrat-ed that the properties of the linear chain are closely related to those of the ®rststep.
(iii) For this ®rst analysis, we ignored the physiological compartmentalizat-ion of the human body. This was done to avoid overwhelming complexity, butit is clear that the consequences of this simpli®cation should be analyzed. Be-cause at the level of the whole human body, this assumption seems more risky.However, it should be seen as a conceptual election so that we can approachthe analysis of purine metabolism as an integrated process. From the know-ledge gained following this strategy, further improvement could include di�er-ent compartments to produce a more realistic model.
Once a conceptual model was stablished, the challenge is to build up a math-ematical model that allow us: (i) to validate the conceptual model; (ii) to dis-cuss the system properties; and (iii) to predict speci®c features of the targetmetabolic pathway. The election of a particular framework for obtaining sucha model is a di�cult task. As a traditional standard, we attempted to develop aMichaelis±Menten model. However, this was not possible in a pure form, sincesome necessary information was simply not available in terms of kinetic pa-rameters which are the characteristic elements for these types of models. Wherepossible (about half the time), reactions were formulated as kinetic rate laws ofMichaelis±Menten type, and these were complemented with power-law kineticsin order to obtain a useable simulation tool. The lack of information, and thefact that our reactional scheme included di�erent processes that were not singleenzyme reactions but a pool of di�erent processes, suggested the use of model-ing strategies speci®cally devised for dealing with these situations. The S-sys-tem and GMA variants within BST were specially suited for this case.
Two types of power-law models were developed within the framework ofBST. The kinetic parameters for these models were either derived from kineticdata in vitro or directly from experimental concentration and ¯ux data andother qualitative information. The possibility of deriving useful estimation ofthe desired kinetic data from these assumption is one of the advantages ofthe modeling strategies in BST. Furthermore, the possibility of testing the mod-
30 R. Curto et al. / Mathematical Biosciences 151 (1998) 1±49

el sensitivity towards any of the considered parameters is a valuable help forchecking how critical is the choice of a particular parameter value from qual-itative assumptions. The resulting GMA and S-system models are robust to pa-rameter variation, so that the system properties would not signi®cantly changewith a slightly di�erent choice in the parameter values.
For relatively small variations in metabolites or in model structure, all threemodels behaved quite similarly, and all results appeared to be reasonable andin accord with biochemical and clinical ®ndings. The permissible ranges of de-viation from normal operating conditions appeared to be wide enough to coverall physiological and mildly pathological conditions.
As one can see in Tables 8 and 9 for severe pathological conditions, theGMA model produced reasonable results, even if the system deviated far fromthe operating range. This observation is quite amazing, since the GMA modelis based on local approximation. The GMA structure seems to cover a widerange of physiological and pathological conditions with one and the same nu-merical model, which was derived almost without further assumptions and ex-clusively from published data. Outside serendipity, a cautious explanation ofthis result may be that, for all practical purposes, metabolic processes in vivofollow power-law kinetics.
The results in Tables 8 and 9 are not only important for future decisionsabout model selection in similar situations, but they are biochemically importantin themselves. For example, Table 9 suggests the investigation of some conse-quences of HGPRT de®ciency that may not have been documented in the liter-ature, such as increases in Gua and in the ¯uxes vgua and vhxd. Some of theseissues are discussed elsewhere, but it is clear that models of the documented com-plexity will require further extensive experimental and mathematical evaluation.
Acknowledgements
This work was supported in part by a Grant from the Fondo de Investigaci-ones Sanitarias de la Seguridad Social (FISss 94/0860), and in part supportedby a grant from The Upjohn Company. R. Curto was funded, as a Ph.D. stu-dent, by CIRIT BQF92.
Appendix A
A.1. Estimates of kinetic parameters for each reaction of the pathway
vprpps: R5P + ATP ® PRPP + AMP
R. Curto et al. / Mathematical Biosciences 151 (1998) 1±49 31

PRPP (X1) inhibits its own formation. According to Ref. [82], PRPP in aconcentration of 1 mM inhibits vprpps at 19%. Thus,PRPPfprpps1 � 1ÿ 0:19and fprpps1 � ÿ0:03.
Ref. [82] also asserts that AMP and ADP in a concentration of 1 mM inhibitthe reaction at 53% and 92%, respectively. Applying the procedure shownabove, we obtain fprpps;AMP�)0.1 and fprpps;ADP�)0.36. Finally, ATP is a co-substrate of this reaction with a KM that is higher than 14 lM. Derivation andnormalization of Eq. (2), using this KM and the corresponding steady-stateconcentration for ATP (see Table 1), implies that fprpps;ATP� 14/(14 + 1900)� 0.007. As was explained before, fprpps4 is the sum of all kineticorders associated with metabolites that constitute X4: fprpps4�)0.45.
Metabolites of the guanylate pool also inhibit this reaction. Ref. [82] foundthat 1 mM of GMP or GDP inhibits the reaction at 3% or 24%, respectively.Thus, fprpps;GMP�)0.004, fprpps;GDP�)0.04, and fprpps8�)0.04.
According to Ref. [83], the apparent KM for phosphate is 3.3 mM, and thisyields fprpps18� 0.7.
With KM � 33 lM for R5P, [69,84], the kinetic equation for vprpps reads
vprpps � VVIVO�PRPPS� X17
KM � X17
Xfprpps1
1 Xfprpps4
4 Xfprpps8
8 Xfprpps18
18 :
vden:As explained in the text, the parameters of this step can be estimated from
the rate law of the ®rst enzyme of the de novo pathway, which is amid-ophosphoribosyltransferase. The reaction catalyzed by this enzyme is
PRPP� glutamine�H2O! bÿ5ÿphosphoribosyl-1-amine
� glutamic acid� PPi:
This reaction exhibits cooperative kinetics with respect to the substrate PRPP.According to Ref. [85], the KM of PRPP varies between 140 and 480 lM, andthe Hill coe�cient (n) between 2 and 3, depending on the tissue. We selected thevalues KM � 300 and n� 2.2.
Ref. [86] demonstrated that GMP, GDP and GTP in a concentration of5 mM inhibit the reaction at 70%, 40% and 13%, respectively. This impliesfden;GMP�)0.1413, fden;GDP�)0.06, and fden;GTP�)0.016. Adding these valuesyields fden8�)0.2.
Constituents of the adenylate pool also a�ect the reaction: AMP, ADP andATP inhibit at 76%, 40% and 21%, respectively [86]. These results suggestfden;AMP�)0.1675, fden;ADP�)0.06, and fden;ATP�)0.028, which yields essen-tially fden4�)0.25.
5 mM IMP inhibits the reaction at 41% [86]. This yields fden2�)0.06.Ref. [87] showed that Pi inhibits vden by changing the Hill coe�cient of
PRPP for this kinetics, taking the values of Hill coe�cients reported at 0,
32 R. Curto et al. / Mathematical Biosciences 151 (1998) 1±49
25, and 50 mM, one obtains the strength of inhibition of Pi at these concentra-tions, which suggests fden18�)0.08.
Summarizing these data, we obtain the complete kinetic rate law
vden � VVIVO�DEN� X n1
KM � X n1
X fden2
2 X fden4
4 X fden8
8 X fden18
18 :
vgprt: Gua + PRPP ® GMP + PPiThis enzyme is reversible. However, it is thought that the enzyme in vivo
only catalyzes the reaction in the direction indicated above. To account forthese uncertainties, we considered the reaction as essentially irreversible, but al-lowed for inhibition by the product GMP. The kinetic rate law was thus rep-resented as suggested by Ref. [88]
vgprt �VVIVO�GPRT� ABÿ PQ KiAKiB
KiPKiQ
� �KBKiA �AKB � BKA �AB� P KiAKB
KiP�Q KBKiA
KiQ� PQ KiAKB
KiQKP
� ABP 1KiP
� �� BPQ KA
KiQKP�AP KB
KiP� BQ KA
KiQ
:
In this formulation, A, B, P, and Q code for PRPP, Gua, Pyrophosphate andGMP, respectively. Their concentrations were estimated at the operating point.For pyrophosphate, the concentration was set as 15 lM [89], and the KA, KB,KiP, and KiQ were set as 240, 4, 2100, and 1.25 lM. The remaining three param-eters, KP, KiA and KiB could not be estimated from data. However, it turned outthat KP has almost no in¯uence on the system (results not shown), and we se-lected a value of KP� 1000 lM. KiA and KiB are the inhibition constants ofPRPP and Gua, respectively. These again had little e�ect on the results, andwe selected values of KiA and KiB� 4 and 1 lM, respectively, which are closeto the concentrations of the associated metabolites.
vhprt: HX + PRPP ® PPi + IMPThis reaction and the vgprt reaction are catalyzed by the same enzyme, hypo-
xanthine-guanine phosphoribosyltransferase (HGPRT). The same questionsabout reversibility apply, and they are handled in the same fashion. An appro-priate rate law, according to Ref. [90], is
vhprt �VVIVO�HPRT� ABÿ VrKiBKA
Vf KiQKPPQ
� �KiBKA
KiAKiQKPAPQ� KiBKA
KiQKPPQ� KB
KiPAP� KB
KiQQA�AB� KiBKA
KiPP� KiBKA
KiQQ
�KBA� KAB� KAKiB
:
The symbols A, B, P, and Q represent HX, PRPP, IMP and Pyrophosphate,respectively, and the constants KA, KB, KP, KQ, KiB, KiP, KiQ are 7.7, 66, 5.8,39, 25, 40, and 260 lM. The constant KiA has not been experimentally deter-mined. However, because model evaluations demonstrate that outputs are
R. Curto et al. / Mathematical Biosciences 151 (1998) 1±49 33

practically una�ected when the parameter KiA is varied between 1 and 200, weused a KiA� 10 lM [1] and a concentration of 15 lM for PPi [89].
vaprt: Ade + PRPP ® AMP + PPiThis enzyme is similar in type to hypoxanthine-guanine phosphoribosyl-
transferase. It also could possibly catalyze a reversible reaction, although thereverse reaction seems irrelevant in vivo. To account for this uncertainty, inhi-bition of the product AMP has been included.
The substrate PRPP has a KM close to 6 lM [29,91,92], and we selectKM � 5 lM.
The KM for Ade has values between 1.1 and 5.2 lM [29,91,92]. This impliesfaprt;Ade between 0.5 and 0.83, and we set faprt6� 0.75.
The Ki for AMP is between 7.5 and 30 lM [29,93]. Inhibition is competitivewith respect to PRPP, and this suggests that faprt;AMP should range between)0.76 and )0.96. Selecting faprt4�)0.8, we obtain the rate law
vaprt � VVIVO�APRT� X1
X1 � KMX faprt6
6 X faprt4
4 :
vpyr:Because the initial enzyme in the synthesis of pyrimidines is also a phosphor-
ibosyltransferase, it seems reasonable to assume that its kinetic parameters aresimilar to those of vhprt, vgprt or vaprt. We roughly estimated the value of fpyr1 asan average of fgprt1, fhprt1, and faprt1, which yielded fpyr1� 1.27. It is shown else-where [19] that sensitivities of variables to this parameter have low values. Thekinetic properties of this step are re¯ected in the power function rate law
vpyr � apyr Xfpyr1
1 :
vimpd: IMP + NAD + H2O ® XMP + NADHRef. [94] published a table of KM values for this enzyme in di�erent tissues:
for example, in Yoshida tumor cells 12 lM, in human placenta 14 lM, and inhuman leukemia cells 23 lM. For our model, we chose an average value ofKM � 17.
XMP and GMP inhibit the enzyme by competing with IMP. The Ki forXMP is 25 lM and for GMP it is 90 lM [94,95]. The kinetic rate law for com-petitive inhibition suggests fimpd;GMP�)0.03 and, thus, fimpd8�)0.03.
vimpd � VVIVO�IMPD�X2
KM 1� X71
KI�XMP�
� �� X2
Xfimpd8
8 :
vgmps: XMP + ATP + glutamine ® GMP + AMP + PPi + glutamateThe published value of KM � 270 lM for ATP [96] suggests the parameter
value fgmps4� 0.12. Moreover, the KM for XMP is 4.9 lM [96], which yieldsthe kinetic equation
34 R. Curto et al. / Mathematical Biosciences 151 (1998) 1±49
vgmps � VVIVO�GMPS� X7
X7 � KMX
fgmps4
4 :
vasuc: IMP + L-aspartate + GTP ® S-AMP + GDP + PiThe enzyme comes in the form of two isoenzymes (L and M) that have dif-
ferent kinetic characteristics [97]. A rigorous assessment of the contributions ofeach isozyme is di�cult, and we use an average of KM � 66.6 [97,98]. GTP andAsp are cosubstrates for this reaction. Aspartate is not included in the model,but an average KM for GTP [97,98] suggests fasuc;GTP� 0.2, and thus fasuc8� 0.2.
Adenylates in general, and AMP in particular inhibit this reaction compet-itively with respect to IMP. Using a Ki value of 170 lM for AMP and a KM of37 lM for IMP [98] in the traditional rate law for competitive inhibition, oneobtains fasuc;AMP�)0.24 and, thus, fasuc4�)0.24.
Finally, Pi in concentrations of 2 or 20 mM inhibits the enzyme at 20% and59%, respectively [99]. This is represented with the parameter settingfasuc18�)0.05.
Summarizing these results, an appropriate rate law is
vasuc � VVIVO�ASUC� X2
KM � X2
X fasuc4
4 X fasuc8
8 X fasuc18
18 :
vasli:This enzyme catalyzes two reactions of purine metabolism. One of them, the
reaction of vasli, is speci®cally depicted in Fig. 1.
S-AMP ® AMP + fumarateAMP acts as a competitive inhibitor of the enzyme with a Ki of 9.2 lM for
AMP [100]. With KM � 1.79 lM for S-AMP [100], the appropriate kinetic ratelaw is
vasli � VVIVO�ASLI� X3
KM 1� X40:08KI
� �� X3
:
The second reaction constitutes one of the steps in the ten step pathway ofde novo purine synthesis (vden). This reaction is rather insigni®cant, and we donot consider it here.
vgmpr: GMP + NADPH M IMP + NADP + NH3
The substrate GMP has a KM of 7.5 lM [101], which corresponds tofgmpr;GMP� 0.23. This e�ect of a guanylate is augmented by the activation ofthe enzyme by GDP and GTP. 2 lM of GTP or GDP activate the enzymeat 22% or 13%, respectively [101]. Thus, fgmpr;GTP� 0.29 and fgmpr;GDP� 0.18which, added to fgmpr;GMP, yields fgmpr8� 0.7. XMP is a potent inhibitor ofthe enzyme: 33 lM of XMP inhibit the enzyme at 93% [102]. This is repre-sented with the setting fgmpr7�)0.76.
R. Curto et al. / Mathematical Biosciences 151 (1998) 1±49 35
vgmpr is a reversible step, in which the product (IMP) inhibits the enzyme.IMP in a concentration of 33 lM inhibits the enzyme at 30%, and 330 lM in-hibits at 70% [102], which suggests a value for fgmpr2 between )0.1 and )0.2. Weuse the average fgmpr2�)0.15.
Adenylates inhibit the enzyme less strongly than guanylates. In a concentra-tion of 33 lM, AMP inhibits the enzyme at 5%, ADP at 7% and ATP at 11%[102]. This implies fgmpr;AMP�)0.01; fgmpr;ADP�)0.02, fgmpr;ATP�)0.04, andfgmpr4�)0.07.
The kinetic rate law of this reaction in power-law form is thus
vgmpr � agmpr Xfgmpr2
2 Xfgmpr4
4 X fgmpr7
7 Xfgmpr8
8 :
vampd: AMP ® IMP + NH3
This enzyme exhibits cooperativity with respect to its substrate AMP. Thissuggests a Hill rate law whose parameters are appropriately chosen asKM � 2300 lM and n� 1.4 [103±106]. GTP inhibits the enzyme, thereby a�ect-ing the apparent KM and n [105]. The result is a smaller reaction rate with anapproximate kinetic order fampd8�)0.03.
Pi is an inhibitor of this enzyme with a Ki of 16 mM in human kidney [106].2.5 mM of Pi decrease the ¯ux from 24.79 to 13.71 in human heart [105], and1.8 mM inhibit the reaction in human erythrocytes by 50% [104]. These datacorrespond to kinetic orders of fampd18 of )0.08, )0.075, and )0.1, respectively,and we specify the parameter as fampd18�)0.1.
The appropriate kinetic rate law is thus
vampd � VVIVO�AMPD��X4 0:08�nKM � �X4 0:08�n X
fampd8
8 Xfampd18
18 :
vmat: methionine + ATP ® SAM + Pi + PPiThe KM of this enzyme for ATP is 450 lM [63]. The enzyme is inhibited un-
competitively by SAM with a Ki between 2 and 2.9 lM [63], which suggests akinetic order of fmat5�)0.6. The kinetic rate law is thus
vmat � VVIVO�MAT� X4 0:76
X4 0:76� KMX fmat5
5 :
vtrans: protein + SAM ® methylated protein + S-adenosyl-L-homocysteineFor this transmethylation pathway we use the kinetic parameters of the ®rst
enzyme (protein carboxyl methyl transferase) which has a KM for SAM of 2 lM[63,107]. This yields the following rate law:
vtrans � VVIVO�TRANS� X5
KM � X5
:
36 R. Curto et al. / Mathematical Biosciences 151 (1998) 1±49

vpolyam:This pathway, like vden and vtrans, includes several enzymes. As discussed be-
fore, it is justi®ed to use the kinetics of the ®rst enzyme in the pathway (S-ad-enosyl-methionine decarboxylase) which catalyzes the step
SAM ® decarboxilated SAMDecarboxylated SAM is subsequently transformed into 5-methylthioadeno-
sine, which in turn is the substrate for the linear polyamine pathway that even-tually produces Ade. The KM of SAM decarboxylase for SAM is 50 lM [108].This yields the kinetic rate law
vpolyam � VVIVO�POLYAM� X5
KM � X5
:
vinuc: IMP + H2O ® Ino + PiThere is a large variety of 50-nucleotidases. Among them, the 50-nu-
cleotidases (E.C. 3.1.3.5.) hydrolyze nucleotides to nucleosides with some resid-ual activity for hydrolyzing deoxynucleotides. Others (50(30)-nucleotidasesE.C.3.1.3.31.) hydrolyze deoxynucleotides to deoxynucleosides with some re-sidual activity for hydrolyzing nucleotides. The nucleotidases determine the ki-netic parameters vinuc, vgnuc, and vdgnuc. Among the 50-nucleotidases, severalsubkinds need to be distinguished. The ecto 50-nucleotidases have a high speci-®city for AMP and a lesser speci®city for IMP and GMP, whereas the cytosolic50-nucleotidases have a higher speci®city for IMP and GMP. For our purposes,we focussed on the kinetic parameters of the more relevant cytosolic 50-nu-cleotidase-II for vinuc and vgnuc [109]. Assuming a Michaelis±Menten mecha-nism, the values of KM of this enzyme for IMP are somewhat higher than400 lM [109±111].
Pi is an inhibitor of the enzyme: 1 mM Pi increases the KM from 200 to4800 lM, [111], which corresponds to a concomitant tenfold decrease in the¯ux rate, thus suggesting finuc18�)0.36. Based on these experimental data,the appropriate kinetic rate law is
vinuc � VVIVO�INUC� X2
KM � X2
X finuc18
18 :
vgnuc: GMP + H2O ® Guo + PiFor this enzyme we also assume a Michaelis±Menten mechanism with the
kinetic parameters of cytosolic 50-nucleotidase-II. Data [109±111] suggest aKM for GMP of about 700 lM.
Pi inhibits this enzyme, changing the KM from 700 to 7900 lM [111]. Theappropriate kinetic order is fgnuc18�)0.34, and the resulting rate law is
vgnuc � VVIVO�GNUC� X8 0:0625
X8 0:0625� KMX
fgnuc18
18 :
R. Curto et al. / Mathematical Biosciences 151 (1998) 1±49 37

vdgnuc: dGMP + H2O ® dGuo + PiAgain, we assume a Michaelis±Menten mechanism with kinetic parameters
for 50(30)-nucleotidases, because it seems that this enzyme catalyzes the reactionin vivo. The KM of this enzyme for dGMP is very high, with a value over3.3 mM [112]. This yields the following rate law:
vdgnuc � VVIVO�DGNUC� X10 0:0333
KM � X10 0:0333:
vgdrnr: GDP + NADPH ® dGDP + NADP + H2ODiribonucleotide reductase is an allosteric enzyme that is modulated by
deoxynucleotides. There are di�erent kinds of this enzyme, but the human en-zyme is in the same class with that of other mammals and of E.coli. The esti-mation of kinetic orders was based on data from calf thymus [113].
The KM of this enzyme for GDP is 50 lM [113]. dATP is a potent inhibitorof this reaction, but its kinetic order is di�cult to estimate. We used the equa-tion fgdrnr;dATP� d(log vgdrnr)/d ([dATP]) [dATP]0 to estimate it, and with nu-merical values obtained from [113], we obtained the kinetic order fgdrnr9�)1.2.
Similarly, dGTP is an inhibitor whose kinetic order is di�cult to estimate.Again using data from the study by Ref. [113], we graphed the logarithm ofvgdrnr against the logarithm of the concentration [dGTP]. After removing ob-vious outliers, the slope of the regression line was )0.39, with a correlation co-e�cient of 0.9999. Hence, fgdrnr10�)0.39.
The appropriate kinetic rate law is
vgdrnr � VVIVO�GDRNR� X8 0:1875
KM � X8 0:1875X
fgdrnr9
9 Xfgdrnr10
10 :
vadrnr: ADP + NADPH ® dADP + NADP + H2OThe same enzyme catalyzes vadrnr and vgdrnr, but the kinetics of the reactions
di�er quite signi®cantly. According to Ref. [113], the KM for ADP is about44 lM. 5 lM of dATP inhibits vadrnr at 50% [113], and this produces an ap-proximate kinetic order of fadrnr9�)0.3.
dGTP in this case acts as an activator of the reaction. Its kinetic order wasestimated from Ref. [113] as fadrnr;dGTP� d(log vadrnr)/d(log [dGTP])� 0.87.Thus, fadrnr10� 0.87.
The resulting rate law is
vadrnr � VVIVO�ADRNR� X4 0:16
X4 0:16� KMX fadrnr9
9 X fadrnr10
10 :
vada: Ado ® Ino + NH3
Adenosine deaminase (ADA) is an irreversible enzyme that catalyzes thedeamination of Ado to Ino and of dAdo to dIno. The enzyme apparently isubiquitous in all species and tissues, with KM 's for Ado in humans that range
38 R. Curto et al. / Mathematical Biosciences 151 (1998) 1±49

between 17 and 100 lM [30,31,114]. We selected a value of KM � 20 lM for thefollowing rate law:
vada � VVIVO�ADA� X4 0:0002
X4 0:0002� KM:
vdada: dAdo ® dIno + NH3
This reaction is also catalyzed by ADA, with a KM for dAdo of 38 lM [114].This yields the rate law
vdada � VVIVO�DADA� X4 0:016
X4 0:016� KM:
varna and vgrna:The RNA nucleotidyltransferase adds nucleotides to the RNA strands, fol-
lowing the reaction(ATP or GTP) + RNAn ® PPi + RNAn�1
Because both ¯uxes produce essentially the same product, the kinetics ofthese ¯uxes are constrained to be the same except for their rate constants. Spe-ci®cally, to preserve the stoichiometric composition of RNA, VVIVO in varna
must be 32
times that in vgrna. Because the kinetic parameters of these two ¯uxesmust be equal, the same kinetic orders frnap4 and frnap8 (referring to the forma-tion of RNA by RNA polymerase) are used in the GMA rate law of the tworeactions varna and vgrna. The KM s for ATP and GTP are 100 and 45 lM, res-pectively [115]. These data su�ce to determine power-law kinetic orders, but aswas commented in the text, power-law parameters are insu�cient to determineMichaelis±Menten parameters. In this case we need to determine Michaelis±Menten parameters for a bisubstrate enzyme,
varna VVIVO�ARNA�or � or X4 0:76 X8 0:75
KM�KA X4 0:76�KG X8 0:75�KC X8 0:75 X4 0:76
vgrna VVIVO�GRNA�:
We still have two degrees of freedom in determining the kinetic parametersof this reaction, so two additional constraints are needed, and we set KM andKC � 1 lM. With these speci®cations, we obtain the values KA� 47.5 andKG� 115.9.
vrnaa and vrnag:Several enzymes hydrolyze nucleic acids to nucleotides and deoxynucleo-
tides: 5030-exonucleases, 3050-exonucleases, endonucleases, H ribonuclease,and some other unspeci®c enzymes. The reactions, catalyzed by any of theseenzymes, do not have exactly the same stoichiometry. Because the ratio Ade/Gua in RNA is constant, the kinetics of Ade and Gua must be equal, exceptin the values of their rate constants, as was the case for varna and vgrna. Here,the kinetic order representing the degradation of RNA is called frnan11. We
R. Curto et al. / Mathematical Biosciences 151 (1998) 1±49 39
set the value for this kinetic order as frnan11� 1. This parameter is discussedelsewhere [19] in more detail, and it is su�cient to note here that changes inthis parameter do not a�ect the behavior of the system much. The power func-tion rate law for this step of the pathway is
vrnaa VVIVO�RNAA�or � or X frnan11
11 :vrnag VVIVO�RNAG�
vadna and vgdna: (dATP or dGTP) + DNAn ® PPi + DNAn�1
This enzyme adds deoxynucleotides to DNA strands, and because the ratioof added dATP and dGTP is constrained by the structure of DNA, the corre-sponding rate law must be equal except for the rate constants, as was discussedin the preceding case. The kinetic orders used in the two reactions are calledfdnap9 and fdnap10. The KM s for dATP and dGTP are 3 and 1.2 lM, respectively[116]. Still, there are two degrees of freedom in the kinetic rate law for thesebisubstrate reactions, and we set KM and KC � 1 lM. With these speci®cations,we obtain the parameter values KA� 2.58 lM and KG� 5.54 lM in the follow-ing rate law:
vadna VVIVO�ADNA�or � or X9 0:66 X10 0:8
KM�KA X9 0:66�KG X10 0:8�KC X9 0:8 X10 0:66
vgdna VVIVO�GDNA�:
vdnaa and vdnag:These two ¯uxes are constrained and pose the same estimation problems as
the degradation of RNA (see above). We made the same assumptions, specify-ing fdnan12� 1 for both kinetic rate laws. This parameter is discussed further inRef. [19]. The rate law for this step is thus
vdnaaVVIVO�DNAA�or � or X fdnan11
11 :vdnag VVIVO�DNAG�
vhxd: HX + H2O + (NAD or O2) ® Xa + (NADH or H2O2)The conversion of HX to Xa and subsequently to UA is irreversibly cata-
lyzed by the enzyme xanthine oxidase, if oxygen is used as the electron acceptor,or by xanthine dehydrogenase, if NAD is the electron acceptor. These two en-zymatic activities are carried out by the same protein which can switch fromone catalytic activity to the other. In humans, the two reactions take place onlyin liver and gut, and there is no agreement about which of the activities is moresigni®cant in vivo: Some references [33] purport that the main activity rests withxanthine dehydrogenase, while others [20] consider xanthine oxidase as moreimportant in vivo. For our models, we set the KM value of this enzyme with res-pect to HX as 13 lM (cf. [117]), which yields Michaelis±Menten reaction
40 R. Curto et al. / Mathematical Biosciences 151 (1998) 1±49

vhxd � VVIVO�HXD� X13 0:7
X13 0:7� KM:
vxd: Xa + H2O + (NAD or O2) ® UA + (NADH or H2O2)This reaction is catalyzed by the same enzyme as vhxd. The KM s of the en-
zyme for Xa are 15.5 and 3 lM for human gut and human liver, respectively[118], and we set KM � 6 lM in the Michaelis±Menten rate law
vxd � VVIVO�XD� X14
X14 � KM:
vgua: Gua + H2O ® Xa + NH3
Guanase or guanine aminohydrolase is believed to be a Michaelian enzymewith a KM for the substrate Gua of 0.56 lM in human erythrocytes [57]. Thisvalue has been used for the Michaelis±Menten rate law
vgua � VVIVO�GUA� X15 0:1
X15 0:1� KM:
vade:This ¯ux represents the oxidation of Ade to 2,8-dihydroxyadenine and the
excretion of this end product and of Ade in urine. When we take values mea-sured in vivo [65] and plot the logarithm of adenine metabolite excretionagainst the logarithm of plasma adenine concentration (see Fig. 3(a)) we ob-tain a reasonably straight line with a slope equal to fade6. The kinetic order thusdetermined is fade6� 0.55, and the rate law is
vade � aade X fade6
6 :
vhx:This ¯ux represents excretion of HX in urine and is not an enzymatic rate.
We can estimate its parameter values by solving a system of two equations. Inevery steady state these values have to satisfy the condition vhx � ahx X fhx13
13 .Also, we know that at our operating point [HX] � 7 lM and vHX� 0.05lmol minÿ1 BWÿ1. Furthermore, it is known that in Lesch±Nyhan patients[HX] is about 50 lM and vHX is over 0.45 lM minÿ1 BWÿ1 [80]. Substitutionof these data and solving the equations results in the kinetic order fhx13� 1.12.The rate law thus is
vhx � ahx X fhx13
13 :
vx:This ¯ux represents excretion of Xa in urine. As in the previous case of vhx, its
kinetic order has been determined from two equations at the operating point,one with Xa� 5 lM and vx� 0.03 lmol minÿ1 BWÿ1 for healthy subjects, andthe other with Xa of about 15 lM and vx of about 0.27 lmol minÿ1 BWÿ1
R. Curto et al. / Mathematical Biosciences 151 (1998) 1±49 41
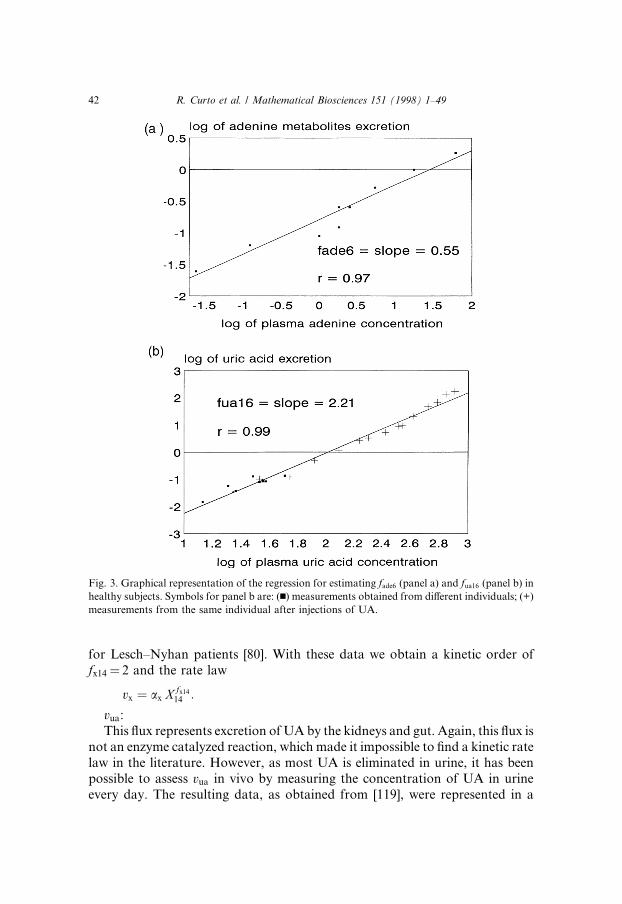
for Lesch±Nyhan patients [80]. With these data we obtain a kinetic order offx14� 2 and the rate law
vx � ax X fx14
14 :
vua:This ¯ux represents excretion of UA by the kidneys and gut. Again, this ¯ux is
not an enzyme catalyzed reaction, which made it impossible to ®nd a kinetic ratelaw in the literature. However, as most UA is eliminated in urine, it has beenpossible to assess vua in vivo by measuring the concentration of UA in urineevery day. The resulting data, as obtained from [119], were represented in a
Fig. 3. Graphical representation of the regression for estimating fade6 (panel a) and fua16 (panel b) in
healthy subjects. Symbols for panel b are: (n) measurements obtained from di�erent individuals; (+)
measurements from the same individual after injections of UA.
42 R. Curto et al. / Mathematical Biosciences 151 (1998) 1±49

log±log plot (Fig. 3(b)) in which the slope corresponds to fua16, with the numer-ical value fua16� 2.21. The Y axis in this plot does not represent the logarithmof total concentration of UA in the human body, because these data were notavailable. Instead, it represents the logarithm of plasma UA concentration,which is assumed to be proportional to the total concentration in the humanbody, and thus leads to the same slope. The appropriate rate law is
vua � aua X fua16
16 :
We have demonstrated in this section how one can construct a CMM modelfrom kinetic parameters and other information found in the literature. Byshowing almost all steps of estimation, this section can easily be extended,amended, or recti®ed as new data become available. The CMM estimates pro-vided the basis for the pure power-law models in GMA and S-system form. Toconstruct the GMA model, we applied Eq. (4) to the CMM rate laws for all¯uxes. The resulting kinetic orders of the GMA model are shown in Table 4.Subsequent application of Eq. (6) to each process of synthesis or degradationthen yielded the kinetic orders of the corresponding S-system model. These re-sults are shown in Table 5.
A.2. Estimated values of rate constants and Vvivo
The last set of parameters that need to be estimated for the three modelsconsists of rate constants in GMA and S-system and Vvivo in CMM. To esti-mate these parameters we need all previously determined parameter values,as well as the concentrations of all metabolites and the ¯ux rates at the oper-ating point. These pieces of information allow us to solve one equation for eachrate law in which either the rate constant or Vvivo is the only unknown. Resultsfor CMM and GMA models are given in Table 6, and results for the S-systemmodel in Table 7.
References
[1] R. Franco, E.I. Canela, Computer simulation of purine metabolism, European J. Biochem.
144 (1984) 305.
[2] F. Heinmets, Supercomputer analysis of purine and pyrimidine metabolism leading to DNA-
Synthesis, Cell Biophys. 14 (1989) 283.
[3] T. Bartel, H. Holzh�utter, Mathematical modelling of the purine metabolism of the rat liver,
Biochim. Biophys. Acta 1035 (1990) 331.
[4] P. Fritzson, Regulation of nucleotidase activities in animal tisues, Adv. Enzyme Regul. 16
(1978) 43.
[5] J.B. Pritchard, F. Chavez-Peon, R.D. Berlin, Purines: supply by liver to tissues., Am. J.
Physiol. 219 (1970) 1263.
[6] R.A. Lewis, R.K. Haag, Purine nucleoside phosphorilase of bovine liver mithochondria,
Adv. Exp. Med. Biol. B 309 (1991) 181.
R. Curto et al. / Mathematical Biosciences 151 (1998) 1±49 43

[7] M.A. Savageau, Biochemical systems analysis. I. Some mathematical properties of the rate
law for the component enzymatic reactions, J. Theoret. Biol. 25 (1969) 365.
[8] M.A. Savageau, Biochemical systems analysis II. Steady state solutions for an n-poll system
using a power-law approximation, J. Theoret. Biol. 25 (1969) 370.
[9] E.O. Voit (Ed.), Canonical Nonlinear Modeling: S-system Approach to Understanding
Complexity, Van Nostrand Reinhold, New York, 1991.
[10] R. Curto, A. Sorribas, M. Cascante, Comparative characterization of the fermentation
pathway of Saccharomyces cerevisiae using biochemical systems theory and metabolic
control analysis: model de®nition and nomenclature, Math. Biosci. 130 (1995) 25.
[11] M. Cascante, R. Curto, A. Sorribas, Comparative characterization of the fermentation
pathway of saccharomyces cerevisiae using biochemical systems theory and metabolic control
analysis: steady-state analysys, Math. Biosci. 130 (1995) 51.
[12] A. Sorribas, R. Curto, M. Cascante, Comparative characterization of the fermentation
pathway of Saccharomyces cerevisiae using biochemical systems theory and metabolic
control analysys: model validation and dynamic behaviour, Math. Biosci. 130 (1995) 71.
[13] M.A. Savageau, Biochemical systems analysis: a study of function and design in molecular
biology, Addison-Wesley, Reading, MA, 1976.
[14] E.O. Voit, M.A. Savageau, Accuracy of alternative representations for integrated biochem-
ical systems, Biochemistry 26 (1987) 6869.
[15] L. Michaelis, M.L. Menten, Die Kinetik der Invertinwirkung, Biochem. Z. 49 (1913) 333.
[16] M.A. Savageau, E.O. Voit, D.H. Irvine, Biochemical systems theory and metabolic control
theory: 1. Fundamental similarities and di�erences, Math. Biosc. 86 (1987) 127.
[17] M.A. Savageau, E.O. Voit, D.H. Irvine, Biochemical systems theory and metabolic control
theory: 2. The role of sumation and connectivity relationships, Math. Biosc. 86 (1987) 147.
[18] F.O. Ho�man, J.S. Hammonds, Propagation of uncertainty in risk assessments: the need to
distinguish between uncertainty due to lack of knowledge and uncertainty due to variability,
Risk Analysis 14 (5) (1994) 707.
[19] R. Curto, The usefulness of mathematical models in biotechnological and clinical studies:
analysis of ethanolic fermentation pathway in Saccharomyces cerevisiae and purine
metabolism in humans, Universitat de Barcelona, 1996.
[20] T.D. Palella, I.H. Fox, Hyperuricemia and gout in: C.R. Scriver, A.L. Beaudet, W.S. Sly, D.
Valle (Ed.), The Metabolic Basis of Inherited Disease, McGraw-Hill, New York, 1989, p.
965.
[21] M.J. Bradford, I.H. Krako�, R. Leeper, M.E. Balis, Study of purine metabolism in a
xanthinuric female, J. Clin. Invest. 47 (1968) 1325.
[22] N.L. Edwards, D. Recker, I.H. Fox, Overproduction of uric acid in hypoxanthine-guanine
phosphoribosyltransferase de®ciency, J. Clin. Invest. 63 (1979) 922.
[23] T. Page, W.L. Nyhan, A.L. Yu, J. Yu, A syndrome of megaloblastic anemia, inmunode-
®ciency, and exesive nucleotide degradation, Adv. Exp. Med. Biol. 309B (1991) 345.
[24] J.H. Ayvazian, S. Skupp, The study of purine utilization and excretion in a xanthinuric man,
J. Clin. Invest. 44 (1965) 1248.
[25] J.H. Ayvazian, S. Skupp, Study of the utilization and excretion of dietary purines in a
xanthinuric man, J. Clin. Invest. 45 (1966) 1859.
[26] F.F. Snyder, J.F. Henderson, Alternative pathways of deoxyadenosine and adenosine
metabolism, J. Biol. Chem. 248 (1973) 5899.
[27] M.S. Hersh®eld, J.E. Seegmiller, Regulation of de novo purine biosynthesis in human
lymphoblasts, J. Biol. Chem. 251 (1976) 7348.
[28] K.J. Van Acker, H.A. Simonds, C. Potter, J.S. Cameron, Complete de®ciency of adenine
phosphoribosyltransferase, N. Engl. J. Med. 297 (1977) 127.
[29] H.A. Simmonds, A.S. Sahota, K.J. Van Acker, Adenine phosphoribosyltransferase
de®ciency and 2,8-dihydroxyadenine lithiasis, in: C.R. Scriver, A.L. Beaudet, W.S. Sly, D.
44 R. Curto et al. / Mathematical Biosciences 151 (1998) 1±49
Valle (Eds.), The Metabolic Basis of Inherited Disease, McGraw-Hill, New York, 1989,
p. 1029.
[30] J.D. Geiger, J.I. Nagy, Adenosine deaminase and [3H] nitrobenzylthioinosine as markers
of adenosine metabolism and transport in central purinergic systems, in: M. Williams
(Ed.), Adenosine and Adenosine Receptors, Humanae Press, Clifton, New Jersey, 1990, p.
225.
[31] N.M. Kredich, M.S. Hers®eld, Immunode®ciency diseases caused by adenosine deaminase
de®ciency and Purine nucleoside phosphorylase de®ciency, in: C.R. Scriver, A.L. Beaudet,
W.S. Sly, D. Valle (Ed.), The Metabolic Basis of Inherited Disease, McGraw-Hill, New York,
1989, p. 1045.
[32] F. Bontemps, G. Van den Berghe, H.G. Hers, Evidence for a substrate cycle between AMP
and adenosine in isolated hepatocytes, Proc. Natl. Acad. Sci. USA 80 (1983) 2829.
[33] E.W. Holmes, J.B. Wyngaarden, Hereditary xanthinuria, in: C.R. Scriver, A.L. Beaudet,
W.S. Sly, D. Valle (Ed.), The Metabolic Basis of Inherited Disease, McGraw-Hill, New York,
1989, p. 1085.
[34] H. Kather, Pathways of purine metabolism in human adipocytes ± Further evidence against a
role of adenosine as an endogenous regulator of human fat-cell function, J. Biol. Chem. 265
(1990) 96.
[35] H.R. Horton, L.A. Moran, R.S. Ochs, J.D. Rawn, K.G. Scrimgeour, Transcription and the
Processing of RNA, in: H.R. Horton, L.A. Moran, R.S. Ochs, J.D. Rawn, K.G. Scrimgeour
(Ed.), Principles of Biochemistry, Prentice-Hall, New Jersey, ch. 21, 1993.
[36] G. Sander, H. Topp, G. Heller-Sch�och, J. Wieland, G. Sch�och, Ribonucleic acid turnover in
man: RNA catabolites in urine as measure for the metabolism of each of the three major
species of RNA, Clin. Sci. 71 (1986) 367.
[37] M. Cascante, R. Franco, E.I. Canela, Sensitivity analysis. A common foundation of theories
for the quantitative study of metabolic control, in: E.O. Voit (Ed.), Canonical Nonlinear
Modeling. S-System Approach to Understanding Complexity, Van Nostrand Reinhold, New
York, 1991, pp. 76.
[38] M.A. Savageau, A. Sorribas, Constraints among molecular and systemic properties ±
Implications for physiological genetics, J. Theoret. Biol. 141 (1989) 93.
[39] C.M. Hill, R.D. Waight, W.G. Bardsley, Does any enzyme follow the Michaelis±Menten
equation?, Molec. Cell. Biochem. 15 (1977) 173.
[40] M.A. Savageau, Critique of the enzymologists test tube, in: E. Bittar (Ed.), Foundations of
Medical Cell Biology, Jai Press, Greenwich, CT, 1992, pp. 45.
[41] M.A. Savageau, Michaelis±Menten mechanism reconsidered: implications of fractal kinetics,
J. Theoret. Biol. 176 (1995) 115.
[42] Peschel, The Predator±Prey Model: Do We Live in a Volterra World? Akademie-Verlag,
Berlin, 1986.
[43] M.A. Savageau, Cascaded enzymatic mechanisms in: M.A. Savageau (Ed.), Biochemical
Systems Analysis: A Study of Function and Design in Molecular Biology, Addison-Wesley,
London, 1976, p. 217.
[44] M.A. Savageau, Mechanisms of gene action, in: M.A. Savageau (Ed.), Biochemical Systems
Analysis: A Study of Function and Design in Molecular Biology, Addison-Wesley, London,
1976, p. 235.
[45] M.A. Savageau, Enzyme kinetics in vitro and in vivo: Michaelis±Menten revisited, in: E.E.
Bittar (Ed.), Principles of Medical Biology, Jai Press, Greenwich. Connecticut, 1995, p. 93.
[46] J.A. Roels, Energetics and Kinetics in Biotechnology, Elsevier, Amsterdam, 1983.
[47] J.S. Newhouse, R. Kopleman, Reaction kinetics on clusters and islands, J. Chem. Phys. 85
(1986) 6804.
[48] E. Kohen, C. Khoen, B. Thorell, G. Wagner, Quantitative aspects of rapid micro¯uorometry
for the study of enzyme reactions and transport mechanisms in single living cells, in: A.A.
R. Curto et al. / Mathematical Biosciences 151 (1998) 1±49 45

Thaer, M. Sernetz (Ed.), Fluorescence Techniches in Cell Biology, Springer, New York, 1973,
p. 207.
[49] E. Kohen, B. Thorell, C. Khoen, J.M. Solmon, Studies of metabolic events in localized
compartments of the living cell by rapid microspectro-¯uorometry, Adv. Biol. Med. Phys. 15
(1974) 271.
[50] R. Kopleman, Rate processes on fractals: theory, simulations, and experiments, J. Statist.
Phys. 42 (1986) 185.
[51] A. Sorribas, M.A. Savageau, A comparison of variant theories of intact biochemical systems.
2. Flux-oriented and metabolic control theories, Math. Biosci. 94 (1989) 195.
[52] J.E. Seegmiller, F.M. Rosenbloom, Enzyme defect associated with a sex-linked human
neurological disorder and excesive purine synthesis, Science 155 (1967) 1682.
[53] E.O. Voit, Optimization in integrated biochemical systems, Biotechnol. Bioeng. 40 (1992)
572.
[54] D.C. Lewis, Qualitative analysis of S-systems: Hopf bifurcations, in: E.O. Voit (Ed.),
Canonocal Nonlinear Modeling: S-System Approach to Understanding Complexity, Van
Nostrand Reinhold, New York, 1991, p. 304.
[55] J.B. Wyngaarden, W.N. Kelley, Gout, in: J.B. Stanbury, J.B. Wyngaarden, D.S. Fredrickson,
J.L. Goldstein, M.S. Brown (Ed.), The Metabolic Basis of Inherited Disease, McGraw-Hill,
New York, 1983, p. 1043.
[56] N. Kamatani, S. Kuroshima, Ch. Terai, M. Hakoda, K. Nishioka, K. Mikanagi, Diagnosis
of genotypes for AdeninePhosphoribosyltransferase (APRT) de®ciency, Adv. Exp. Med.
Biol. 253A (1989) 51.
[57] A. Giacomello, C. Salerno, Possible metabolic basis for GTP depletion in red cells of patients
with PRPP synthetase superactivity, Adv. Exp. Med. Biol. 309B (1991) 253.
[58] K. Pillwein, P. Chiva, A. Kno¯ach, B. Czermak, K. Schuster, E. Gersdorf, B. Ausserer, C.
Murr, R. Goebl, G. Stockhammer, H. Maier, H. Kostron, Purine metabolism of human
glioblastoma invivo, Cancer Res. 50 (1990) 1576.
[59] M.N. Goodman, J.M. Lowenstein, The purine nucleotide cycle. Studies of ammonia produc-
tion by skeletal muscle in situ and in perfused preparations, J. Biol. Chem. 252 (1977) 5054.
[60] W.G. Siems, T. Grune, R. Schmidt, R. Uhlig, G. Gerber, Y.V. Tikhonov, A.M. Pimenov,
R.T. Toguzov, Purine nucleotides, nucleosides and nucleobases of liver, skeletal muscle,
blood and tumor cells during the growth of Erlich Ascites tumor in mice, Adv. Exp. Med.
Biol. 309A (1991) 113.
[61] T. Grune, W.G. Siems, G. Gerber, R. Uhlig, Determination of the ultraviolet absorbency and
radioactivity of purine compounds separated by high-performance liquid-chromatography ±
Application to metabolic ¯ux rate analysis, J. Chromatogr. 553 (1991) 193.
[62] J.R. Barber, B.H. Morimoto, L.S. Brunauer, S. Clarke, Metabolism of S-adenosyl-L-
methionine in intact human erythrocytes, Biochim. Biophys. Acta 887 (1986) 361.
[63] K.L. Oden, S. Clarke, S-adenosyl-L-metionine synthase from human erythrocytes: role in the
regulation of cellular S-adenosylmethionine levels, Biochemistry 22 (1983) 2978.
[64] T. Grune, W. Siems, R. Uhlig, P. Langen, G. Gerber, Changes of purine nucleotide
metabolism of Erlich ascites cells during transition of tumor growth, Adv. Exp. Med. Biol.
309A (1991) 109.
[65] C.H. de Verdier, A. Ericson, F. Niklasson, M. Westman, Adenine metabolism in man. 1.
After intravenous and preoral administration, Scand. J. Clin. Lab. Invest. 37 (1977) 567.
[66] A. Tabucchi, F. Carlucci, R. Pagani, F. Ciccomascolo, L. Lopalco, A. Siccardi, Some aspects
of purine nucleotide metabolism in human lymphocytes: nucleotide content in human
lymphoblastoid lines transfected with HIV-1, Adv. Exp. Med. Biol. 309A (1991) 121.
[67] G. Morgan, S. Strobel, C. Montero, J.A. Duley, P.M. Davies, H.A. Simmonds, Raised IMP-
dehydrogenase activity in the erythrocytes of a case of purine nucleoside (PNP) de®ciency,
Adv. Exp. Med. Biol. 309B (1991) 297.
46 R. Curto et al. / Mathematical Biosciences 151 (1998) 1±49

[68] J.G. Cory, Metabolismo de los nucle�otidos pur�õnicos y pirimid�õnicos, in: T.M. Devlin (Ed.),
Bioqu�õmica, Reverte S.A., Barcelona, 1988, p. 618.
[69] S. Kunjara, M. Sochor, A.L. Greenbaum, P. Mclean, Aspects of the regulation of hepatic
phosphoribosyl pyrophosphate formation in the obese (ob/ob) mouse ± Relationship to the
pentose phosphate pathway, Biochem. Med. Metab. Biol. 49 (1993) 217.
[70] K.R. Albe, B.E. Wright, Carbohydrate metabolism in dictyostelium discoideum: II. Systems'
Analysis, J. Theoret. Biol. 169 (1994) 243.
[71] L. Stryer. DNA y RNA: Las mol�eculas de la herencia, in: L. Stryer (Ed.), Bioqu�õmica,
Revert�e S.A., Barcelona, 1988, p. 71.
[72] J.G. Puig, I.H. Fox, F.A. Mateos, M.L. Jimenez, Adenine-nucleotide turnover in hypoxan-
thine-guanine phosphoribosyl-transferase de®ciency ± Evidence for an increased contribution
of purine biosynthesis de Novo, Metabolism 38 (1989) 410.
[73] M.E. King, J.M. Honeysett, S.B. Howell, Regulation of de novo purine synthesis in human
bone marrow mononuclear cells by hypoxanthine, J. Clin. Invest. 72 (1983) 965.
[74] M.L. Jimenez, J.G. Puig, F.A. Mateos, T.H. Ramos, J.S. Melian, V.G. Nieto, M.A. Becker,
Increased purine nucleotide degradation in the central nervous system (CNS) in PRPPS
synthetase superactivity, Adv. Exp. Med. Biol. 253A (1989) 9.
[75] T.W. Traut, P.A. Ropp, A. Poma, Purine nucleoside phosphorylase: allosteric regulation of a
dissociating enzyme, Adv. Exp. Med. Biol. 309B (1991) 177.
[76] E. Zoref-Shani, G. Kessler-Icekson, L. Wasserman, O. Sperling, Characterization of purine
nucleotide metabolism in primary rat cardiomyocyte cultures, Biochim. Biophys. Acta 804
(1984) 161.
[77] J.M. Whelan, A.S. Bagnara, Factors a�ecting the rate of purine ribonucleotide dephosphor-
ylation in human erythrocytes, Biochim. Biophys. Acta 563 (1979) 466.
[78] K.J. Van Acker, H.A. Simonds, Long-term evolution of type 1 Adenine phosphoribosyl-
transferase (APRT) de®ciency, Adv. Exp. Med. Biol. 309B (1991) 91.
[79] M.A. Becker, J.G. Puig, F.A. Mateos, M.L. Jimenez, M. Kim, H.A. Simmonds, Neurode-
velopmental impairment and deranged PRPP and purine nucleotide synthesisin inherited
superactivity of PRPPsynthetase, Adv. Exp. Med. Biol. 253A (1989) 15.
[80] R.A. Harkness, Lesch±Nyhan syndrome: reduced aminoacid concentrations in CSF and
brain, Adv. Exp. Med. Biol. 253A (1989) 159.
[81] S. Fujimori, T. Tagaya, N. Yamaoka, N. Kamatani, L. Akaoka, Molecular analysis of
hypoxanthine-guanine phosphoribosyltransferase de®ciency in Japanese patients, Adv. Exp.
Med. Biol. 309B (1991) 101.
[82] I.H. Fox, W.N. Kelley, Human phosphoribosylpyrophosphate synthetase kinetic mechanism
and end product inhibition, J. Biol. Chem. 247 (1972) 2126.
[83] I.H. Fox, W.N. Kelley, Human phosphoribosylpyrophosphte synthetase, distribution
puri®cation and properties, J. Biol. Chem. 246 (1971) 5739.
[84] P.A.M. Berman, L. Human, Regulation of 5-phosphoribosyl 1-pyrophosphate and of
hypoxanthine uptake and release in human erythrocytes by oxypurine cycling, J. Biol. Chem.
265 (1990) 6562.
[85] E.W. Holmes, Kinetic, physical, and regulatory properties of amidophosphoribosyltransfer-
ase, Adv. Enzyme Regul. 19 (1981) 215.
[86] E.W. Holmes, J.A. McDonald, J.M. McCord, J.B. Wyngaarden, W.N. Kelley, Human
glutamine phosphoribosylpyrophosphate amidotransferase. Kinetic and regulatory proper-
ties, J. Biol. Chem. 248 (1973) 144.
[87] J. Kovarsky, M.C. Evans, E.W. Holmes, Regulation of human amidophosphoribosyltrans-
ferase: interaction of ortophosphate, PP-ribose-P, and purine ribonucleotides, Canad. J.
Biochem. 56 (1978) 334.
[88] J.F. Henderson, L.W. Brox, W.N. Kelley, F.M. Rosenbloom, J.E. Seegmiller, Kinetic studies
of hypoxanthine-guanine phosphoribosyltransferase, J. Biol. Chem. 243 (1968) 2514.
R. Curto et al. / Mathematical Biosciences 151 (1998) 1±49 47

[89] K.R. Albe, M.H. Butler, B.E. Wright, Cellular concentrations of enzymes and their
substrates, J. Theoret. Biol. 143 (1990) 163.
[90] A. Giacomello, C. Salerno, Human hypoxanthine-guanine phosphoribosyltransferase, J.
Biol. Chem. 253 (1978) 6038.
[91] H. Holmsen, M.C. Rozenberg, Adenine nucleotidemetabolism of blood platelets. III Adenine
phosphoribosyl transferase and nucleotide formation from exogenous adenine, Biochim.
Biophys. Acta 157 (1968) 266.
[92] S. Fujimori, I. Akaoka, K. Sakamoto, H. Yamanaka, K. Nishioka, N. Kamatani, Common
characteristics of mutant adenine phosphoribosyltransferases from four separate Japanese
families with 2,8-dihydroxyadenine urolithiasis associated with partial enzyme de®ciencies.,
Hum. Genet. 71 (1985) 171.
[93] M. Hori, J.F. Henderson, Kinetic studies of adenine phosphoribosyltransferase, J. Biol.
Chem. 241 (1966) 3404.
[94] M.E. Pugh, E.B. Skibo, Inosine monophosphate dehydrogenase from porcine (Sus-scrofa-
domestica) thymus ± Puri®cation and properties, Comp. Biochem. Physiol. [B] 105 (1993)
381.
[95] E.W. Holmes, D.M. Pehlke, N. Kelley, Human IMP dehydrogenase kinetics and regulatory
properties, Biochim. Biophys. Acta 364 (1974) 209.
[96] T. Page, B. Bakay, W.L. Nyhan, Human GMP synthetase, Int. J. Biochem. 16 (1984) 117.
[97] Y. Matsuda, H. Ogawa, S. Fukutome, H. Shiraki, H. Nakagawa, Adenylosuccinate
synthetase in rat liver: the existence of two types and their regulatori roles, Biochem. Biophys.
Res. Commun. 78 (1977) 766.
[98] M.B. Van der Weyden, W.N. Kelley, Human Adenilosuccinate Synthetase. Partial
puri®cation, kinetic and regulatory properties of the enzyme from placenta, J. Biol. Chem.
249 (1974) 7282.
[99] H. Ogawa, H. Shiraki, Y. Matsuda, K. Kakiuchi, H. Nakagawa, Puri®cation, crystalization,
and properties of adenylosuccinate synthetase from rat skelethal muscle, J. Biochem. 81
(1977) 859.
[100] R.L. Stone, H. Zalkin, J.E. Dixon, Expression, puri®cation, and kinetic characterization of
recombinant human adenylosuccinate lyase, J. Biol. Chem. 268 (1993) 19710.
[101] T. Spector, T.E. Jones, R.L. Miller, Reaction mechanism and speci®city of human GMP
reductase, J. Biol. Chem. 254 (1979) 2308.
[102] J.J. Mackenzie, L.B. Sorensen, Guanosine 5'-phosphate reductase of human erythrocytes,
Biochim. Biophys. Acta 327 (1973) 282.
[103] G. Nagel-Starczynowska, G. Nowak, K. Kaletha, Puri®cation and properties of AMP-
deaminase from human uterine smooth-muscle, Biochim. Biophys. Acta 1073 (1991) 470.
[104] S. Yun, C.H. Suelter, Human erythrocyte 5'-AMP aminohydrolase puri®cation and
characterization, J. Biol. Chem. 253 (1978) 404.
[105] G. Nowak, K. Kaletha, Molecular-forms of human heart-muscle AMP deaminase, Biochem.
Med. Metab. Biol. 46 (1991) 263.
[106] G. Nowak, K. Kaletha, Puri®cation and properties of AMP-deaminase from human kidney,
Biochem. Med. Metab. Biol. 47 (1992) 232.
[107] S. Clarke, Protein carboxyl methyltransferases: two distinct classes of enzymes, Ann. Rev.
Biochem. 54 (1985) 479.
[108] A.E. Pegg, H.G. Williams-Ashman, On the role of S-adenosyl-L-methionoe in the
biosynthesis of spermidine by rat prostate, J. Biol. Chem. 244 (1969) 682.
[109] H. Zimmermann, 5'- Nucleotidase: molecular estructure and functional aspects, Biochem. J.
285 (1992) 345.
[110] R. Itoh, J. Oka, Evidence for existence of a cytosol 5'-nucleotidase in chicken heart:
comparision of some properties of heart and liver enzymes, Comp. Biochem. Physiol. 81B
(1985) 159.
48 R. Curto et al. / Mathematical Biosciences 151 (1998) 1±49

[111] R. Itoh, Puri®cation and some properties of cytosol 5'-nucleotidase from rat liver, Biochim.
Biophys. Acta 657 (1981) 402.
[112] L. H�oglund, P. Reichard, Cytoplasmatic 5'(3')-nucleotidase from human placenta, J. Biol.
Chem. 265 (1990) 6589.
[113] S. Eriksson, L. Thelander, M. Akerman, Allosteric regulation of calf thymus ribonucleoside
diphosphate reductase, Biochemistry 18 (1979) 2948.
[114] P.D. Boyer, The binding change mechanism for ATP synthase ± Some probabilities and
possibilities, Biochim. Biophys. Acta 276 (1993) 257.
[115] P.L. Ballard, H.G. Williams-Ashman, Isolation and properties of a testicular ribonucleic acid
polymerase, J. Biol. Chem. 241 (1966) 1602.
[116] P.A. Fisher, T.S. Wang, D. Korn, Enzymological Characterization of DNA Polymerase
alpha, Basic catalytic properties, processivity, and GAP utilization of the homogeneous
enzyme from human KB cells, J. Biol. Chem. 254 (1979) 6128.
[117] C.F. Strittmatter, Studies on avian xanthine dehydrogenases. Properties and patterns of
appearance during development, J. Biol. Chem. 240 (1965) 2557.
[118] P.K. Bondy, L.E. Rosenberg, Duncan's Diseases of Metabolism, Saunders, Philadelphia,
1974.
[119] W. Lathem, G.P. Rodnan, Impairment of uric acid excretion in gout, J. Clin. Invest. 41
(1962) 1955.
R. Curto et al. / Mathematical Biosciences 151 (1998) 1±49 49