mathematical modelling of climbing film evaporators
TRANSCRIPT

MATHEMATICAL
MODELLING OF CLIMBING
FILM EVAPORATORS
by
Stephen David Peacock
Submitted in fulfilment of the academic requirements for the degree of
Masters of Science in Engineering in the Department of Chemical
Engineering. University of Natal.
01 February 2001
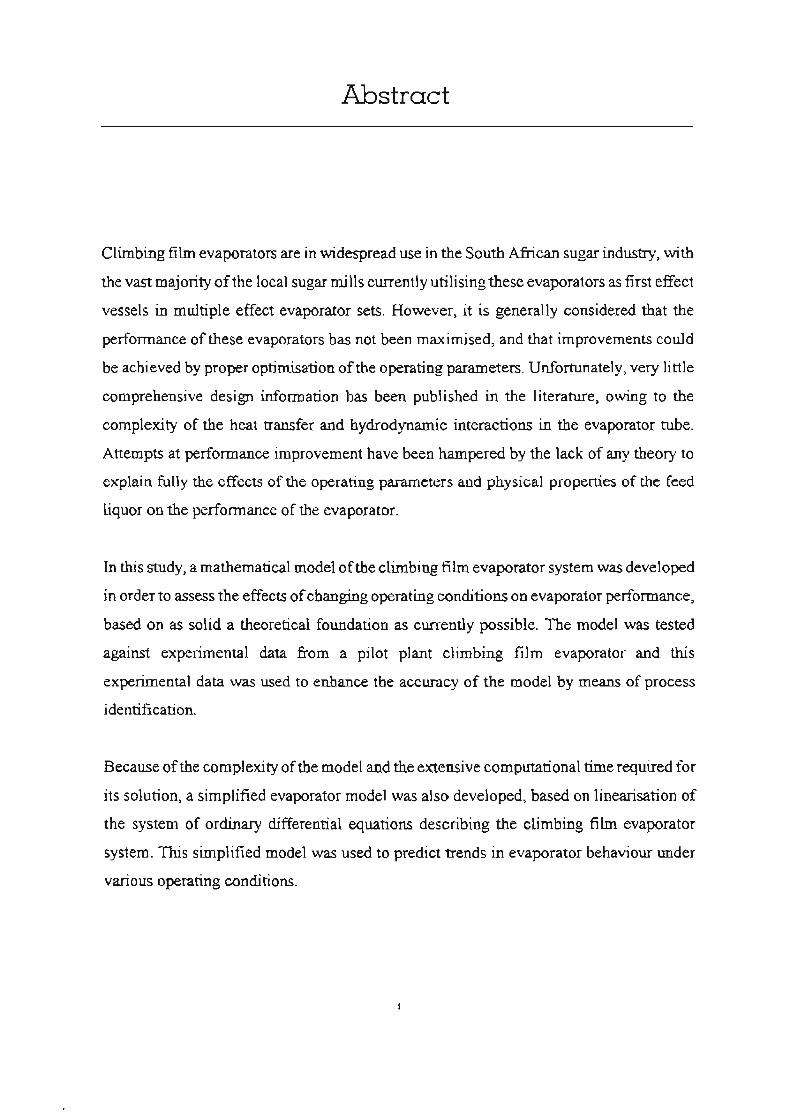
Abstract
Climbing film evaporators are in widespread use in the South African sugar industry, with
the vast majority of the local sugar mills currently utilising these evaporators as first effect
vessels in multiple effect evaporator sets. However. it is generally considered that the
perfonnance of these evaporators has not been maximised, and that improvements could
be achieved by properoptimisation of the operating parameters. Unfortunately, very little
comprehensive design infonnation has been published in the literature. owing to the
complexity of the heat transfer and hydrodynamic interactions in the evaporator tube.
Attempts at performance improvement have been hampered by the lack of any theory to
explain fully the effects of the operating parameters and physical properties of the feed
liquor on the performance of the evaporator.
In this study. a mathematical model of the climbing film evaporator system was developed
in order to assess the effects of changing operating conditions on evaporator performance,
based on as solid a theoretical foundation as cunendy possible. The model was tested
against experimental data from a pilot plant climbing film evaporator and this
experimental data was used to enhance the accuracy of the model by means of process
identification.
Because of the complexity of the model and the extensive computational time required for
its solution, a simplified evaporator model was also developed, based on Iinearisation of
the system of ordinary differential equations describing the climbing film evaporator
system. This simplified model was used to predict trends in evaporator behaviour under
various operating conditions.

Preface
The work published in this thesis is, unless stated to the contrary in the text, my own. No
portion of this work has been submitted, either in whole orin part, to any other Wliversity.
Substantial portions oftbis work have, however, previously heen published by the author
in journals relating to the sugar industry.
Stephen Peacock Prof Maciej Starzak
"

Acknowledgements
I would like to gratefully acknowledge the guidance and assistance of the following people
and organisations, without whom this work could not have been carried out:
• The Sugar Milling Research Institute and the South African sugar industry - for their
financial support of the work, and for permission to publish the results thereof.
• My supervisor, Maciej Starzak, who sacrificed many, many hours in the interests of
improving both sugar technology and my capabilities as a chemical engineer.
• Dennis Walthew, Raoul Lionnet, Steve Davis, Brian Purchase and the rest of the
staff of the Sugar Milling Research Institute, both past and present, who assisted
with the project.
• Rob Whitelaw, Guy Montocchio, Dave Love, lan Smith, Dave Meadows, Peter Rein
and the rest of the staff of the Tongaat-Hulet1 Sugar group, most notably those at the
Felixton sugar mill, who provided assistance and guidance on the project.
'"

Contents
1 Introduction
Parli: Theory and Madel Development
2 Literature Review
2.1 Two phase flow and heat transfer characteristics
2.1.1 Flow boiling in vertical tubes
2.1.2 Condensation
2.2 Existing models of climbing film evaporators
2.2.1 Coulson and Mehta (1953)
2.2.2 Piret and Isbin (1954)
2.2.3 Coulson and McNelly ( 1956)
2.2.4 Gupta and HoUand (1966a)
2.2.5 Gupta and Holland (1966b)
2.2.6 Tang (1980)
2.2.7 Mayinger and Schult (1981)
2.2.8 Bourgois and Le Maguer (1933a)
2.2.9 Bourgois and Le Maguer (1983b)
2.2.10 Bourgois and Le Maguer (1984)
2.2.11 Zinemanaselal. (1984)
2.3 Conclusions
3 Model Description
3.1 Basic model philosophy
3.2 Generation of the balance equations
3.2.1 Total mass balance of liquid and vapour
IV
1
4
4
4
8
9
9
11
13
17
20
20
20
22
25
27
29
33
34
34
37
37
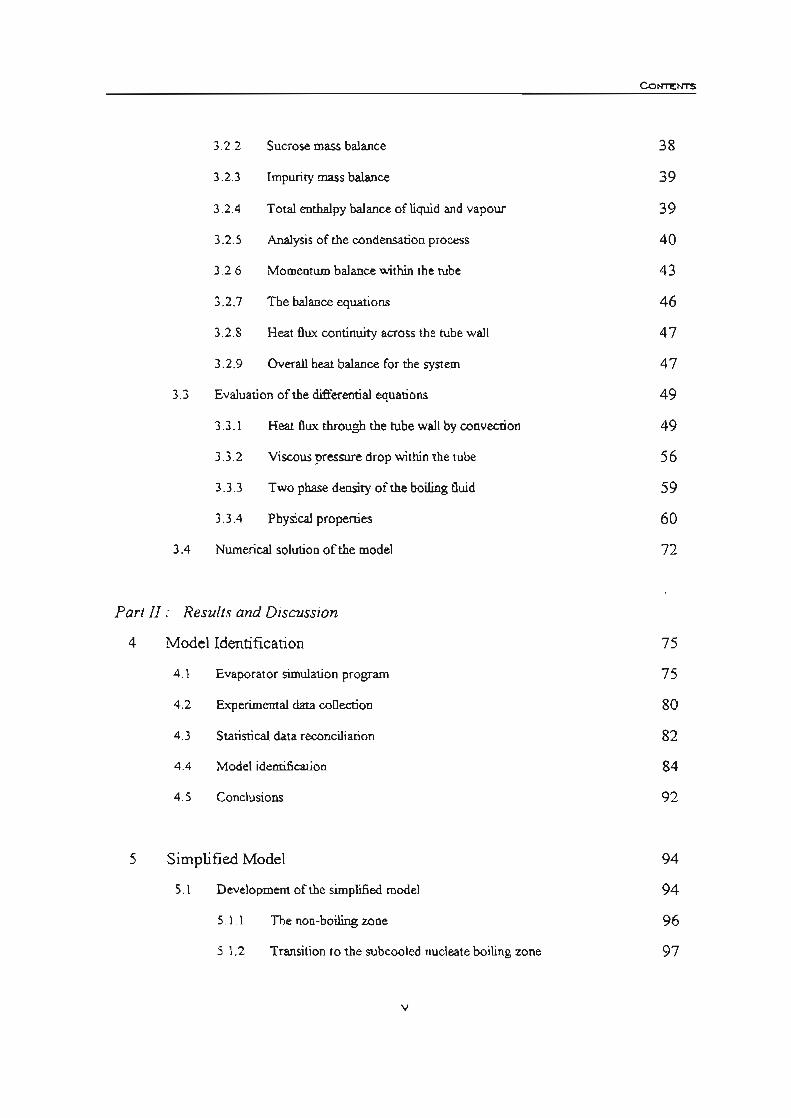
3.2.2 Sucrose mass balance
3.2.3 Impurity mass balance
3.2.4 Total enthalpy balance of liquid and vapour
3.2.5 Analysis ofthe condensation process
3.2.6 Momentum balance within the tube
3.2.7 The balance equations
3.2.8 Heat flux continwty across the tube wall
3.2.9 Overall heat balance for the system
3.3 Evaluation of the differential equations
3.3.1 Heat flux through the tube wall by convection
3.3.2 Viscous pressure drop within the tube
3.3.3 Two phase density of the boiling fluid
3.3.4 Physical propenies
3.4 Numerica1 solution of the model
Part II ; Results and Discussion
4
5
Model Identification
4.1 Evaporator simulation program
4 .2 Experimental data collection
4 .3 Statistical data reconciliation
4.4 Model identification
4.5 Conclusions
Simplified Model
5.1 Development of the simplified model
S.I.I
5. 1.2
The non-boiling zone
Transition to the subcooled nucleate boiling zone
v
CONTENTS
38
39
39
40
43
46
47
47
49
49
56
59
60
72
75
75
80
82
84
92
94
94
96
97
Co.....",
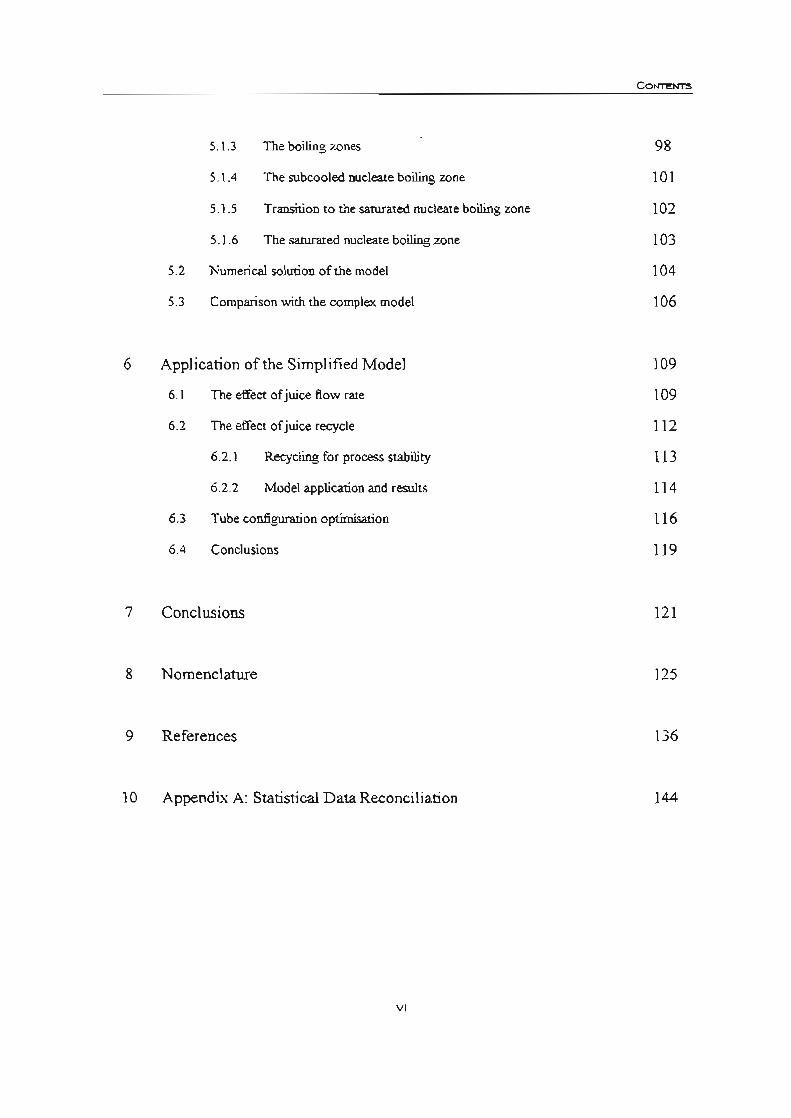
5.1.3 The boiling zones 98
5.1.4 The subcooled rucleate boiling zone 101
5.1.5 Transition to the saturated nucleate boiling zone 102
5.1.6 The saturated nucleate boiling zone \03
5.2 Numerical solution of the model 104
5.3 Comparison with the complex model 106
6 Application of the Simplified Model 109
6.1 The effect of juice flow rate 109
6.2 The effect of juice recycle 112
6.2.1 Recycling for process stability 113
6.2.2 Model application and resuhs 114
6.3 Tube configuration optimisation 116
6.4 Conclusions 119
7 Conclusions 121
8 Nomenclature 125
9 References 136
10 Appendix A: Statistical Data Reconciliation 144
VI
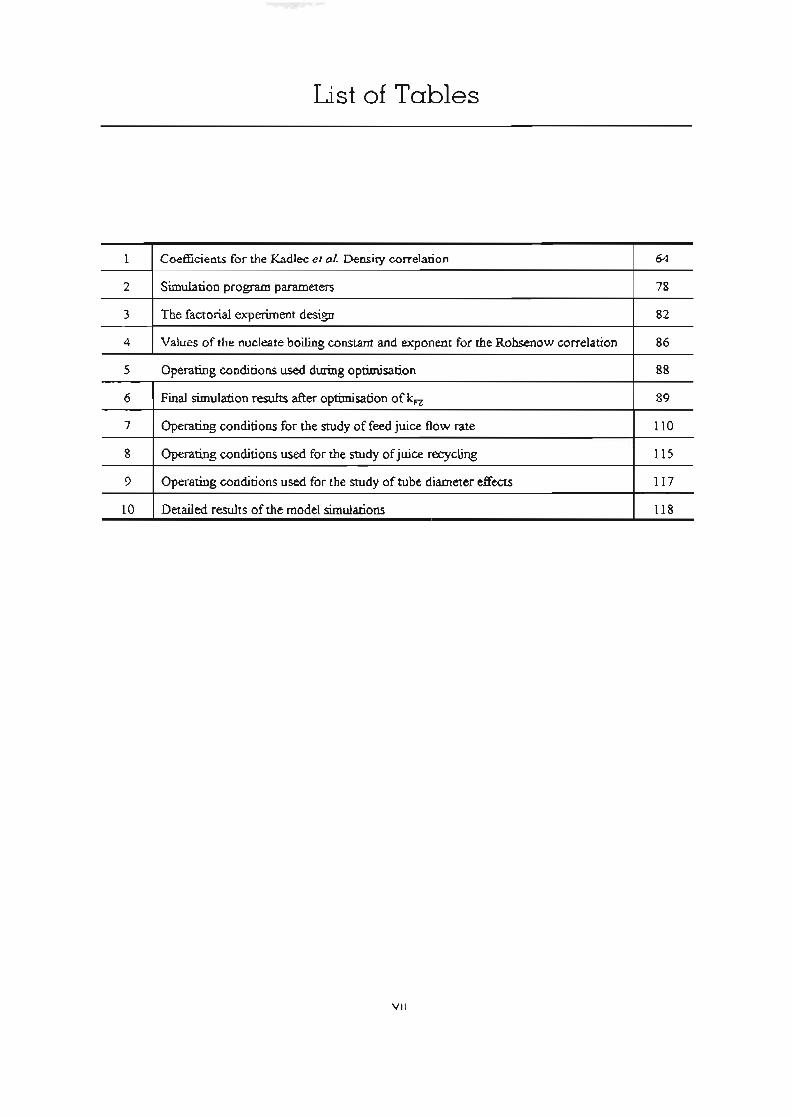
list of Tables
I Coefficients for the Kadlec et al Density correlation 64
2 Simulation program parameters 78
3 The factorial experiment design 82
4 Values of the nucleate boiling constant and exponent for the Rohsenow correlation 86
5 Operating conditions used during optimisation 88
6 Final simulation results after optimisation of kn 89
7 Operating conditions for the study of feed juice flow rate 110
8 Operating conditions used for the study of juice recycling 115
9 Operating conditions used for the study of tube diameter effects 117
10 Detailed results afthe model simulations 118
vu
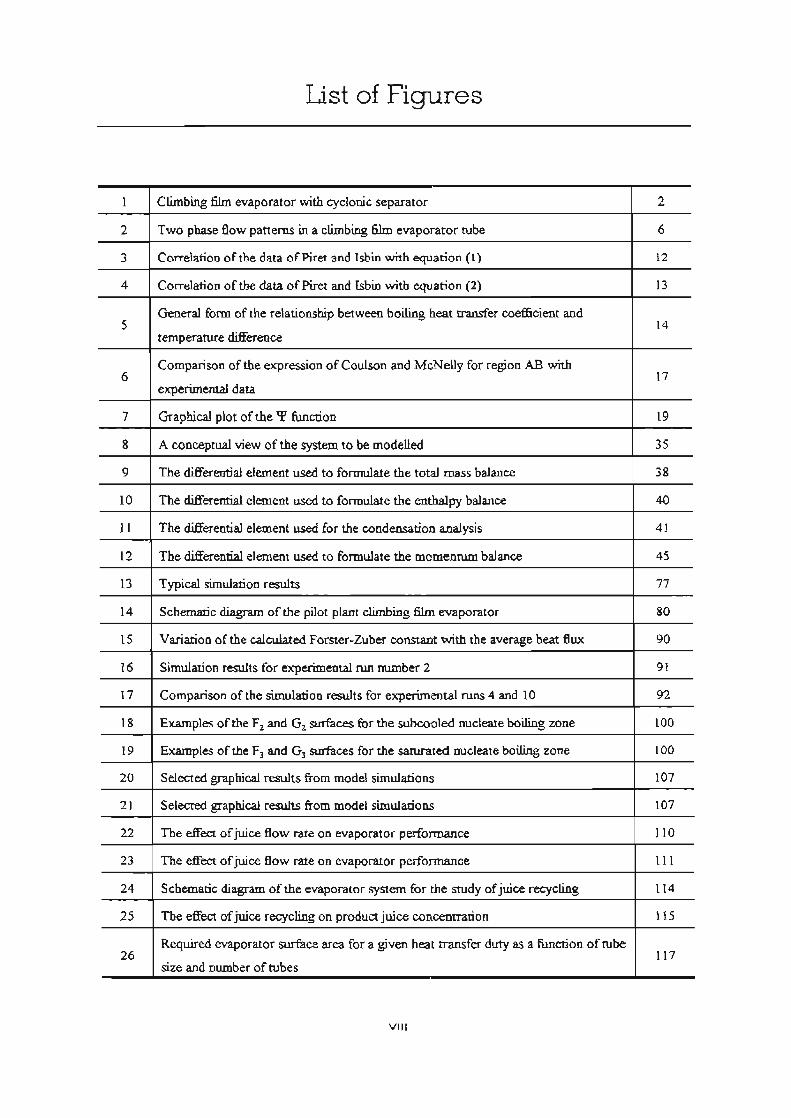
List of Figures
I Climbing film evaporator with cyclonic separator 2
2 Two phase flow patterns in a climbing film evaporator tube 6
3 Correlation of the data ofPiret and lsbin with equation (1) 12
4 Correlation afthe data ofPiret and lsbin with equation (2) 13
5 General form. of the relationship betWeen boiling heat transfer coefficient and
14 temperature difference
6 Comparison of the expression of Coulson and McNelly for region AB with
17 experimenta1 data
7 Graphical plot of the 'P function 19
8 A conceptual view aftbe system to be modelled 35
9 The differential element used to formulate the total mass balance 38
10 The differential element used to formulate the enthalpy balance 40
11 The differential element used for the condensation analysis 41
12 The differential element used to formulate the momentum balance 45
13 Typical simulation results 77
14 Schematic diagram of the pilot plant climbing film evaporator 80
15 Variation of the calculated Forster-Zuber constant with the average heat flux 90
16 Simulation results for experimental run number 2 91
17 Comparison of the simulation results for experimental runs 4 and 10 92
18 Examples aCthe F l and G2 surfaces for the subcooled nucleate boiling zone 100
19 Examples of the F, and G) surfaces for the saturated nucleate boiling zone lOO
20 Selected graphical results from model simulations 107
21 Selected graphical results from model simulations 107
22 The effect of juice flow rate on evaporator petfonnance 110
23 The effect of juice flow rate on evaporator perfonnance III
24 Schematic diagram of the evaporator system for the study of juice recycling 114
25 The effect of juice recycling on product juice concentration 115
26 Required evaporator SI.11"fiI.ce area for a given heat transfer duty as a function of tube
117 size and number of tubes
VIU
Chapter 1
Introduction
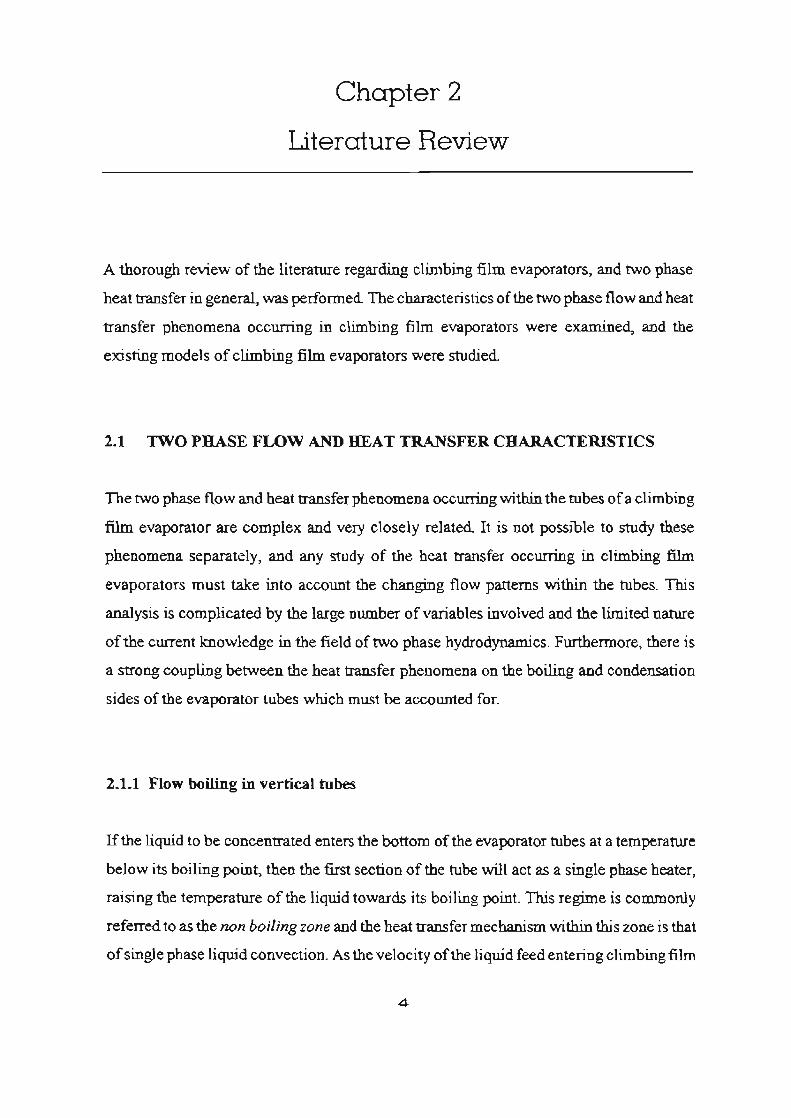
The climbing film evaporator was first introduced by Kestner, in 1899, and consists of one
or more vertical tubes within a shell, usually heated by condensing steam. Typically, the
tubes are six to ten metres in length and 27 to 50 millimetres in diameter. As many as five
thousand tubes may commonly be placed within a single shell. The liquor to be evaporated
is fed to the bottom of the tubes, where it vapourises and the liquid phase is carried up the
tube in a thin film against the tube wall (the 'climbing film'). The difference in density
between the liquid phase entering the tube bottom and the evaporating two phase mixture
within the tubes results in this natural circulation flow. At the top of the tubes, the vapour
is removed from the concentrated liquor in a separator (see Figure I ). As the climbing film
evaporator is an upward flow type evaporator, the boiling point of the liquor to be
concentrated is greater at the bottom of the tubes than at the top because of the greater
hydrostatic pressure at the tube bottom. Thus, in the lower part of the tubes there is no
boiling and the temperature increases with increasing height, until the boiling point
corresponding to the local pressure in the tube is reached. After this point, the temperature
of the liquid falls with increasing height, and vapourisation of the liquor occurs due to
both flashing and the further addition of heat. Even though the liquor concentration
increases along the length of the tube, resulting in an increased boiling point elevation
with increasing height, the effect of the decreasing hydrostatic head is more significant,
yielding an overall effect of decreasing boiling point with increasing distance along the
tube.
The primary advantage of the climbing film evaporator is its short liquor residence time,
typically of the order of thirty seconds to three minutes. High rates of heat transfer can be
obtained without the use ofbigh steam temperatures or long liquor contact times, allowing
the concentration of heat-sensitive liquors for which such subjective properties as flavour,

CHAPT'ER I INTRODUCTION
colour and aroma are of prime importance. Other advantages include simplicity of
construction, cleaning and maintenance, low cost per unit of heat transfer area, small floor
space requirements and the ability to handle viscous and foaming liquors. The long tubes
make it possible to achieve high evaporation loads in a single pass. Disadvantages of the
climbing film evaporator include the need for an external vapourniquid separation vessel
and the potentia1 for the occurrence of transient pulsation phenomena (Gundmundson &
Olauson, 1971).
Condensate
-.0""":111- Tangential Inlet
liquor
So"" catcher
Figure L Climbing film evaporator with cyclonic separator (Smith, 1983).
2
CHAl"T"ER I INTRODUCTION
Climbing film evaporators are widely used in the South African sugar industry. The first
evaporator of this type was installed at the Darnall mill in 1969, with 6,7 metre long tubes.
Currently, I3 of the 17 local sugar mills utilise climbing film evaporators as first effect
vessels, with tube lengths of up to 7,3 metres (Rein & Love, 1995). The short evaporator
residence time, small liquor hold up volume and low temperature of operation minimise
the occurrence of browning reactions. either by caramelisation of sugars or the reaction
of proteins with sugars. However. it is generally considered that the performance of these
evaporators is not optimal and that improvements could be achieved by proper
optimisation of the operating parameters. Unfornmately, very little design information is
available in the literature, owing to the complexity of the heat transfer and hydrodynamic
interactions in the evaporator tube. Attempts at performance improvement have been
hampered by the lack of any theory to explain fully the effects of the operating conditions
and physical properties of the feed liquor on the performance of the evaporator.
The objective of this study is the production ofa mathematical model of the climbing film
evaporator system which can be nsed to assess the effects of changing operating conditions
on evaporator performance, based on as solid a theoretical base as currently possible.
3
Part I :
Theory and Model Development
Chapter 2
Literature Review
A thorough review of the literature regarding climbing film evaporators, and two phase
heat transfer in general, was performed The characteristics of the two phase flow and heat
transfer phenomena occurring in climbing film evaporators were examined. and the
existing models of climbing film evaporators were studied
2.1 lWO PHASE FLOW AND HEAT TRANSFER CHARACTERISTICS
The two phase flow and heat transfer phenomena occurring within the tubes of a climbing
film evaporator are complex and very closely related. It is not possible to study these
phenomena separately, and any study of the heat transfer occurring in climbing film
evaporators must take into account the changing flow patterns V¥ithin the tubes. This
analysis is complicated by the large number of variables involved and the limited nature
of the current knowledge in the field of two phase hydrodynamics. Furthermore, there is
a strong coupling between the heat transfer phenomena on the boiling and condensation
sides of the evaporator tubes which must be accounted fOT.
2.1.1 Flow boiling in vertical tubes
If the liquid to be concentrated enters the bottom of the evaporator tubes at a temperature
below its boiling point, then the first section of the tube will act as a single phase heater,
raising the temperature of the liquid towards its boiling point. This regime is commonly
referred to as the non boiling zone and the heat transfer mechanism within this zone is that
of single phase liquid convection. As the velocity of the liquid feed entering climbing film
4
LrrERAoTURE REVIEW
evaporators is generally low, leading to laminar flow of the liquid within the tube, heat
transfer in this zone is p>Or. The length of the non boiling zone is dependent on the
temperature of the liquid entering the bottom of the tubes; the lower the entrance
temperature, the longer the non boiling zone.
When the tube wall temperature rises above the maximum superheat temperature of the
liquid phase in contact with it (the 'critical wall temperature for nucleation'), bubble
formation on the tube wall commences, even though the bulk fluid temperature in the tube
is below the boiling point temperature at the local pressure. The bubbles formed at the
tube wall move out into the subcooled bulk liquid, where they subsequently collapse. This
region of the tube is referred to as the subcooled nucleate boiling zone. Heat transfer in
this zone is more efficient than that in the non boiling lone, due to the disturbance of the
liquid boundary layer against the tube wall by the bubbles of vapour. Two mechanisms
contribute to the heat transfer occmring in this regime, namely convective beat transfer
and nucleate boiling. Convective heat transfer is strongly dependent on the velocity of the
two phase mixture within the evaporator tube, as the main resistance to this mechanism
of heat transfer results from the liquid phase boundary layer against the tube wall. The
nucleate boiling mecbanism, bowever, is largely independent of velocity as the liquid
pbase boundary layer is destroyed by the action of the bubbles formed at the tube wall.
These two heat transfer mechanisms act in parallel within the tube, with convective
boiling taking place in the liquid phase surrounding the bubbles formed by nucleate
boiling. Initially, the contribution of the nucleate boiling mechanism to the total heat
transfer dominates.
As the fluid rises through the evaporator tube, it is heated and the local pressure decreases
due to the decrease in hydrostatic head with increase in height. When the bulk liquid
reaches its boiling point temperature at the local pressure, the saturated nucleate boiling
zone commences, with bubbles of vapour dispersed in the continuous liquid phase.
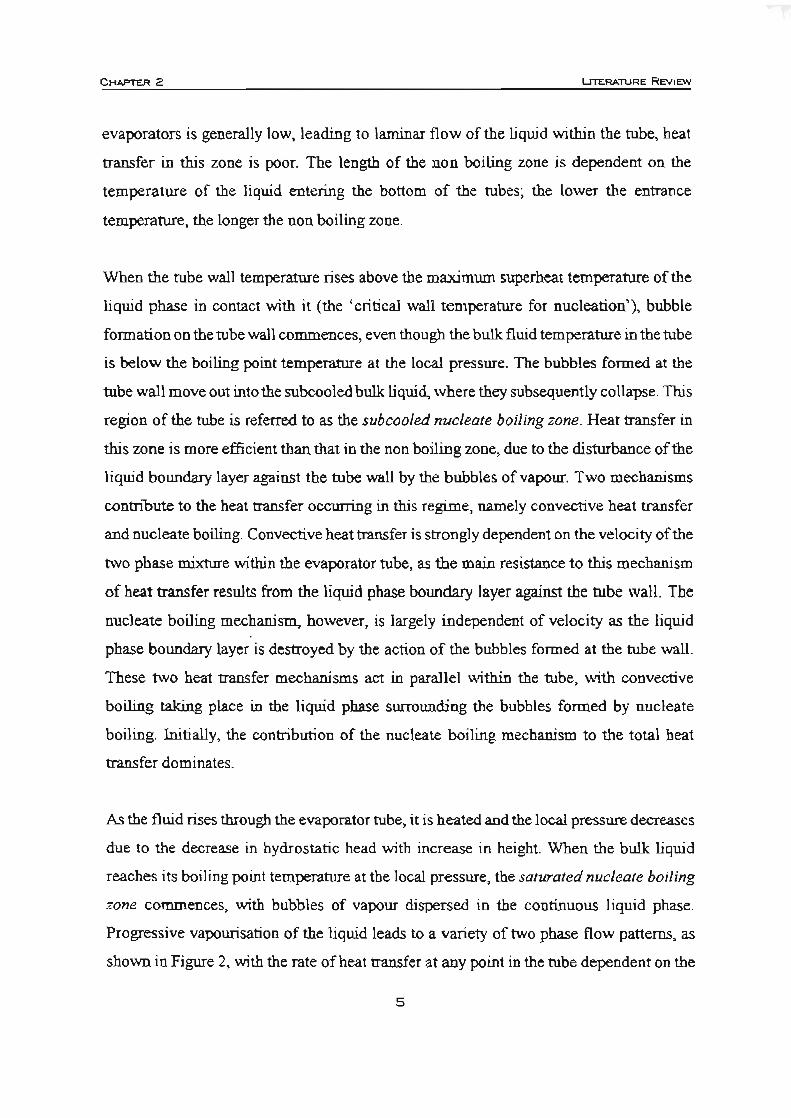
Progressive vapourisation of the liquid leads to a variety of two pbase flow patterns, as
shown in Figure 2, with the rate of heat transfer at any point in the tube dependent on the
5

CHAFT'ER 2 LrT1!:RATIJRE REV1EW
relative flow rates of liquid and vapour at that point. As the proportion of vapour in the
tube increases, the velocity of the two phase flow increases because of the greater volume
occupied by the vapour phase (the mass flow rate remains constant). The pressure gradient
in the tube is subsequently increased because of the greater wall drag and the force
necessary to accelerate the two phase flow to the higher velocities. While the nucleate
boiling mechanism still dominates heat ttansfer in this regime, the contribution of the
convective boiling mechanism increases with increasing two phase velocity through the
tube.
.. : .. :
' .. . . ' . . ' ' .. ' . .
1:= .... Si ..... .... -
Figure 2: Two phase flow patterns in a climbing film evaporator tube (Collier, 1980).
Initially, in the saturated nucleate boiling zone, the vapour bubbles are dispersed in the
liquid phase. Further up the tube, the bubbles become more numerous and elongated, and
some bubble coalescence occurs. Eventually. slugs of vapour with diameters approaching
6
CHAPTER 2 Ln'EAATURE REVIEW
that of the tube are fonned. This unstable flow pattern quickly breaks dowo to form the
annular flow regime, in which vapour forms the central core within the tube with the
liquid phase carried up the tube wall in a thin film (the 'climbing film') by the drag
induced by the high velocity flow of vapour in the core. The separation of the phases in
this manner results from the difference in their densities. In an accelerating flow (the total
mass flow rate through the tube is constant, but the average density of the two phase
mixture is constantly falling), the pressure gradient is the same for both phases, but the
less dense vapour phase is accelerated more than the denser liquid phase and thus travels
at a higher velocity through the tube. The vapour phase therefore moves to the centre of
the tube in order to minimise the retarding frictional effects on its flow, allowing it to
travel at several times the speed of the liquid phase (Wintenon, 1981). As the annular flow
regime is characterised by very efficient heat transfer. it is usually considered ideal to
operate climbing film evaporators so as to utilise the annular flow regime throughout as
much of the tube length as possible.
As evaporation proceeds funher up the tube, the annular liquid film becomes progressively
thinner. As the thickness of the liquid film against the tube wall is decreased by
evaporation and its velocity subsequently increases due to the increased drag of the higher
velocity vapour phase. the contribution of the convective boiling mechanism to overall
heat transfer may exceed that of the nucleate boiling mechanism. In some cases. beat
transfer by convection may be so efficient that the tube wall is cooled to below the critical
temperature required for nucleate boiling. Under these circwnstances. bubble formation
ceases and further vapourisation occurs by convective boiling heat transfer alone, with
vapourisation occurring at the vapour-liquid interface.
In the final stage of evaporation, if the liquid flow rate through the evaporator is low or
the temperature difference driving force for evaporation very high. the thin annular film
of liquid breaks down under the high vapour velocities in the tube. The dispersed flow
regime, with liquid entraimnent in a core of vapour and a partially dry tube wall, may
occur. Each droplet ofliquid is cushioned from impact against the tube waIl by the layer
7

CHAf>'T'ER 2 l.I'n:RA"T\JRE REVIEW
of vapour generated by the droplet as it approaches the tube wall (Rohsenow, 1983;
Winterton, 1981). As vapour phase convective heat transfer is considerably less efficient
than liquid phase convective heat transfer, the dispersed flow regime is characterised by
falling heat transfer coefficients with increasing proportion of vapour in the two phase
flow through the tube.
2.1.2 Condensation
When a saturated vapour is brought into contact with a surface which is at a temperature
below the saturation temperature of the vapour, heat is transferred from the vapour to the
surface and condensate is produced. Under normal circumstances, the liquid wets the
surface. spreads out and forms a condensate film. If the vapour is condensing on a vertical
surface, such as an evaporator tube, the condensate film flows downwards under the
influence of gravity, but is retarded by the viscosity of the liquid. This flow will normally
be streamline, and further condensation will occur at the vapour-liquid interface
(increasing the thickness of the condensate film), with associated heat flow through the
liquid film by conduction. Under conditions of relatively long surfaces or high
condensation rates, the flow of the condensate film may become turbulent, leading to an
increase in the rate of beat transfer through the condensate film due to the disturbance of
the fluid boundary layer against the surface by the turbulent flow conditions.
If an incondensible gas, such as air. is present in the vapour to be condensed, the
incondensible gas will remain. and accumulate, at the condensing surface following the
condensation of the vapour. Further vapour must diffuse through this layer of gas collected
in the vicinity of the heat transfer surface before it can condense. Thus, the presence of
incondensible gas adjacent to the heat transfer surface acts as a thermal resistance to heat
transfer, resulting in a significant reduction in the efficiency of condensation heat transfer.
B
CHAPT!:R 2 LrTEAATURE REVIEW
2.2 EXISTING MODELS OF CLIMBING FILM EV APORA TORS
Very few climbing film evaporator models bave been published in the literature. Most of
those studies which have been perfonned have focussed on the empirical correlation of
a few operating variables, over a very limited range of operating conditions.
In early studies, the climbing film evaporator was considered as a lwnped-pararneter
system and only relationships between process variables averaged over the entire apparatus
were discussed. Tbe Imt distributed-parameter model accounting for the distribution of
temperature, pressure and juice composition over the length of the tubes was by Bourgois
and Le Maguer (1983a; 1983b; 1984). This model , however, was based on several
simplifying assumptions, such as the assumption of a constant rate of evaporation along
the tube length, which is its most serious drawback. Zinemanas et al. (1984) performed
a general study into the simulation of beat exchangers with change of phase, allowing for
multicomponent phase equilibria. In ptinciple, the model which was developed in the
current study follows the concepts formulated by Zinemanas et al.
2.2.1 Coulson and Mebta, (1953)
Coulson and Mehta presented information regarding the performance of a small stainless
steel climbing film evaporator with one tube 5 ft. 3 in. (1,6 m) long and Y, in. (12,7 mm)
outside diameter (20 s.w.g. wall thickness). Tbe heat transfer area based on the mean
diameter of the tube was 0 ,637 sq. ft. (0,0592 m'). A travelling thermocouple moving
within the centre of the tube was used to determine the liquor temperature profile up the
tube during the evaporation process.
Around two hundred experimental tests were carried out, using distilled water. sucrose
solutions of different concentrations (20%,30% and 40%), Teepol solutions of different
concentrations (0,01 % and 0,1 %) and isopropyl alcohoL The variables selected as being
9

C~2
possible factors affecting evaporator performance were temperature difference (varied
between 15 and 62°F [8,3 and 34,4°C]), feed rate (varied between 24 and 180 Ib.1br [10,9
and 81,6 kglbr]), boiling point temperature (varied between 110 and 1600f [43,3 and
71 ,1°C]), surface tension (varied between 21 and 68 dynes/cm [2, l x10" and 6,8x10"
N/m]) andviscosity(varied between 0,45 and 2 cP [4,5xI04 and 2x 1 0" Pa.s]). The general
approach to experimentation was to vaty one of the factors of interest while maintaining
all of the others at fixed levels.
For each of the experimental runs, the authors measured an overall beat transfer
coefficient. A film coefficient for the boiling liquid was then calculated by eliminating the
heat transfer resistance due to the tube wall and the heat transfer resistance on the outside
of the tube. These experimentally determined film coefficients were assumed to be related
to the variables of interest by a relation of the following form:
ha = K(~Ta . W;.O'e_ J..1Ld.Tbpe )
where K is a constant which was expected to vary with the liquid used in the tests due to
the effects of physical property terms not included within the bracketed expression, o.T
is the difference between the mean temperature on the boiling side and the mean
temperature on the heating medium side, W c is the mass feed rate to the evaporator, ais
the surface tension of the boiling liquid, ~L is the viscosity of the boiling liquid, T bp is the
boiling temperature of the liquid and a. b, c, d and e are constants.
Following the conclusion of the experimental program, only three of the initial five factors
were considered to significantly affect the performance of the evaporator, leading to a
performance equation as follows:
ha ; K'(6t°'''w~,25 ' ~L -0,49)
where K' is a constant term including the effects of all parameters not contained within
the bracketed expression and At is the calcu1ated temperature difference across the boiling
10

CHAPTER 2 Lrr£RATURE REVIEW
film itself (the difference between the temperature of the inner wall of the tube and the
bulk fluid temperature).
2.2.2 Piret and !shin, (1954)
Piret and !sbin measured heat transfer coefficients in an experimental apparatus consisting
of a single tube vertical evaporator utilising a 46,5 in. (1,18 m) long, 1 in. (25,4 mm)
diameter, electrically heated copper test section. Heat fluxes ranging from 5,89 kW/m' to
165,62 kW/m' were supplied by three spirally wound heater coils attached to the outside
of the test section.
In total, 94 runs were performed using six different test fluids, namely water, isopropyl
alcohol, n-butyl alcohol, carbon tetrachloride and 35% and 50% potassium carbonate
solutions. It was found that all of the runs could be fitted by the following empirical
relation (developed by extension from the work of Linden and Montillon (1930) in
developing log mean velocity correlations for liquid film heat transfer coefficients):
= (D )0,8 (C f1 )0,6 ( )0,33 0,0086 U~PL P~L L "; .. . (1)
where h. .. is the average boiling heat transfer coefficient, D is the inner tube diameter, kt. is the thermal conductivity of the liquid, u", is the log mean liquid-vapour velocity in the
pipe: u", = (uv-uJlln[uJuJ,,o.. is the liquid phase density, ~L is the liquid phase viscosity,
CpL is the liquid phase heat capacity ,tr", is the surface tension of water at its normal boiling
point and a is the surface tension oftbe fluid of interest at its normal boiling point. This
relationship was found to fit the data with a mean deviation of only 4%, and with 91 ,3%
of the runs having a deviation of less than 10%. This empirical relationship was further
tested by making use of additional data for water and sucrose solutions up to 50%. All of
these data showed good agreement with the empirical relationship, as shown in Figure 3.
I I

C....,.,..,. 2 l.I"'TUu.T\JAE REVIEW
i· .. uu
It
200 ... •
.uu .. , • 80
? 60
i 1 ,
2C I
,
2 4 6 8 I 2 4 6
X 10' I. • • X 10
Figure 3. Correlation of the data ofPiret and Isbin with equation (I), [piret and !sbin, 1954]
12

CHAPTER 2 LITERATURE REVIEW
Piret and Isbin also correlated their experimental data using the pool boiling relatiooship
developed by Robsenow(1953):
•.. (2)
where T x is the heating surface temperature minus the fluid saturation temperature, hfg is
the latent heat of vapourisation, Cd is an empiric-a1 constant which depends both on the
tube metal and the liquid being evaporated, QI A is the heat transfer rate per unit area of
heating surface. g is the acceleration due to gravity and Pv is the density of the vapour
phase. The fitted data for the various fluids used in their study are shown in Figure 4.
0 -• ~
0
1 i , 1
I (..,.~ .,
,.~, '1 <P •• , ~(.
" ~.J.'" I · -, " !,t ~t " . ct'." ;,~" r-. t-~i o.~~ f;,,~1 I <i ~~ • ~o~ -~.-(.~.~ - 1/ ;p "'· -1' p+ .,
' I ~I ;,{ ..... " · " .... , :;- . · > , , ,.
' Ti ~/ t ! " of' t .. .~ .... ... ~ • _001 ...
Figure 4, Correlation of the data ofPiret and Isbin with equation (2) [piret and !sbin. 1954]
2.2.3 Coulson and McNelly, (1956)
Coulson and McNelly extended the work previollsly published by Coulson and Mehta
13

CHAPTER 2 LrrER.t.TURE REVIEW
(1953), with particular reference to the influence of large temperature differences OD the
heat transfer coefficient. They also developed a bener idea of the mechanism of boiling
within the tubes of a climbing film evaporator, and derived a general correlation for use
in the design of these evaporators. In order to carry out the experimental work., their
previously described equipment was modified to use pressurised hot water as the heating
medium and to allow for the use of tubes varying in diameter from V. ~ (6,35 mm) to I in.
(25,4 mm).
Some six hundred experimental investigations were carried out using a variety of fluids,
namely water, ethanol, carbon tetrachloride, isopropyl alcohol, kerosene, toluene and
cyclohexane. Most of the work was carried out with silver tubes, but some tests were also
performed with stainless steel and copper tubes. However, the nature of the tube material
used in the tests was not found to have any significant effect on the observed heat transfer.
For each test, the feed liquid was introduced into the evaporator at its boiling point at the
desired pressure of operation.. The experimental results were all found to fit the general
form shown in Figure 5, with the average boiling heat transfer coefficient as a function of
the temperature difference driving force at fixed values of the liquid feed rate, showing
three distinct regions AB, BC and CD.
Lo~(dT)
Figure S. General form of the relationship between boiling heat transfer coefficient and temperature difference. [Coulson and McNelly, 1956]
14
CHAPTER 2 LITERATURE REVIEW
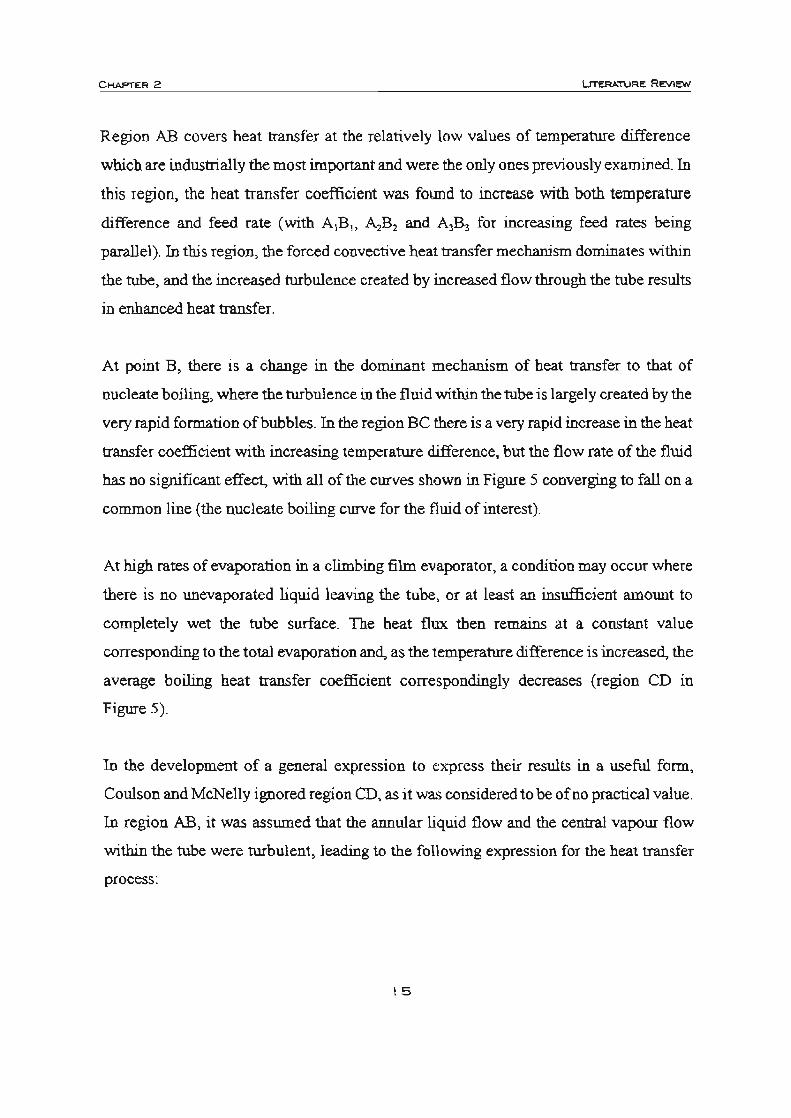
Region AB covers heat transfer at the relatively low values of temperature difference
whicb are industrially the most important and were the only ones previously examined. In
this region, the heat transfer coefficient was found to increase with both temperature
difference and feed rate (with AIBh A2B2 and A3B3 for increasing feed rates being
parallel). In this region, the forced convective heat transfer mechanism dominates within
the tube, and the increased turbulence created by increased flow through the tube results
in enhanced beat transfer.
At point B, there is a change in the dominant mechanism of beat transfer to that of
nucleate boiling, where the turbulence in the fluid within the tube is largely created by the
very rapid fonnation of bubbles. In the region BC there is a very rapid increase in the heat
transfer coefficient with increasing temperature difference, but the flow rate of the fluid
has no significant effect, with all of the curves shown in Figure 5 converging to fall on a
common line (the nucleate boiling curve for the fluid of interest).
At high rates of evaporation in a climbing film evaporator, a condition may occur where
there is no unevaporated liquid leaving the tube, or at least an insufficient amount to
completely wet the tube surface. The beat flux then remains at a constant value
corresponding to the total evaporation and, as the temperature difference is increased, the
average boiling heat transfer coefficient correspondingly decreases (region CD in
Figure 5).
In the development of a general expression to express their results in a useful form,
Coulson and McNelly ignored region CD, as it wa. considered to be of no practical value.
In region AB, it was assumed that the annular liquid flow and the central vapour flow
within the tube were turbulent, leading to the fonowing expression for the heat transfer
process:
15
CHAPreR 2 LrTERATURE REVIEW
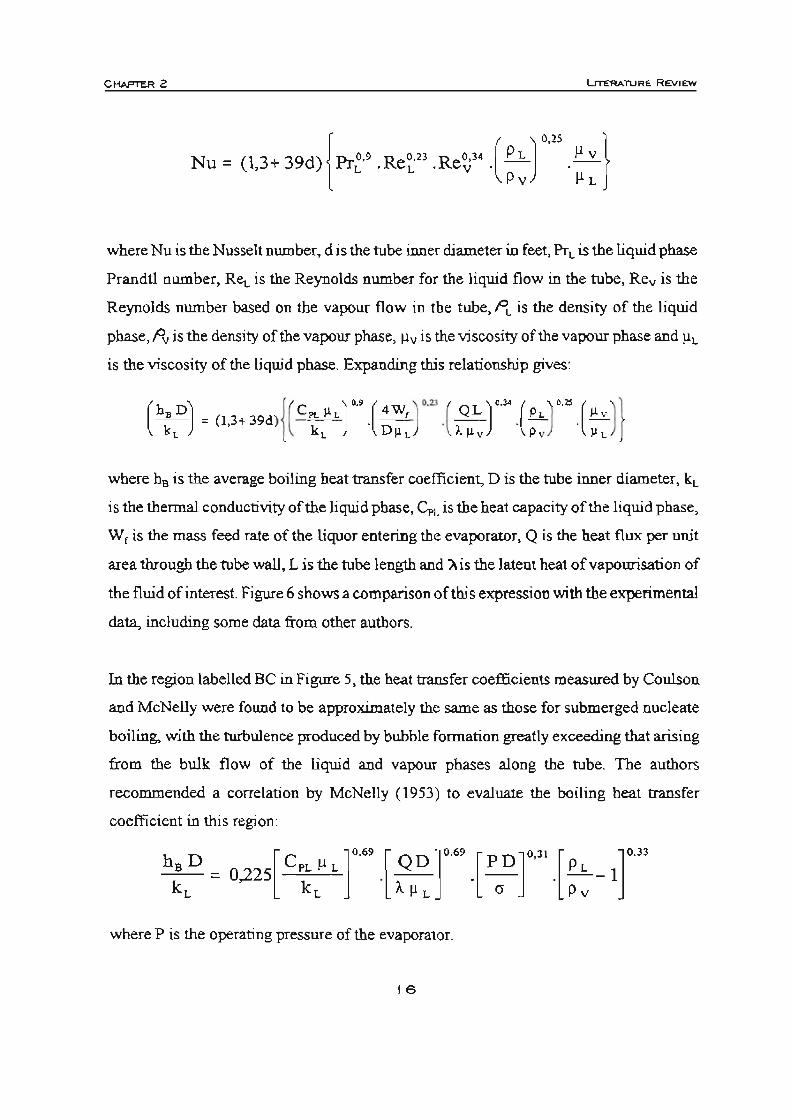
Nu= (I,3+ 39d){prt' .Re~·23 . Re~34 . ( ; ~r" .~:}
where Nu is the Nusselt nwnber, d is the tube inner diameter in feet, PrL is the liquid phase
Prandtl number, Ret is the Reynolds number for the liquid flow in the tube, Rev is the
Reynolds number based on the vapour flow in the tube, Pt is the density of the liquid
phase, Pv is the density of the vapour phase. ~v is the viscosity of the vapour phase and ~t
is the viscosity of the liquid phase. Expanding this relationship gives:
_._ = (13+ 39d) Pt. il L __ , __ ~ Il v (h D) {(C )'" (4W ),.D (QL )"" ( )"" ( )} kL' k L ' Dil L. . All v . Pv . il L
where he is the average boiling heat transfer coefficient, D is the tube inner diameter, kL
is the thermal conductivity of the liquid phase, CPl. is the heat capacity of the liquid phase,
Wr is the mass feed rate of the liquor entering the evaporator. Q is the heat flux per unit
area through the tube wall, L is the tube length and .... is the latent heat of vapourisation of
the fluid of interest. Figure 6 shows a comparison of this expression with the experimental
data, including some data from other authors.
In the region labelled BC in Figure 5, the heat transfer coefficients measured by Coulson
and McNeUy were found to be approximately the same as those for submerged nucleate
boiling, with the turbulence produced by bubble formation greatly exceeding that arising
from the bulk flow of the liquid and vapour phases along the tube. The authors
recommended a correlation by McNelly (1953) to evaluate the boiling heat transfer
coefficient in this region:
liB D = 0,22S[ CPL f!. t ]0 .• 9 .[_Q D ]0 .• 9 .[_P D ]o.3I .[~_ 1]°·33 k t k L Af!. L er Pv
where P is the operating pressure of the evaporator.
16
CHAPTER 2 LITERATURE REVI~
'00
' 00
so
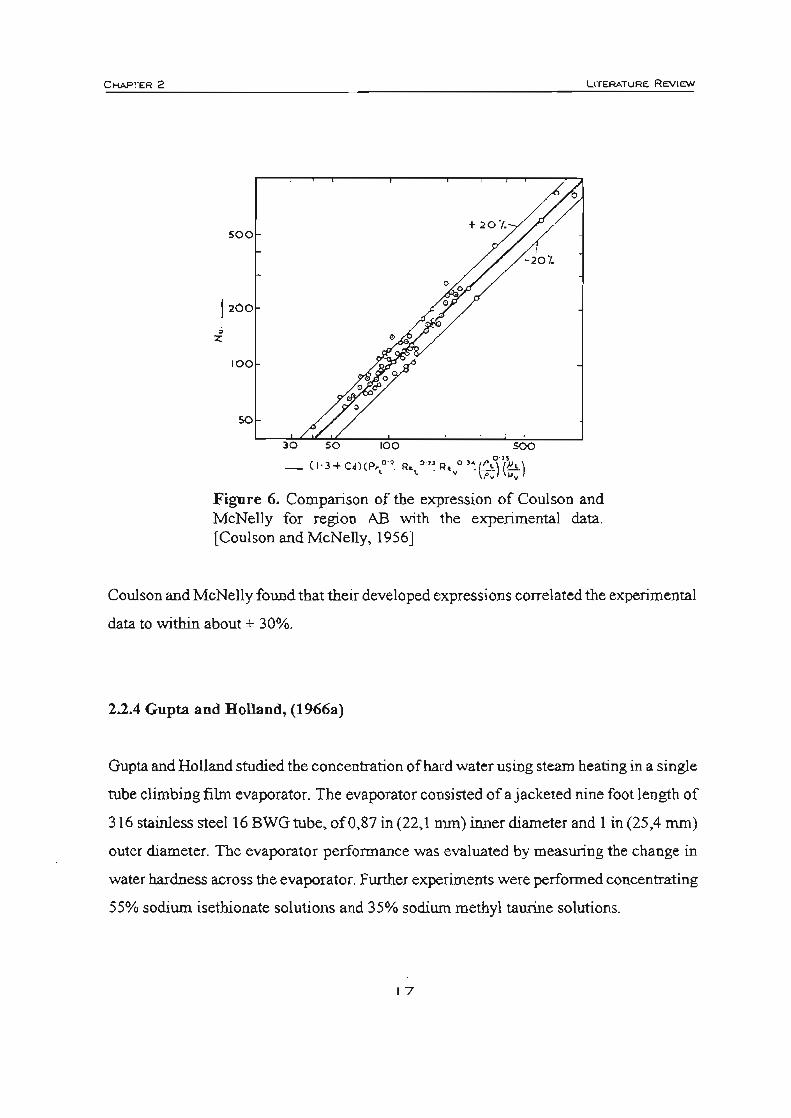
Figure 6. Comparison of the expression of Coulson and McNelly for region AB with the experimental data. [Coulson and McNelly, 1956]
Coulson and McNelly found that their developed expressions correlated the experimental
data to within about ± 30%.
2.2.4 Gupta and Holland, (1966a)
Gupta and Holland studied the concentration of hard water using steam beating in a single
tube climbing film evaporator. The evaporator consisted of a jacketed nine foot length of
316 stainless steel 16 BWG tube, of 0,87 in (22,1 mm) inner diameter and 1 in (25,4 mm)
outer diameter. The evaporator performance was evaluated by measuring the change in
water hardness across the evaporator. Further experiments were performed concentrating
55% sodium isethionate solutions and 35% sodium methyl taurine solutions.
17
C.....,...2 Lrr'ERA.TURE REVIEW
Seventy five experiments were done concentrating hard water. Four steam pressures.
namely 76,96, 118 and 132 psia (524,662,814 and 910 kPa(a)) were used. The feed
temperature varied between 50 and 180°F (10 and 82,2°C), with the feed water flow rate
ranging between 300 and 6331blbr (136,1 and 287,1 kglhr). The heat flux data obtained
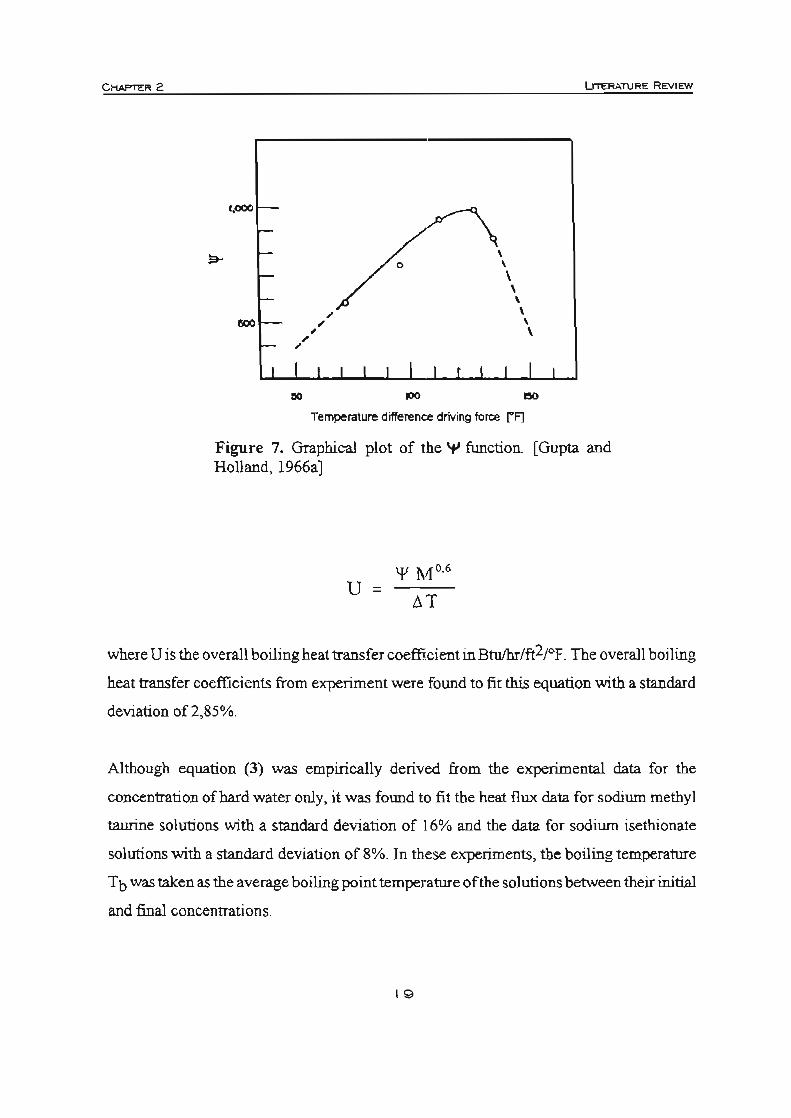
from the hard water concentration experiments were found to fit the empirical equation:
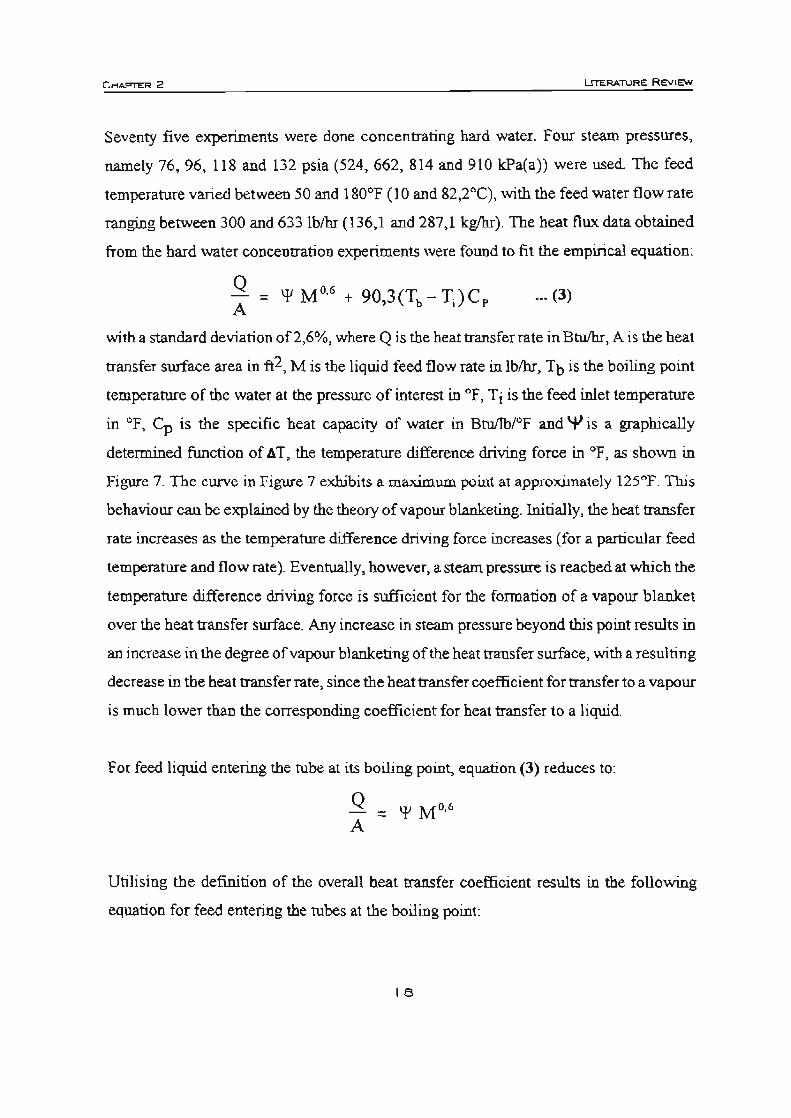
~ = 'I' M O.' + 90,3 (Tb - TJC p ••• (3)
with a standard deviation of2.6%, where Q is the heat transfer rate in BtuIhr, A is the heat
transfer surface area in ft2, M is the liquid feed flow rate in lblhr, Tb is the boiling point
temperature oftbe water at the pressure of interest in of . Tj is the feed inlet temperature
in of, c;, is the specific heat capacity of water in BtuIlbl"F and'+' is a graphically
determined function of Lt. T> the temperature difference driving force in of . as shO\vn in
Figure 7. The curve in Figure 7 exhibits a maximum point at approximately 125°F. This
behaviour can be explained by the theory of vapour blanketing. Initially, the beat transfer
rate increases as the temperature difference driving force increases (for a particular feed
temperature and flow rate). Eventually. however. a steam presswe is reached at which the
temperature difference driving force is sufficient for the formation of a vapour blanket
over the heat transfer surface. Any increase in steam pressure beyond this point results in
an increase in the degree of vapour blanketing of the heat transfer surface, with a resulting
decrease in the heat transfer rate, since the heat transfer coefficient for transfer to a vapour
is much lower than the corresponding coefficient for heat transfer to a liquid.
For feed liquid entering the tube at its boiling point, equation (3) reduces to:
Q = 'I'Mo,. A
Utilising tbe definition of the overall beat transfer coefficient results in the following
equation for feed entering the tubes at the boiling point:
18
CHAPTER 2
1,000
" ..
, , ,
o
100
~ , , \ \ , , ,
\
... Temperature difference driving force rFJ
Figure 7, Graphical plot of the It' fimction. [Gupta and Holland, 1966a 1
u=
where U is the overall boiling heat transfer coefficient in BtuIhr/ft2/oF. The overall boiling
heat transfer coefficients from experiment were found to fit this equation with a standard
deviation of 2.85%.
Although equation (3) was empirically derived from the experimental data for the
concentration of hard water only. it was found to fit the heat flux data for sodium methyl
taurine solutions with a standard deviation of 16% and the data for sodiwn isethionate
solutions with a standard deviation of 8%. In these experiments, the boiling temperature
Tb was taken as the average boiling point temperature of the solutions between their initial
and final concentrations.
19

CHAPTER 2 LrrERA"TURE REVIEW
2.2.5 Gupta and Holland, (1966b)
In the continuation of their work on climbing film evaporators, Gupta and Holland defined
three regions within the tube of a climbing film evaporator (namely liquid, foam and
climbing film) and presented a technique for estimating the lengths of these three regions
and the heat transfer coefficients within them. In the development of this technique. data
collected during their previous study was used, along with additional data collected using
the same experimental apparatus. The results obtained were plotted graphically, and no
adjustments or extensions to their previous climbing film evaporator model were
proposed.
2.2.6 Tang, (1980)
Tang modelled the flow in a climbing film evaporator tube on a theoretical hydrodynamic
and thermodynamic basis. The obtained model was used to determine the exit vapour and
liquid phase velocities. the mean residence time of the liquor within the evaporator tube
and the effective mean temperature difference across the tube wall The predictions of the
model were found to compare favourably, at least in order of magnitude, with the results
of experimental tests concentrating a sodium thiocyanide solution in a stainless steel
climbing film evaporator (tube diameter 25 mm, wall thickness 1,62 mm, length 3 m).
Unfortunately. no attempt was made to correlate heat transfer coefficients using the model.
2.2.7 Mayinger and Scbult, (1981)
Mayinger and Schult developed a model to predict the dynamic behaviour of a generalised
double phase change heat exchanger (a heat exchanger with a condensing fluid as the
heating medium and an evaporating fluid as the heated fluid). The primary bases of the
20
C"""""" 2
model were the basic laws of conseIVation of mass, energy and momentum, taking into
account the strong coupling between the boiling and condensation sides of the exchanger
via the heat fluxes transported and the heat stored. The partial differential equations so
obtained. are highly noniinear, and were therefore solved by an appropriate computer
program, using numerical methods. In order to simplify the mathematical treatment and
avoid long computational times for the numerical analysis of the system. the following
assumptions were made:
• The flow on each side of the tube wall was considered one-dimensional
• The vapour and liquid were considered to be in thermodynamic equilibrium
• The tube wall was considered to be very thin, or having a bigh thermal conductivity,
thus allowing it to be effectively neglected in the analysis
• The boiling fluid was considered to enter the tube in a subcooled state
• The condensing vapour was considered saturated
In order to solve the system of differential equations describing the syste~ constitutive
equations describing the following phenomena needed to be developed: subcooled boiling
on the evaporating side. two phase flow pressure drop on the evaporating and condensing
sides. the slip ratio on the evaporating and condensing sides and heat transfer with boiling
and with condensation. The information used to describe these phenomena was taken from
the literature in the form of empirical equations. As phenomena such as pressure drop and
heat transfer may be strongly dependent on the geometric conditions in the heat exchanger,
an experimental programme was used to select those equations from the literature best
suited to incorp>ration in the model. This experimental programme utilised a very simple
double phase change heat exchanger, evaporating refrigerant R12 using condensing steam.
Mayinger and Schult found that their model agreed well with the results of their
experiments, provided that no two-phase flow instabilities occurred, the frequency of
system perturbations was not too high and the system pressure was not changed too much.
21

C HAPTEA 2 l...rrERATURE REVIEW
2.2.8 Bourgois and Le Maguer, (1983a)
Bourgois and Le Maguer performed a literature survey in the field of climbing film
evaporator modelling, covering the period from 1970 to 1980. They found that very little
work had been done in the area of interest. Due to the large number of variables involved
and the limited state of knowledge of beat transfer, the results wbicb bad been obtained
by various authors for one set of conditions were of little real value in predicting
performance under a different set of conditions, 'Ibey set out to establish relationships for
the heat transfer and fluid flow phenomena in the boiling and non-boiling zones within the
tube of a climbing film evaporator, The constant coefficients in these relationships cou1d
then be empirically established using experimental data.
Theoretical analysis of the heat transfer across the tube wall in a section of tube 6 Z within
the non-boiling zone led to the following equation:
Pe, dln(T') Nu,; 4 dZ' ... (4)
where Nu. is the local Nusselt number, charactelistic of the evaporator length and the heat
transfer coefficient at position z in the tube, Pei is the Peclet number calculated at the
evaporator inlet conditions, T* is a dimensionless temperature variable:
, (T, - 1;) T ; (T, -T)
which is a function of position within the tube. Ts is the condensing steam temperature,
Ti is the temperature of the subcooled liquid at the inlet of the tube, T is the liquid
temperature at a distance z along the tube and Z· is the dimensionless distance along the
tube Z' -7lL, wbere L is the tube length. Evaluation of equation (4) requires a knowledge
of the relationship between In(T') and Z', which can be determined experimentally.
Making the following assumptions:
• The vapour phase within the tube is always saturated
22
CHAPTER 2 lrTER#l..11JRE REV1EW
• The inertia and acceleration terms within the momentwn balance equation are much
larger than the frictional terms (which is usually true for rapid evaporation)
, Incompressibility of the liquid phase
• Not much temperature variation within the boiling zone, thus allowing the
temperature dependence of the liquid and vapour phase densities to be ignored
• Along the saturation curve of water, the absolute temperature and pressure can be
related by T ~ cP', where c ~ 166,766 and n = 0,06978, and the vapour phase
behaves as an ideal gas
and carrying out a momentum balance, Bourgois and Le Maguer developed the following
relationship for the pressure distribution along the tube of a climbing film evaporator:
v, ( (P,-SP,) ) dW, dP
- R' Ps +S- I dZ,-g(ap ,+ p,(l-a»L 1t p ,p,
---~~~~~--~~~-----------dZ' a (1- n)
l-pV'- p -' 'p , Rc
•.. (5)
where P is the pressure at distance z along the tube. Vi is the liquid phase velocity at
distance z along the tube, R is the universal gas constant (8314,5 JlkmollK), f> is the
density of the two phase mixture at distance z along the tube, P, is the liquid phase density
at distance z along the tube, S is the slip ratio (V,N, where V, is the vapour phase velocity
at distance z along the tube),f>, is the vapour phase density at distance z along the tube,
W 2 is the vapour phase mass flow rate at distance z along the tube, g is the acceleration
due to gravity and« is the volume fraction of the vapour phase at distance z along the
tube. The value forC(.is not known. but was determined by Bourgois and Le Maguer using
the modified Dannouth correlation for vertical upward cocurrent annular flow as proposed
by Turner (1966):
.' ., h J,
= 1 1- 3,1(I-a) 3,1 (1 - a)
where j l- is the dimensionless volumetric liquid flux at distance z along the tube, as
23
CHAPnO< 2 LrrER.<o.TURE REVIEW
defined by:
U] is the volumetric liquid flux at distance z along the tube and D is the inside diameter
of the tube). Similarly, j, ' is the dimensionless volumetric vapour flux at distance z along
the tube, as defined by:
where j2 is the volumetric vapour flux at distance z along the tube.
Equation (5) can be solved numerically once dW,IdZ' is known.
From a steady state beat balance at a distance z along the tube, Bourgois and Le Maguer
developed the following relationship for Uv the local beat transfer coefficient, in the
boiling zone, at distance z along the tube:
1 [A dW, 0_ 1 dP] U z = nDL(P; _ PO) 7 dZ' + (W1C ,1 + W, C,,)nP dZ' ... (6)
where p$ is the pressure of the condensing steam, A is the latent heat ofvapourisation of
the liquid phase, W, is the liquid pbase mass flow at distance z along the tube, C" is the
heat capacity of the liquid phase and Cp2 is the heat capacity of the vapour phase.
Assuming a constant mass rate of evaporation along the length of the tube, equation (6)
can be solved numerically together with equation (5) once dW,IdZ' is known (or
detennined by experiment).
24
Ct1AFTER 2 LiTERATURE REVIEW
2.2.9 Bourgois and Le Maguer, (1983b)
In the second publication regarding their climbing film evaporator model, Bourgois and
Le Maguer validated their theoretically developed equations using a pilot scale single tube
borosilicate glass climbing fIlm evaporator. The glass tube used was 3 metres in length.,
with a 30 mm inside diameter and a 1,53 mm wall thickness. This tube was exposed to a
2,7 metre long glass steam jacket of diameter 50 mm. Seven thermocouples were located
along the axis of the tube in order to determine the temperature profIle of the boiling fluid.
To allow for independent study of the separate zones within a climbing film evaporator>
the experimental study was divided into three parts:
• Experiments with the liquid phase completely filling the tube, with no evaporation.
This allowed the phenomena of the non-boiling zone to be studied.
• Experiments with the liquid phase entering the tube at its boiling point, to enable
the phenomena of the boiling zone to be studied.
• Experiments utilising a combination of conditions in the previous two sets of
experiments, to permit the study of the performance of the evaporator under norma1
conditions of use in industry. For these tests, sucrose solutions and tomato juice
were used in addition to water.
Results obtained during the OOt set of tests suggested that, for a given flow rate, In(T')
could be approximated by a second degree polynomial in Z':
In(T') ; A + B.Z· + C.Z"
leading to the following form for equation (4) describing the heat transfer in the non
boiling zone:
Pe · • Nu, ; 4(B+ 2CZ )
where the coefficients B and C were detennined by best least squares fit of the
25
CHAP'T'ER 2 ~1'\JRE REVIEW
experimental data as:
O 4 8 9445 5,22 x 10'
B=- , 5+ p + , e j Pe j
and
c= o 238 + _75_5 _ .:.13:..:5=--x=--I:..::0_' , Pe j Pe~
In the second series of tests, the boiling zone was studied. For this zone. the equations
previously developed by Bourgois and Le Maguer for pressure drop and heat transfer
contain the mass flow rates of the liquid and vapour phases within the tube. However.
these values can only be determined by experiment at the inlet and outlet of the evaporator
tube. For their analysis, the authors assumed a linear increase in vapour quality (and hence
vapour mass flow rate) with distance along the tube, yielding:
dW, dZ' = W2,
where W2e is the mass flow rate of vapour exiting the tube. This allows the differential
equation describing the pressure drop (equation (5)) to be numerically solved to obtain
local values of pressure along the length of the tube. Similarly, equation (6) can be
numerically evaluated to yield local values of the boiling heat transfer coefficient along
the length of the tube. Bourgois and Le Maguer also correlated the heat transfer
coefficients obtained in their experiments with the dimensionless distance along the tube,
Z· , using a least squares fit for a polynomial equation of order 2:
U, = 615,5-112Z' + 41,55Z"
Using this correlation within equation (6), with rearrangement, allows the vapour
generation rate dWi dZ& to be determined at any point within the tube:
26
CHAPTER 2
dW2
dZ' = 1[DcLU,
A (P; _ pn) _
(W1CpI + W2C p2 ) ncp·-l
A
dP
dZ'
In the third set of experiments, the authors tested their model by using conditions resulting
in both the non-boiling and boiling zones being present within the tube. The known
variables used as inputs to the model were the initial feed conditions (such as the feed inlet
temperature T j and the mass flow rate offeed W), the system vacuum pressure at the top
of the tube P" and the steam pressure Ps. The desired outputs of the model were the
distance at which boiling starts Zt,., the mass flow rate of vapour at the exit of the tube W 2e
and the temperature at the outlet of the evaporator Te.
The experimental work to test the model was carried out with water, sucrose solutions of
different concentrations and tomato juice. Bourgois and Le Maguer found that the
differences between the experimental values of the distance at which boiling began and
the vapour production rate at the evaporator exit were always within 10% of the calculated
values using the model They considered this to be reasonable, given the measurement
errors inherent to their system.
2.2.10 Bourgois and Le Maguer, (1984)
In the third paper regarding their climbing film evaporator model, Bourgois and Le
Maguer applied the model to an industrial scale climbing film evaporator used to
concentrate pineapple juice from 13,5 to 62% (mlm) at a feed flow of approximately 5 tIh.
The evaporator was composed of three sections, each section having a greater number of
tubes than the previous ODe to allow for the inc.reased volume of vapour and to ensure a
climbing film boiling regime during the entire evaporative process. The tubes in the first
27
C""""'" 2 l..rn:.RA1'\JRE REVIEW
two sections of the evaporator were oflength 2,13 rn, while those in the third section were
oflength 2,44 m. All tubes were of stainless steel, with inner diameter 19 mm. The heat
transfer information used in the evaporator model was corrected for the change in thermal
conductivities to take into account the change in tube material from glass to stainless steel.
As the inlet pressure into the industrial evaporator was unknown, it was necessary for
Bourgois and Le Maguer to estimate this quantity before computing the model. This
estimate was then iteratively updated fonowing successive model runs, in order to match
the outlet pressure to that observed experimentally. The method of calculation of the
model was as follows:
• From the estimate of the inlet pressure and the composition and temperature of the
feed, a flash calculation was performed to calculate the ratio of vapour to liquid in
the feed entering the tubes.
• Assuming that the flow in the industrial evaporator was equally distributed between
all of the tubes, the flow to one tube in the evaporator was calculated. The original
model was then applied to a single tube.
• Account was taken of the pressure drop between successive sections of the three
stage evaporator, based on losses due to hydrostatic head, expansion and
contraction.
Bourgois and Le Maguer found that the model was adequate for predicting the behaviour
of the industrial climbing film evaporator under study. The measured values for the
product concentration and vapour flow rate at the evaporator outlet were found to differ
from the calculated values by 2,7% and 0,8%, respectively. The calculated amount offlash
vapour generated on entry into the tubes was calculated to be 4% of the feed flow,
ensuring immediate two phase flow within the tubes. The initial void fraction was
calculated as 0,619, with the local heat transfer coefficient found to decrease with
increasing void fraction. The velocities at the top of the tubes were found to be 1,59 mls
for the liquid phase and 59,0 m/s for the vapour core. From the inlet to the outlet, the slip
28
C...,.,.... 2 LrTERA.nJRE REVIEW
ratio within the tubes varied by no more than 5%, which was considered to be consistent
with theory.
2.2.11 Zinemanas et aL, (1984)
Zinemanas and his co-workers developed a general algorithm for the simulation of vertical
and horizontal shell and tuhe heat exchangers with change of phase of one or more
components. The algorithm calculates local values of the variables of interest along the
length of the heat exchanger tubes and was found to yield acceptable accuracy when
compared with experimental data for systems of one to three components.
Model Development
The design of heat exchangers follows the basic differential equation for heat transfer:
dQ - = U ~T dA . ••• (7)
where dQ is the amount of heat transferred, U is the local overall heat transfer coefficient,
AT is the temperature difference driving force and dA is the heat transfer area element.
Rigorous integration of equation (7) is possible ifreliable correlations for the heat transfer
coefficients. pressure drop and physical properties are available. In their study, Zinemanas
et al. utilised simultaneous pointwise integration of both equation (7) and the differential
equation describing the hydrodynamics of the system, using the best available correlations
in the literature for each flowpattem type within the heat exchanger tube. A vapour-liquid
equilibrium correlation was used for systems of more than one component l, The
assumptions employed in the model development were:
• steady state,
This aspect of the model ofZinemanas et al. will not be discussed in detail here, as it is not relevant to the current study.
29

CHAPOUO 2
• adiabatic overall heat exchanger system.
• thermodynamic equilibrium between the phases,
• uniform temperature profiles across any cross-section of the tube.
Rearranging equation (7) yields:
Q, dQ A = f--"-"~
o U .t. T •.• (8)
l.J'TEu,nJRE REVIEW
where U and A.T are non-linear, non-explicit functions ofQ. Thus numerical integration
is needed. Q is obtained from the enthalpy balance of the system
dQ = M.dH ... (9)
where M is the mass flow rate and dH is obtained from:
dH = (XC'L + (1- x)C,v )dT + A dx .•• (10)
where dT is the differential change in temperature of the stream, x is the steam quality, C,c
and Cpv are the heat capacities of the liquid and vapour phases and 1\ is the phase change
enthalpy, neglecting the pressure change in the differential element.
Equations (8), (9) and (10) are integrated numerically, together with the pressure drop
relationship for the flow pattern identified within the tubes.
The local overall heat transfer coefficient used in the integration is calculated using
1 I = - +
U hi
Di R ro + h
o Do
where U is the overall heat transfer coefficient, Do and Dj are the outer and inner tube
diameters, respectively. Rro and ~ are the outer and inner fouling resistances. kw is the
thermal conductivity of the tube wall material and l\, and 11; are the outer and inner local
30
CHAP'OR 2 LITERATURE REVI~
heat transfer coefficients.
The model calculation is based on numerical integration using steps of constant entbalpy
change (AH,). For each integration step (k), the physical properties are a function oftbe
local conditions for that step. The incremental pressure in the current step is that
calculated in the previous step. The temperature is calculated from the incremental
enthalpy balance, resulting in
for single phase flow and
lIQ = Tk + ~~
MCpk
for two phase flow. where Ts (x~ P) is the saturation temperature. This is a nonlinear
equation which needs to be solved (forxk+l) simultaneously with the material balance. The
flow pattern prevailing within the tubes is identified and the applicable heat transfer
correlations are used. The overall local heat transfer coefficient is calculated, together with
the beat flux equalities on both sides of the Wall , which have to be matcbed, by an iterative
procedure.
The area increment which corresponds to the relevant enthalpy increment step is then
calculated
From the corresponding length increment calculated from the geometry of the tubes, the
pressure for the next step is calculated:
3 1

CHAPTER 2 LITERATURE REV1EW
(refer to the next section on Hydrodynamics and Heat Transfer for details). The
calculation procedure stops when the total heat transferred reaches the total required heat
duty for the heat exchanger (QT).
Hydrodynamics and Heat Transfer
A thorough review of the literature was undertaken by Zinemanas et al. in order to choose
the best available heat transfer and pressure drop correlations for inclusion into the model.
Correlations were also chosen for the identification of the flow pattern existing within the
tubes.
For single phase flow, the pressure drop is well defined. The local heat transfer coefficient
values within the tubes were calculated using Dittus-Boelter type expressions, as
recommended by Hughmark (1969).
The pressure drop equations for two phase flow included an acceleration tenn in addition
to the frictional and gravitational terms. The Lockhart-Martinelli (1949) pressure drop
correlation was utilised, in the form presented by Collier (1980). For calculation of the two
phase local heat transfer coefficients within the tubes, the correlation of Chen (1966) was
used.
Experimental Verification
Zinemanas et al. tested their model using data available in the open Literature. In general,
the tube lengths calculated by the model agreed well with the experimental lengths. For
one of the data sets tested, the average difference for all runs was found to be 22,5%,
which shows some limitations in the heat transfer correlations used in the model.
32

CHAPTER 2 LITERATURE REV1EW
2.3 CONCLUSIONS
Not many mathematical models of the climbing film evaporator system exist in the
available literature. Early studies considered the evaporator system using lumped
parameter models. utilising average values of the relevant process variables to describe
the overal1 behaviour of the system.
Only two distnbuted-parameter climbing film evaporator models were found in the
author's survey of the literature, the first being due to Bourgois and Le Maguer (1983a,
1983b, 1984). Their model was, however, based on several simplifying assumptions, such
as the asswnption of a constant mass rate of evaporation along the length of the tube. This
assumption may is the major drawback of the modeL
The most recent work in the field of climbing film evaporator modelling was the
comprehensive study of Zinemanas et al. (1984), who studied the simulation of heat
exchangers with change of phase. While the model of Zinemanas et aT. is> in principle,
similar to that developed by the author, their work was aimed at providing a generalised
model for many types of evaporating heat exchanger, and incorporating multicomponent
vapour-liquid equilibrium. The aim of the current study is to provide a mathematical
model specific to the climbing fi lm evaporator in the sugar industry, based on
experimental data gathered under industrial conditions, and including extension to
practical applications.
33

Chapter 3
Model Description
To describe fully the climbing film evaporator system, it is necessary to obtain information
about the pressure, component flow rate and temperature distributions along the length of
one of the tubes within the apparatus under steady state conditions. For this purpose, a
system of ordinary differential equations can be developed from first principles to describe
fully the conditions inside and outside an evaporator tube. These strongly-coupled
differential equations require solution using a numerical integration procedure.
3.1 BASIC MODEL PHILOSOPHY
The system to be modelled is that of a climbing film evaporator in a raw sugar mill. as
shown conceptually in Figure 8. Clarified cane juice (known as clear juice) is red to a
preheater, where it is heated to a temperarure close to, or slightly above, the normal juice
boiling point. The heated juice is then fed to the bottom of the tubes of the climbing film
evaporator. For the purposes of modelling, the clear juice is assumed to be a tbree
component mixture. consisting of water, sucrose and non-sucrose dissolved solids
(impurities).
The main purpose of modelling the climbing film evaporator system is to determine the
temperature distribution across a sing1e tube of the apparatus as a function of the tube
length. This temperature distribution will include:
• the steam temperature. T s
• the outer tube wall temperature. T .... 1
• the inner tube wall temperature. T ... "2
• the liquid temperature, T l> and
• the vapour temperature, Tv.
34

CHAPTER 3
v ...... LJ .. -
ator Evapor
C __
"-tedJuic.
Prehe ater
Cold Julc.
Figure 8. A conceptual view of the system to be modelled.
M ODEL D ESCRIPTlON
The steam temperature is assumed to be constant and known. The two tube wall
temperatures result from the continuity conditions for the steady state heat flux across the
tube walL Under conditions of no boiling within the tube, the liquid temperature results
from an enthalpy balance for the liquid. Under boiling conditions, the liquid boiling point
temperature is defined by the pressure and the liquid composition. At any cross-section
within the tube, the vapour temperature is assumed to be the same as that of the liquid
phase. This implies a certain degree of superheating of the vapour phase.
The hydrodynamics of the climbing film evaporator system can be characterised by:
• the mass flow rate of condensate per unit length of the tube perimeter, r • the mass flow rate of the liquid, L, and
• the mass flow rate oftbe vapour, V.
The mass flow rate of condensate per unit perimeter length resu1ts from an enthalpy
35
CHAPTER 3 MODEL DESCRIFnON
balance, based on the Nusselt theory of condensation. The mass flow rate of liquid is
calculated using a total flow (liquid and vapour) mass balance within the tube. The mass
flow rate of vapour results from an enthalpy balance within the tube.
The composition of the liquid phase within the tubes can be defined by two mass fractions:
• the mass fraction of sucrose, s, and
• the mass fraction of impurities, r.
The sucrose content of the liquid phase results from a sucrose balance within the tube.
Similarly, the impurity content results from an impurity mass balance. The vapour phase
is assumed to be pure water, free of both sucrose and impurities.
The total pressure within the tubes is governed by a momentwn balance within the tube,
containing terms due to:
• the viscous fluid pressure drop
• the weight of the two-phase mixture (hydrostatic bead), and
• the flow acceleration affect.
For the purposes of model solution. it is assumed that the following boundary condition
quantities are known under a given set of evaporator operating conditions and can be
assigned numerical values as system input parameters:
•
•
•
•
•
•
the mass flow rate of cold j uice through the preheater. Fo
the mass fraction sucrose content of the clear juice fed to the preheater, sp
the mass fraction impurity content of the clear juice fed to the preheater, rp
the temperature of the heated juice leaving the preheater, T LO
the vapour space pressure at the top of the evaporator tubes, Ptop
the mass flow rate of condensate per unit tube perimeter at the top of the evaporator
tubes, r,
The mass flow rate of condensate per unit perimeter length at the top of the tubes, r 0> is
36

C HAPTE.R 3 MOOE1.. OESCR1P'TlON
taken to be zero, as there is assumed to be no condensate film present at the very top of
the tubes.
3.2 GENERATION OF THE BALANCE EQUATIONS
Mass, momentum and enthalpy balances can be fonnulated for the climbing film
evaporator system, utilising the following assumptions:
• steady state conditions are assumed to exist in the evaporator system at all times,
and
• a plug flow model is assumed for the hydrodynamics of the system (i.e. there is no
radial or axial mixing of the fluid being evaporated).
As all the variables of interest vary continuously along the length oftbe tube, the relevant
balance equations were formulated for a differential tube length section, dz. The bottom
cross-section of the tube was assumed to be at z = o.
3.2.1 Total mass balance of liquid and vapour
A total mass balance can be fonnulated by considering the differential element, dz, shown
in Figure 9 .
37
CI-tAPT!:R 3
The resulting balance
L +dL V+dV
o r :)
dz I Cl 0
Cl
=- • • (\ UD r
L V
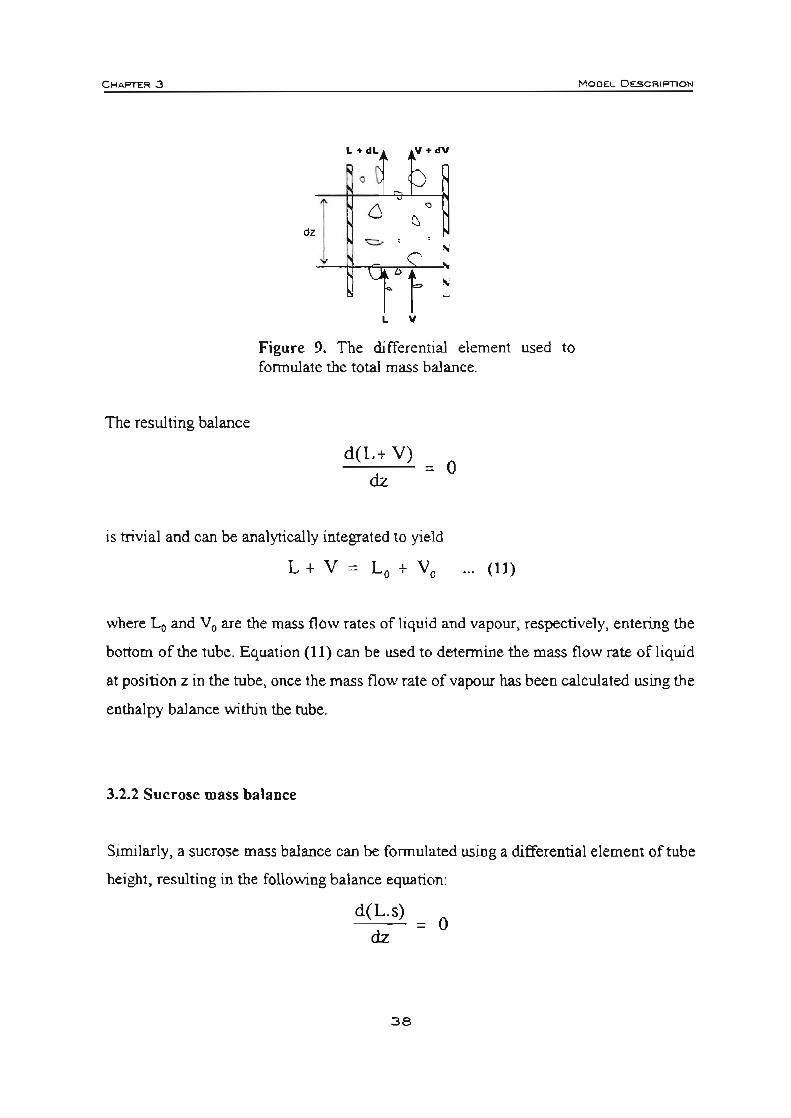
Figure 9. The differential element used to formulate the total mass balance.
d(L + V)
dz = 0
is trivial and can be analytically integrated to yield
L + V = Lo + Vo ... (U)
MODf:L DESCRIPTlON
where Lo and Vo are the mass flow rates ofliquid and vapour, respectively. entering the
bottom of the tube. Equation (11) can be used to determine the mass flow rate ofliquid
at position z in the tube, once the mass flow rate of vapour has been calculated using the
enthalpy balance within the tube.
3.2.2 Sucrose mass balance
Similarly, a sucrose mass balance can be fonnulated using a differential element of tube
height, resulting in the following balance equation:
d(L.s)
dz
38
= 0

MOOEI.. DESCAIP'TlON
which can be easily analytically integrated to yield
L.s = Lo'so (12)
where So is the mass fraction sucrose in the liquid phase entering the bottom ofthe tubes.
3.2.3 Impurity mass balance
An impurity mass balance can be fonnulated to yield
d(L.r)
dz = 0
which is trivial and can be analytically integrated to yield
L.r = Lo. ro ... (13)
where ro is the mass fraction non-sucrose dissolved solids (impurities) in the liquid phase
entering the bottom of the tubes.
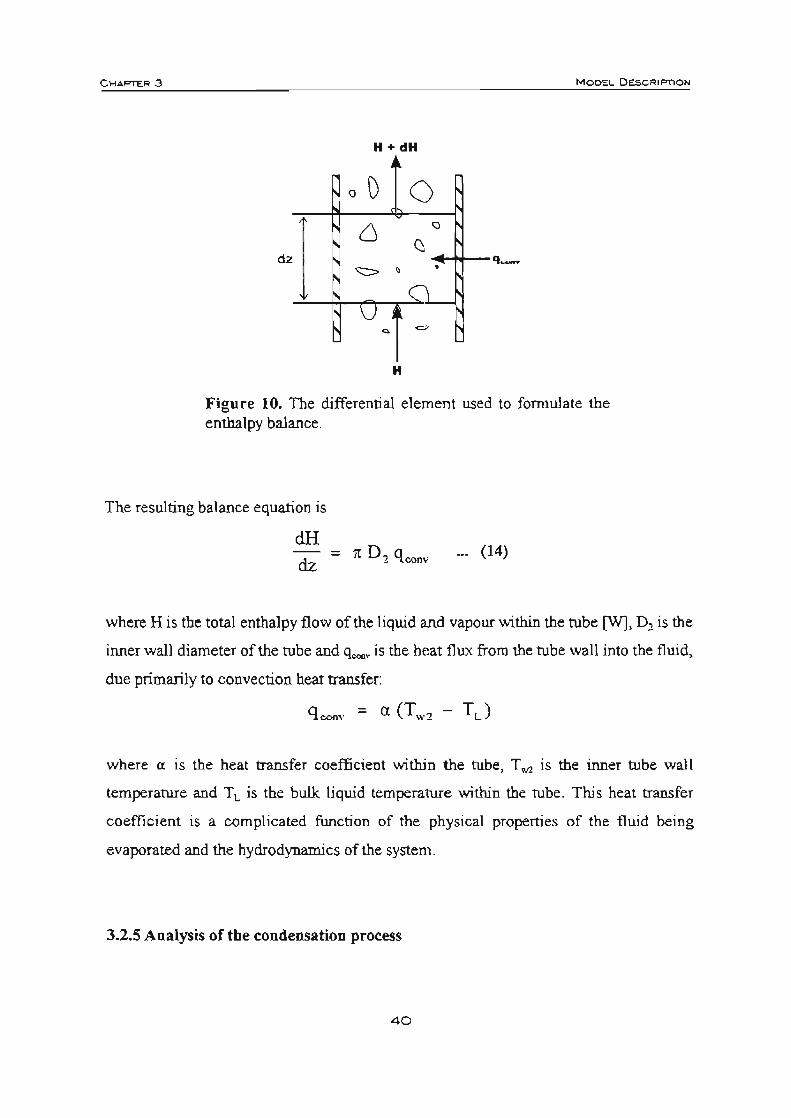
3.2.4 To!al enthalpy balance of liquid and vapour
A total enthalpy balance within the tube can be formulated by considering the differential
element of tube length, dz, shown in Figure 10.
39
C MAPTER 3 MODEL DESCRIPTION
H +dH
o \) 0 Cl Q
Q. dz
<::> , . Cl
V ~ =
H
Figure 10. The differential element used to fonnulate the enthalpy balance.
The resulting balance equation is
dH
dz 11 D, q"",v .•. (14)
where H is the total enthalpy flow of the liquid and vapour within the tube [WJ, D, is the
inner wall diameter of the tube and q~. is the heat flux from the tube wall into the fluid,
due primarily to convection heat transfer:
qo=v = (l (Tw2 - TL )
where et is the heat transfer coefficient within the tube, T..a is the inner tube wall
temperature and T L is the bulk liquid temperature within the tube. This heat transfer
coefficient is a complicated function of the physical properties of the fluid being
evaporated and the hydrodynamics of the system.
3.2.5 Analysis of the condensation process
40

CHAPTER 3 MOO!:L OESCRIFnON
Traditionally, the condensation process is analysed as originally postulated by Nusselt (see
Monrad and Badger, 1930), where wholly laminar flow of the condensate film and a
constant wan temperature are asswned. However, for this study, the second simplification
was considered unrealistic and thus the traditional theory was appropriately modified to
allow for a more general approach (based on the approach by Mills, 1992).
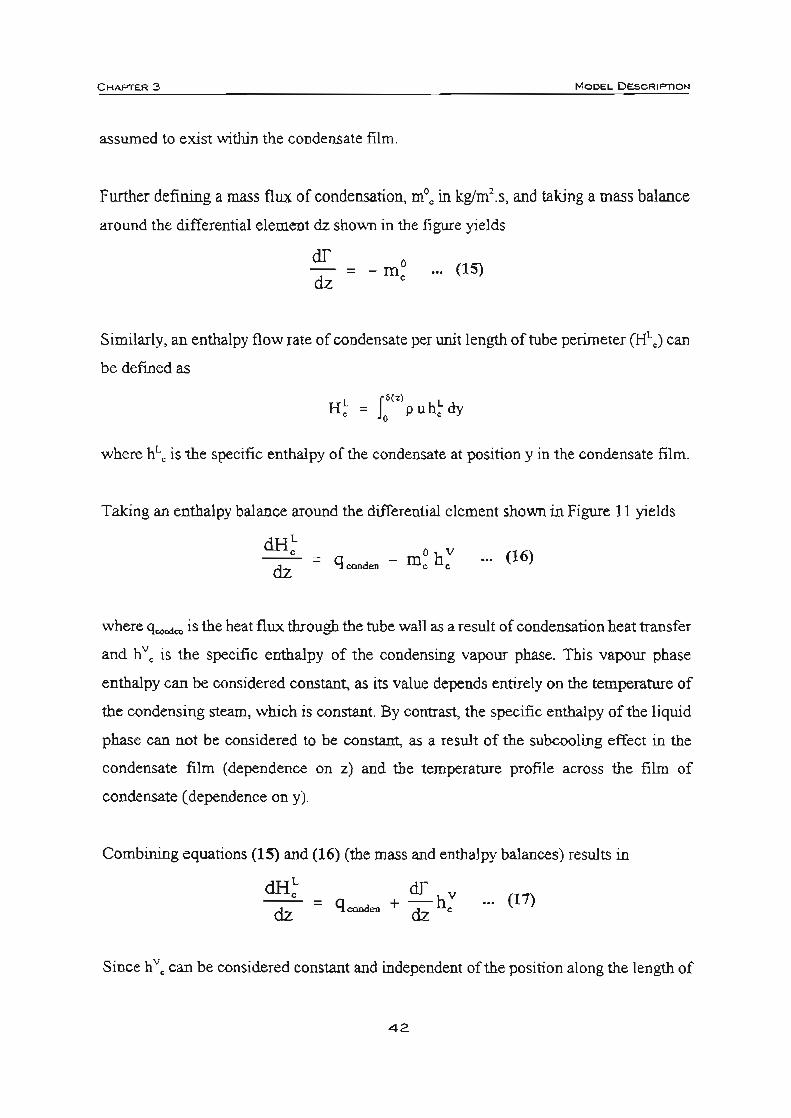
The condensation process occumng on the outside tube wall can be analysed by
considering a differential element of tube length, dz, as shown in Figure 11 .
~'m
i H' • r
, ,J
Figure 11. The differential element used for the condensation analysis.
There are two assumptions made in analysing the control element shown in Figure 11 :
• the film velocity of the flowing condensate is fairly low (laminar flow), and
• temperature gradients in the z direction (along the length of the tube) can be
considered negligible.
A mass flow rate of condensate per unit length of tube perimeter (I') can be defined as
f&(')
r = 0 p udy
where p is the density of the condensate, u is the velocity of the condensate film al
position y in the condensate film, 6(z) is the thickness of the condensate film at position
z along the tube length and dy is a differential element of condensate film thickness. It
should be noted that this definition for r is independent of the nature oflhe flow pattern
41
CHAPTER 3 MODEL DESCRIP'TlON
assumed to exist within the condensate film.
Further defining a mass flux of condensation, mOo in kg/m' .s, and taking a mass balaoce
around the differential element dz shown in the figure yields
cif dz
... (15)
Similarly, an enthalpy flow rate of condensate per unit length of tube perimeter (HLo) can
be defined as
fb{Z) H; = 0 p u h ~ dy
where hLc is the specific enthalpy of the condensate at position y in the condensate film.
Taking an enthalpy balance around the differential element shown in Figure 11 yields
dH L , dz
o hV == q conden - m e e
••• (16)
where qClOl'ldco is the heat flux through the tube wall as a result of condensation heat transfer
and hVo is the specific enthalpy of the condensing vapour phase. This vapour phase
enthalpy can be considered constant. as its value depends entirely on the temperature of
the condensing steam, which is constant. By contrast, the specific enthalpy of the liquid
phase can not be considered to be constant, as a result of the subcooling effect in the
condensate film (dependence on z) and the temperature profile across the film of
condensate (dependence on y).
Combining equations (15) and (16) (the mass and enthalpy balances) results in
dz ••• (17)
Since hVc can be considered constant and independent of the position along the length of
42

CHAPTER 3
the tube (z), equation (17) can be written as
dz
which can be rearranged to yield
d(fh; - H~ ) dz
M ODEL D ESCR1PT10N
= - q""""""
By appropriate1y defining a condensation and subcooling enthalpy flow rate for the
condensate film CH" in W/m) as
the mass and enthalpy balances for the condensate film can be reduced to one simple
differential equation:
= - q """"" ,.. (18)
3.2.6 Momentum balance within the tube
Considering the differential element of tube length, dz, shown in Figure 12, a two phase
momentum balance within the tube can be formulated (Holland and Bragg, 1995) to yield
: = -U, :) -[ ~ , !(LUL + VUv)] -( : : Pv + : : PL)g
where p is the pressure at height z within the tube, ~ is the cross-sectional area for flow
within the tube, F is the frictional drag force ofthe tube wall, L is the mass flow rate of the
liquid phase. V is the vapour phase flow rate, UL is the liquid phase velocity. u., is the
vapour phase velocity, Axv and A.ct are the cross-sectional areas for flow of the vapour and
43

CI-lAPTER :3 MODEL DESCRIPTlON
liquid phases within the tube, respectively and p,. and PL are the vapour and liquid pbase
densities, respectively.
Assuming the homogenous flow model of two"phase fluid flow within the tube, which
implies no slip between the liquid and vapour phase flows, the following simplification
results:
dp
dz
IdF = ----
Adz ••• (19)
where m' is the total mass flux of the two phase fluid flowing through the tube, u is the
average velocity of the two phase fluid at point z in the tube, Pm is the density of the two
phase fluid and g is the acceleration due to gravity.
Making use of the following definition:
rn' u
P ..
44
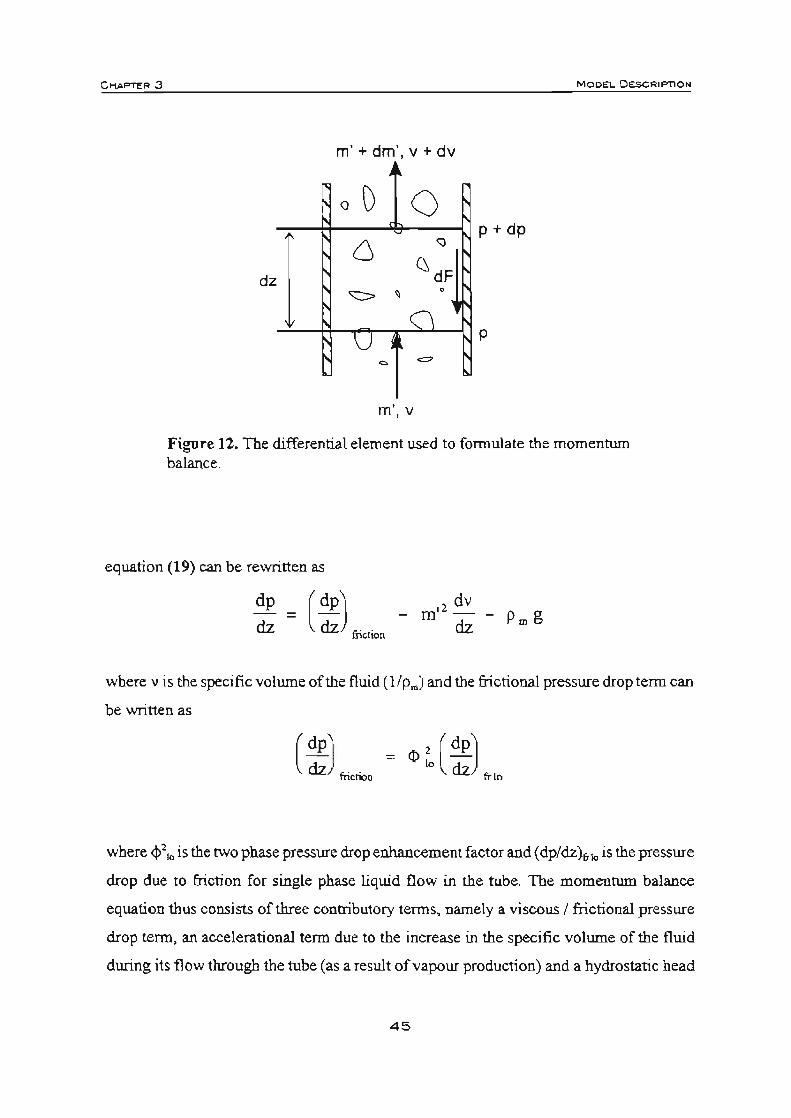
CI-1.It.PTER3 MOOEL DESCRIFnON
rn ' + drn', v + dv
<J 0 0
dz
6 '" C, dF
P +dp
<::::> , •
Cl \J
p
~ =
m',v
Figure 12. The differential element used to fonnulate the momentum balance.
equation (19) can be rewritten as
where v is the specific volume of the fluid (1/Pm) and the frictional pressure drop term can
be written as
where 4>2 kI is the two phase pressure drop enhancement factor and (dpldz )frkl is the pressure
drop due to friction for single phase liquid flow in the tube. The momentum balance
equation thus consists of three contributory tenns. namely a viscous I frictional pressure
drop tenn. an accelerational tenn due to the increase in the specific volume oftbe fluid
during its flow through the tube (as a result of vapour production) and a hydrostatic head
45

Ct-lAPTER3 MODEL. DESCRIP'TlON
tenn.
It is nwnerically convenient to combine the two derivatives in the equation into one tenn.
Thus, defining a modified pressure tenn, the following ordinary differential equation
results:
where
dp
dz
p = p +
..• (20)
m'2
Pm
3.2.7 The balance equations
To summarise, the following balance equations can be formulated for the climbing film
evaporator system:
and
L + V = L o + Vo ... (11)
dp
dz
L.s = Lo'so (12)
L.r = Lo.ro (13)
dH
dz
=: - qcoDdcn
46
••. (14)
... (18)
... (20)
MODEl. DESCRIPTION
where
rn'2 p p +
Pm
Thus the system is described fully by a set of six ordinary differential equations, three of
which can be analytically integrated.
3.2.8 Reat flux continuity across the tube wall
In the climbing film evaporator system, heat flows from the condensing steam to the
boiling juice through the tube wall Under steady state conditions, continuity of this heat
flow requires that the product of heat flux and swface area remain constant for each of the
heat transfer mechanisms involved in the system. This concept is represented by the
following conditions:
••• (21)
where qcooducl is the heat flux transmitted through the tube wall material by conduction and
D \ and D2 are the outer and inner tube diameters, respectively.
3.2.9 Overall heat balance for tbe system
Considering heat flow continuity between the condensing steam and the boiling juice, it
can be seen that the enthalpy balance for the condensing steam and the enthalpy balance
for the liquid and vapour within the tube are mutually dependent. Writing these two
enthalpy balances, and the continuity condition:
... (14)
47

C I"IAP'rrR3
= - qconden ••• (18)
qconden Dj = qCOD\l D2
equations (14) and (22) can be combined to yield
dH dz = 11 D J q "'""'"
MOOEL OESCRIPnON
... (22)
This relationship can. in turn, be combined with equation (18), resulting in
which can be easily integrated to yield a simple linear relationship between the enthalpy
of the fluid being boiled and the enthalpy of the condensate:
H - H(O) = 1t DJ (H, - H , (0» ... (23)
Equation (23) represents, in fact, an overall enthalpy balance involving the bottom of the
tube (position z = 0) and an arbitrary cross-section. Using this simple relationship in the
model allows the enthalpy of condensate. and hence the flow rate of condensate per unit
perimeter length, to be easily calculated once the enthalpy of the boiling fluid is known.
This result allows solution of one of the ordinary differential equations on the list of
balance equations, leaving only two ordinary differential equations requiring numerical
solution. The final system of six ordinary differential equations describing the climbing
film evaporator system is thus:
L + V = Lo + Vo ._. (11)
L.s = L o.so (12)
L.r = Lo.ro ... (13)
48
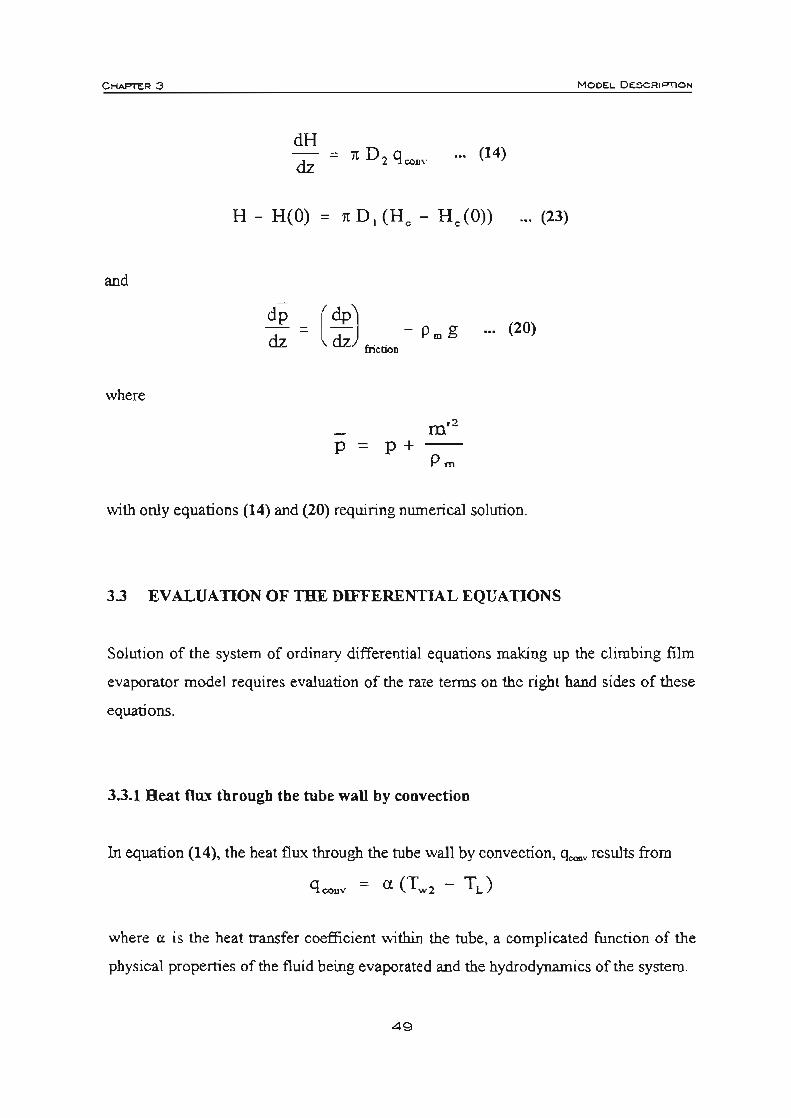
C~R3
and
where
... (14)
H - H(O) = 1t DJ (H, - H,(O)) ... (23)
dp
dz
p
... (20)
rn'2
with only equations (14) and (20) requiring numerical solution.
3.3 EV ALUA nON OF THE DIFFERENTIAL EQUA nONS
MODEL DESCRIPTION
Solution of the system of ordinary differential equations making up the climbing film
evaporator model requires evaluation of the rate tenns on the right hand sides of these
equations.
3.3.1 Heat flux through the tube wall by convection
In equation (14), the heat flux through the tube wall by convection, q_ results from
q~v = a (TW2 - TL)
where a is the heat transfer coefficient within the tube. a complicated function of the
physical properties of the fluid being evaporated and the hydrodynamics of the system.
49
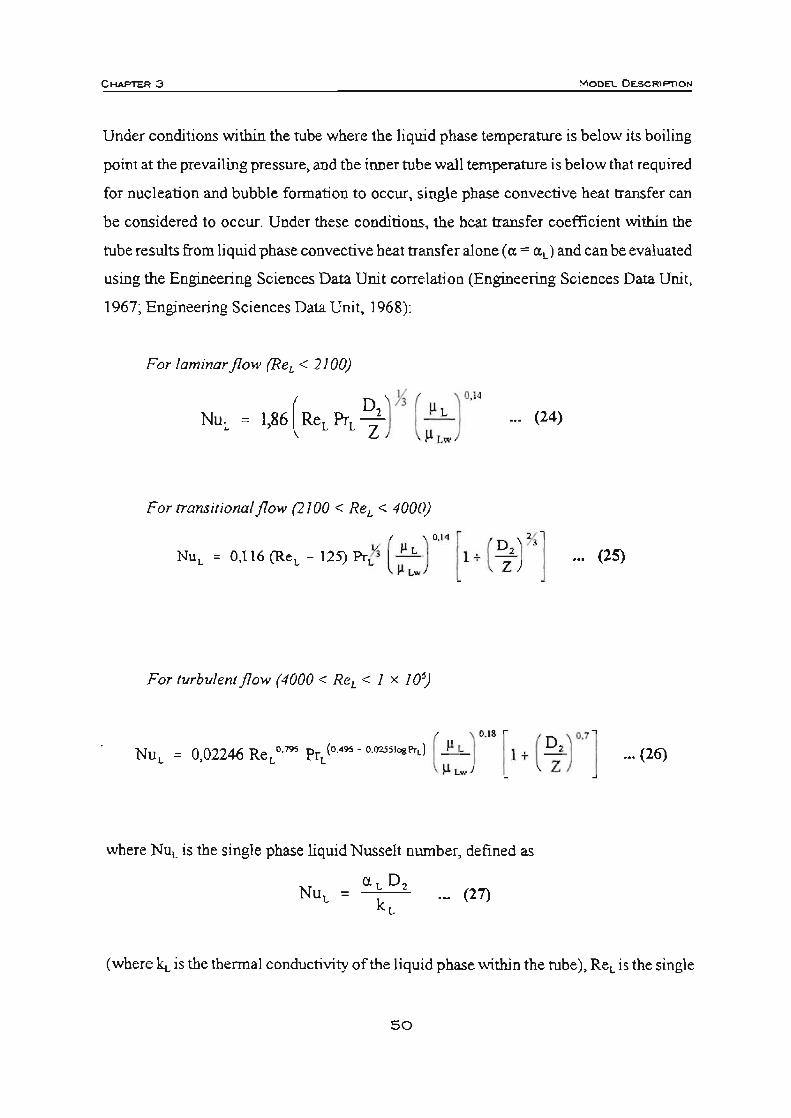
C HAPTER 3 MODEL DESCRlP'nON
Under conditions within the tube where the liquid phase temperature is below its boiling
point at the prevailing pressure, and the inner tube wall temperature is below that required
for nucleation and bubble formation to occur, single phase convective heat transfer can
be considered to occur. Under these conditions, the heat transfer coefficient within the
tube results from liquid phase convective heat transfer alone (" ~ "J and can be evaluated
using the Engineering Sciences Data Unit correlation (Engineering Sciences Data Unit,
1967; Engineering Sciences Data Unit, 1968):
For laminar flow (ReL < 2100)
( D )y, ( )0.14
NUL = 1,86 ReL PrL l ~ ~ Lw
For trami/ionalflow (2100 < ReL < 4000)
,.. (24)
( )"" [ (D )"j NUL = 0.11 6 (Re L - 125) Pr~ : L~ 1 + Z2 ... (25)
For turbulent flow (4000 < ReL < 1 x 10')
( )"" [ (D)07] N U L = 0,02246 ReL
0:195 PrL (O.4~ - 0.02sslog Prd : L~ 1 + Z2 .
where NUL is the single phase liquid Nusselt number, defined as
ex L D2 kL
._ (27)
... (26)
(where k L is the thennal conductivity of the liquid phase within the tube), ReL is the single
50
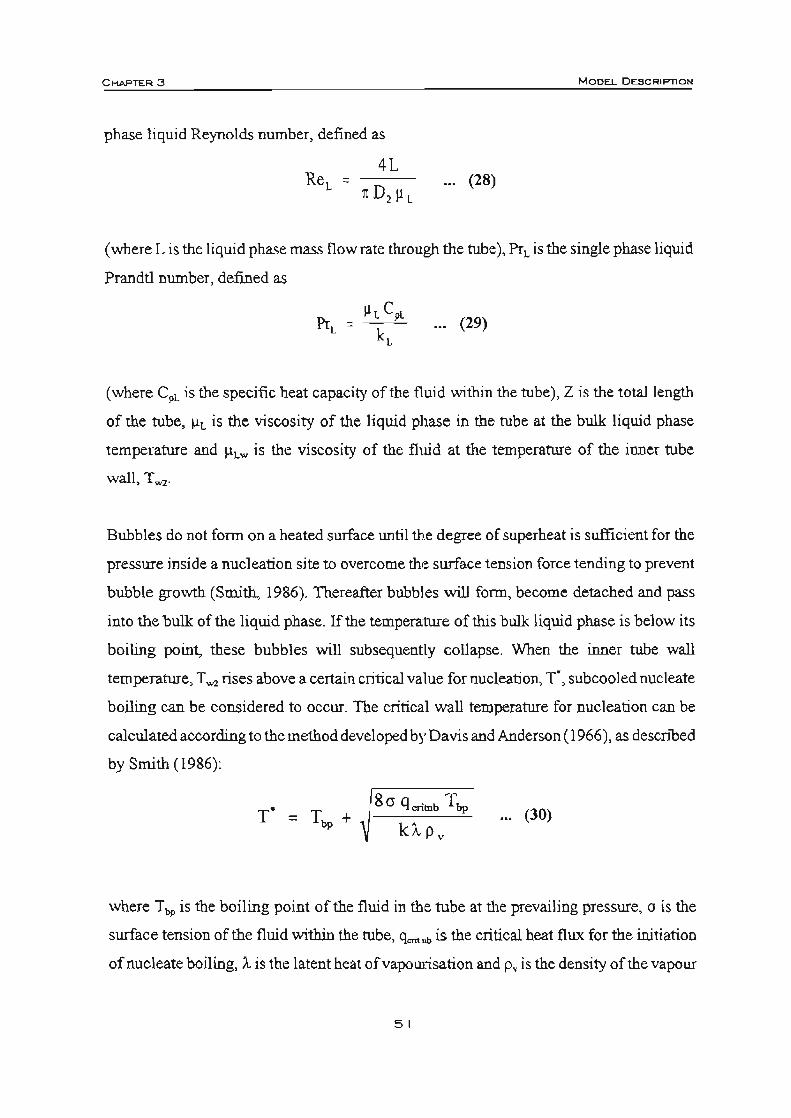
CI-tAPTER 3
phase liquid Reynolds number, defined as
4L Re L =
n D, ~ L
MODEL DESCRIFTlON
••• (28)
(where L is the liquid phase mass flow rate through the tube), PrL is the single phase liquid
Prandtl number, defined as
PrL :; ... (29)
(where epL is the specific beat capacity of the fluid within the tube), Z is the total length
of the tube, ~L is the viscosity of the liquid phase in the tube at the bulk liquid pbase
temperature and ilL ..... is the viscosity of the fluid at the temperature of the itlller tube
wall, Tw2 .
Bubbles do not form on a heated surface until the degree of superheat is sufficient for the
pressme inside a nucleation site to overcome the surface tension force tending to prevent
bubble growth (Smith, 1986). Thereafter bubbles will form, become detached and pass
into the bulk of the liquid phase. If the temperature of this bulk liquid phase is below its
boiling poin~ these bubbles will subsequently coUapse. When the inner tube wall
temperature, Tw2 rises above a certain critical value for nucleatio~ T*, subcooled nucleate
boiling can be considered to occur. The critical wall temperature for nucleation can be
calculated according to the method developed by Davis and Anderson (1966), as described
by Smith (1986):
... (30)
where Tbp is the boiling point of the fluid in the tube at the prevailing pressure, 0 is the
surface tension of the fluid within the tube, q critub is the critical heat flux for the initiation
of nucleate boiling, A is the latent heat of vapourisation and p,. is the density of the vapour
51

CHAFfER 3 MODEL DESCRIPTION
phase). However, qcritnb is a function of the critical wall temperature for nucleation
(where TL is the temperature of the liquid phase within the tube and qerit nb is the critical
beat flux for initiation of nucleate boiling) and thus equation (30) is a quadratic equation
in the square root ofT', which can be solved algebraically to yield:
qeritob =
where
'" =
and
( Cl +2~r
c' I + 4c,
8<> (T .. + 273,15)
kL A P v
Once the fluid temperature within the tube rises above the loca1 boiling point temperature
at the prevailing pressure, fully developed I saturated nucleate boiling can be considered
to occur. For both the subcooled and saturated nucleate boiling regimes, the heat transfer
within the tube can be described by a correlation developed by Chen (\966), although it
is assumed that no vapour phase is present during subcooled nucleate boiling. The basic
premise assumed by Chen is that, since both convective heat transfer and nucleate boiling
heat transfer contribute to the overall transfer of heat during boiling, the heat transfer
coefficients for these two mechanisms can be additively superimposed to yield the overall
boiling heat transfer coefficient, €I :
... (3\)
52
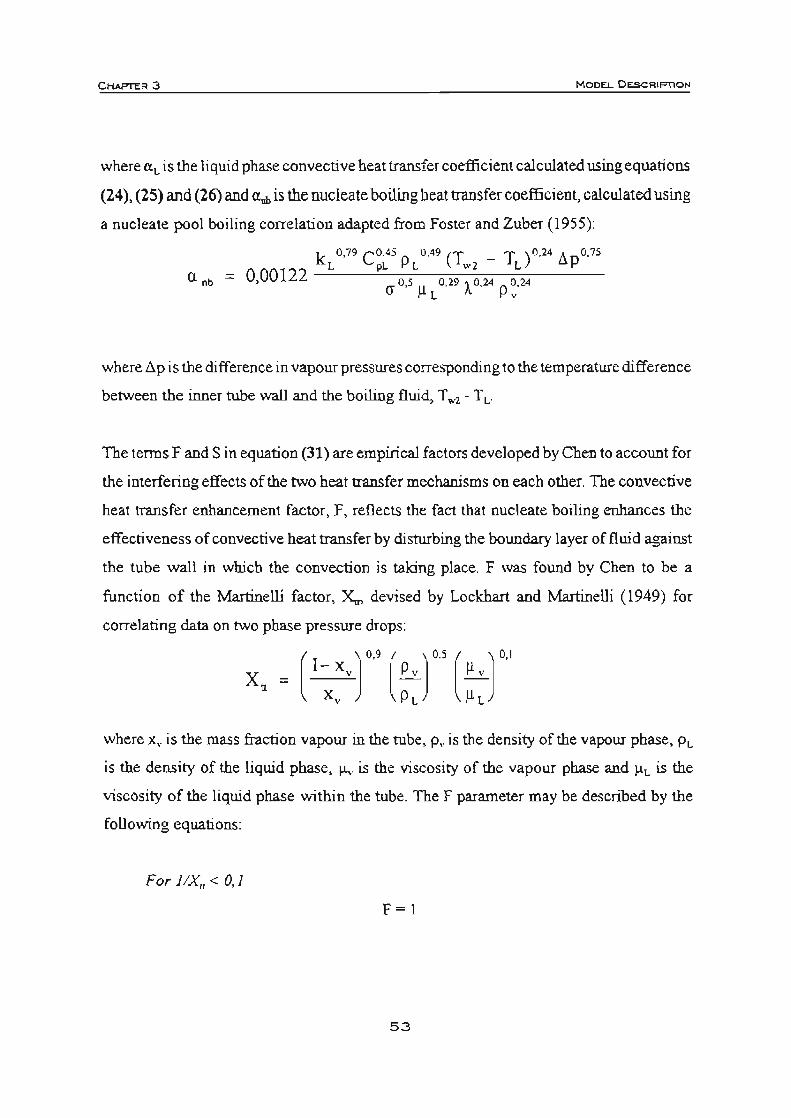
CHAPT'ER3 MODEL- DESCRIPTION
where al. is the liquid phase convective heat transfer coefficient calculated using equations
(24), (25) and (26) and ex"" is the nucleate boiling heat transfer coefficient, calculated using
a nucleate pool boiling correlation adapted from Foster and Zuber (1955):
a nb :;;
k 0,79 C O," P 0,49 (T _ T )0,24 I!.pO,75 L ~ L w2 L
0,00122 os 029,024 024 IT ' ~L' ~' P;
where Ap is the difference in vapour pressures corresponding to the temperature difference
between the inner tube wall and the boiling fluid, T., - T L'
The terms F and S in equation (31) are empirical factors developed by Cben to account for
the interfering effects of the two heat transfer mechanisms on each other. The convective
heat transfer enhancement factor. F. reflects the fact that nucleate boiling enhances the
effectiveness of convective heat transfer by disturbing the boundary layer of fluid against
the tube wall in which the convection is taking place. F was found by Chen to be a
function of the Martinelli factor, x., devised by Lockhart and Martinelli (1949) for
correlating data on two phase pressure drops:
( 1- ) 0,9 ( ) O,S ( ) 0, \ X = X v Pv h
tt X V PL ~ L
where Xv is the mass fraction vapour in the tube , P v is the density of the vapour phase. PL
is the density of the liquid phase. JJv is the viscosity of the vapour phase and ilL is the
viscosity of the liquid phase within the tube. The F parameter may be described by the
following equations:
For l lX I/ < 0,1
53

CH~R3 MODEL DESCRIPTlON
ForO,i < i IX,, < O,7
For l lXI/ > 0,7
( 1 ) 0,7434
F ~ 2,608 X "
It can be seen from these equations that, for the subcooled nucleate boiling zone, with no
vapour phase present, the Chen F factor will have a value of 1.
The nucleate boiling suppression factor, S, accounts for the shear stress at the tube wall
due to flow, which renders the temperature difference less effective for nucleate boiling:
1 S ~
I + 2 53x 10-6 Re l ,l7 , 'P
where Re~ is the two phase Reynolds number, calculated from the liquid phase Reynolds
number (equation (28)):
Re .. ~ ReL.F""
At a certain stage in the evaporative process in a vertical tube, fully developed film boiling
may take place. Under these conditions, the convective heat transfer mechanism becomes
dominant and nucleate boiling no longer occurs, with heat being rapidly transferred across
the thin film ofliquid against the tube wall and vapourisation occurring at the surface of
the liquid film only. Klimenko (1988) provided a scheme for evaluation of the heat
transfer coefficient within the tube under these conditions. The first step is to evaluate the
Klimenko parameter <I> to detennine whether fully developed film boiling is occurring:
54
CI"IAPTER3 MODE'- OESCRtPTlON
<l> =
Fully developed film boiling can be considered to be the dominating heat transfer
mechanism if cl> > 1,6 x 10⁴, in which case the heat transfer coefficient within the tube can
be calculated as a combination of the single phase convective heat transfer coefficient. a l ,
and the film boiling heat transfer coefficient. "y:
(l = ((l ~+(l~)y,
The film heat transfer coefficient results from
where Nu is the Nusselt number. given by
Nu =
L, is a physical property parameter:
Re, is a modified Reynolds nwnber, given by
_ 4(L + V)L, [ (~)] Re. - D' 1 + Xv - 1 1< 2f1L Pv
and kLw is the thermal conductivity of the liquid phase at the inner tube wall temperature,
T.,.
55
CHAFl'EFI. 3 MOOEL DESCRIf""nON
Should the evaporative process continue until most of the liquid phase in the tube has been
vapourised, dry-out will occur. At this point, there will be insufficient liquid phase in the
tube to properly wet the tube surface. The rate of heat transfer will fall dramatically, as the
primary heat transfer mechanism in this regime will be single phase convective heat
transfer to the vapour phase.
Dry-out can consider to have occurred if the dimensionless volumetric vapour fiux,j*,
rises above a value of2,5 (Bourgois and Le Maguer, 1987, after Wallis, 1969):
.• 4 (L + V)x,
J = . ' D; (P L -P,) ,jPLgD,
The heat transfer coefficient for post-dry-out heat transfer can be calculated using a Dittus
Boelter type expression for turbulent single phase beat transfer:
0; = O,023Reo.8 Pro., ... (32)
where the physical properties used to calculate:: the Reynolds and Prandtl numbers in
equation (32) are those obtained by taking mass fraction-weighted average values for the
liquid and vapour pbases in the tube.
3.3.2 Viscous pressure drop within the tube
For conditions of single phase flow within the tube (before the development of saturated
nucleate boiling), the viscous frictional pressure drop term in the momentum balance,
equation (20), can be evaluated using the Cburchill correlation for single phase pressure
drop (Churchill, 1977):
._ (33)
where fl. is the Fanning friction factor for the liquid phase, calculated from:
56
C~FI :3 MODEL DESCRIPnON
where
( [ 09 ]16
A = .. 2,457 .log ( R: J . + 0,27 ~, •.• (35)
(where Rei. is the Reynolds number ca1culated assuming that the entire flow in the tube
is in tbe liquid pbase and using physical properties for the liquid phase. and e is the
absolute roughness of the tube surface in metres), and
B .... ( 37530) I. Re L
... (36)
In this single pbase region of the tube, (dpld2)rrio;' ~ (dpld2) ••. For those regions of the
tube in which two phase flow exists, the pressure drop is described by:
( dP) , ( dP) - = <1>, -dz friction Q dz fr IQ
where 4>'. is the two phase pressure drop enhancement factor and (dpld2).~ is the pressure
drop due to friction for single phase liquid flow in the tube as calculated using
equation (33) (Lockhart and Martinelli, 1949, as described in Smith, 1986). The two phase
pressure drop enhancement factor can be calculated using the method ofFriedel (1979):
where
3,24F.H E + -=-;"""-=-="" Fr O,04S WeO•03S
'P 'P
E = (1 .. x.)' +
57
, P L f. x. f p, L
CHAPTER 3 MODEL DESCRIFnON
(where f, is the Farming friction factor for the vapour phase, calculated from equations
(34), (35) and (36), using a vapour phase Reynolds number calculated assuming that the
entire flow in the tube is in the vapour phase and using physical properties for the vapour
phase,)
and
( )0."( )0.,9 ( )0.7
H= PL ~ I_"' p, ilL ilL
Fr", = 16(L + V)2
16(L + V)2 We", =
1t 2 D J cr P 2 '"
where Pip is the two phase density, calculated assuming homogenous flow within the tube:
1 p = ( '" x ~+
Pv
(I - Xv)) PL
... (37)
For post-dry-out conditions within the evaporator tube, the single phase vapour pressure
drop is calculated using equations (33) through (36), but assuming the entire flow through
the tube to be in the vapour phase and using physical properties for the vapour phase.
58
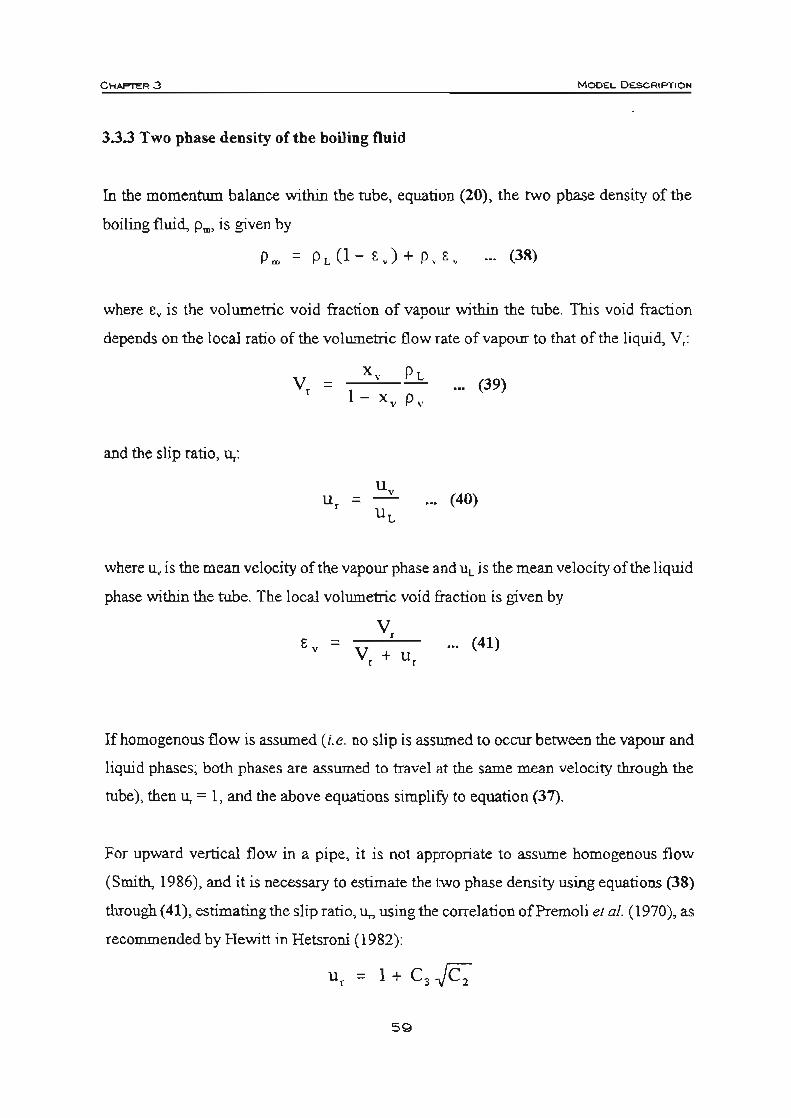
CHAPTER 3 MODEL OESCR!PT10N
3.3.3 Two phase density of the hoiling fluid
In the momentum balance within the tube, equation (20), the two phase density of the
boiling fluid, Pm> is given by
Pill = P L (1 - E " ) + P. E. .•. (38)
where e,. is the volumetric void fraction of vapour within the tube. This void fraction
depends on the local ratio of the volwnetric flow rate of vapour to that of the liquid, V.:
and the slip ratio, u,:
v = r 1 - X v P v
u = ,
... (39)
... (40)
where u., is the mean velocity of the vapour phase and uL is the mean velocity of the liquid
phase within the tube. The local volumetric void fraction is given by
V, E =
v V + u , , ... (41)
If homogenous flow is assumed (i.e. no slip is assumed to occur between the vapour and
liquid phases; both phases are assumed to travelllt the same mean velocity through the
tube), then U, = I , and the above equations simplifY to equation (37).
For upward vertical flow in a pipe, it is not appropriate to assume homogenous flow
(Smith, 1986), and it is necessary to estimate the two phase density using equations (38)
through (41), estimating the slip ratio, u" using the correlation ofPremoli et al. (1970), as
recommended by Hewitt in Hetsroni (1982):
u, = I + C,.,re;
59
CHAPTER .3 MODEL DESCRtPTlON
where
( )
0.22
C, = 1,578Re~0. 19 ~~
(where ReL is the Reynolds number calculated assuming that all the flow in the tube is in
the liquid phase and using physical properties for the liquid phase), and
where
V,
( )
-0 08
Cl = O,0273WeL Re~o.51 Pc Pv
and WeL is the Weber number calculated assuming all of the flow within the tube is in the
liquid phase and using physical properties for the liquid phase:
WeL = 16(L + V) '
n' D' Cl P 2 L
If the parameter C, < 0, then homogenous flow should be assumed to exist, and the slip
velocity U, = 1.
3.3.4 Physical properties
A literature survey on the physical properties of cane juices was carried out, in order to
evaluate the most appropriate physical property correlations for use in the climbing film
evaporator model (peacock, 1995a; Peacock, 1995b).
60
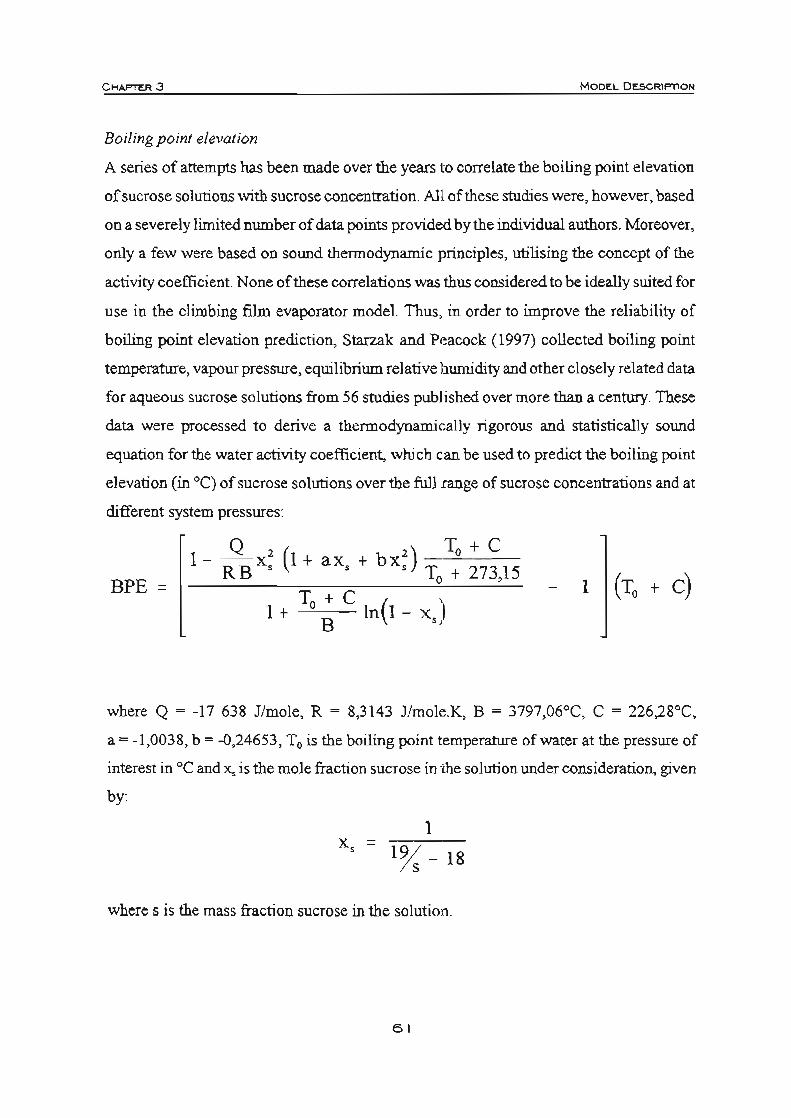
C HAPTER .3 M ODEL D ESCRIPTlON
Boiling point elevation
A series of attempts has been made over the years to correlate the boiling point elevation
of sucrose solutions with sucrose concentration. All of these studies were, however, based
on a severely limited number of data points provided by the individual authors. Moreover,
only a few were based on sound thennodynamic principles, utilising the concept of the
activity coefficient. None of these correlations was thus considered to be ideally suited for
use in the climbing film evaporator model Thus, in order to improve the reliability of
boiling point elevation prediction, Starzak and Peacock (1997) collected boiling point
temperature, vapour pressure, equilibrium relative humidity and other closely related data
for aqueous sucrose solutions from 56 studies published over more than a century. These
data were processed to derive a thermodynamically rigorous and statistically sound
equation for the water activity coefficient. which can be used to predict the boiling point
elevation (in °C) of sucrose solutions over the full :range of sucrose concentrations and at
different system pressures:
BPE =
Q ' ( ' ) To + C 1- RB x, 1 + ax, + bx, To + 273,15
T + C ( ) 1 + OB 1nl - x, I
where Q ~ -17 638 J/mole, R ~ 8,3143 J/mole.K, B ~ 3797,06°C, C ~ 226,28°C,
a ~ -1 ,0038, b = -0,24653, To is the boiling point temperature of water at the pressure of
interest in °C and X. is the mole fraction sucrose in the solution under consideration, given
by:
1
where s is the mass fraction sucrose in the solution.
6 1
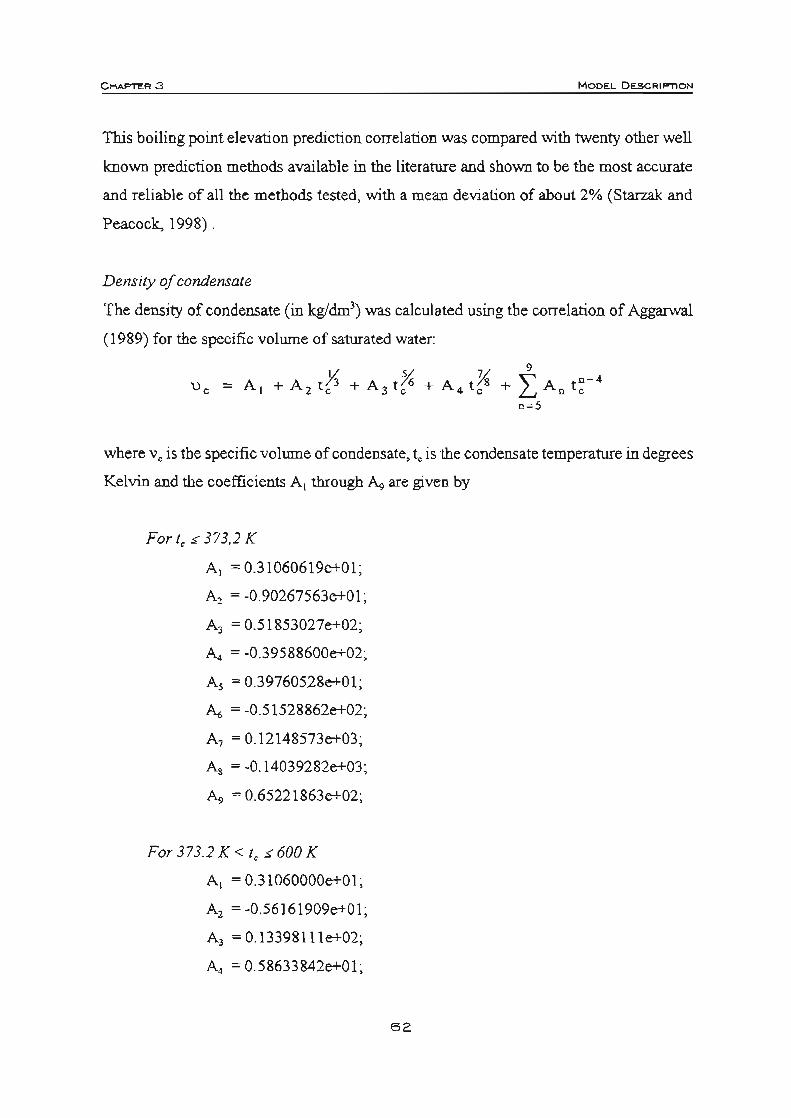
CHAPTER 3 MODEL DESCRIPTlON
This boiling point elevation prediction correlation was compared with twenty other well
known prediction methods available in the literature and shown to be the most accurate
and reliable of all the methods tested, with a mean deviation of about 2% (Starzak and
Peacock, 1998) .
Density of condensate
The density of condensate (in kg/dm') was calculated using the correlation of Aggarwal
(1989) for the specific volume of saturated water:
9
+ "A t n-
4 L... n c 0=5
where Vc is the specific volume of condensate. tc is the condensate temperature in degrees
Kelvin and the coefficients AI through ~ are given by
For I, s 373,2 K
A, =0.31 060619e+01 ;
A, = -0.90267563e+01 ;
A, = 0.51 853027e+02;
A" = -0.39588600e+02 ;
A, = 0.39760528e+01 ;
A" = -0.5 I 528862e+02;
A, = 0.12148573e+03;
As = -0.1 4039282e+03;
A" = 0.65221863e+02;
For 373.2 K < I, S 600 K
A, = 0.31060000e+01;
A, = -0,56161909e+01;
A, = 0.13398 111e+02;
A, = 0.58633842e+01;
62

CHAPTER 3
A, ~ -0.18599625e+02;
A. ~ 0.64106083e+01;
A, ~ -0.87578869e+01 ;
As ~ 0.88766804e+01 ;
A, ~ -0.37156558e+01;
For 1< > 600K
A, ~ 0.31060000e+01;
A, ~ -0.54649353e+01;
A, ~ -0.72486047e+03;
A, ~ 0.12055044e+04;
A, ~ -0.57213086e+03;
A, ~ 0.72626416e+03;
A, ~ -0.65027012e+04;
As ~ 0.41431125e+05;
A, ~-0.11816734e+06;
Density of sugar cane juice
MODEL DESCRIPTION
The density of sugar cane juice (in kg/m') was calculated using the correlation of
Kadlec el. al. (1983):
PL ~ a+bTL+cT~+dT{
where the coefficients a, b, c and d are given by:
a ::::; ao + a l Bx + a 2 Bx2 + a3 Bx 3
, , b = bo + b l Bx + b, Bx + b, Bx
d = do + d l Bx + d , Bx' + d , Bx'
63

CHAFTEA3 MODEL DESCRIPTION
where Bx is the dry solids content (sucrose and impurities) of the sugar cane juice on a
mass percent basis. and the coefficients are given in Table 1.
Table 1. Coefficients for the Kadlec et, ai_ density correlation_
Concentration range i - 1 2 3 4
a 1000,45 3,94325 0,0146409 2,69936 x 1 O-~
b -6,01137 x 10⁻³ -6,85707 x 10-) -2,63869 x 10-<5 - 1,54649 x 10⁴
Bx :s 69% c -5,44367 x 10'3 7,64646 x 1O,s -6,50649 x 10⁻⁷ 8,44748 x 10⁻⁹
d 1,3 1672 x lO-s -3,55879 X 10-' 6,36639 x 10⁻⁹ -7,25049 x 10⁻¹\
a 1316,33 -Q,61119 0, 130327 -3,91182 x 10-'
b -1,7077 0,0299153 -1 ,46234 x 10'" -4,69390 X 10⁻⁷
Bx>69% C 6,5 1225 x 10-3 -1,65477 x 1~ 2,15744 x 10'7 8,36737 x 10'"
d 0 0 0 0
Density of vapour and steam
The density of vapour was calculated using the ideal gas equation.
Enthalpy of saturated liquid water
The specific enthalpy of saturated liquid water (in kJ/kg) was calculated using the
correlation of Aggarwal (1989):
9
+ "A tD
-4
L.... n w 0;5
where hw is the specific enthalpy, t,.,.. is the temperature in degrees Kelvin and the
coefficients AI through A, are given by
For ' . $ 287.2 K
AI ~ 0.2364914ge-02;
A, ~ 0.10918589e+04;
A, ~ -0.92032929e+04;
64
CHAPTER 3
A. = 0.22190031e+05;
As = -O.78623057e+04;
A" = -0.32543672e+05;
A, = 0.40901742e+05;
A, = -0.36393298e+03;
A" = -0. 19495543e+05;
For t. > 287,2 K
A, = 0.20860000e+04;
A, = -0.10864822e+04;
A, = 0.30911332e+05;
A. = -0.44055891e+05;
As = 0.11541795e+05;
A" = 0.48651314e+02;
A, = -0. 18603667e+04;
A, = 0.24305122e+04;
A" = -0. 13371470e+04;
Enthalpy of saturated water vapour
MOOEL. OESCR1PT10 N
The specific enthalpy of satuIated water vapour (in kJlkg) was calculated using the
correlation of Aggarwal (1989):
9
+ '" A t n-
4 L... a v a .S
where h. is the specific enthalpy, t. is the temperature in degrees Kelvin and the
coefficients A I through ~ are given by
For t. 5 591,2 K
A, = 0.20860000e+04;
65

CHAP'Tl!R 3
A, ~ O.13530557e+04;
A, ~ -O.33616219e+05;
A., ~ O.53989891e+05;
A, ~ -O.22623269e+05;
A., ~ O.14442905e+04;
A, ~ -O.34480552e+04;
A, ~ 0.47304248e+04;
A, ~ -0. 172409J3e+04;
For t. < 591,2 K
A, ~ O.20860000e+04;
A, ~ O.86537622e+03;
A, ~ 0.46032137e+06;
A., ~ -O.7264J812e+06;
A, ~ O.31508275e+06;
A., ~ -0.39173969e+06;
A, ~ O.37372265e+07;
A, ~ -O.25566604e+08;
A, ~ O.77743632e+08;
Enthalpy of sugar cane juice
MODEL DESCRIPTION
The specific enthalpy of sugar cane juice (in kJ/kg) was calculated using the correlation
by Lyle (1950)
{(BX) ( 100 + BX )
hL = 2,326 10 900 _ 8 Bx
where Bx is the dry solids content (sucrose and impurities) of the sugar cane juice on a
mass percent basis and T L is the juice temperature in cc.
66
CHAP'TER3 MODEL DESCR1PTION
Saturation pressure of water
The absolute vapour pressure of saturated boiling water (in bar) at a given boiling point
temperature, Ts in degrees Kelvin, was calculated using the Wagner equation
(Wagner,1973):
where
and the coefficients are given by
For 273,2 ,; T,'; 323,2 K
A, = -8,10988775;
A, = 2,17464254;
A, = -3,51897089;
A., = -0,50283681 ;
A, = 647,126;
A =22055" "<> "
For 323,2 < T, ,; 423,2 K
A, = -7,81340301 ;
A, = 1,55097861 ;
A, = -2,84616200;
A., = -1 ,26127042;
A, = 647,126;
A" = 220,55;
+ A '1,1,5 + A '1" + A '1'6] 2 3 4
1 - '1'
T, '1'=1-
A s
67
CHAPTEA3
For 423,2 < T, $ 523,2 K
A, - -7,74037537;
A, - 1,38109682;
A, - -2,60773347;
A. - -1 ,57952429;
A, - 647,126;
• -22055 "6 "
For T, > 523,2 K
A, - -7,82843137;
A, - 1,69248424;
A, - -4,27203456;
A. - 49,12068163;
A, - 647,126;
• - 22055' "6 "
Saturation temperature of water
MOOEL DESCAIP'TIOH
The boiling point temperature of pure water (in degrees Kelvin) at a given absolute
pressure was calculated using the correlation of Aggarwal (1 989):
A T = A + 2
s I log P + A . ,
where Ps is the absolute pressure in Mpa and the coefficients are given as:
For P, $ 0,085 MPa
A, - 0.39612064e+02;
A, - -O.39839608e+04;
A, - -0.96562826e+01;
6B

CHAPTER 3
For 0,085 < P, $ 2,625 MPa
A I ~ 0.45864958e+02;
A, ~ ·0.38175562e+04;
A, ~ ..Q.93753290e+Ol;
For 2,625 < P, $ 11,25 MPa
A I ~ ..Q.43211877e+01 ;
A, ~ ·0.46978731e+04;
A, ~ ..Q.I0285592e+02;
For p. > 11,25 MPa
AI ~ ..Q.31177350e+03;
A, ~ ..Q.I0757354e+05;
A, ~ ..Q.14310894e+02;
Specific heal capacity of condensale
MOO~L DESCRIFT10N
The specific heat capacity of pure water (in kJ/kg. QC) was calculated using an empirical
correlation:
where T c is the temperature of the condensate in 0c.
Specific heat capacity of sugar cane juice
The specific heat capacity of sugar cane juice (in kJ/kg.°C) was calculated using the
correlation developed by Watson (1989):
CPL = 4,1253 - 0,024804Bx + 6,7 x 10-' Bx .TL
+ 1,8691 X 10⁻³ TL - 9,271 X 10-6 T~
69

CI-lAP'ITR 3 MODEL DESCRIPTION
where T L is the juice temperature and Bx is the dry solids content (sucrose and impurities)
of the sugar cane juice on a mass percent basis.
Specific heat capacity of water vapour
The specific heat capacity of water vapour (in kJikg. 'C) was calculated using an empirical
correlation:
Cpv = 0,2323418 (8,10 - 0,72 x 10⁻³ tv + 3,63x 10"'; t~ - 1,16x 10-' t;)
where !v is the vapour temperature in degrees Kelvin.
Swface tension
The swface tension at the liquid / vapour interface in sugar cane juice (in N/m) was
calculated using the correlation of Watson (1989):
where T L is the temperature of the juice in °C andBx is the dry solids content (sucrose and
impurities) of the sugar cane juice on a mass percent basis.
Thermal conductivity of condensate
The thermal conductivity of pure water (in W /m.' C) was calculated using an empirical
correlation:
k w 6,308 x 10-6 T2
c
where T c is the temperature of the condensate in cc.
Thermal conductivity of sugar cane juice
The thermal conductivity of sugar cane juice (in W /m.oC) was calculated using the
correlation ofRiedel (1949):
kL = 1,162222 x 10⁻³ (486 + 1,55TL - 0,005T~)(I- 0,0054Bx)
70

CI-tAPT!:R 3 MODEL. DescRlPTloN
where T L is the temperature of the juice in °C and Bx is the dry solids content (sucrose and
impurities) of the sugar cane juice on a mass percent basis.
Thermal conductivity of water vapour
The thermal conductivity of water vapour (in W Im.oC) was calculated using an empirical
correlation:
+ 4 3 X 10⁻⁴ t 2 , v -21,73xlO-8 t~)
where lv is the vapour temperature in degrees Kelvin.
Viscosity of condensate
The viscosity of pure water (in kg/m.s) was calculated using an empirical correlation:
f'w = 2,73xlO-3 + 2,88xlO--{i Tc - 5,95x10⁻⁴logTc
where Tc: is the temperature of the condensate in QC.
Viscos ity of sugar cane juice
The viscosity of sugar cane juice (in cP, where I cP = 1000 kg/m.s) was calculated using
the correlation ofGenotelle (1978):
[ll + 431N
1.25)
logflL = 22,46N - 0,114 + (30 - TL)' , 91 + TL
where T L is the juice temperature in °C and
Bx N = -:=-::-"'-"::-:--=-
1900 - 18Bx
where Bx is the dry solids content (sucrose and impurities) of the sugar cane juice on a
mass percent basis.
71
CHAPTER 3 MODEL. OESCRIPTlON
Viscosity of water vapour
The viscosity of water vapour (in kglm.s) was calculated using an empirical correlation:
flv ~ -3,189xlO- 6 + 41,45 x 10- 9 Iv - 8,272 x 10-13 t~
where t:., is the vapour temperature in degrees Kelvin.
3.4 NUMERICAL SOLUTION OF THE MODEL
Numerical solution of ordinary differential equations is fairly routine, provided that all the
required boundary conditions are known at one of the boundaries of integration. This is
known as an initial value problem. However. the system under consideration in this study
has boundary conditions at both boundaries of integration, namely the top and the bottom
of the evaporator tubes, and thus requires more advanced solution techniques.
The following boundary values are known under a given set of evaporator operating
conditions and can be assigned numerical values:
• tbe mass flow rate of cold juice through the preheater, F,
• •
• •
•
the mass fraction sucrose content of the clear juice fed to the preheater. sp
the mass fraction impurity content of the clear juice fed to the preheater, rp
the temperature of the heated juice leaving the preheater, T l.O
the vapour space pressure at the top of the evaporator tubes, PlOp
the mass flow rate of condensate per unit tube perimeter at the top of the evaporator
tubes, ro
The mass flow rate of condensate per unit perimeter length at the top ofthe tubes, r o, is
taken to be zero, as there is assumed to be no condensate film present at the very top of
the tubes.
While the starting point of integration is the bottom of the evaporator tube. two of these
72
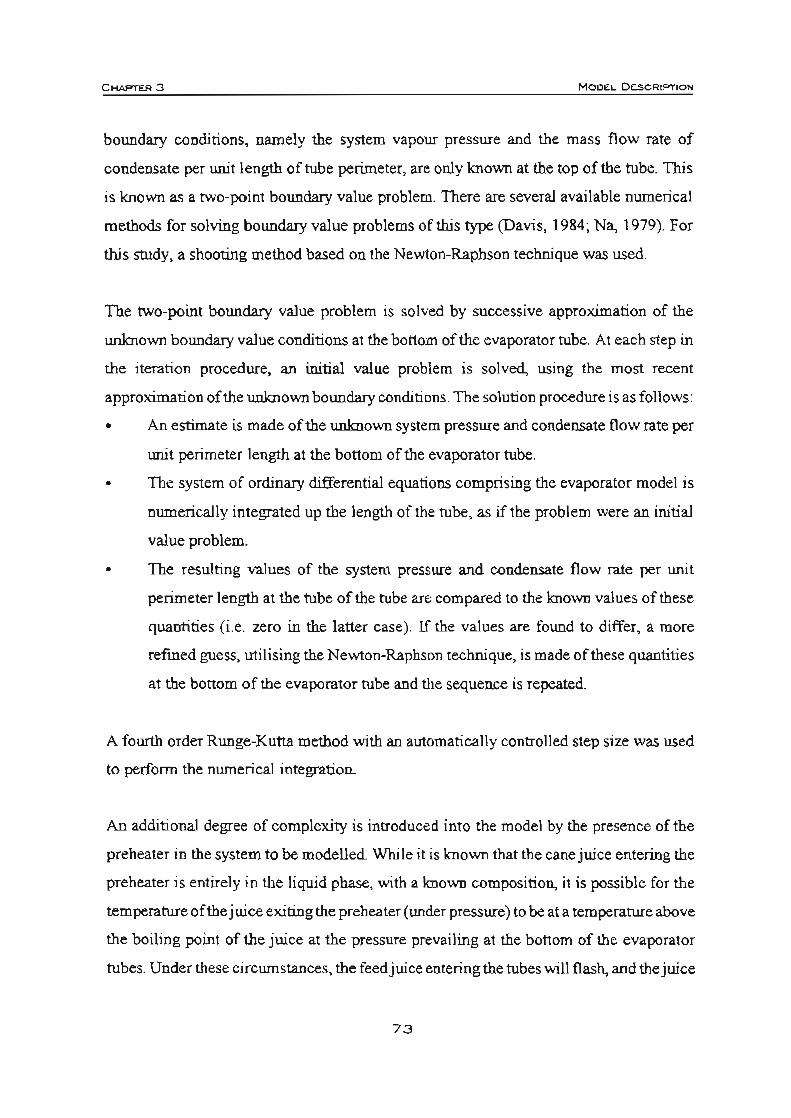
C ......... 3 MOOEI.. DESCRIPTION
boundary conditions. namely the system vapour pressure and the mass flow rate of
condensate per unit length of tube perimeter, are only known at the top of the tube. This
is known as a two-point boundary value problem. There are several available numerical
methods for solving boundary value problems of this type (Davis, 1984; Na, 1979). For
this study, a shooting method based on the Newton-Raphson technique was used.
The two-point boundary value problem is solved by successive approximation of the
unknown boundary value conditions at the bottom of the evaporator tube. At each step in
the iteration procedure, an initial value problem is solved, using the most recent
approximation of the unknown boundary conditions. The solution procedure is as fonows:
• An estimate is made of the unknown system pressure and condensate flow rate per
unit perimeter length at the bottom of the evaporator tube.
• The system of ordinary differential equations comprising the evaporator model is
nwnerically integrated up the length of the tube, as if the problem were an initial
value problem.
• The resulting values of the system pressure and condensate flow rate per unit
perimeter length at the tube of the tube are compared to the known values of these
quantities (i.e. zero in the latter case). If the values are found to differ, a more
refined guess, utilising the Newton-Raphson technique, is made of these quantities
at the bottom of the evaporator tube and the sequence is repeated.
A fourth order Runge-Kutta method with an automatically control1ed step size was used
to perform the numerical integration.
An additional degree of complexity is introduced into the model by the presence of the
preheater in the system to be modelled. While it is known that the cane juice entering the
prebeater is entirely in the liquid phase, with a known composition, it is possible for the
temperature of the juice exitingtbe preheater (under pressure) to be at a temperature above
the boiling point of the juice at the pressure prevailing at the bottom of the evaporator
tubes. Under these circumstances, the feedjuice entering the tubes will flash, and the juice
73

CHAPTER 3 M ODEL DESCRIPTlO N
entering the tubes win need to be considered as ajuice / vapour mixture. In order to fully
account for this phenomenon, it is necessary for the model to perform a flash calculation
on the incoming juice to determine the quantity of vapour present in the feed stream, and
hence the liquid phase composition, based on the temperature of the hot juice exiting the
preheater and the most recent estimate of the prevailing pressure at the bottom of the
tubes. The flash calculation is. in essence. an enthalpy balance. If the temperature of the
juice exiting the preheater is belowtbe boiling point of the juice at the prevailing pressure
at the bottom of the tube, flashing does not occur and no flash calculation is performed.
Ifflashing does occur, then the following enthalpy balance equation is solved for the mass
fraction vapour in the juice entering the bottom of the evaporator tube, x..: hLl ~ (I - xv ) hL2 + Xv hv2
where hLl is the specific enthalpy of the hot juice exiting the preheater. assumed to be
entirely in the liquid phase, h" is the specific enthalpy of the liquid phase at the boiling
point prevailing at the bottom of the evaporator tube and h", is the corresponding specific
enthalpy of the vapour phase.
74
Part Il:
Results and Discussion
Chapter 4
Model Identification
4.1 EV APORA TOR SIMULA nON PROGRAM
The climbing film evaporator model , as described in Chapter 3, was used to develop an
evaporator simulation program in the MA TLAB programming language. It should be noted
that the program makes provision for the optional inclusion of a fouling layer on the inner
wall of the tube as a further barrier to heat transfer. This feature is not discussed as part
of this study as, in practice, it was never utilised
The inputs required for simulation of a climbing film evaporator system using this
program are:
• the physical parameters of the evaporator system to be modelled, such as
the number of tubes,
the inner and outer tube diameters,
the length of the evaporator tubes,
the surface roughness of the tube material and
the thermal conductivity of the tube material.
• and the operational parameters of the evaporator system, such as
the mass flow rate of cold sugar cane juice fed to the preheater.
the composition of the cold juice fed to the preheater (in terms of sucrose
and impurities content),
the temperature oftbe hot juice exiting the preheater,
the vapour space pressure at the top of the evaporator tubes and
the pressure of the condensing steam within the shell of the vessel.
75
C~A4
The outputs provided by the simulation program are profiles of the follo\viog quantities
as they vary along the length of the tube:
the two state variables involved in the numerical integration of the ordinary
differential equations, namely the enthalpy flow of the boiling fluid within
the tube (equation (14)) and the modified pressure term contained in
equation (20),
the mass flow rate of condensate per unit length of the tube perimeter,
the temperatures of the condensing steam, outer and inner tube walls and
boiling juice,
the composition of the boiling liquid phase,
the local heat transfer coefficients for condensation on the outer wall of the
tube and for boiling heat transfer within the tube,
a local overall heat transfer coefficient for the evaporator system,
the mass flow rates of the liquid and vapour phases within the tube,
the absolute pressure within the tube,
the two phase mixture quality (mass fraction vapour) and
the heat flux through the tube wall.
The results of a typical simulation are shown in Figure 13. The input parameters for this
simulation were partially based on industrial conditions in one of the first effect climbing
film evaporators at the Fe1ixton sugar mill, as given in Table 2. The average overall heat
transfer coefficient for this evaporator system was calculated to be 1,09 kW/m2.0c.
The graphical results in Figure 13 show the typical behaviour of a climbing film
evaporator. Due to the small effect of the acceleration term in the momentum balance, the
modified pressure plot shows, in effect, the decrease in absolute pressure with increasing
height in the evaporator tube. The point at which boiling starts is clearly visible at a point
approximately 1,8 metres up the tube, with the two phase mixture having a lower pressure
drop per metre of tube length than the single phase liquid. The enthalpy flow shows a low
76
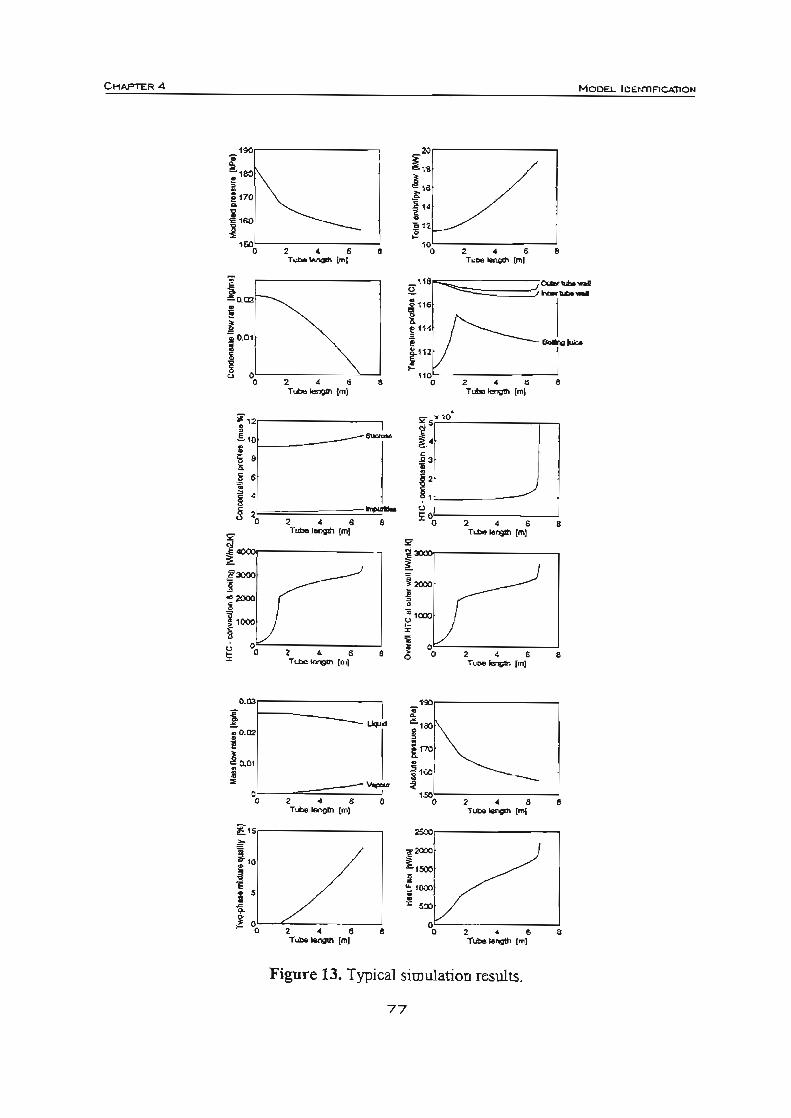
C~R4
10,,/
too, J CCL_~, __ .,--~.-"-~.
Tube IenQIh Iml
i::~-------~ ~ . • n § ~~==",====.;===O,=" ..... ~.
Tube*'\l!l1 {ml
" l~'r-----------.
i"'" ."'" j,.» ~ °Ot"--~,--.:---~,-~.
Tube IWGII'I lml
~~-~,--==.c===~,~"'~.' Tube I8ngIh I"'l
~1S,--------,
1""'1-------------, i :2OlC
i . ,."
~
1 , . . Tube ""'" {mj
,
"",r--------,
, . . TubelefVil'l ["'1 •
Figure 13. Typical simulation resu1ts.
77
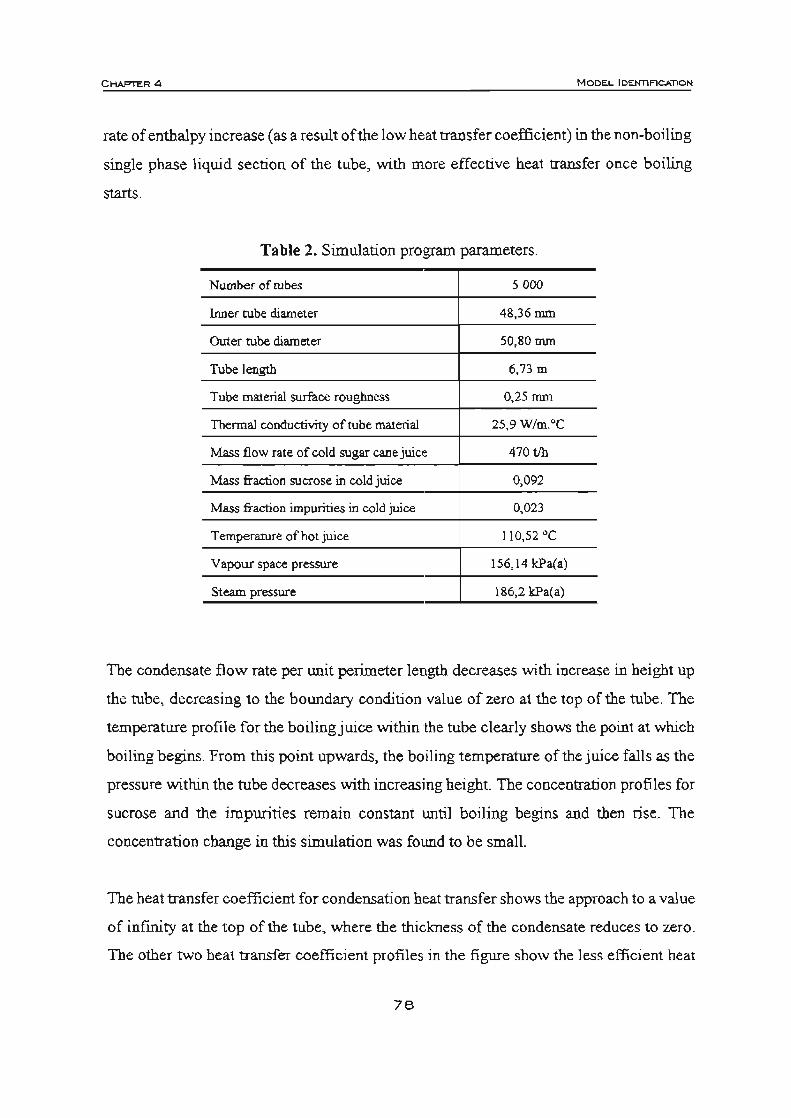
C HAPTER 4 MOOEL IDENTlFICA110N
rate of enthalpy increase (as a result of the low heat transfer coefficient) in the non-boiling
single phase liquid section of the tube, with more effective heat transfer once boiling
starts.
Table 2. Simulation program parameters.
Number of tubes 5000
Inner tube diameter 48,36 mm
Outer rube diameter 50,80 nun
Tube length 6,73 m
Tube material surface roughness 0,25 mm
Thermal conductivity of tube material 25,9WIm."C
Mass flow rate of cold sugar cane juice 470 tIh
Mass fraction sucrose in cold juice 0,092
Mass fraction impurities in cold juice 0,023
Temperature of hot juice 110,52 °C
Vapour space pressure 156,14 kP-<a)
Steam pressure 186,2 kPa(a)
The condensate flow rate per unit perimeter length decreases with increase in height up
the tube, decreasing to the boundary condition value of zero at the top of the tube. The
temperature profile for the boiling juice within the tube clearly shows the point at which
boiling begins. From this point upwards, the boiling temperature of the juice falls as the
pressure within the tube decreases with increasing height. The concentration profiles for
sucrose and the impurities remain constant until boiling begins and then rise. The
concentration change in this simulation was fOlmd to be small.
The heat transfer coefficient for condensation heat transfer shows the approach to a value
of inftnity at the top of the tube, where the thickness of the condensate reduces to zero.
The other two heat transfer coefficient profiles in the figure show the less efficient heat
78

CHAPTI::R 4 MODEL IOENTIF1Cll.ilON
transfer taking place in the single phase zone, witb eobanced heat transfer once boiling
begins.
The liquid and vapour mass flow rates clearly show the production of vapour within the
tube once boiling begins to occur. This is also reflected in the plot for the two phase
mixture quality.
The last plot shows the beat flux transferred from the condensing steam to tbe boiling
juice through the tube wall .
An overall average heat transfer coefficient for the modelled evaporator can be calculated
from the results of the simulation, based on the heat transfer across the tube wall required
to heat the juice to its boiling point and vapourise a portion of the liquid phase:
LOCpLm (TLo - T';;') + V, 'I..
A (T, - Tv< ) u=
where Lo is the flow rate of liquid entering the bottom of the evaporator tube, CpLPl is the
average specific heat capacity of the liquid phase in the non-boiling zone of the evaporator
tube, TLO is the temperature of the feed liquid entering the bottom of the evaporator tube,
r bp is the boiling point of the liquid phase at the vapour pressure prevailing at the top of
the evaporator tube, Vc is the vapour phase flow rate exiting the top of the evaporator tube,
A is the average latent heat ofvapourisation within the tube, A is the swface area for heat
transfer within the tube, T s is the temperature of the heating steam and T ~<: is the
temperature of the vapour phase exiting the top of the evaporator tube.
This approximate overall average heat transfer coefficient was also used in analysis of the
experimental climbing film evaporator data collected by the southern African sugar
industry. as described in the next section.
79

C~R4 MODEL lDEN'nflCATlON
4.2 EXPERIMENTAL DATA COLLECTION
From 1994 to 1997, the Sugar Milling Research Institute operated a pilot plant climbing
film evaporator at the Felixton sugar mill. The pilot plant evaporator was designed to
investigate the effects of both mechanical and operational parameters on climbing film
evaporator perfonnance through the measurement of an approximate overal1 average heat
transfer coefficient (Walthew et al., 1995; Walthew and Whitelaw, 1996). A schematic
diagram of the pilot plant evaporator is shown in Fignre 14.
V1 OR '12)
1'01.0.. ,-_ _ " 2nd I!PPE.CT
SEPARATORS
Figure 14. Schematic diagram of the pilot plant climbing film evaporator.
The pilot plant evaporator consists of three st.;'linless steel tubes of two inch nominal
diameter and of length 7,0 metres, within a mild steel shell. Feed juice from the factory
is fed to a galvanised steel drum, suspended from a load cell to enable the mass flow rate
of juice to be detennined. From the feed drum, the juice is pumped by a variable speed
80
CHAPTER 4 MOOEL t oamFlCAl1ON
fixed displacement pump, through a preheater, to the bottom saucer of the evaporator. The
concentrated juice I vapour mixture exiting the top of the evaporator tubes is separated in
a cyclonic separator and the vapour stream is condensed. Both products of the evaporation
process are cooled and then stored in further galvanised drums, suspended from load cells
to allow for flow rate measurement
The pilot plant is thoroughly instrumented, allowing for the measurement of the feed
liquor, product syrup, steam condensate and vapour condensate flow rates, steam and
vapour pressures. feed juice temperature and the pressure drop over the length of the tube.
The juice concentrations before and after evaporation were determined by the mill
laboratory at the Felixton mill, using refractive index measurements.
During the 1995 season, the Felixton pilot plant climbing film evaporator was used to
investigate the effects of selected operating conditions on first effect evaporator
performance, using a factorial experimental design (Walthew and Whitelaw, 1996). The
dependent variable in this study was the average overall heat transfer coefficient, while
the independent variables (or factors) which were selected for study were:
the temperature difference driving force for evaporation,
the feed juice flow rate,
the feed juice temperature, and
the feed juice concentration.
The independent variables and their low and high values in the factorial experiment were
chosen based on the prevailing operating conditions of first effect climbing film
evaporators in the South African sugar industry. The levels of the factors are shown in
Table 3. All the experiments were carried out using clean tubes, and the test solutions for
evaporation were synthetic solutions made up using high purity refined sugar and water.
Thus. no fouling of the tube surfaces occurred during the experimental runs. The results
of the factorial experiment are discussed by Walthew and Whitelaw (1996).
81
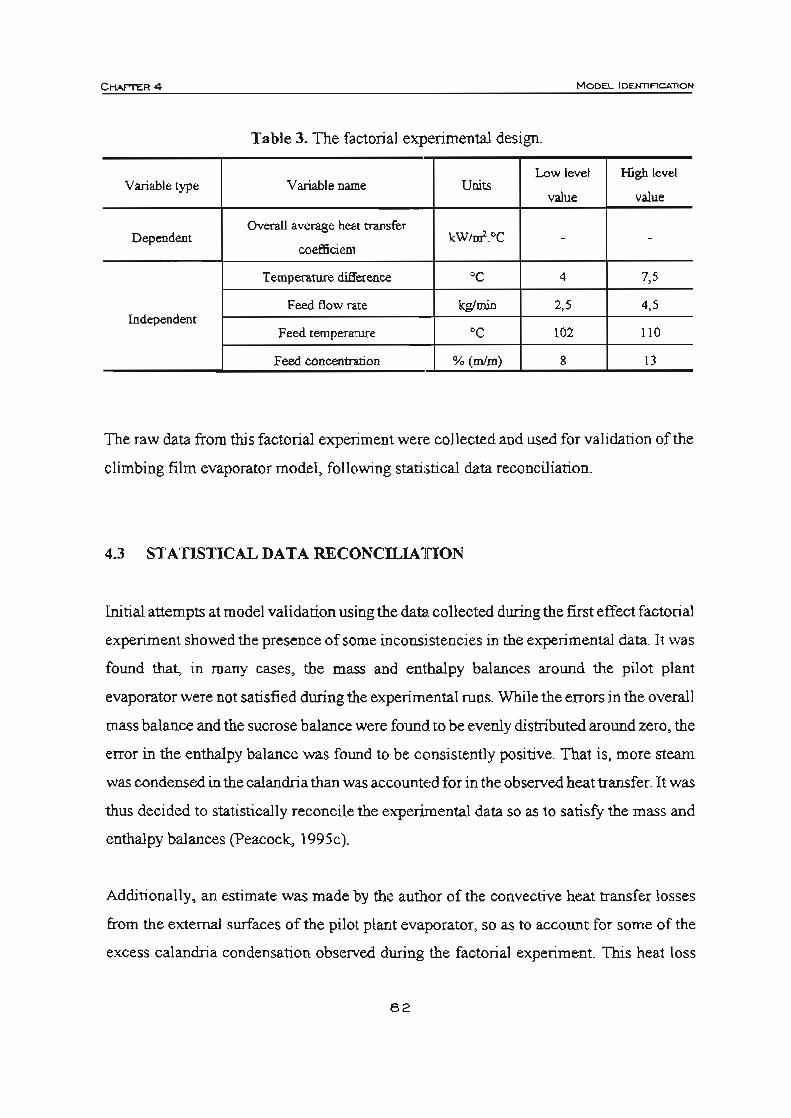
CHAPTER 4
Table 3. The factorial experimental design.
Low level High level Variable type Variable name Units
value value
Dependent Overall average heat transfer
kW/m2.OC - -coefficient
Temperature difference °C 4 7,5
Feed flow rate kg/min 2,5 4,5 Independent
Feed temperarure °C 102 110
Feed concentration % (mlm) 8 13
The raw data from this factorial experiment were collected and used for validation of the
climbing film evaporator model, following statistical data reconciliation.
4.3 STATISTICAL DATA RECONCILIATION
Initial attempts at model validarion using the data collected during the first effect factorial
experiment showed the presence of some inconsistencies in the experimental data. It was
found that, in many cases, the mass and enthalpy balances around the pilot plant
evaporator were not satisfied during the experimental runs. While the errors in the overall
mass balance and the sucrose balance were found to be evenly distributed around zero, the
error in the enthalpy balance was found to be consistently positive. That is, more steam
was condensed in the calandria than was accounted for in the observed heat transfer. It was
thus decided to statistically reconcile the experimental data so as to satisfy the mass and
enthalpy balances (Peacock, 1995c).
Additionally, an estimate was made by the author of the convective heat transfer losses
from the external surfaces of the pilot plant evaporator, so as to account for some of the
excess calandria condensation observed during the factorial experiment. This heat loss
82
C HAPTER 4
estimate was based on tests carried out on the pilot evaporator with no feed flow (Le., with
no evaporation taking place, with all the observed steam condensation being due to
convective beat losses) and a confinnatory tbeoretical estimate based on published
convective heat transfer coefficient correlations in the literature.
Statistical data reconciliation involves the manipulation of the experimentally measured
variables so as to satisfy the mass and enthalpy balances for the system, while cbanging
the experimental data as little as possible. :For the purposes of this analysis, each
experimental variable was assigned a variance, representing the range of experimental
error expected forthat variable. Thesevariances were determined by statistically analysing
the fluctuations in the individual variables during continuous steady state operation of the
pilot plant evaporator. An optimisation index was then defined as:
Index = i: (Xl - %;)' j_1 varj
where 'S is the optimised I altered value of the jtb variable, Xj is the experimentally
measured value of the jtb variable and varj is the variance of the jtb variable. The
reconciliation algorithm satisfies the mass and enthalpy balances while minimising the
optimisation index (i.e., minimising the effect on the experimental data). Thus, the
experimental data are weighted by the inverses of their variances. The more accurately
measured variables will be affected less during the reconciliation procedure than those
measured less accurately (with higher variances). The variables subject to reconciliation
were:
the juice reed flow rate,
the j wce feed concentration,
the steam pressure,
the vapour space pressure,
the juice feed temperature,
the steam condensate flow rate,
the vapour condensate flow rate,
83

C...,.,.,,4
the concentrated juice product flow rate, and
the concentrated juice product concentration.
MODEL. IDENTlF1CAT'IOtI
The data reconciliation algorithm was implemented by means of a MA TLAB computer
program. Seven of the origina1 27 experiments were discarded due to gross errors in the
data from these tests. The results of data reconciliation of the remaining 20 tests are
discussed by Peacock (1995c), which is included as Appendix A The modified data from
the statistical reconciliation procedure were used for model validation.
4.4 MODEL IDENTIFICA nON
Preliminary model verification, by comparing the results of model simulation with the
results of experimentation using the pilot plant climbing film evaporator, showed that the
model results did not agree with those obtained by experiment. In general, it was found
that the simulation program consistently under .predicted the actual heat transfer occurring
in the pilot plant evaporator. That is, the simulation program predicted lower heat transfer
coefficients, steam condensate flow rates, concentrated juice product concentrations,
vapour condensate flow rates, heat fluxes and two phase mixture qualities than had been
observed for the experimental data.
Analysis of the heat transfer components of the climbing film evaporator model showed
that the most probable cause of the erroneous model results was the boiling heat transfer
portion of the Cben correlation for flow boiling in vertical tubes. While the convective
beat transfer tenn in this correlation (the Engineering Sciences Data Unit correlation for
single phase convective heat transfer, as given by equations (24) through (26)) was
considered to be accurate, it was felt that the modified Forster-Zuberpool boiling equation
(Forster and Zuber. 1955) was inaccurate:
84
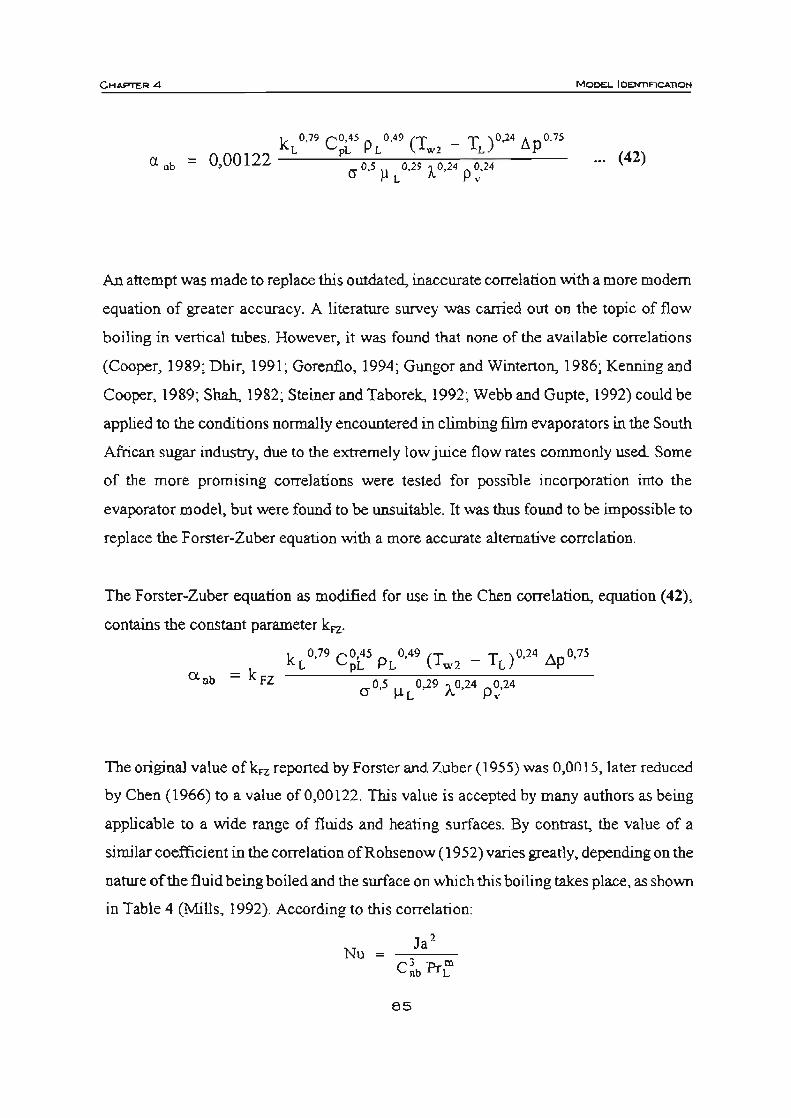
CMAP'TER4
k 0,79 C O,'' P 0,49 (T _ T ) 0,24 !;p O,7S L pL L w2 L
= 0,00122 "02' ,0" 02' cr'" ' ~~P' ~ L \'
,.. (42)
An attempt was made to replace this outdated, inaccwate correlation with a more modem
equation of greater accuracy. A literature survey was carried out on the topic of flow
boiling in vertical tubes. However, it was found that none of the available correlations
(Cooper, 1989; Dhir, 1991; Gorenilo, 1994; Gungor and Winterton, 1986; Kenning and
Cooper, 1989; Shah, 1982; Steiner and Taborek, 1992; Webb and Gupte, 1992) could be
applied to the conditions normally encountered in climbing film evaporators in the South
African sugar industry, due to the extremely low juice flow rates commonly used Some
of the more promising correlations were tested for possible incorporation into the
evaporator model, but were found to be unsuitable. It was thus found to be impossible to
replace the Forster-Zuber equation with a more accwate alternative correlation.
The Forster-Zuber equation as modified for use in the Chen correlation, equation (42),
contains the constant parameter kFZ.
k 0.79 C O,45 P 0,49 (T _ TL
)o,24 6pO,75 L pL L w2 a nb :;:: k FZ cr 0,5 I-L L 0,29 A 0,24 P ?,,14
The original value ofkFZ reported by Forster and ZUbeT (1955) was 0,0015. later reduced
by Chen (1966) to a value of 0,00122, This value is accepted by many authors as being
applicable to a wide range of fluids and heating surfaces. By contrast, the value of a
similar coefficient in the correlation ofRohsenow (1952) varies greatly, depending on the
nature of the fluid being boiled and the surface on which this boiling takes place, as shown
in Table 4 (Mills, 1992), According to this correlation:
85

CMAPTER4
Table 4. Values of the nucleate boiling constant and exponent for the Rohsenow
correlation.
Liquid Surface C. m
Water Copper. scored 0,0068 2,0
Water COPpe1". polished 0,013 2,0
Water Stainless steel, chemically etched 0,013 2,0
Water Stainless steel, mechanically polished 0,013 2,0
Water Stainless steel, ground and polished 0,008 2,0
Water Brass 0,006 2,0
Water Nickel 0,006 2,0
Water Platinum 0,013 2,0
Carbon tetrachloride Copper 0,013 4,1
Benzene Chromium 0,010 4,1
n-Pentane ChronUwn 0,015 4,1
Ethanol CbronUum 0,0027 4,1
Isopropyl alcohol Copper 0,0023 4,1
n-Butyl alcohol Copper 0,0030 4,1
3S%~C03 Copper 0,0027 4,1
where Ja is the Jakob number
(where CPL is the specific heat capacity of the liquid being boiled, T .. is the inner tube
wall temperature, T bp is the temperature of the boiling liquid and A is the latent beat of
vapourisation of the liquid)~ C.., is the nucleate boiling coefficient (similar to kF0, PrL is
the Prandtl number for the liquid (as defined in equation (29» , m is the nucleate boiling
exponent (as given in Table 4). Tbe Nusselt number, Nu, is given by
B6
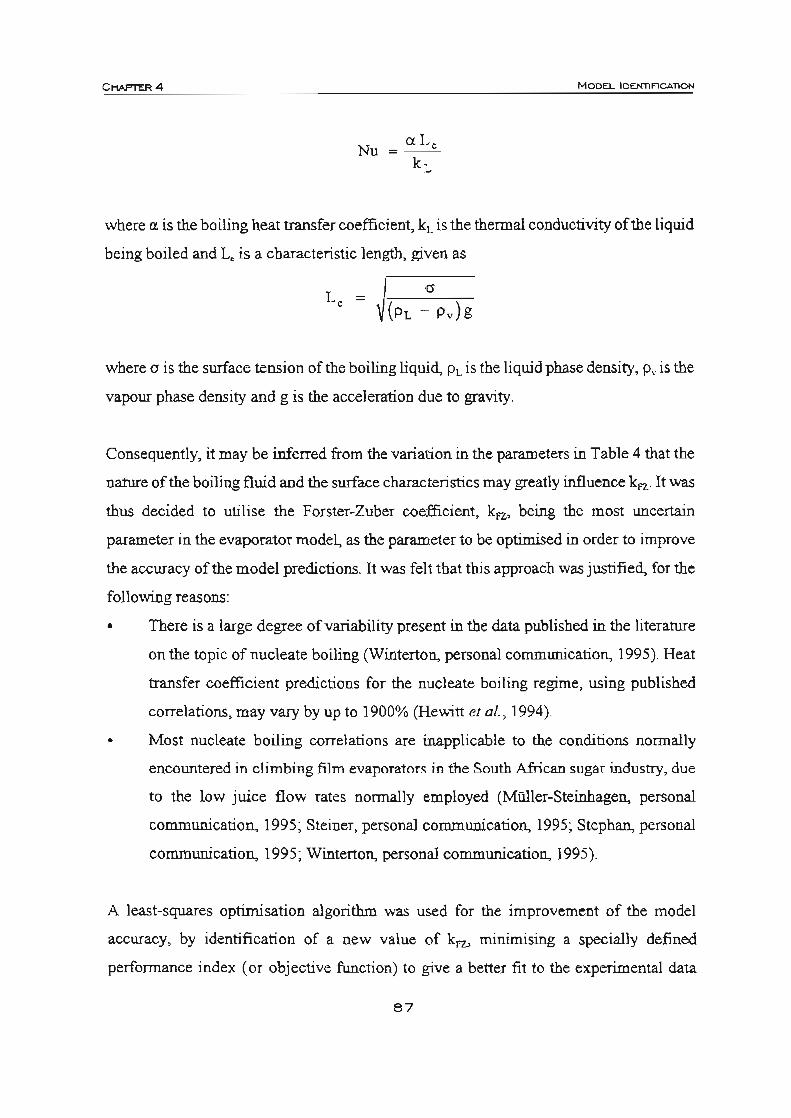
CHAPTER 4
where a is the boiling heat transfer coefficient. kL is the thermal conductivity of the liquid
being boiled and Le is a characteristic length. given as
where 0 is the surface tension of the boiling liquid, PL is the liquid phase density, p, is the
vapour phase density and g is the acceleration due to gravity.
Consequently. it may be inferred from the variation in the parameters in Table 4 that the
nature of the boiling fluid and the surface characteristics may greatly influence kIT. It was
thus decided to utilise the Forster-Zuber coefficient. kFZ• being the most uncertain
parameter in the evaporator model, as the parameter to be optimised in order to improve
the accuracy of the model predictions. It was felt that this approach was justified, for the
following reasons:
• There is a large degree of variability present in the data published in the literature
on the topic of nucleate boiling (Winterton, personal communication, 1995). Heat
transfer coefficient predictions for the nucleate boiling regime, using published
correlations, may vary by up to 1900% (Rewitt et al. , 1994).
• Most nucleate boiling correlations are inapplicable to the conditions normally
encountered in climbing film evaporators in the South African sugar industry, due
to the low juice flow rates normally employed (Miiller-Steinhagen, personal
communication. 1995; Steiner. personal communication, 1995; Stephan, personal
communication, \995 ; Winterton, personal communication, 1995).
A least-squares optimisation algorithm was used for the improvement of the model
accuracy, by identification of a new value of kIT. minimising a specially defined
performance index (or objective function) to give a better fit to the experimental data
87
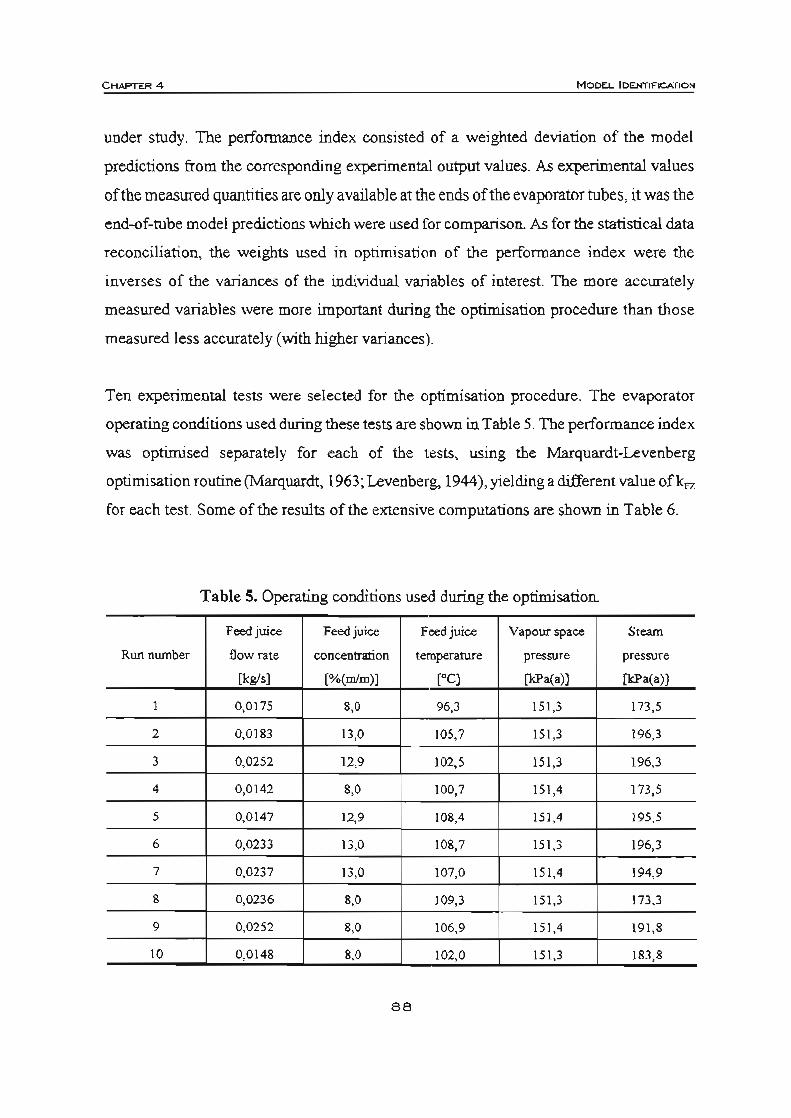
CHAFTl::R 4 MOOEL IOEI'mFlCATlON
under study. The performance index consisted of a weighted deviation of the model
predictions from the corresponding experimental output values. As experimental values
of the measured quantities are only available at the ends of the evaporator tubes, it was the
end-of-tube model predictions which were used for comparison. As for the statistical data
reconciliation, the weights used in optimisation of the perfonnance index were the
inverses of the variances of the individual variables of interest. The more accurately
measured variables were more important during the optimisation procedure than those
measured less accurately (with higher variances).
Ten experimental tests were selected for the optimisation procedure. The evaporator
operating conditions used during these tests are shown in Table 5. The perfonnance index
was optimised separately for each of the tests, using the Marquardt-Levenberg
optimisation routine (Marquardt, 1963; Levenberg, 1944), yielding a different value ofk"
for each test. Some of the results of the extensive computations are shown in Table 6.
Table S. Operating conditions used during the optimisation.
Feed juice Feed juice Feed juice Vapour space Steam
Run number flow rate concentration temperature pressure pressure
[kgl,] [o/o(m'm)] [0C] [kPa(a)] [kPa(a)]
1 0,0175 8,0 96,3 151,3 173,5
2 0,0183 13,0 105,7 151 ,3 196,3
3 0,0252 12,9 102,5 151,3 196,3
4 0,0142 8,0 100,7 151,4 173,5
5 0,0147 12,9 108,4 15] ,4 195,5
6 0,0233 13,0 108,7 151,3 196,3
7 0,0237 13,0 107,0 151,4 194,9
8 0,0236 8,0 109,3 151,3 173,3
9 0,0252 8,0 106,9 151,4 191 ,8
10 0,0148 8,0 102,0 151 ,3 183,8
88

CHAP'T'ER4
Table 6. Final simulation results after optimisation ofkFZ.
Steam condensate Product juice Vapour product Product juice
flow rate concentration flow rate flow rate Forster· Run [kw'] [%(mlm)] [kw'] [kw'] ZubeT
numbe.-constant
Exptl. Calc. Exptl. Calc. Exptl. Calc. Exptl . Calc. (, 1000)
1 0,0031 0,0030 9,5 9,5 0,0028 0,0025 0,0147 0,0150 8,94
2 0,0092 0,0097 32,1 31 ,6 0,0109 0,0094 0,0074 0,0077 5,63
3 0,0092 0.0095 22,1 21 .6 0,0105 0.0090 0.0147 0,0157 4.43
4 0.0028 0.0026 9.9 9,7 0,0027 0,0023 0,0115 0,0119 '.92 5 0.0084 0.0090 40.0 39,7 0.0099 0,0089 0,0048 0,0049 3,15
6 0,0 104 0,0108 27,7 27,0 0,0124 0,0107 0 ,0109 0,0120 4,20
7 0,0105 0.0109 27,3 26,7 0,0124 0,0107 0.0113 0,0123 4,12
• 0.0043 0,0041 10,2 9,9 0,0048 0,0039 0,0188 0,0199 6.75
9 0.0090 0.0090 13,7 13,3 0,0105 0,0087 0,0147 0,0163 5, 10
10 0,0079 0,0078 20,9 19,9 0.0092 0.0074 0.0057 0.0070 5,75
It was found that the calculated optimal values of the Forster·Zuber constant were several
times higher than Chen's original value of 0.00122. ranging from 0,003 to 0,009.
Typically, it was observed that lower values ofkFZ (between 0,003 and 0,005) occurred for
experimental runs characterised by a large change in the juice concentration over the
evaporator (of the order of 15%(mlm) to 30%(mlm)). Experimental runs yielding only a
slight increase in juice concentration (of the order of3%(mlm) to 5%(mlm)) resulted in
higher values ofkFZ (hetween 0,007 and 0,009). This behaviour was found to be strongly
correlated with the average heat flux across the evaporator tube, as shown in Figure 15.
However. the hypothesis of a relationship between kl'Z. and the average heat flux needs
further confirmatory investigation.
A comparison between the model predictions and experimental data for nul 2 is shown in
89
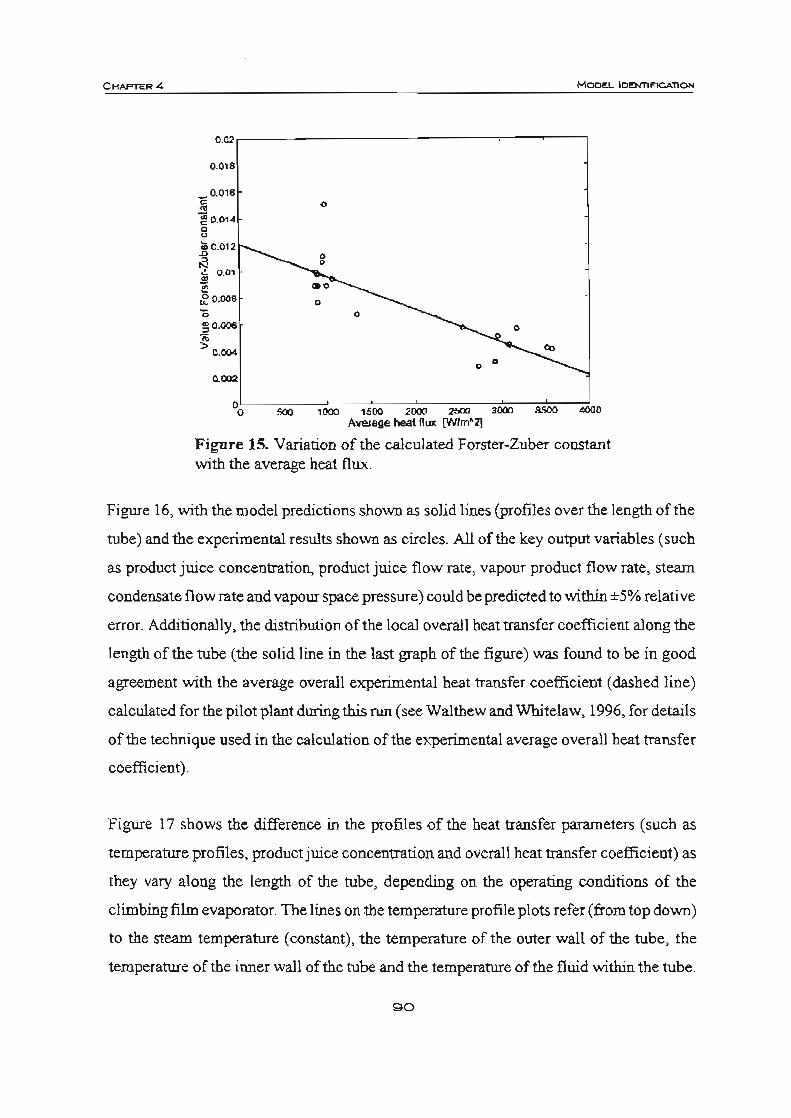
CHAPTER 4 MODEL lDENTlFlCAllON
0.Q2~----------------~--,
0.018
..... 0.016
!l ~O.014 o " .! 0.012
.0 .!. 0 .01
~ (i 0.00& -Q
~O.OO5
~ 0.004
0.002
o
o
\ ~ ,- ~ - - - - -AY8l"age heat flux [W/m~21
Figure 15. Variation of the calculated Forster-Zuber constant with the average heat flux.
Figure 16, with the model predictions shown as solid lines (profiles over the length of the
tube) and the experimental results shown as circles. All of the key output variables (such
as product juice concentration, product juice flow rate, vapour product flow rate, steam
condensate flow rate and vapour space pressure) could be predicted to within ±5% relative
error. Additionally, the distribution of the local overall heat transfer coefficient along the
length of the tube (the solid line in the last graph of the figure) was found to be in good
agreement with the average overall experimental heat transfer coefficient (dashed line)
calculated for the pilot plant during this run (see Walthew and Whitelaw, 1996, for details
of the technique used in the calculation of the experimental average overall heat transfer
coefficient).
Figure 17 shows the difference in the profiles of the heat transfer parameters (such as
temperature profiles, product juice concentration and overall heat transfer coefficient) as
they vary along the length of the tube, depending on the operating conditions of the
climbing film evaporator. The lines on the temperature profile plots refer (from top down)
to the steam temperature (constant), the temperature of the outer wall of the tube, the
temperature of the inner wall of the tube and the temperature of the fluid ,vithin the tube.
90

CHAPTER 4
_ O.02~---
i -0.015 • .'! ~ 0.01
~ :; 0.005 • • ,.
°0 2 4 6
e2ll B
Tube length {m!
8'0 ~ O,-,'---__ .J
o 2 4 6 ! Tube length [m]
.. -8,0.06..-- ---, <!!. .! O. ~ ~ 00.04
'"
°c 2 4 6 Tube length {ml
.. ~170 i, .. f'......-___ I 11se C
S'40 , ;; ll'30 " '-____ ---,-.J
o 2 4 6 Tube longth [m!
MOOEl. lQENTlFlCAllQN
" .... r-----."
~sooa e !.... ./ ,,30001-. -.. -.-.-.-.-•• ... "'2OOQ ~ "'QCIO ~
00 2 4 6 Tube length [m!
Figure 16. Simulation results for experimental run number 2.
Plots (a), (b) and (c) in the figure show the results for experimental run nwnber 4,
characterised by a low steam temperature. It can be seen that, over almost half of the
length of the tube, the evaporator functions as a juice heater. with only single phase liquid
convective heat transfer taking place. Low local overall beat transfer coefficient values
occur in this region of the tube, mostly due to the laminar flow nature of the single phase
flow as a result of the low juice flow rate. Obviously, these conditions result in a very poor
final product concentration.
By contrast, the results for experimental run nwnber \0 are shown in plots (d), (e) and (t)
in Figure 17. This experimental run is characterised by a high steam temperature, resulting
in a high overall heat transfer coefficient being observed over almost the entire length of
the tube. Both beat transfer profiles shown in the figure exhibit two characteristic
9 1
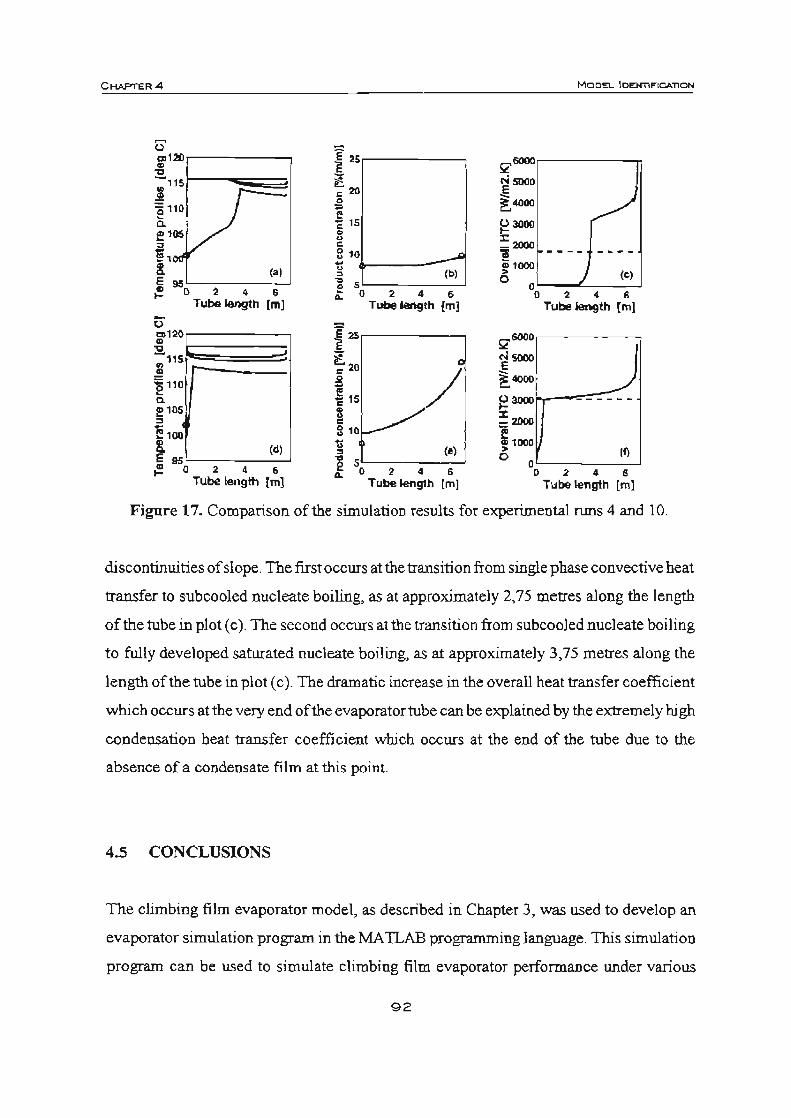
CHAPTER 4
1",--·----, .20 ~ i 15
~ g 10 ..A ~ · ... ---·~,~.)l £ 50 2 4 6
Tube length (m]
MODEL IDEN'TlFlCATlON
5<6000,.----"
~5000 ~ .... ~3000
1= "I o °0 2 4 6
Tube length [m]
S? .... I ~sooo l':. 40001 ~ ~ 3000 ~,.._~_"'_c:_:-::_ -
=-(f) 11000
D'~-;:2--:':--'=-' Tube length Iml
Figure 17. Comparison of the simulation results for experimental runs 4 and 10.
discontinuities of slope. The first occurs at the transition from single phase convective heat
transfer to subcooled nucleate boiling, as at approximately 2,75 metres along the length
of the tube in plot (c). The second occurs at the tr:msition from subcooled nucleate boiling
to fully developed saturated nucleate boiling, as at approximately 3,75 metres along the
length of the tube in plot (c). The dramatic increase in the overall heat transfer coefficient
which occurs at the very end of the evaporator tube can be explained by the extremely higb
condensation heat transfer coefficient which occurs at the end of the tube due to the
absence of a condensate film at this point.
4.5 CONCLUSIONS
The climbing film evaporator model, as described in Chapter 3, was used to develop an
evaporator simulation program in theMAILABprogramminglanguage.This simulation
program can be used to simulate climbing film evaporator performance under various
92
CHAPTER 4 MODEL.. lDEN'nFlCA11ON
operating conditions. Apart from changes in traditional operating parameters, such as
steam pressure, feed juice flow rate and feed juice temperature, etc., the program can also
be used to predict the effect on system performance of changes which are inconvenient to
evaluate in practice, such as those of tube size and tube materiaL
A series of experiments was carried out on a pilot plant climbing film evaporator at the
Felixton sugar mill to investigate the efficiency of heat transfer under varying operating
conditions. The factorial experiment involving changes in feed juice flow rate, feed juice
temperature, feed juice concentration and temperature difference driving force resulted
in a set of experimental data which was used to evaluate the performance of the simulation
program, and then to improve the performance of the model using process identification.
The initial model was modified by vaIYing the Forster-Zuber coefficient in the Chen
correlation for boiling heat transfer. The identification of this constant led to a great
improvement in the model perfonnance, giving 5% relative error between the model
predictions and the experimental measurements. A variation in the value of the Forster
Zuber coefficient was observed, which could be correlated with heat flux.
93

Chapter 5
Simplified Model
The original system of ordinary differential equations describing the steady-state operation
of a climbing film evaporator was strongly coupled and nonlinear. Moreover, the
nonlinearity was strengthened by the fact that the mechanism of beat transfer within the
tube changed dramatically when moving through the various zones \vithin the tube. such
as
• the non-boiling, single phase convective heat transfer zone.
• the subcooled nucleate boiling zone, and
• the saturated nucleate boiling zone.
As a result. obtaining an analytical solution tathe system of ordinary differential equations
was impossible and numerical integration techniques had to be used, requiring extensive
computational time. This limited the usefulness of the model for practica1 application.
A simplified model afthe climbing film evaporator system was thus developed, based on
linearisation of the original ordinary differential equations, which could be analytically
integrated. This simplified model was found to be an acceptable approximation of the
complex model, giving similar solutions under all of the process conditions tested.
5.1 DEVELOPMENT OF THE SIMPLIFIED MODEL
Of the six ordinary differential equations describing the climbing film evaporator system,
the two strongly coupled, nonlinear equations requiring numerical solution were those
resulting from the overall enthalpy balance, equation (14), and the momentum balance,
equation (20). These equations can be represented in the following general mathematical
form:
94
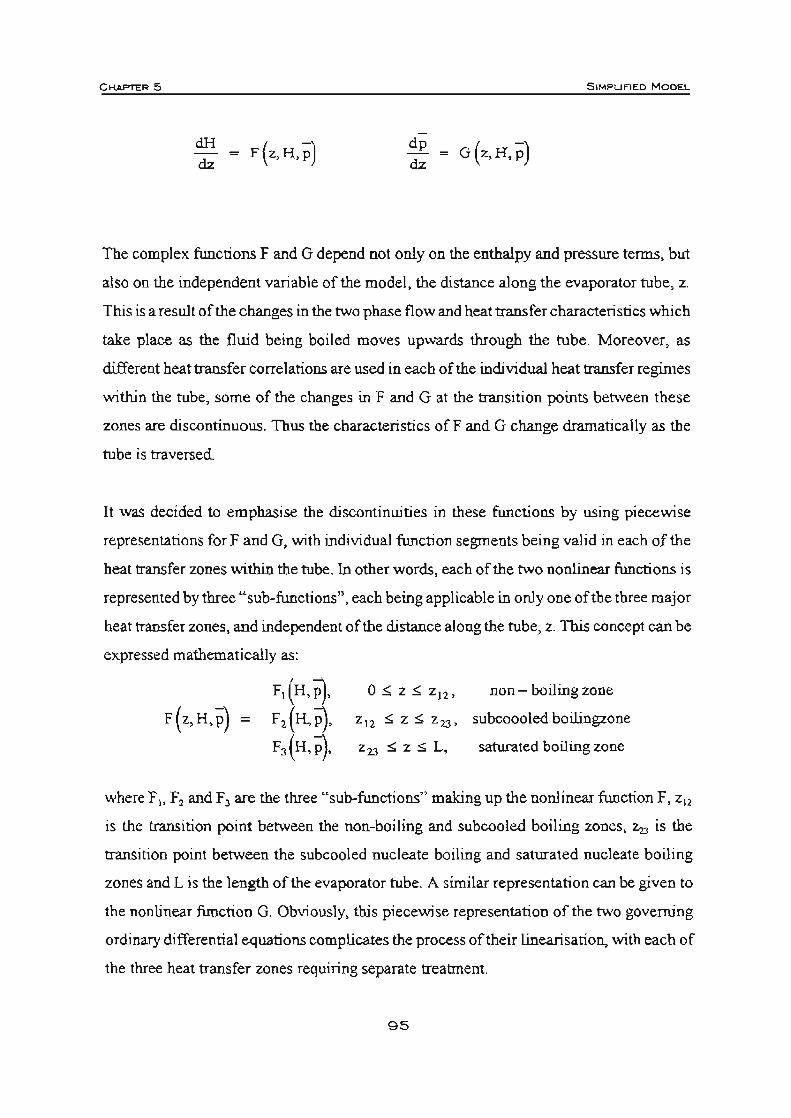
C....,.,... 5 SIMPUI'lED MODEL
The complex functions F and G depend not only on the enthalpy and pressure terms. but
also on the independent variable of the model. the distance along the evaporator tube. z.
This is a result of the changes in the two phase flow and beat transfer characteristics which
take place as the fluid being boiled moves upwards through the tube. Moreover, as
different beat transfer correlations are used in each of the individual heat transfer regimes
within the tube, some of the changes in F and G at the transition points between these
zones are discontinuous. Thus the characteristics of F and G change dramatically as the
tube is traversed.
It was decided to emphasise the discontinuities in these functions by using piecewise
representations for F and G, with individual function segments being valid in each of the
heat transfer zones within the tube. In other words, each of the two nonlinear functions is
represented by three "'sub-functions". each being applicable in only one afthe three major
heat transfer zones, and independent of the distance along the tube, z. This concept can be
expressed mathematically as:
Ft (H. p). F, (H. ii). F3(H. p).
o ~ z ~ 2 12 • non-boilingzone
212 ~ 2 ~ 2 23 • subcoooled boilingzone
Z23 :s; Z ~ L. saturated boiling ZODe
where F l> F2 and F3 are the three "sub-functions" making up the nonlinear function F . Zl2
is the transition point between the non-boiling and subcooled boiling zones, Zn is the
transition point between the subcooled nucleate boiling and saturated nucleate boiling
zones and L is the length of the evaporator tube. A similar representation can be given to
the nonlinear function G. Obviously. this piecewise representation of the two governing
ordinary differential equations complicates the process of their linearisation. with each of
the three heat transfer zones requiring separate treatment.
95
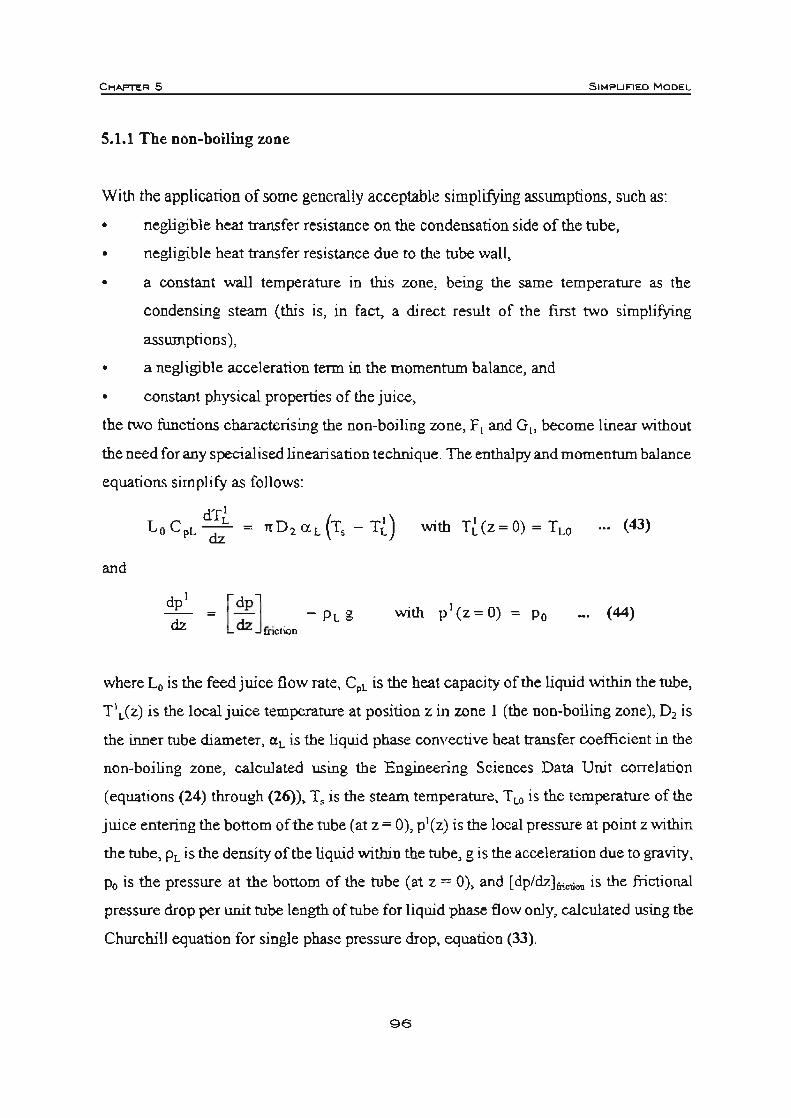
SlMPUFlED MODEL.
5.1.1 The non-boiling zone
With the application of some generally acceptable simplifying assumptions, such as:
• negligible heat transfer resistance on the condensation side of the tube.
• negligible heat transfer resistance due to the tube wall.
• a constant wall temperature in this zone, being the same temperature as the
condensing steam (this is, in fact, a direct result of the first two simplifying
assumptions),
• a negligible acceleration term in the momentum balance, and
• constant physical properties of the juice,
the two functions characterising the non-boiling zone, F I and G \. become linear without
the need for any specialised linearisation technique. The enthalpy and momentum ba1ance
equations simplify as follows:
and
dpl
dz
with TUz ~ 0) ~ TLO
with pl (Z~O) ~ Po
.•. (43)
... (44)
where L, is the feed juice flow rate, C,.. is the heat capacity of the liquid within the tube,
T 1L(Z) is the local juice temperature at position z in zone 1 (the non-boiling zone), D2 is
the inner tube diameter, (XL is the liquid phase convective heat transfer coefficient in the
non-boiling zone, calculated using the Engineering Sciences Data Unit correlation
(equations (24) through (26)), T, is the steam temperature, TLO is the temperature ofthe
juice entering the bottom of the tube (at z ~ 0), p '(z) is the local pressure at point z within
the tube, PL is the density of the liquid within the tube, g is the acceleration due to gravity,
Po is the pressure at the bottom of the tube (at z = 0), and [dpldzl ... oo is the frictional
pressure drop per unit tube length of tube for liquid phase flow only, calculated using the
Churchill equation for single phase pressure drop, equation (33).
96
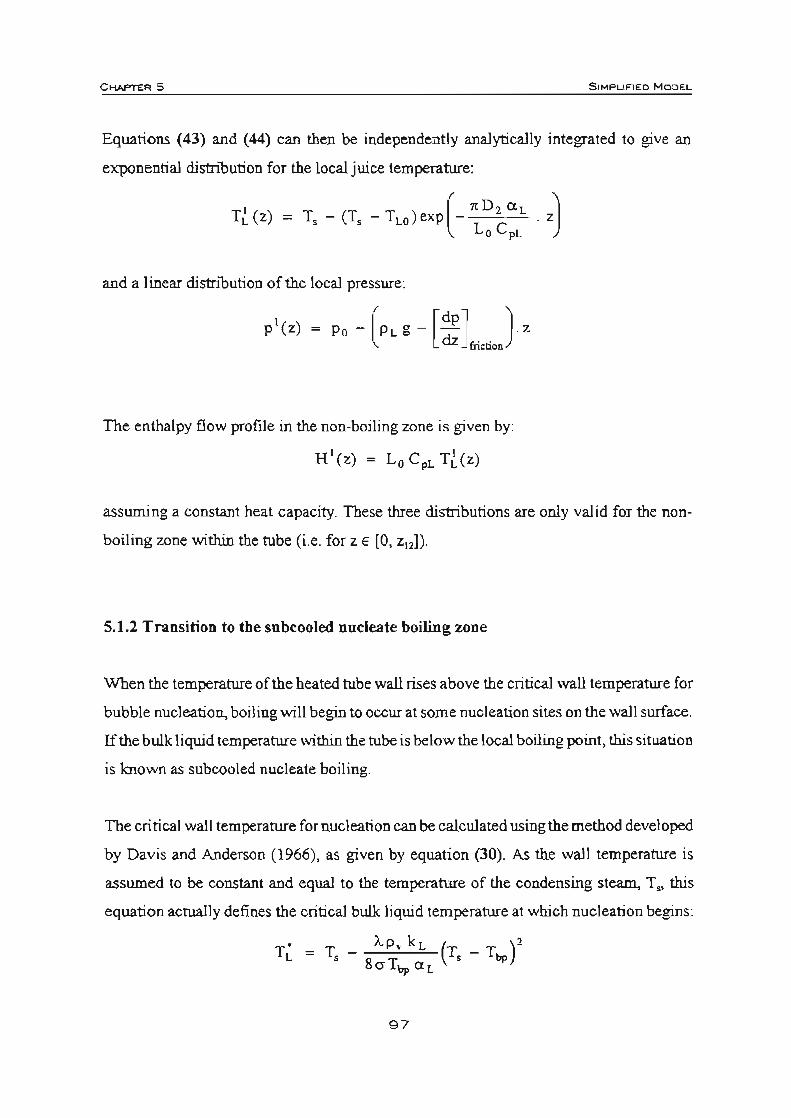
CHAP'TEFI 5 SIMPUfC'EO MOOEI..
Equations (43) and (44) can then be independently analytically integrated to give an
exponential distribution for the local juice temperature:
and a linear distribution of the local pressure:
The enthalpy flow profile in the non-boiling zone is given by:
HI(z) = Lo C pL T{(z)
assuming a constant heat capacity. These three distributions are only valid for the non
boiling zone within the tube (i.e. for z E [0, Z,,]).
5.1.2 Transition to the subcooled nucleate boiling zone
When the temperature of the heated tube wall rises above the critical wall temperature for
bubble nucleation, boiling will begin to occur at some nucleation sites on the wall surface.
!fthe bulk liquid temperature within the tube is below the local boiling point, this situation
is known as subcooled nucleate boiling.
The critical wall temperature fornucleation can be calculated using the method developed
by Davis and Anderson (1966), as given by equation (30). As the wall temperature is
assumed to be constant and equal to the temperature of the condensing steam, T s> this
equation actually defines the critical bulk liquid temperature at which nucleation begins:
97

CHAPTER 5 SI MPLIFIED MODEL
where T' L is the critical bulk liquid temperature for nucleation, }. is the latent enthalpy of
vapourisation of the liquid being boiled, p. is the density of the vapour phase, kL is the
thermal conductivity of the liquid phase, 0 is the surface tension of the liquid and T", is
the local boiling point of the liquid within the tube. Note that the critical bulk temperature
for nucleation is a function of distance along the length of the tube. z. This is because
T' L(Z) is a function of the juice boiling point, T bp> which is determined by the local
pressure, p'(z).
The first transition point in the simplified climbing film evaporator model , Z12, can be
defmed as the distance, measured from the bottom of the evaporator tube, at which the
local bulk temperature of the juice, resulting from the non-boiling zone model, approaches
the critical bulk temperature for nucleation. Mathematically. this condition is defined as:
.,. (45)
Since the functions for calculating both of these temperatures are noniinear, numerical
techniques are required to solve equation (45) for the transition point, Z".
5.1.3 Tbe boiling zones
The F and G functions for the two nucleate boiling zones (the subeooled and saturated
nucleate boiling zones) are much more complex than those for the non-boiling zone, and
simple physicaJ arguments like those used in section 5.1.1 above are insufficient to
linearise them. A purely formal linearisation technique, such as a truncated Taylor
expansion around an arbitrarily chosen point (H', p) could be used. Alternatively, as F
and G are functions of two variables, linearisation could be performed by approximating
some actual known values of the F and G functions with planar (two-dimensional linear)
representations over a certain range ofH and p values. In this study, the second method
oflinearisation was considered more suitable, as it provides more realistic values of the
linearised functions over the whole (H, p) domain of interest, rather than around an
98

CHAFfER 5 SIMPWFIED MODEL.
arbitrary point.
Using the general equation of a plane in three-<limensional space to approximate both Fi
and Gi results in:
FFin(H, p) = "ID + a 11 H + a 12 p
.•. (46)
(for clarity, the " i" indices on the a coefficients bave been omitted on the right hand sides
of the equations) where the unknown coefficients ~k: can be detennined by minimising the
distance between the actual surfaces, Fj and G;, and their linearised coWlterparts, FjLin and
G/·in, respectively. In general, the method ofleast squares was used for these calculations.
However, the approach differed slightly, depending on the actual shape of the F and G
functions in three-dimensional space.
Examples of the F and G surfaces for the subcooled and saturated nucleate boiling zones
have been numerically generated and are shown in Figures 18 and 19, respectively. The
surfaces F, (H, j)) and G, (H, j)), characterising the subcooled nucleate boiling zone, are
fairly planar and can be easily !inearised, with the additional requirement that the
linearised planar representation pass through the F and G function values prevailing at the
first transition point. Z12' In other words. the linearised planar representation is constrained
to pass through (Hu. 1>12, F12) and (H11, P12, GIl)' This produces a very reliable
approximation around the point of transition between the DOD-boiling zone and the
subcooled nucleate boiling zone, which is critical to accurate model perfonnance in both
of these heat transfer zones. Moreover, this can be achieved without significantly
sacrificing model accuracy at (H, j)) points lying far from the transition point, due to the
fairly planar nature of the actual F and G curves.
99
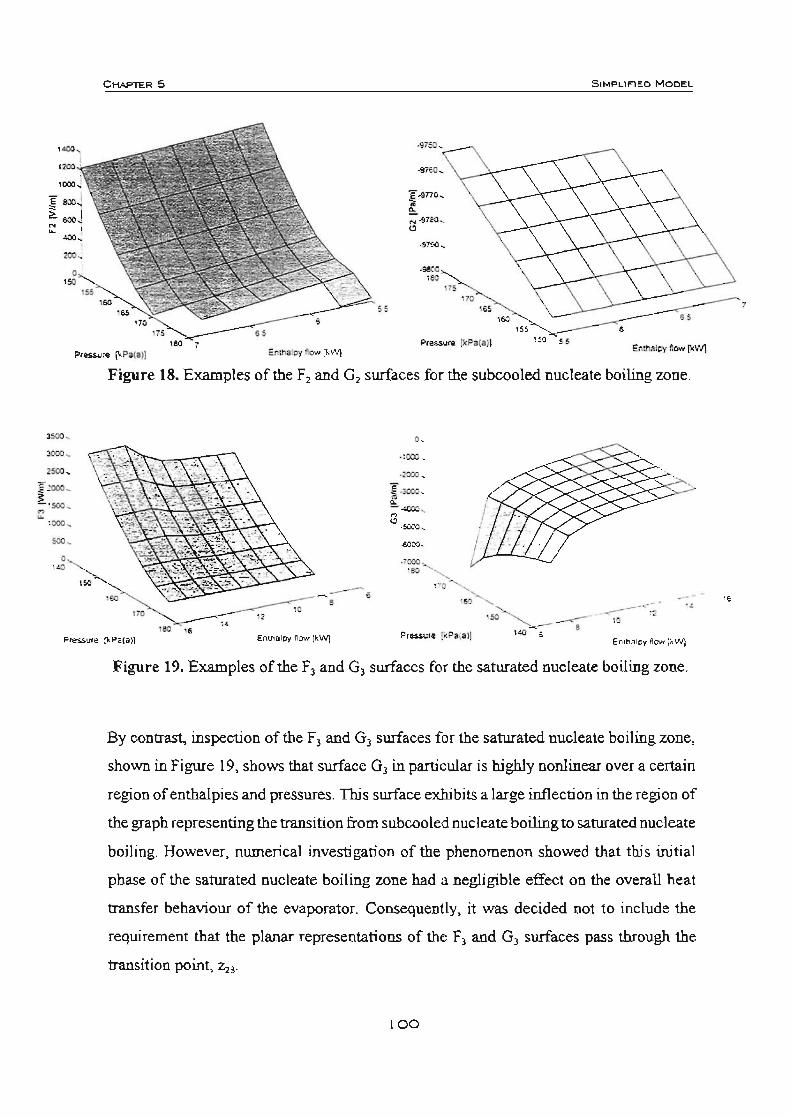
=. ""'.
f.:ooo ~ !. '500~ ~
o .",
C~ 5 S IMPL IFIED M O DEL.
," , PtHSUI"e (l<Pa(IJ)
Pre<;$Ure [!cP.(.») ,~ 5S Enma\py tow (l<WJ
Figure 18. Examples of the F, and G, surfaces for the subcooled nucleate boiling zone.
o.
·:000 ,
.=. I -lOIX),
• - ..,., 8 • . = . -. .TOOO,
. ~ ~
·M ........
,,,'-. ---' . ">.- , ----~-.-:,
,0 •
.,
Pressure {kPa(.») Enl/'ll lpy now (lIWl Pl"HSure !~Pil(l)j '40 6
Figure 19. Examples of the F) and 0 3 surfaces for the saturated nucleate boiling zone.
By contrast, inspection of the F) and 0 3 surfaces for the saturated nucleate boiling zone,
shown in Figure 19, shows that surface G) in particular is highly nonlinear over a certain
region of enthalpies and pressures. This surface exhibits a large inflection in the region of
the graph representing the transition from subcooled nucleate boiling to saturated nucleate
boiling. However, numerical investigation of the phenomenon showed that this initial
phase of the saturated nucleate boiling zone had a negligible effect on the overall heat
transfer behaviour of the evaporator. Consequently, it was decided not to include the
requirement that the planar representations of the F) and 0 ) surfaces pass through the
transition point, Z:!).
100
.,
CHAPTER 5 SIMPUFIED MODEL.
5.1.4 The subcooled nucleate boiling zone
As discussed previously, the approximating planes for F, and G, are constrained to pass
through the corresponding conditions at the first transition point, 2 1" namely (hi', PI', F I,)
and (h ,2• PI2. G , 2) This additional requirement converts the equations for these planes.
equation (46), into a more specific form:
••• (47)
where Ft. ]2 is the value of the function F2 at l'2 and, similarly, O2, 12 is the value of the
function G2 at Z ]2. The four unknown coefficients a ' l> a '2, 3.,] and an can be detennined
using the classic least squares regression, the objective being the minimisation of the sum:
N,
~ [Un - ' ]' I = L... F, (H"p,)- F2.i + I: 1
N
"" [ Un - ']' L G, (H"p,) - G,., i . l
with respect to the coefficients a;b where F2Lin and G2 LilI are given by equation (47) and F· 2. i
and G°l.i are values detennined from the original complex model (i.e. the values making
up the original F, and G, surfaces). NF and No are the numbers of(H;, Pi) points making
up the F and G surfaces, respectively. This procedure represents the process of fitting the
equation of a plane to a selected set of F2 and G2 data.
Once the coefficients a,k have been detennined by least squares regression, it becomes
possible to solve the linearised system of ordinary differential equations for the subcooled
nucleate boiling zone. These equations can be written in a matrix-vector fonn as:
..'!... [~: dz P
- HI2 ] _ [F'~~' ] ~H2 -H12] - - Lin. + - 2 -- P12 G 2,12 P - Pl1
_ (48)
101

CHAPTER 5 SIMPUF"IED MOOEL
where If and p2 are the enthalpy and modified pressure values of interest in zone 2 (the
subcooled nucleate boiling zone). with A being the matrix of a, .. coefficients. The initial
conditions are H'(z,,) = H" and P'(z,,) = p". Since equation (48) represents a system of
two linear ordinary differential equations with constant coefficients. it can be integrated
analytically. The solution of this system can be expressed in terms of the matrix
exponential and, in the case where A is nonsingular. is given by:
•.. (49)
where ~~2 is the 2x2 identity matrix.
Equation (49) only applies to the subcooled nucleate boiling zone. that is for Z E [z ll> Zn].
In this heat transfer zone. the bulk liquid is subcooled and thus the entha1py. H'(z)
uniquely defines the liquid temperature. T'L. in this zone.
5.1.5 Transition to tbe saturated nucleate boiling zone
As the temperature of the juice within the tube approaches its local saturation temperature,
T bp. the mechanism of heat transfer changes from subcooled nucleate boiling to saturated
nucleate boiling heat transfer. The second transition point in the simplified evaporator
model , Zn. is defined as the distance, measured from the bottom of the evaporator tube,
at which the local bulk temperature of the juice. resulting from the subcooled nucleate
boiling zone model. approaches the local boiling point temperature. Mathematically. this
condition can be expressed as:
Ti(z) - T.",(z) = 0 ••• (SO)
The bulk temperature of the juice in the subcooled nucleate boiling zone is a nonlinear
102

Cl"tAPTER 5 SLMPUFLED MOOEI..
function with respect to the distance along the tube, z. Furthermore, the local boiling point
temperature of the juice is a nonlinear function of the local pressure within the tube, ji'(z).
Thus, numerical techniques are required to solve equation (SO) for the transition point, z".
5.1.6 The saturated nucleate boiling zone
The F, and G, functions for the saturated nucleate boiling zone can be approximated by
a planar representation. This is achieved by fitting two equations for planes
Lin -F3 (H, p) = blO + bll H + b l2 p
... (51)
to available F"3 and GO 3 data. The six unknovvn bjk coefficients can be determined using a
least squares regression technique, as for the subcooled nucleate boiling zone.
Once the bj , coefficients have been detennined, equation (51) constitutes the right hand
sides of the linearised enthalpy and momentum balances for the saturated nucleate boiling
zone. This system of two linear ordinary differential equations can be written in matrix
vector form as:
••• (52)
where HJ and iT are the enthalpy and modified pressure values of interest in zone 3 (the
saturated nucleate boiling zone). with the matrix B being the matrix ofbjk coefficients. The
initial conditions H'(z,,) = H" and P'(z,,) = p" result from the linearised model for the
subcooled nucleate boiling zone at the second transition point,~. Equation (52) is a linear
system of equations, and as such is analytically integrable. For a nonsingular matrix S ,
which was found to be true in practice, the solution is:
103
CHAPn:R 5 SIMPUI'"IEO M oDEl..
[I!:(Z)] = [exP(B(z - z" l) _ E2•21(B-,[b lO ] + [1!23]) + [1!23] ... (53) p (zl b20 p" p"
Equation (53) is valid only for the saturated nucleate boiling zone. that is for z E [z". L].
In this heat transfer zone, the enthalpy within the tube, H'(z) uniquely defines the flow rate
of vapour, rather than the juice temperature, as the temperature of the boiiingjuice is
detennined thennodynamically as the boiling point of the juice at the given local pressure
and juice composition.
5.2 NUMERICAL SOLUTION OF THE SIMPLIFIED MODEL
In practical operation, the operating conditions ofa climbing film evaporator are specified
in such a way that the juice characteristics, such as temperature and composition, are
specified at the bottom of the evaporator tube, while certain operating parameters, such
as the vapour space pressure and flow rate of condensate per unit length of tube perimeter,
are only available at the top of the evaporator tube. A problem of this nature is classified
as a two point boundary value problem, and requires solution using numerical techniques.
The simulation of the otiginal system of ordinary differential equations (the complex
model) constitutes a two point boundary value problem of the form:
dH
dz = F(z, H,ii; reo») H(O) = H o
dp= ( ;;\ dz G z,H,p) P(L) = p,,,,,
Note that the two ordinary differential equations utilise boundary conditions known at both
ends of the evaporator tube. The above boundary value problem can be solved by
numerically finding the root [I'(O), P(O)] of the following system of two algebraic
104
C~R5 SIMPLIFIED MOOEL
equations:
p(L) - P"", 0
... (54)
r(L) ~ 0
where the flow rate of condensate per unit length of tube perimeter. r. results from a
combination of the condensate and juice enthalpy balances:
r(z) ~ r(o) _ H(z) - H(O) 1t D 2 Ac
... (SS)
where Dz is the diameter of the inner tube wall and Ac is the latent enthalpy of
condensation for the condensing steam. The process of solution of these algebraic
equations is iterative and involves the Newton-Raphson technique. 1bis is particularly
time-consuming. in that the integration of successive initial value problems is required,
in order to evaluate the right hand side of equation (54), at each iteration step of the
Newton-Raphson procedure.
In principle, the simplified, linearised climbing film evaporator model also constitutes a
two point botmdary value problem. However, as a full analytical solution of the simplified
model is available, finding the root of the system of algebraic equations in equation (54)
no longer requires time-consuming numerical integration of a system of differential
equations. The root can be found utilising the same Newton-Raphson solver as for the
complex model. and the required solution can be evaluated via the following sequence of
calculations at each iteration step:
• The first transition point, Zl2 is detennined from equation (45), using Newton's
method for solution.
• The enthalpy and pressure values at the transition point. H I2 and P12.are determined
from the equations of the non-boiling zone model.
• The approximating planes for the subcooled boiling zone. F2l.ia and G2Lin
• are
determined by generating a set of sample points. at which actual values from the F 2
105
C~5 S lMPUF"IED MODEL.
and G, surfaces, F~' and G;, can be evaluated, and evaluating the matrix of
coefficients, A.
• The second transition point, "n, is determined from equation (SO), using Newton's
method for solution.
• The enthalpy and pressure values at the transition point, H23 and Pn,are determined
from the equations of the subcooled nucleate boiling zone approximating planes.
• The approximating planes for the saturated boiling zone, F3Lin and Gllin, are
determined by generating a set of sample points, at which actual values from the F,
and G, surfaces, F,;' and G,;' , can be evaluated, and evaluating the matrix of
coefficients, B.
• The enthalpy and pressure values at the end of the evaporator tube, HI.. and Pt. are
determined from the equations of the saturated nucleate boiling zone approximating
planes. f(L) is calculated using equation (SS).
• The right hand side of equation (54) is evaluated.
5.3 COMPARISON WITH THE COMPLEX MODEL
The simplified climbing film evaporator model was validated by comparing the results of
several simulations under different operating conditions against the results obtained using
the complex model simulation program under the same conditions. Selected graphical
results from two such comparative tests are displayed in Figures 20 and 21, with the results
from the complex model being shown as the solid lines in the figures and the results from
the simplified model being shown as the dotted lines.
The plots labeled (a) in the figures show the juice temperature profile as the evaporator
tube is traversed Under the conditions used in these two examples, the juice reaches its
boiling point fairly rapidly upon entering the tubes (as would typically occur in an
industrial situation). Once saturated nucleate boiling has been initiated, the juice
temperature remains reasonably constant, decreasing slightly as the tube is traversed due
106
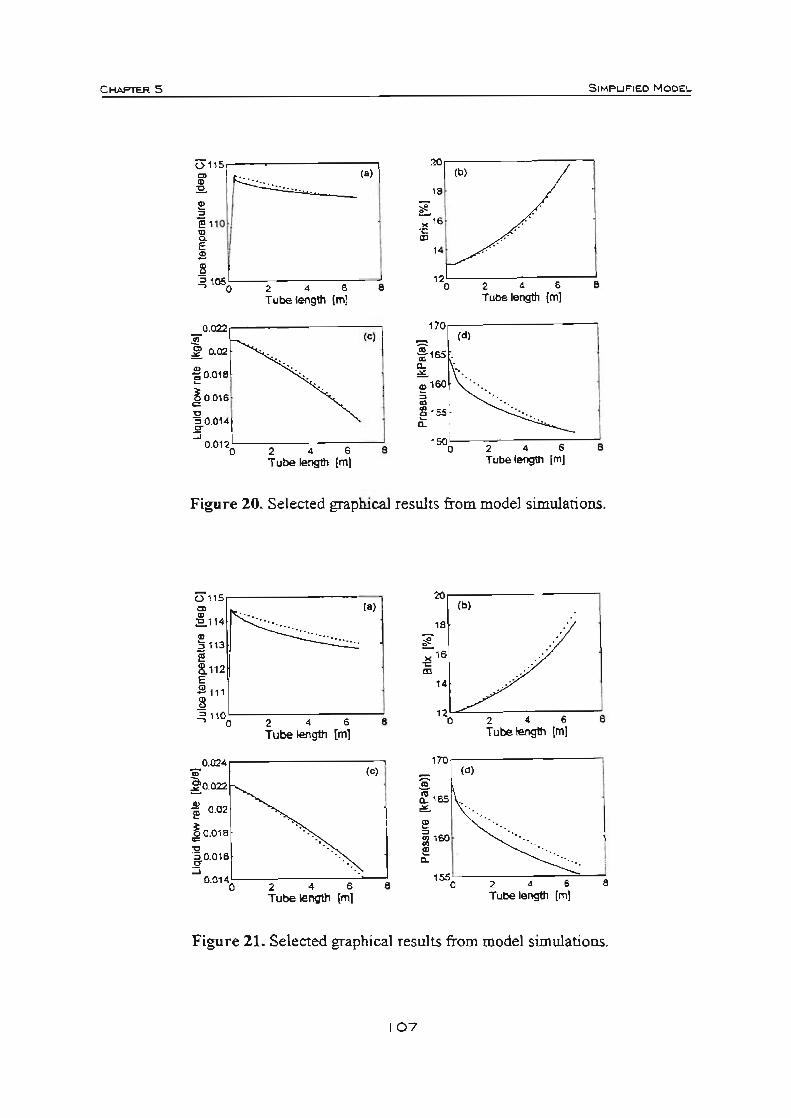
C MAPTER 5 S IMPUFIED MODEL
(3' 115 20
l:' .... ,a) lb) .... "- .... , . • i1:. , i! 110 . ,. 8. ~ .
'" E ,. " Jl
" 0 ' 106 8 2 4 , 8 - 0 2 , • Tube length [m] Tube length (m]
0.022 170 .. ,<)
i 155 . 'd)
~ 0.02
~ 0.018 0. . , "-
~o'16 1 e 160 ,
io.Ol" • £155
......I O.O12~ 2 , • • ""a 2 , • • Tube length Im] Tube \eogttI [mJ
Figure 20. Selected graphical results from model simulations.
0 115 20
ill4 ~ .. ,.) ' b) , .
• "' '5113
1112
.,. ~
'" E " .s 111
Jl "a ~ 110
2 • 8 • ~ , 2 4 • • Tube length [m} Tube length {ml
0.02" 170
'" ,<) 'd)
'" ... ~O.022
~ 0.02 :. -,55 "-
~ 0.O18 e i 160
~
" ;g0.018 0. ".
0 .0140 2 , • • 155, 2 , , 8
Tube length (m) Tube \eng1tl [m]
Figure 21. Selected graphical results from model simulations.
107
CHAPTER 5 SIMF'UFIED MODEL.
to the reduction of hydrostatic head with height up the tube.
The plots labeled (b) in Figures 20 and 21 show the concentration profile of the juice as
it moves through the evaporator tube. It can be clearly seen that the simplified model
better approximated the complex model under the conditions prevailing for the example
in Figure 20. A slight error in the prediction of juice concentration is evident in Figure
21(b).
The plots labeled (c) in the figures display the liquid phase flow rate through the
evaporator tube. As vapour is formed. the liquid phase flow rate drops proportionately. As
the liquid phase flow rate andjuice concentration are intimately related, the error evident
in Figure 21(b) is also evident in Figure 21(c).
The plots labeled (d) in the figures show the local pressure profiles along the evaporator
tube. Once again, it is clear that the example in Figure 20 was more accurately
approximated by the simplified model than the example in Figure 21 .
While minor differences between the results are apparent, it is evident that the simplified
evaporator model is a reasonably good representation of the more exact complex model.
108

Chapter 6
Application of the Simplified Model
The simplified climbing film evaporator model was used to develop an evaporator
simulation program in the MA TLAB programming language.
The simplified climbing film evaporator model was applied to the study of three important
applications in the sugar industry. For these studies, the original value of the Forster-Zuber
coefficient, kfZ ~ 0,00122, as specified by Chen, was used.
6.1 THE EFFECT OF JUICE FLOW RA TIC
The feed juice flow rate to climbing film evaporators is of critical importance to their
efficient operation. Tests were carried out using the Felixton mill pilot plant evaporator
to determine the effect of feed juice flow rate on evaporator perfonnance, with the other
experimental operating parameters held constant (Walthew and Whitelaw, 1996). The
results of some of these experimental tests are shown in Figure 22, where the average
overall heat transfer coefficient for the evaporator is displayed as a function of the feed
juice flow rate.
In order to confirm these experimental observations. the simplified evaporator model was
used to study the effect of feed juice flow rate on the average overall heat transfer
coefficient of a climbing film evaporator. The operating conditions used in the study.
shown in Table 7. were similar to those used for the first effect climbing film evaporators
at the Felixton sugar mill . Three different tube diameters (38,40 mm, 48, 36 mm and 71 ,60
mm) were assumed, with feed juice flow rates varying between 0,5 and 3 kg/min/tube. The
results of the model simulations are shown in Figure 23.
109

C HAPTER 6
3.5
n
" .., ,,~ .. ",
·h a.~ 2.5 -~~
"u e<> ,", i'!:>: " > ""
1., 0
• 0.5
• f -• • . ..
...
Appuc .... nOH OF THE SIMPUFlEO MODEL
•• •
1.5
•
2 2.5
Feedjuice flow rate [kg/min/tube]
Figure 22. The effect of juice flow rate on evaporator performance for a 48,36mm diameter tube. [Walthew and Whitelaw, 1996]
Table 7. Operating conditions for the model study offeedjuice flow rate.
Number ofrubes '000 Tube length [mJ 6,73
Feed juice sucrose concentration r/O(mlm)] 10,2
Feed juice impurity concentration {%(mfm)] 1,8
Feed juice temperature (0C] 11 0
Steam pressure [kPa(a)J 200
Vapour pressure [kPa{a)] ISS
Figure 23 confirms the general trend of the expelimental data, whieh was obtained using
48,36 mm inner diameter tubes. However, the feedjuiee flow rate at wbich the substantial
increase in overal1 average heat transfer coefficient occurs, as predicted by the model, is
different to that obtained experimentally. The reason for this difference is not yet known,
1 10

CHAPTER 6 Af>f>UCATlOH OF" Tl-iE SIMPUF"IEO M ooa
and further work would be required to identify the cause.
2~r-------------------~-----------------.
"'" ;Z2100
~ ~2000
~ %,.00
l l----:7?--~ 0\900
38,40 nun ------/
48,36 nun
71 ,60 Iml
,,,,,,I =;;::;:~~=:;:::=~ F o.!: \ \5 2 25 J Feeo juICe "CM' rate [kg/miMube]
Figure 23. The effect of j wce flow rate on evaporator performance.
As expected, the flow rate at which the substantial change occurs increases with increasing
tube diameter. This is due to the increase in cross-sectional area for flow within the tube
with increasing tube diameter. In a small diameter tube, a lower flow rate is required for
thorough wetting of the tube wall surface than in a larger diameter tube. The substantial
change in beat transfer coefficient is not visible on the cwve for the 71 ,60 mm internal
diameter tube, as it probably at a flow rate higher than those studied here.
Using the simplified evaporator model to evaluate the effect of tube diameter on
evaporator performance showed that, for each feed juice flow rate. on optimal tube
diameter exists which maximises the overall average heat transfer coefficient. At the juice
flow rates typically encountered in the South African sugar industIy, tubes of inner
diameter 48.36 mm (the most common tube Si7..e in the industry) would appear to be a
reasonable choice.
Waltbew and Whitelaw(1996) showed that a low feed juice flow rate limits the maximum
I I I

ApPUCATlON OF" Tl-tE SIMPUFlEO MODE L
attainable heat transfer coefficient by limiting the water available for evaporation. They
also showed that the degree of fouling within evaporator tubes in the sugar industry
decreased with increasing feed juice flow rate. These factors, along with the experimental
data from the pilot plant climbing film evaporator and the results of this theoretical study,
indicate that climbing film evaporators should be ideally be operated so as to achieve a
consistently high feed flow rate.
6.2 THE EFFECT OF JUICE RECYCLE
The process of beat transfer in a climbing film evaporator is subject to conflicting effects
with regard to feed juice flow rate. On the one hand, a relatively low flow rate is desirable
to ensure a reasonable juice residence time within the evaporator. This allows for a high
degree of evaporation to take place. By contrast, low juice flow rates (and hence low juice
velocities within the tubes) result in laminar flow conditions within the evaporator tubes.
leading to poor convective heat transfer coefficicnts2•
In the subcooled nucleate boiling and saturated nucleate boiling zones, the nucleate boiling
heat transfer mechanism dominates. with very little contribution to the overall heat
transfer coming from the convective heat transfer mechanism. As nucleate boiling heat
transfer is fairly insensitive to the flow rate within the tube. the effect of low juice flow
rates on heat transfer within these zones is small. However. laminar flow conditions
dramatically affect the length of the non-boiling zone. where single phase convective heat
transfer dominates. Any increase in the length of the non-boiling zone results in a
shortening of the length of tube available fOTthe more efficient boiling heat transfer zones.
negatively impacting on overall heat transfer and, hence, on the amQlmt of water
evaporated.
, Very low juice feed flow rates to climbing film evaporators can also result in partial tube dry-out at the top ends of the tubes, with the consequences ofa significant decrease in overall heat transfer and a greatly accelerated rate of fouling .
12
CHAPTEA6 ApPUCATlON OF' THE SIMPUF'IED MODEL.
Two techniques can be used to ensure good heat transfer in a climbing film evaporator.
The first of these is adequate feed juice preheating to ensure the onset of nucleate boiling
as soon as possible after the juice enters the evaporator tubes, thus effectively eliminating
the non-boiling zone. A theoretical study of the effect of feed juice preheating on the
length of the non-boiling zone has heen performed (peacock, 1996; Peacock, 1998). The
second technique involves recycling a tx>rtion of the concentrated liquid phase leaving the
evaporator back to the feed juice inlet to improve the system hydrodynamics.
While increasing the juice flow rate per tube results in more efficient convective heat
transfer, the overall effect of recycling on evaporator performance is more complex. As
a result of the addition of high concentration material from the evaporator outlet, some of
the physical properties of the feed juice stream, such as the density and viscosity, will
increase, negatively affecting overdll evatx>rator performance. The combined result of
these conflicting effects can not be intuitively determined for any given system. It was thus
decided to apply the simplified evaporator model to study the effect of recycling on
evaporator perfonnance more closely.
6.2.1 Recycling for process stability
Recycling of juice during evaporation results in more than just enhanced convective heat
transfer, with benefits also realised in terms of process stability. The damping effect of
recycling enables minor feed juice flow fluctuations to be eliminated easily, resulting in
more steady evaporator operation. The benefits of steady operation, in terms of the
elimination of the possibility of tube dry-out and the mitigation of evaporator fouling, are
significant. It is predominantly for these reasons that some South African sugar mills have
instal1ed recycle lines in their climbing film evaporators, not for the enhancement of
convective heat transfer. Nonetheless, it is important to be able to evaluate the effect of
recycling on evaporator performance, regardless of the reasons for its use.
113
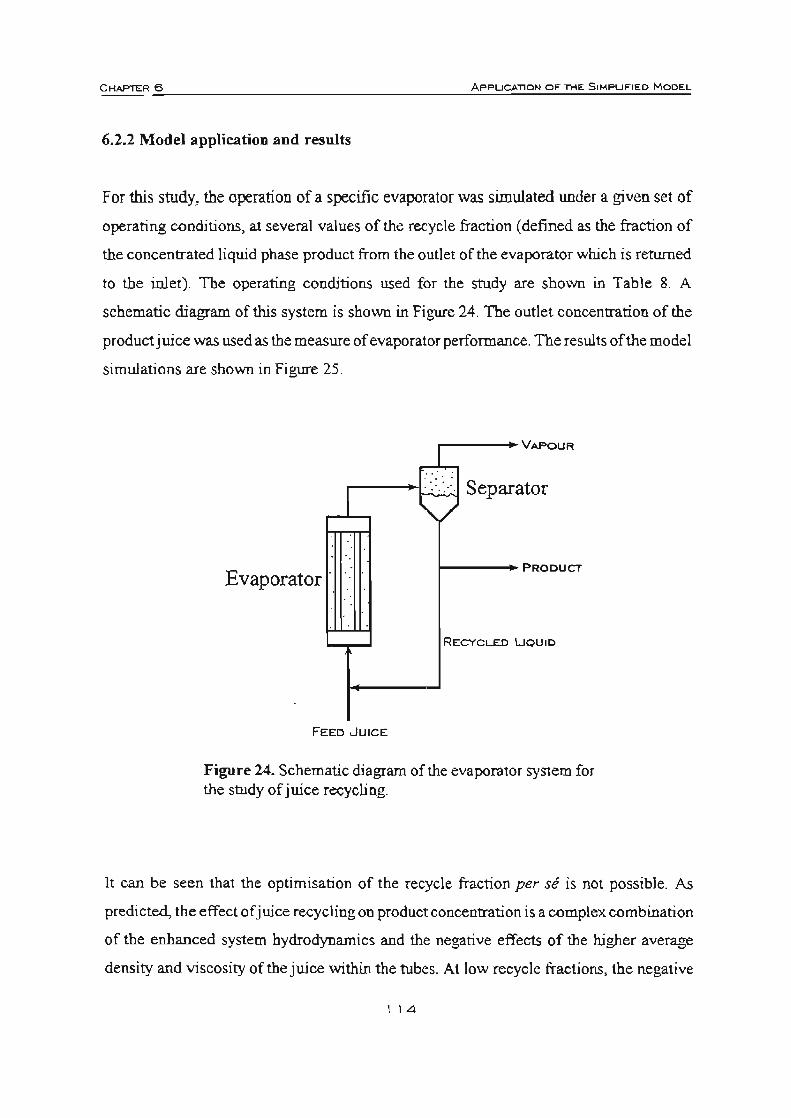
CHAPTER 6 ApPUCAl10N OF" TME SIMPUF"IED MODEL
6.2.2 Model application and results
For this study, the operation of a specific evaporator was simulated under a given set of
operating conditions, at several values of the recycle fraction (defined as the fraction of
the concentrated liquid phase product from the outlet of the evaporator which is retwned
to the inlet). The operating conditions used for the study are shown in Table 8. A
schematic diagram of this system is shown in Figure 24. The outlet concentration of the
product juice was used as the measure of evaporatorperfonnance. Theresu1ts of the model
simu1ations are shown in Figure 25.
.----~VAPOUR
: .:. : ,-...,':"':0.;: .. ;;1. Separator
Evaporator !----.-PRODUCT
RECYCLED LlOUID
FEED ..JUICE
Figure 24. Schematic diagram of the evaporator system for the study of juice recycling.
It can be seen that the optimisation of the recycle fraction per se is not possible. As
predicted, the effect of juice recycling on product concentration is a complex combination
of the enhanced system hydrodynamics and the negative effects of the higher average
density and viscosity of the juice within the tubes. At low recycle fractions, the negative
1 14
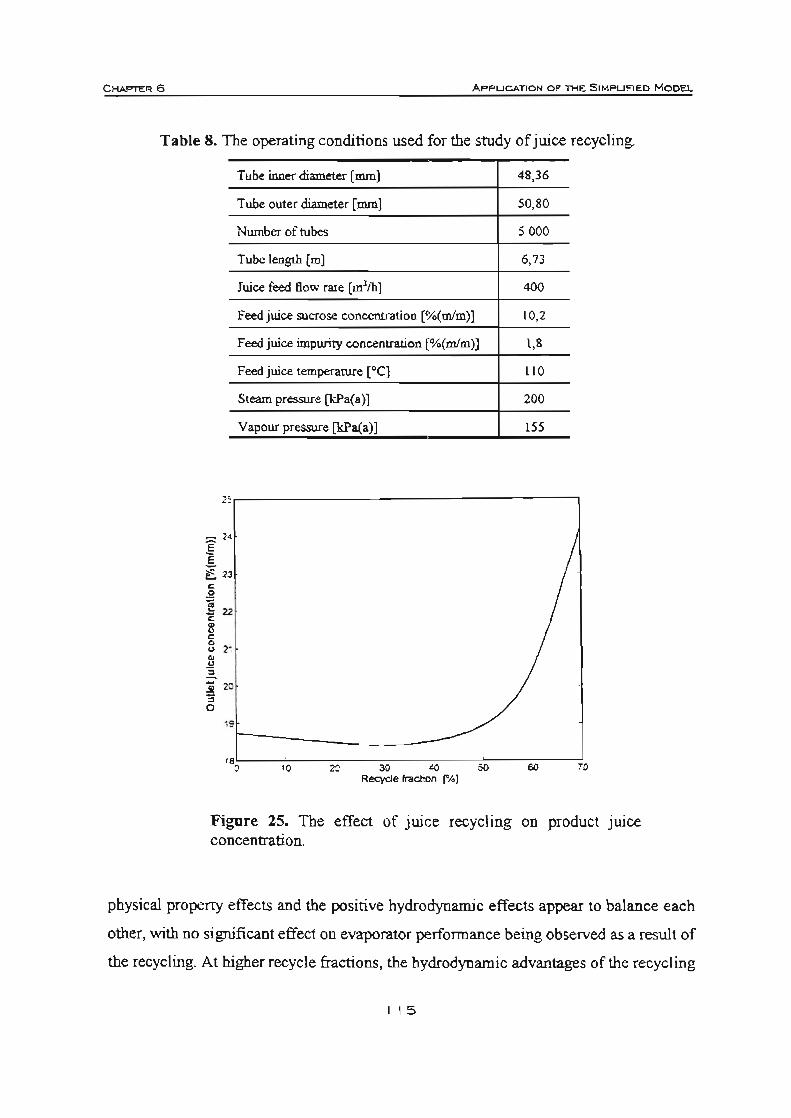
CHAPTERS A ...... UCATlON OF THE SIMPUf"I EO MOOE.l..
Table 8. The operating conditions used for the study of juice recycling.
Tube inner diameter [mm] 48,36
Tube outer diameter [mm] 50,80
Number of tubes 5000
Tube length (m] 6,73
Juice feed flow rate [m1/h] 400
Feed juice sucrose concentration [o/o(m/m)] 10,2
Feed juice impurity concentration [%(mlm)] 1,8
Feed juice temperature [0C] 110
Steam pressure [kPa(a)] 200
Vapour pressure [kPa(a)] 155
"r----------- - ---,
Figure 25. The effect of juice recycling on product JUIce concentration.
physical property effects and the positive hydrodynamic effects appear to balance each
other, with no significant effect OD evaporator perfonnance being observed as a result of
the recycling. At higher recycle fractions, the hydrodynamic advantages of the recycling
115
CHAPTER 6 APPUCATlON OF n.tE SIMPUFlED MODEL-
start to influence the evaporator perfonnance, improving the product juice concentration
substantially. It should be noted, however, that the recycle fractions required to achieve
this performance enhancement are high (of the order of 60 to 70% of the product liquid),
and some experimental work should be carried out to confirm this result.
The results of this study confirm the conventional wisdom of the sugar industry. in that
recycling in climbing film evaporators should be camed out for process stability and
fouling control reasons, not for heat transfer performance enhancement. It is clear that
recycle fractions of less than 50% will have no significant effect on evaporator
performance (excluding considerations of tube dry-out under some conditions). At higher
recycle fractions, some performance benefits may be obtained, but at the expense of
recycling large quantities ofliquid. It should be noted, though, that no significant increase
in residence time will result from the increased recycle of liquid, as the liquid inventory
of the evaporator vessel is approximately constant.
6.3 TUBE CONFIGURATION OPTIMISATION
In the design of climbing film evaporators, it is desirable to know the required surface area
for the perfonmance of a specific heat transfer duty under a given set of operating
conditions. A problem of particular current interest to the South African sugar industry is
the effect of different tube diameters to those commonly used on evaporator performance.
The simplified climbing film evaporator model was thus used to evaluate the effects of
different tube diameters and numbers of tubes on the required surface area for the
achievement of a specific heat transfer duty. In fact, with a fixed tube diameter and
number of tubes, evaluating the required surface area for heat transfer reduces to the
problem of evaluating the required evaporator tube length, as this is the only surface area
parameter not already specified.
The operating conditions used in this study are shown in Table 9. Three different tube
116

ApPUCAnON OF Tl-IE SIMPUFIED MODEL
diameters were evaluated (namely 38,40 mm, 48,36 mm and 71 ,60 mm inner diameters),
with numbers of tubes ranging from 3000 to 8500 tubes per evaporator. A summary of the
model results is displayed in Figure 26. With a fixed volumetric juice throughput for the
vessel, as in this case, specifying the tube diameter and number of tubes uniquely fixes the
juice flow rate per tube. As the juice flow velocity through the tube al10ws for more
meaningful comparisons between tubes of varying diameters, compared to the use of
numbers of tubes, this parameter is used along the x-axis of the figure.
Table 9. Operating conditions for the study of tube diameter effeclS.
Juice flow rate for entire vessel [mJ/h]
Feed juice sucrose concentration [%(mlm)]
Feed juice impurity concentration [%(mlm)]
Required product sucrose concentration (%(mlm)]
Feed juice temperature [QC]
Steam pressure [kPa(a)]
Vapour pressure [kPa(a))
• 1.2)1;10
1.15
,. ,
o
71,60 mm ID
0.'
0.85 ~ 38,40 rTVTl 10
400
10.2
1,8
21 ,3
110
200
155
48,36 mm 10
1 1
o.~L .• ---'C=--~-":"'-7----,'c~-~_~~_JI U U , '2 'A ,. ,. Juice"<lw velocity {cmls]
Figure 26. Required evaporator surface area for a given heat transfer duty as a fimction of tube size and number of tubes.
117

CHAPTERS APPUCATlON 01'" ll'iE SIMPU I'"IEO MODEL
Detailed results are shown in Table 10, where the average Hfe is the overall average beat
transfer coefficient for the evaporator. When interpreting the results of this study, it must
be noted that the product concentration remains fixed in each case, with the tube length
being varied to obtain this desired product concentration. This makes comparison of the
results quite difficult.
Table 10. Detailed results of the model simulations.
Input Data Model Resuhs
lnnertube Outer tube Juice flow Required Average Number of Tube length
diameter diameter velocity surface .,.. HTC tubes [m]
[mm] [mm] [em/s] [m'l [kW/ml.0C]
5500 1,74 10 762 1,33 16,2
7000 1,37 9 322 1,54 11,0
7500 1,28 9 048 1,59 10,0
38,40 42,40 7750 1,24 8928 1,61 9,6
8000 1,20 881 9 1,63 9,1
8250 1, 16 8719 1,64 8,8
8500 1,13 8627 1,66 8,4
4000 1,51 11 713 1,21 19,3
5500 1, 10 8767 1,64 10,5 48,36 50.80
6 000 I,Ol 8 444 1,70 9,3
6500 0,93 8188 1,75 8,3
3000 0,92 II 753 1,22 17,4
4000 0,69 10 012 1,43 11 > 1
71 ,60 76, 10 4500 0,61 9557 1,50 9.4
5000 0,55 9 220 1.56 8.2
6 000 0.46 8746 1.64 6,5
From Figure 26, it can be seen that the required surface area for the performance of a given
heat transfer duty is fairly sensitive to the juice flow velocity. The results in the figure
I I B
CHAPTERS AppuCAnON Of' THE SIMF'Uf'IEO MOOEL.
imply that, in the design of climbing film evaporators, it is not only the overall surface
area required which is of importance, but also the actual dimensions of the evaIXlrator. If
is better. in tenns of minimisation of the installed heat transfer surface area, to utilise
many shorter tubes (of 6 to 9 metres in length) in a climbing film evaporator, thereby
maintaining the juice flow velocity near its optimal value, than fewer, longer tubes (of
over 9 metres in length).
While the figure shows a monotonic decrease in required surface area with decreasing
juice flow velocity, this trend cannot continue unabated, as it is obvious that a certain
minimum flow of juice is required through the tube to avoid tube dry-out and the region
of IXlor vapour-phase convective heat transfer from occurring. It is expected that an
optimal juice flow velocity will exist for each tube size. which results in a minimisation
of the surface area required for the performance of a given heat transfer duty.
The optimal juice flow velocity can be seen to decrease with increasing tube diameter.
This result is not unexpected in that the larger the tube diameter (and, subsequently, the
larger the quantity of liquid within the tube not in close proximity to the tube wall), the
longer the residence time required by the juice within the tube for effective evaporation.
However. it would appear that tube diameter does not play a major role in the performance
of properly designed climbing film evaporators, as the lowest surface area values
predicted for each of the three tube diameters appear to be similar.
Most climbing film evaporators in the South African sugar industry use 48,36 mm inner
diameter tubes and operate at juice flow velocities of approximately 1 cm/so Figure 26
justifies this choice of conditions.
6.4 CONCLUSIONS
A simplified model of a climbing film evaporator was developed, based on linearisation
119

CHAPTERS A,pPUCATION 0" THE SIMPU"IED MOOEL
of the system of ordinary differential equations making up the original evaporator model.
The simplified model was found to be an acceptable approximation of the complex
evaporator model under all process conditions tested, and the model was applied to the
study of three practical applications in the sugar industry.
10 the first application, the model was used to study the effect of feed juice flow rate on
evaporator performance. The results obtained were found to corroborate the general trends
observed experimentally. although showing quite large discrepancies when compared to
the actual numerical results of the experiments. More work. both experimental and
theoretical, would be required to evaluate the causes of these discrepancies.
In the second application. the effect of product juice recycling on evaporator performance
was evaluated. At recycle fractions of 50% or less, recycling was found to have DO
significant effect. At higher recycle fractions, a performance benefit was observed, but
practical considerations may make the use of such high recycle fractions undesirable.
10 the third application, the simplified evaporator model was used to study the effects of
tube diameter and numbers of tubes on evaporator performance. The surface area required
for the achievement of a specific heat transfer duty was evaluated at three different tube
diameters, with varying numbers of tubes. It was found to be betterto use many, relatively
short tubes than fewer, longer tubes in the design of climbing film evaporators. The results
were found to confirm the conventional wisdom of the South African sugar industry with
regard to evaporator tube configuration.
120
Chapter 7
Conclusions
Climbing film evaporators are widely used in the South African sugar industry. However.
it is generally considered that the performance of these vessels is not optimal and that
improvements could be achieved by proper optimisation of the operating parameters.
Owing to the complexity of the heat transfer and hydrodynamic interactions in the
evaporator tubes, attempts at performance improvement have been hampered by the lack
of any theory to explain fully the effects of the operating conditions and physical
properties of the feed liquor on the performance of the evaporator. A study was thus
carried out to produce a mathematical model of the climbing film evaporator system,
which could be used to assess the effects of changing operating conditions on evaporator
performance, based on as solid a theoretical base as currently possible.
To describe fully the climbing film evaporator system, it is necessary to obtain information
about the pressure, component flow rate and temperature distributions along the length of
ODC of the tubes within the apparatus under steady state conditions. For this purpose, a
system of six ordinary differential equations was developed from first principles, making
use of mass, enthalpy and momentum ba1ances carried out over one tube of the vessel. Of
these six ordinary differentia1 equations, four can be solved analytically. leaving two
equations requiring numerical solution.
Numerical solution of ordinary differential equations is fairly routine, provided that all the
required boundary conditions for solution are known at one of the boundaries of
integration. However, the system under consideration here has known boundary conditions
distributed at both boundaries of integration (both ends of the evaporator tube), thus
requiting more sophisticated solution techniques. For this study, a shooting method based
on the Newton-Raphson technique was used to solve the two-point boundary value
121
CM~R7 CONCLUSION!5
problem, using a fourth order Runge-Kutta method with an automatically adjusted step
size to perform the numerical integration of the system of two ordinary differential
equations describing the climbing film evaporator.
The climbing film evaporator model was used to develop an evaporator simulation
program in the MATLAB programming language. Given a set of inputs describing the
physical parameters of an evaporator and its operating conditions, the simulation program
produces profiles of various heat transfer and hydrodynamic quantities as they vary along
the length of the evaporator tube.
From 1994 to 1997, a pilot plant climbing film evaporator installed at the Felixton sugar
mill was used to investigate the effects of both mechanical and operational parameters on
evaporator performance (Walthew and Whitelaw, 1996). Tbe raw data from some of these
experimental tests were collected and used for validation oftbe climbing film evaporator
model , following the use of a statistical data reconciliation algorithm. Preliminary model
verification showed that the model consistently w1der-predicted the heat transfer actually
occurring in the pilot evaporator. Analysis of the heat transfer components of the
evaporator model showed that the most probable cause of the erroneous results was the
nucleate boiling heat transfer portion of the Chen correlation for flow boiling in vertical
tubes. It was felt that the modified Forster-Zuber pool boiling equation was inaccurate.
An attempt was made to replace this outdated, inaccurate correlation with a modem
equation of greater accuracy. However, it was fOWId that none of the available correlations
could be applied to the conditions normally encountered in the South African sugar
industry, due to the extremely low juice flow rates typically used. Following further
investigation. it was decided to utilise the Forster-Zuber coefficient. kFZ• being the most
uncertain parameter in the evaporator model, as the parameter to be optimised in order to
improve the accuracy of the model predictions. A least-squares optimisation algorithm was
used for this purpose, identifying a new value for kFZ to give a better fit to the experimental
data, based on minimisation of an appropriately defined performance index.
122

CHAPTER 7 CONCI..USION$
In the model identification procedure, it was found that the calculated optimal values of
kfZ were several times higher then Chen' s original value of 0,00122, ranging from 0,003
to 0,009. Identification of the new values for this coefficient led to a great improvement
in model performance, yielding 5% relative error between the model predictions and the
experimental measurements.
The original system of ordinary differential equations describing the steady state operation
of a climbing film evaporator was strongly coupled and nonlinear. Moreover, this
nonlinearity was strengthened by the fact that the mechanism of heat transfer within the
tube changes dramatically when moving through the various zones within the tube, such
as the non-boiting zone, the subcooled nucleate boiling zone and the saturated nucleate
boiling zone. As a result, obtaining an ana1ytical solution to the system of equations was
impossible and numerical integration techniques had lO be used, requiring extensive
computational time. This limited the use of the model for practical application.
A simplified model of the climbing film evaporator system was thus developed, based on
linearisation of the original system of ordinary differential equations, which could then be
analytically integrated It was decided to emphasise the discontinuous nature of the heat
transfer and hydrodynamic changes occurring along the length of the tube by using
piecewise linear representations for the ordinary differential equations. with individual
function segments being valid in each of the three heat transfer zones within the tube.
The simplified climbing film evaporator model was verified by comparing the results of
several simulations under different operating conditions against the results obtained using
the complex model simulation program under the same conditions. While minor
differences in the results were observed. it was found that the simplified evaporator model
was a reasonably good representation of the more exact, complex model.
The simplified evaporator model was used to develop an evaporator simulation program
in the MA TLAB programming language. This simulation program was applied to the study
123

C HAPTER 7 CONCLUSIONS
of three important applications in the sugar industry, namely the effect of feed juice flow
rate on evaporator perfonnance, the effect of concentrated juice recycling on evaporator
performance and the optimisation of the tube configuration in an evaporator to yield the
minimum swface area required for the performance of a given heat transfer duty. It was
found tbat the results obtained in these applications corroborated the general trends
observed expetiroentally, reproducing the observed experimental data qualitatively.
However, quite large quantitative discrepancies were found when compared to the results
of the experiments. More modelling and experimental work would need to be carried out
to determine the reasons for these discrepancies.
124

s"."",
a
a"
to a, .. A
A
A,
to All
A,.
A...
A..
b
b,
to a,
b.
B
Chapter 8
Nomenclature
Explanation
Constant exponent in the evaporator model ofCoulson and Mehta, 1953;
Constant in the correlation ofStarzak and Peacock, 1997;
Constant in the sugar cane juice density correlation ofKadJec er al. , 1983
Constants in the sugar cane juice density correlation ofKadJec et al .• 1983
Coefficients in the linear regression afthe complex functions F and G, where
j -= 1,2 andk= 1,2
Surface area for heat transfer,
Constant in the evaporator model of Bourgois and Le Maguer, 1983b;
Cross--sectional area for flow within the evaporator tube;
Parameter in the Churchill correlation for single phase pressure drop
Matrix of a;, coefficients in linear regression analysis
Constants in the physical properties correlations of Aggarwa~ 1989 for pure
water
Cross-sectional area for flow within the evaporntor tube
Cross-sectional area for liquid phase flow within the evaporator tube
Cross-sectional area for vapour phase flow within the evaporator tube
Constant exponent in the evaporator model ofCoulson and Mehta, 1953;
Constant in the correlation of Starzak and Peacock, 1997;
Constant in the sugar cane juice density correlation ofKadJec et a/. , 1983
Constants in the sugar cane juice density correlation ofKadJec et al. , 1983
Coefficients in the linear regression of the complex functions F and G, where
j - I ,2andk - O, I ,2
Constant in the evaporator model ofBourgois and Le Maguer, 1983b;
Parameter in the Churchill correlation for single phase pressure drop;
Constant in the correlation of Starzak and Peacock, 1997
125
Units
m'
rn'
m'
m'
m'

CHAPITR 8 NOMENCLATURE
B Matrix ofbij coefficients in linear regression analysis
BPE Boiling point elevation of the boiling fluid within the tube ' C
Bx Dissolved solids content (sucrose and impurities) of sugar cane juice %(mlm)
c Constant exponent in the evaporator model of Coulson and Mehta, 1953;
Constant descnoing the saturation curve of water in the evaporator model of
Bourgois and Le Maguer, 1983a;
Constant in the sugar cane juice density correlation ofKadlec et aI. , 1983
Co Constants in the sugar cane juice density correlation ofKadlec et a!. , 1983
to"
C Constant in the evaporator model ofBourgois and Le Maguer, 1983b;
Constant in the correlation of Starzak and Peacock. 1997
C, Parameter in the slip ratio correlation ofPremoli et a/. , 1970
C, Parameter in the slip ratio correlation ofPremoli el a/. , 1970
C, Parameter in the slip ratio correlation ofPremoli et aJ. , 1970
C~ Nucleate boiling coefficient in the correlation ofRohsenow, 1952
C, Specific heat capacity of water in the model of CJUpta and Holland, 1966a BTUnb."F
C" Specific heat capacity of the liquid phase within the evaporator tube kJlkg.oC
C" Specific heat capacity of the liquid phase within the evaporator tube kJlkg.oC
C. Specific heat capacity of the liquid at the evaporator inlet conditions kJ/kg.oC
C .. Specific heat capacity for clifferential element k within the evaporator tube kJlkg.oC
C ... Specific heat capacity of the liquid phase within the evaporator tube kJ/kg.oC
C.,. Average specific heat capacity of the liquid phase within the non-boiling zone kJlkg.oC
C .. Specific heat capacity of the vapour phase within the evaporator tube kJ/kg.oC
C~ Specific heat capacity of pure water kJ/kg.oC
C, Constant in the evaporator model ofPilet and loom, 1954
d Constant exponent in the evaporator model ofCoulson and Mehta, 1953; Inner
tube diameter in the evaporator model of Coulson and McNelly, 1956; ft
Constant in the sugar cane juice density correlation ofKadlec et aI. , 1983
d, Constants in the sugar cane juice density correlation ofKadlec et al. , 1983
to d)
D Inner tube diameter ID
126
CHAPTER 6 NOMENCLATURE
D, Outer tube diameter m
D, Inner tube diameter m
D. Inner tube diameter m
Do Outer tube diameter m
e Constant exponent in the evaporator model of Coulson and Mehta, 1953
E Parameter in the two phase pressure drop prediction method ofFriedel, 1979
E,q Identity matrix of size 2x2
r, Fanning friction factor for the liquid phase within the tube
t; Fanning friction factor for the vapour phase within the tube
F Frictional force in the opposite direction to fluid flow within the tube; N
Empirical convective heat transfer enhancement factor in the correlation by
Chen, 1966;
Parameter in the two phase pressure drop prediction method ofFriede~ 1979;
Complex function representing the right hand side of the ordinary differential
equation describing the overall enthalpy balance in the tube
F, Mass flow rate of cold juice to the preheater kg/,
F, Sub~functions descnbing the nonlinear function F over the three heat transfer
to F, zones within the evaporator tube
F" Value of the complex F function at Z12
F2,12 Value of the sub-function Fl at Zn
'" Fl,12 Value of the sub-function F2 at zl2 as calculated using the linear model
Fi,/ j'd> value of the Fi sub-function calculated from the complex evaporator model
F ilii Linearised approximations of the F; sub-functions, where i = 1 .. .3
F,. Two phase Froude number
g Acceleration due to gravity mI,' G Complex function representing the right hand side of the ordinary differential
equation describing the momentum balance within the evaporator tube
G, Sub-functions describing the nonlinear function G over the three heat transfer
to G} zones within the evaporator tube
G" Value ofthe complex G function at Z12
G2,12 Value of the sub-function G2 at Zu
127
CHAPn;R e NOMENCLATURE
G2,l:1.oI Value of the sub-function G: at Z12 as calculated using the linear model
G~j' jlll value of the G; sub-function calculated from the complex evaporator model
G;Un Linearised approximations of the G; sub-functions, where i = 1 . . 3
h" Local heat transfer coefficient at the outer tube wall W/m2.OC
h_ Average hailing heat tnmsfer coefficient Within the evaporator tube B1111h.sq ft. oF
h, Film heat transfer coefficient for the boiling liquid within the evaporator tube BTUIh.sq ft .oF
h"L Specific enthalpy of condensate at position y in the condensate film l/kg
h" , Specific enthalpy of the condensing steam l /kg
... Latent heat of vapourisation of the fluid within the evaporator tube kJ/kg
h" Local heat transfer coefficient within the tube W/m2.OC
he Specific enthalpy of the boiling juice kJ/kg
he, Specific enthalpy of the hot juice exiting the preheater IIkg
h.., Specific enthalpy of the flashed juice at the bottom of the evaporator tubes l/kg
h" Specific enthalpy of the flash vapour at the bottom of the evaporator tubes J/kg
h,. Specific enthalpy of saturated water kJ/kg
H Total enthalpy ofliquid and vapour within the evaporator tube; J
Parameter in the two phase pressure drop prediction method of Fried el, 1979
ff Arbitrary value of the total enthalpy, H I
Ho Value of the overall juice and vapour enthalpy at the bottom of the tube I
H' Local enthalpy at position z in the non-boiling zone I
H' Local enthalpy at position z in the subcooled nucleate boiling zone I
H' Local enthalpy at position z in the saturated nucleate boiling zone I
n 12 Value of the overall juice and vapour enthalpy at Zl2 J
H" Value oftbe overall juice and vapour enthalpy at Zz3 J
Ho Condensation and subcooling enthalpy flow rate for the condensate film W /m
HoL Enthalpy flow rate of condensate on the outer tube walt per unit perimeter W /m
I Penormance index in the linear regression of the complex functions F and G .,
Dimensionless volumetric vapour flux Within the evaporator tube J
i, Vorumetric liquid flux within the evaporator tube mls
J, Volumetric vapour flux within the evaporator tube mls
128
CHAPTER 8 NOMENClATURE
jl" Dimensionless volumetric liquid flu,," within the evaporator tube
jl" Dimensionless volumetric vapour flux within the evaporator tube
Ja Jakob number for the boiling fluid within the evaporator tube
kn Constant in the heat transfer correlation ofForster and Zuber, 1955
k. Thermal conductivity ofthe liquid at the evaporator inlet conditions W /m .oC
k, Thermal conductivity of the liquid phase within the evaporator tube W/m .oC
K,. Thermal conductivity of the liquid phase in the tube at the temperature of the W/m.oC
inner tube wall
k. Thermal conductivity of the tube wall material W/m.oC
K Constant in the evaporator model ofCoulson and Mehta, 1953
K' Constant in the evaporator model of Coulson and Mehta, 1953
L Length of the evaporator tube; m
Mass flow rate of vapour within the evaporator tube kg/,
I., Mass flow rate of vapour entering the bottom of the evaporator tube kg/,
L, Physical property parameter in the correlation ofKlimenko, 1988
m Constant exponent in the correlation ofRohsenow, 1952
rn ' Mass flux of fluid, at position Z, flowing through the tube kglm2 .s
rn.' Mass flux of condensation kglm2.s
M Mass flow rate of feed to the evaporator Ib/h
n Constant exponent describing the saturation OJrve of water in the evaporator
model of Bourgois and Le Maguer, 1983a
N Parameter in the sugar cane juice viscosity correlation of Genotelle, 1978
N, Number of CH.. j);} points making up the F function
No Number of 0\ j).) points making up the G function
Nu Nusselt number for the boiling fluid within the evaporator tube
Nu, Nusselt number for the liquid phase within the tube
Nu, Local Nusselt number at position z within the evaporator tube
p Local pressure within the evaporator tube Pa
p Modified pressure term in the climbing film evaporator model Pa
p Arbitrary value of the modified pressure term Pa
p" Value of the modified pressure term at 2\2 Pa
129

CHAPTER 6 NOMENC~T\JRf:
-p~ Value of the modified pressure term at ~ Pa
p, Modified pressure term at the bottom of the evaporator tube P.
p' Local modified pressure term at position z in the non-boiling zone P.
p' Loca1 modified pressure term at position z in the subcooled nucleate boiling P.
zone
P' Loca1 modified pressure term at position z in the saturated nucleate boiling P.
zone
p .. Vapour space pressure at the top of the evaporator tubes P.
P Operating vapour pressure of the climbing film evaporator in the model of lbslsq ft (abs)
Coulson and McNelly, 1956;
Local pressure at distance z along the evaporator tube P.
P, Loca1 pressure within differentia1 element k of the evaporator tube Pa
p. Pressure of the condensing steam P.
p. Vacuum pressure at the top of the evaporator tube Pa
P~ Peclet number fOT the evaporator feed, ca1culated at the inlet conditions
P.- Prandtl number for the boiling two phase mixture within the evaporator tube
P.-, Prandtl number for the liquid phase within the evaporator tube
CJ...o... Heat flux through the tube wall as a result of condensation heat transfer W/m2
q.,.... Heat flux transmitted through the tube wall by conduction W/ml
q.." Heat flux from the tube wall into the boiling fluid , primarily by convection W /m2
qorilll> Critical heat flux for the initiation of nucleate boiling W/m1
Q Heat flux:; W/ml
Constant in the correlation ofStarzak and Peacock, 1997 J/mo!
Q, Total heat flux transferred by the evaporator W/m2
• Mass fraction impurities in the liquid phase within the evaporator tube
" Mass fraction impurities in the juice entering the bottom of the tubes
" Mass fraction impurities in the juice fed to the preheater
R Universal gas constant, R = 8314,5 J/kmol .K J/kmol .K
R, Inner tube wall fouling resistance m2.oCIW
R,. Outer tube wall fouling resistance m1.oCIW
Re Reynolds Dumber for the boiling two phase mixture in the evaporator tube
130

CHAPTER e NOMENCLATURE
Re,. Modified Reynolds number in the correlation ofKJimenko, 1988
Re,. Reynolds number for the liquid phase within the evaporator tube
Re" Two phase Reynolds number
Re" Reynolds number for the vapoUT phase within the evaporator tube
, Mass fraction sucrose in the liquid phase within the evaporator tube
.. Mass fraction sucrose in the juice entering the bottom of the tubes
.. Mass fraction sucrose in the juice fed to the preheater
S Slip ratio within the evaporator tube;
Empirical nucleate boiling suppression factor in the correlation of Ch en,. 1966
" Temperature of condensate K
t" Temperature of water vapoUT K
t,. Temperature of condensate K
T Temperature "C
r Dirnensionless temperature tenn in the evaporator model ofBourgois and Le
Maguer, 1983a;
Critica1 wall temperature for nucleation °C
T, Boiling point temperature of water °C
T, Boiling point of water OF
To, LocaJ boiling point temperature of the liquid within the evaporator tube °C
'Po, Boiling point temperature of the liquid at the vapour pressure prevailing at the °C top of the evaporator tube
T, Temperarure of condensate °C
T, Temperature of the fluid exiting the evaporator °C
T; Feed inJet temperature °C
T, Temperature in differential element k of the evaporator robe °C
T, Temperature of the liquid phase within the evaporator tube °C
r , Critical bulk juice temperature at which nucleation begins °C
Tu T emperarure of the hot juice entering the bottom of the evaporator °C
T' • Local temperature of the juice at position z in the non-boiling zone °C
T' , Local temperature oftbe juice at position z in the subcooled nucleate boiling °C zone
131
C I'i.A.PTER 8 NOMENCLATURE
T' , Local temperature of the juice at position z in the saturated nucleate boiling ·C
zone
T. Temperature of the condensing steam ·C
T, Temperature of the vapour phase within the evaporator tube ·C
T~ Temperature of the vapour exiting the top of the evaporator tube ·C
T., Outer tube wa1l temperature ·C
T., Irmer tube wall temperarure ·C
T, The difference betWeen the heating surface temperarure and the boiling fluid OC
saturation temperarure
u Velocity of the condensate:film flowing down the outer tube wall; mI,
Average velocity of the fluid flowing through the tube, at position z mI,
U. Logarithmic mean liquid-vapour velocity in the evaporator tube, as defined by ftI,
Piret and Isbin, 1954
u, Mean velocity of the liquid phase within the tube: mI,
U, Slip ratio
'" Mean velocity of the vapour phase within the tube mI,
U Overall boiling heat transfer coefficient for the evaporator W/m2.oC
U, Overall heat transfer coefficient for differential element k of the tube W/m~.oC
U, Local boiling heat transfer coefficient at position z within the evaporator tube W /m2.oC
varj Variance of experimental variable j
V Mass flow rate of vapour within the evaporator tube kg/,
V, Mass flow rate of vapour entering the bottom ofthc evaporator tube kg/,
V, Liquid phase velocity within the evaporator rube mI,
V, Vapour phase velocity within the evaporator tube mI,
V, Vapour phase flow rate exiting the evaporator tube kg/,
V, Ratio of volumetric vapour flow rate to volumetric liquid flow rate in the tube
W Mass flow rate offeed to the evaporator kg/,
W, Mass flow rate of liquid within the evaporator tube kg/,
W, Mass flow rate of vapour within the evaporator tube kg/,
W. Mass flow rate of vapour exiting the evaporator tube kg/,
W, Mass flow rate of feed to the evaporator Ibslb
13 2

CHAPTER e NOMENCLATURE
We,. Weber number calculated assuming all the flow within the tube to be in the
liquid phase
We" Two phase Weber number
x Mass fraction vapour within the evaporator tube
"; Optimised value of experimental variable j
X, Mass fraction vapour in differential step k within the evaporator tube
"- Mass fraction sucrose in the liquid phase within the evaporator tube
x., Mass fraction vapour within the evaporator tube
X. Martinelli factor
y Position within the condensate film on the outer tube wa1~ as measured in the rn
direction perpendicular to the axis of the tube
z Position along the length ofthe tube, measured from the bottom m
z" Position along the tube of the transition between the non-boiling and m
subcooled nucleate boiling heat transfer zones
z" Position along the tube of the transition between the suboooled nucleate m
boiling and saturated nucleate boiling heat transfer zones
Z Total length of the evaporator tube m
z· Dimensionless distance along the evaporator tube, as defined by BoUTgois and
Le Maguer, 1983a
z· • Dimensionless position within the tube at which boiling starts
a Volumetric mass fraction vapour within the evaporator tube
Heat transfer coefficient within the evaporator tube W/ml.oC
a , Film boiling heat transfer coefficient within the evaporator tube W/m2.oC
"'- Single phase liquid convective heat transfer coefficient in the tube W/m2."'C
... Nucleate boiling heat transfer coefficient within the evaporator tube W/ml.oC
6(z) Thickness of the condensate film on the outer tube wall at position z m
AA, Differential surface area element corresponding to the differential element k of rn'
the evaporator tube
All, Change in enthalpy across integration step k )
Ap Difference in vapour pressures for the boiling fluid. corresponding to the Pa
temperature difference between the inner tube wall and the boiling fluid
133

CHAPT'ER e NOM~tATURE
<1<), Heat flux for the differential element k along the evaporator tube W/m1
<1t Temperature difference across the boiling film of liquid against the tube wall ·C
<1T Temperature difference between the condensing steam and the boiling fluid 'C
<1T, Temperatu~ difference for differential element k of the evaporator tube ·C
<1" Differential tube length element corresponding to the differential element k of m
the evaporator tube
e Absolute roughness of the tube surface m
e" Volumetric void fraction of vapour within the evaporator tube
r Mass flow rate of condensate per unit length of tube perimeter kg/m.s
r. Mass flow rate of condensate per unit length of tube perimeter at the top of the kg/m.s
evaporator tubes
A Latent heat ofvapourisation of the fluid within the evaporator tube kl/kg
A, Latent heat of condensation of the condensing steam kl/kg
'I' Empirical term in the evaporator model of Gupta and Holland, 1996 ..
determined graphically asa function of!l T;
Parameter in the saturation pressure correlation ofWagner, 1973 for water
4>'. Two phase pressure drop enhancement factor
<I> Klimenko parameter for fully developed film boiling
P Density of the two phase mixture within the evaporator tube kgfm'
Density of the condensate film on the outer tube wall kg/m)
p, Density of the liquid phase within the evaporator tube kglm)
p, Density of the vapour phase within the evaporator tube kg/ml
PL Density of the liquid phase within the evaporator tube kg/m)
p. Average density of the fluid flowing within the tube, at position z kg/ml
p. Two phase density oftbe fluid within the evaporator tube kg/m]
p. Density of the vapour phase within the evaporator tube kg/m'
° Surface tension of the fl uid within the evaporator tube N/m
o. Surface tension of water at its nonnal boiling point N/m
~, Viscosity of the liquid phase within the evaporator tube Pa.s
~ .. Viscosity of the liquid phase in the tube at the uUler tube wall temperature Pa.s
~ Viscosity of the vapour phase within the evaporator tube Pa.s
134
CHAPTER e NOMENCI..ATURE
". Viscosity of water Pa.s
v Specific volume of the fluid at position z within the evaporator tube mJlkg
v, Specific volume of saturated water dml/kg
X Experimentally measured value of variable j
135

Chapter 9
References
Aggarwal, M.C. (1989), " Computerized formulation for the thermodynamic properties of
saturated water based on the lAPS formulation 1984", Heat Transfer Division of the
American Society of Mechanical Engineers, 116 (Convective heat transfer and
transport processes), 21 -26.
Bourgois, J. & Le Magner, M. (19830), "Modelling of heat transfer in a climbing-film
evaporator: Part f'. Journal ofF oDd Engineering, 2, 63-75.
Bourgois, J. & Le Magner, M. (1983b), "Modelling of heat transfer in a climbing-film
evaporator: Part IT", Journal of Food Engineering, 2, 225-237.
Bourgois, J. & Le Magner, M. (1984), "Modelling of heat transfer in a climbing-film
evaporator: Part ill. Application to an industrial evaporator", Journal of Food
Engineering, 3, 39-50.
Bourgois, J. & Le Magner, M. (1987), "Heat-transfer correlation for upward liquid film
heat transfer with phase change: Application in the optimization and design of
evaporators", Journal a/Food Engineering, 6, 291-300.
Chen, le. (1966), "Correlation for boiling heat transfer to saturated liquids in convective
flow". Industrial and Engineering Chemislry Process DeSign and Development, S,
322-329.
Churchill, S. W. (1977), Chemical Engineering, 84, 7 November, 91-92.
136
CI-tAPTER 9 REFERENCES
Collier, lG. (1980), Convective Boiling and Condensation, Second Edition, London :
McGraw-HiII.
Cooper, M.G. (1989), "Flow boiling - the 'apparently nucleate' regime", International
Journal of Heat and Mass Transfer, 32, 459-464.
Coulson, lM. & McNelly, MJ. (1956), "Heat transfer in a climbing film evaporator. Part
n.", Transactions of the Institution of Chemical Engineers, 34, 247-257.
Coulson, J.M. & Mehta, R.R. (1953), "Heat transfer coefficients in a climbing film
evaporator", Transactions of the Institution of Chemical Engineers, 31 , 208-228.
Davis, ME. (1984), Numen cal methods and rnodellingforchernical engineers. New York:
Wiley House Publishers, 258 pp.
Dhir, V.K. (1991), "Nucleate and transition boiling heat transfer under pool and external
flow conditions",International Journal of Heat and Fluid Flow, 12, 290-314.
Engineering Sciences Data Unit (1967), "Forced convection heat transfer in circular tubes.
Pan 1: Correlations for fully developed turbulent flow - their scope and limitations".
Engineering Sciences Data, Item 67016.
Engineering Sciences Data Unit (1968), "Forced convection heat transfer in circular tubes.
Part 2: Data for laminar and transitional flows including free-convection effects",
Engineering Sciences Data, Item 68006.
Foster, H.K. & Zuber, N. ( 1955), "Dynamics of vapour bubbles and boiling heat transfer",
American Institution of Chemical Engineers Journal, I, 531-535.
137

CHAPTER 9 REFERENCES
Friedel, L. (1979), "Improved friction pressure drop correlation for horizontal and vertical
two-phase pipe flow", Paper 2 - European Two-Phase Group Meeting, Ispra, Italy.
Genotelle, J. (1978), "Expressing the viscosity of sugar solutions", IndUSTries Alimentaires
et Agricoles, 95, 747-755.
Gorenflo, D. (1994), "Behaltersieden" in VDl Warmeatlas, Section Ha, Seventh edition,
Berlin: VDI-Verlag.
Gundrnundson, C. & 0lauson, L. (1971), "Harmful Pulsation Phenomena in a Climbing
Film Evaporator With Superheated Feed", Svensk Papperstidning, 74(7-15),
197-200.
Gungor, K.E. & Winterton, R.H.S. (1986), "A general correlation for flow boiling in tubes
and annuli", International Journal of Heat and Mass Transfer, 29, 351 -358.
Gupra, A.S. & Holland, FA (1966a), "Heat Transfer Studies in a Climbing Filin
Evaporator. Part I: Heat Transfer from Condensing Steam to Boiling Water",
Canadian Journal of Chemical Engineering, 44, 77-81.
Gupra, A.S. & Holland, FA (1966b), "Heat Transfer Studies in a Climbing Film
Evaporator. Part ll: Heat Transfer Regions", Canadian Journal of Chemical
Engineering, 44, 326-329.
Hetsroni, G. led] (1982), Handbook of Multiphase Systems, New York: Hemisphere
Publishing Corporation.
Holland, FA & Bragg, R. (1995). Fluid Flow for Chemical Engineers, London: Edward
Arnold, Chapter 7.
138

Ct-tAPn:R 9 RI!:"'ERENC~
Hughmark, G.A. (1969), "Designing thennosiphon reboilers", Chemical Engineering
Progress, 65(7), 67-70.
Kadlec, P., Bretschneider, R. & Bubnik, Z. (1983), Chemical Engineering
Communications, 21, 183-190.
Kenning, D.B.R. & Cooper, M.G. (1989), "Saturated flow boiling of water in vertical
tubes", International Journal of Heat and Mass Transfer, 32, 445-458.
K1imenko, v.v. (1988), "A generalised correlation for two phase forced flow heat
transfer" ,International Journal of Heat and Mass Transfer, 31 , 541-552.
Levenberg, K. (1944), "A method for the solution of certain problems in least squares",
Quarterly of Applied Mathematics, 2, 164-168.
Linden, C.M. & Montillon, G.H. (1930), Industrial and Engineering Chemistry, 22, 708-
713 .
Lockhart, R.W. & Martinelli, R.C. (1949), "Proposed correlation of data for isothermal
two phase, two component flow in pipes", Chemical Engineering Progress, 45(1),
39-48.
Lyle, O. (1950), Technology for Sugar Refinery Workers , London: Chapman and Hall
Limited, Second Edition, p 472.
Marquardt, D.W. (1963), "An algorithm for least squares estimation of nonlinear
pararneters",Joumal SIAM, 11, 431-441.
139
CHAPTER 9 REFERENCES
Mayinger, F. & Schult, M. (1981), "Dynamic behaviour of double phase-change heat
exchangers", Heat Exchangers: Thermal-Hydraulic Fundamentals and Design,
Washington: Hemisphere Publishing Corporation, 955-979.
McNelly, M.J. (1953),Journal of the Imperial College Chemical Engineering Society, 7,
18.
Mills, A.F. (1992), Heat Transfer, Boston: lrwin, Chapter 7: "Condensation, evaporation
and boiling".
Monrad, C.C. & Badger, W.L. (1930), "The condensation of vapours", Transactions of the
American institution a/Chemical Engineers, 24, 84.
Muller-Steinhagen, H. (1995), Personal communication, Department of Chemical and
Process Engineering, University of Surrey, Guildford, Surrey, GU2 5XH, United
Kingdom.
Na, T.y. (1979), Computational methods in engineering boundary value problems, New
York: Academic Press, 309 pp.
Peacock, SD. (1995a), "Selected physical properties of sugar factory process streams",
Sugar Milling Research instilute Technical Report, 1714, 46 pp.
Peacock, S.D. (1995b), "Predicting physical properties of factory juices and syrups",
International Sugar Journal, 97(1162), 571-577.
Peacock, SD. (1995c), "Data reconciliation as applied to the first effect factorial
experiment data from the Felixton pilot plant evaporator", Sugar Milling Research
Institute Technical Note, 47195, 5 pp.
140

CHAP'TER 9 REF"ERENCES
Peacock, S.D. (1996), "The optimisation of feed juice temperature for climbing film
evaporators - A preliminary study", Sugar Milling Research Institute Technical
NOle, 49/96, 7pp.
Peacock, SD. (1998), "Tools for the study of clear juice heating and its effect on climbing
film evaporator operation", Sugar Milling Research Institute Technical Report,
1773,9 pp.
Piret, E.L. & Isbin, H.S. (1954), "Natural Circulation Evaporation: Two Phase Heat
Transfer", Chemical Engineering Progress, 50(6), 305-311.
Premo]i, A. , Francesco, D. & Prima (1970), " An empirical correlation for evaluating two
phase mixture density under adiabatic conditions", European Two-Phase Flow
Group Meeting, Milan, 8-10 June 1970.
Rein, P.W. & Love, DJ. (1995), "Experiences With Long Tube Climbing Film
Evaporators", Proceedings of the International Society of Sugar Cane
Technologists' Conference, 22, Volume 1, 251 -259.
Riedel, L. (1949), "Heat conductivity measurements in sugar solutions, fruit juices and
milk", Chem. Ing. Technik, 21 , 340-341.
Rohsenow, W.M. (1953), Heat Transfer: A Symposium, Chapter 4, Ann Arbor: University
of Michigan Press.
Rohsenow, W.M. (1983), "Needed Research in Boiling Heat Transfer", Heal Transfer in
Energy Problems, Washington : Hemisphere Publishing Corporation, 51-58.
Shah, M.M. (1982), "Chart correlation for saturated boiling heat transfer", ASHRAE
Tramactions, 88, 185-196.
141
CHAP>ER 9 REFERENCES
Smith, RA (1983), "Evaporators" in Heat exchanger design handbook, New York:
Hemisphere Publishing Corporation, pp 3.5.2-3.5.5.
Smith, RA (1986), Vaporisers: selection, design and operation, New York: Longman.
Starzak, M. & Peacock, S.D. ( 1997), " Water activity coefficient in aqueous solutions of
sucrose - A comprehensive data analysis", Zuckerinduslrie, 122(5), 380-387.
Starzak, M. & Peacock, SD. (1998), "Boiling point elevation for aqueous solutions of
sucrose - A comparison of different prediction methods", Zuckerindustrie, 123(6),
433-441.
Steiner, D. (1995), Personal communication, Universitat Karlsruhe, Postfach 6980,
KaiserstraBe 12, D-76128, Karlsruhe, Germany.
Steiner, D. & Taborek, J. (1992), "Flow boiling heat transfer in vertical tubes correlated
by an asymptotic method", Heal Transfer Engineering, 13, 43-69.
Stepban, K. (1995), Personal communication, Jnstitut filrTechnische Thermodyoamik und
Thermische Verfahrenstechnik, Universitat Stuttgart, 70550, Stuttgart, Germany.
Tang, c.L. (1980), "Two phase flow in a climbing fi lm evaporator" , Canadian Journal of
Chemical Engineering, 58, 425-430.
Turner, J.M. (1966), "Annular two-phase flow", PbDThesis, Darmouth College, Hanover,
New Hampshire, USA.
Wagner, W. (1973), Cryogenics, 13, 470.
142
CHAPTER 9 REFERENCES
Wall is, G.B. (1969), One-dimensional two-phase flow, New York: McGraw Hill Book
Company.
Waltbew, D.e. & Whitelaw, R. W. (1996), "Factors affectingtbe performance oflongtube
climbing film evaporators", Proceedings o/the South African Sugar Technologists'
Association. 70. 221-224.
Walthew, D.e. , Whitelaw, R W. & Peacock, S.D. (1995), "Preliminary results from a long
tube climbing film pilot evaporator", Proceedings of rhe Sourh African Sugar
Technologists' Association. 69, 132-137.
Watson, L.1. (1989), "Heat transfer performance in evaporators. Pan I: Theory and
mechanisms", Sugar Research Institute Technical Report. 191.
Webb, RL. & Gupte, N.S. (1992), "A critical review of correlations for convective
vaporization in tubes and tube banks", Heal Transfer Engineering, 13, 58-81.
Winterton, R.H.S. (1981), Thermal Design of Nuclear Reacrors, Oxford : Pergamon Press,
Chapter 5 : "Boiling Heat Transfer", 67-83.
Winterton, RH.S. (1995), Personal communication, School of Manufacturing and
Mechanical Engineering, Binningham University, Birmingham, BI5 2TI, United
Kingdom.
Zinemanas, D. (1983), "Simulation of heat transfer systems witb phase change", Msc
TheSis. Technion - Israellnstitute of Technology.
Zinemanas, D., Hasson, D. & Kehat, E. (1984), "Simulation of heat exchangers with
change of phase", Computers and Chemical Engineering, 8(6), 367-375.
143

Appendix A
Statistical Data Reconciliation
144
SUGAR MILLING RESEARCH INSTITUTE
Title
To
From
Date
Technical Note 47/95
DATA RECONCILIATION AS APPLIED TO THE FIRST EFFECT FACTORlAL EXPERIMENT DATA FROM THE FELIXTON PILOT PLANT EV APORA TOR
DC Walthew, SMRI GRE Lionnet, SMRI M Starzak, UND
SD Peacock
11 December 1995
1. Introduction
In order to increase the accuracy of the climbing film evaporator rnodeP. the model was calibrated against the experimental data from the Felixton pilot plant. The data used for this model optimisation were those from the first effect factorial experiment. Great difficulties were experienced in matching the model to the experimental data, as the data were found to be inconsistent - the overall mass, heat and brix balances were not satisfied. While the errors in the mass and brix balances were evenly distributed about zero, the error in the heat balance was found to be consistently positive (i .e. more steam was condensed in the ca1andria than was accounted for by the observed evaporation/heat transfer). It was thus decided to reconcile the experimental data so as to satisfy the mass, heat and brix balances - to yield data more amenable to use in calibrating the evaporator model.
2. Data Reconciliation
Data reconciliation involves the manipulation of the experimentally measured variables so as to satisfy the mass, brix and heat balances, while changing the experimental data as little as possible. For the purposes of data reconciliation, each experimentally measured variable was assigned a variance, representing the range of experimental error expected for that variable. An optimisation index was defmed as follows:
Peacock, SO; "Mathematical Modelling and Experimental Study of Climbing Film Evaporators" ; SMRJ Technical Report No. 1698; 8 November 1994.
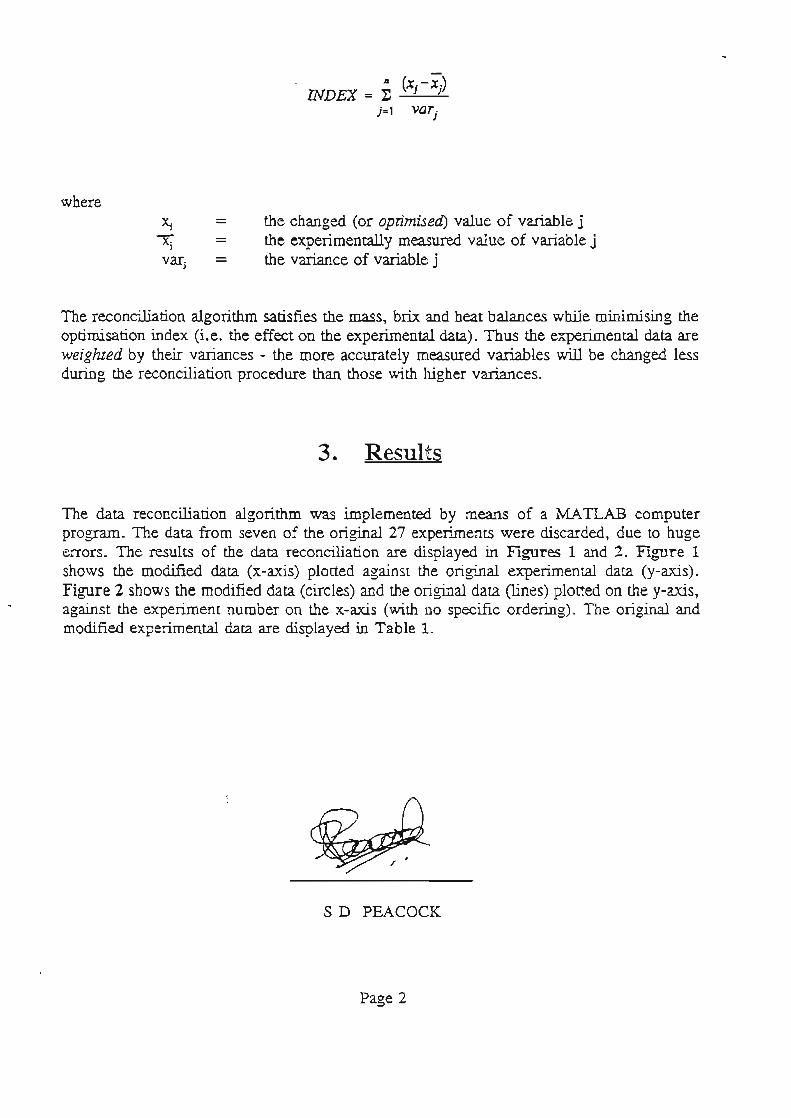
where the changed (or oprimised) value of variable j the experimentally measured value of variable j the variance of variable j
The reconciliation algorithm satisfies the mass, brix and heat balances while minimising the optimisation index (i.e. the effect on the experimental data). Thus the experimental data are weighted by their variances - the more accurately measured variables will be changed less during the reconciliation procedure than those with higher variances.
3. Results
The data reconciliation algorithm was implemented by means of a ~1A TLAB computer program. The data from seven of the original 27 experiments were discarded, due to huge errors. The results of the data reconciliation are displayed in Figures 1 and 2. Figure 1 shows the modified data (x-axis) plotted against the origi.nal experimental data (y-axis) . Figure 2 shows the modified data (circles) and the original data (lines) plotted on the y-axis, against the experiment number on the x-axis (with no specific ordering). The original and modified experimental data are displayed in Table 1.
,
S D PEACOCK
Page 2
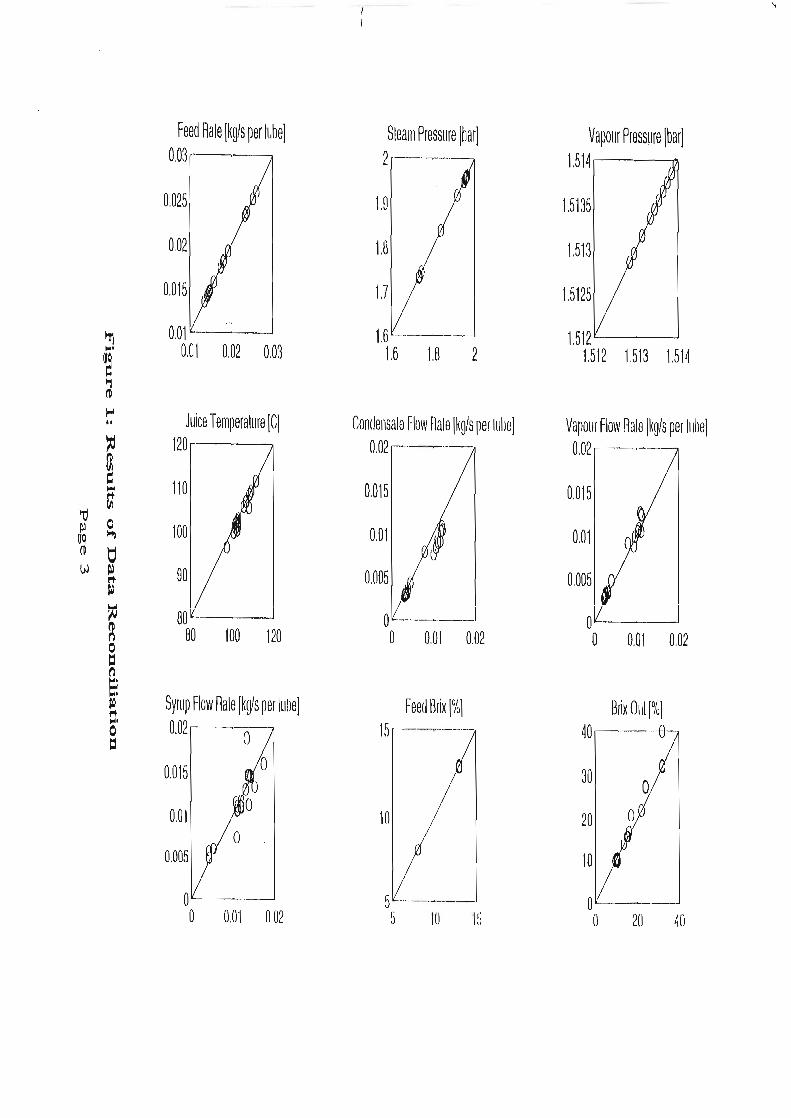
Feed Rale [Kg/s per lube] 0,03
0,025
0,02
0,015
0 , 01 ----~
0.01 0.02 0.03
Juice T emperalure [CJ 120
110
100
90
80------' 80 100 120
Syrup Flow Rale rkg/s per lube] 0.02 0
0.015 o
0.01 o
0.005
o L. ___ ----.J
o 0.01 0,02
I ,I
Sleam Pressure [bar] 2 .------,....---
1,9
1,0
1.7
1.6 --'----. 1.6 1.8 2
Condensale Flow Rale [kg/s per IlIbe] O 02 .---,_ .... -.
0.015
0.01
0,005
o ---~----o 0,01 0.02
Feed Brix [%] 15 ----.,.---... -
5 -.... __ ._ ..... _-5 10 'Ui
Vapour Pressure [bar) 1.514
1.5135
1.513
1.5125
1.512 ""----<
1.512 1.513 1.514
Vapour Flow Rale [kg/s per IlIbe] 0.02
0.015
0.01
0,005
Ol[,----l o 0.01 0,02
BrixOul[%1 40 ---6-
30 o 20 o
10
0'----1 o 20 40
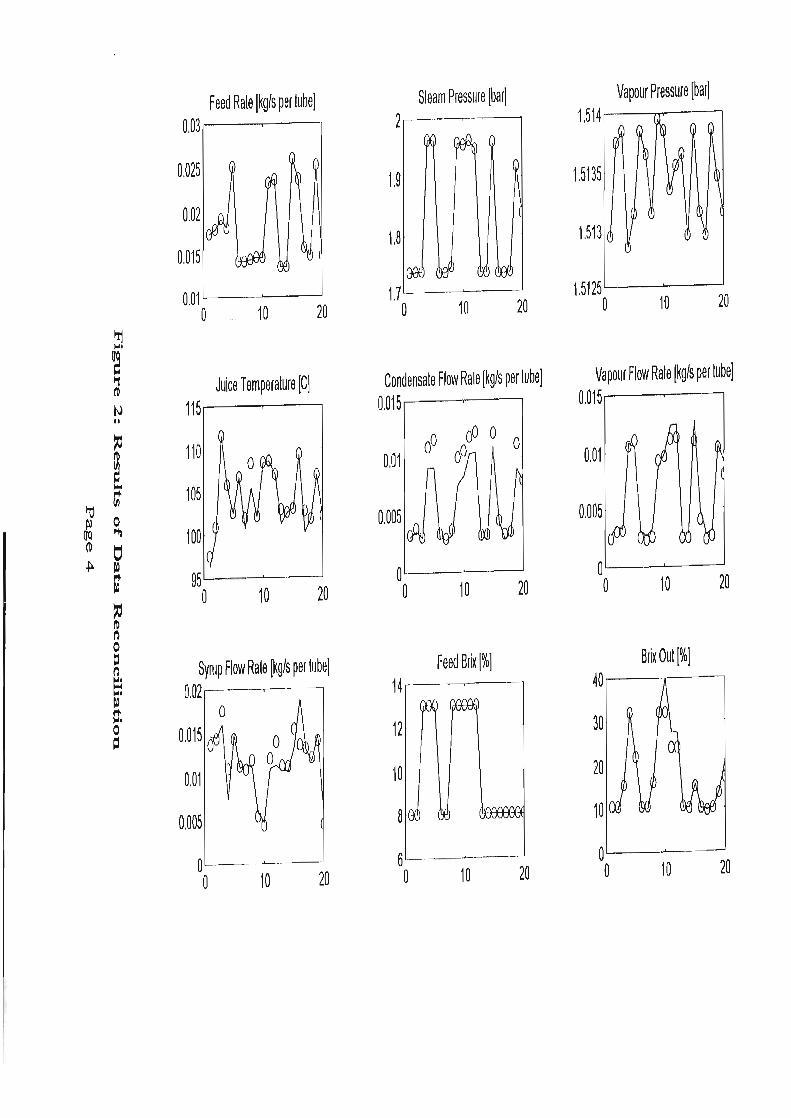
Feed Rate [~g/s per tube) 0,03.----'
0,01 -----'-----' 20 o ... 10
Juice Temperature [CJ 115---------
95 L--_I-o,----!
20 o 10
Syrup Flow Rate [kg/s per tube) 0,02 ...--------"'
0,01
0,005
0'---""----o 10 20
Steam Pressure [bar] Vapour Pressure [bar] 1 ,514 ..--~--'
1,9 1.5135
1,8 1,513
1.71--~---'
o 10 20 1,5125 '""--"----'
o 10 20
Condensate Flow Rate [kg/s per tube] Vapour Flow Rate [~g/s per tube] 0,015 0,015
o .-~------" o 10 20
Feed Brix [%] 14 ,-.-, ------.
12
10
8
6 ,----~---
o 10 20
01----1..0..-----' o 10 20
Brix Out [%] 40.-----..-----.
OL---J-----J o 10 20