mathematical modeling of covid-19 in 14.8 million
TRANSCRIPT

ARTICLE
Mathematical modeling of COVID-19 in14.8 million individuals in Bahia, BrazilJuliane F. Oliveira 1,2✉, Daniel C. P. Jorge 3, Rafael V. Veiga1, Moreno S. Rodrigues 4,
Matheus F. Torquato 5, Nivea B. da Silva6, Rosemeire L. Fiaccone6, Luciana L. Cardim1, Felipe A. C. Pereira 7,
Caio P. de Castro3, Aureliano S. S. Paiva 1, Alan A. S. Amad 5, Ernesto A. B. F. Lima8, Diego S. Souza 1,
Suani T. R. Pinho3,9, Pablo Ivan P. Ramos 1,9 & Roberto F. S. Andrade 1,3,9
COVID-19 is affecting healthcare resources worldwide, with lower and middle-income
countries being particularly disadvantaged to mitigate the challenges imposed by the disease,
including the availability of a sufficient number of infirmary/ICU hospital beds, ventilators,
and medical supplies. Here, we use mathematical modelling to study the dynamics of COVID-
19 in Bahia, a state in northeastern Brazil, considering the influences of asymptomatic/non-
detected cases, hospitalizations, and mortality. The impacts of policies on the transmission
rate were also examined. Our results underscore the difficulties in maintaining a fully
operational health infrastructure amidst the pandemic. Lowering the transmission rate is
paramount to this objective, but current local efforts, leading to a 36% decrease, remain
insufficient to prevent systemic collapse at peak demand, which could be accomplished using
periodic interventions. Non-detected cases contribute to a∽55% increase in R0. Finally, we
discuss our results in light of epidemiological data that became available after the initial
analyses.
https://doi.org/10.1038/s41467-020-19798-3 OPEN
1 Center of Data and Knowledge Integration for Health (CIDACS), Instituto Gonçalo Moniz, Fundação Oswaldo Cruz, Salvador, Bahia, Brazil. 2 Centre ofMathematics of the University of Porto (CMUP), Department of Mathematics, Porto, Portugal. 3 Instituto de Física, Universidade Federal da Bahia, Salvador,Bahia, Brazil. 4 Fundação Oswaldo Cruz, Porto Velho, Rondônia, Brazil. 5 College of Engineering, Swansea University, Swansea, Wales, UK. 6 Instituto deMatemática e Estatística, Universidade Federal da Bahia, Salvador, Bahia, Brazil. 7 Instituto de Física, Universidade de São Paulo, São Paulo, Brazil. 8 OdenInstitute for Computational Engineering and Sciences, The University of Texas at Austin, Austin, TX, USA. 9These authors contributed equally: Suani T. R.Pinho, Pablo Ivan P. Ramos, Roberto F. S. Andrade. ✉email: [email protected]
NATURE COMMUNICATIONS | (2021) 12:333 | https://doi.org/10.1038/s41467-020-19798-3 | www.nature.com/naturecommunications 1
1234
5678
90():,;

In December 2019, clusters of a respiratory disease attributed toa potentially novel coronavirus were identified. This hypoth-esis was rapidly confirmed, and the virus was named as severe
acute respiratory syndrome coronavirus 2 (SARS-CoV-2), thecausal agent of coronavirus disease 2019 (COVID-19). This novelcoronavirus rapidly spread across Asia, Europe, and other con-tinents, achieving pandemic status, as determined by the WorldHealth Organization, on March 11, 2020. As of October 2020, allparts of the world were, to varying degrees, impacted by theCOVID-19 epidemic, with more than 40 million cases and 1.1million deaths reported globally1, in what can be construed as theworst pandemic since the Spanish flu (1918–1920).
A prominent feature of the current pandemic is the high person-to-person transmissibility of the virus, with a basic reproductionnumber (R0) estimated at 2.2–2.5 in Wuhan, China, where initialcases were detected2,3. Other worrying aspects are the severity ofclinical complications and the lack of vaccines or effective drugs to,respectively, prevent disease and accelerate the patient’s recovery.Consequently, the only effective mechanisms currently available todampen viral spread are non-pharmaceutical interventions (NPI),and the population’s adherence thereof. Among these are socialisolation and distancing, quarantine, travel restrictions, and chan-ges in individual behavior, such as the widespread usage of facemasks and heightened preoccupation with hygiene4.
The sudden increase in demand for hospitalization during thepandemic, leading to collapse in health systems due to insufficientmedical infrastructure and healthcare resources, has particularlyimpacted countries with limited healthcare infrastructure, such asthose in Latin America. Brazil, the largest country in this region,provides a cautionary example of the profound impacts ofCOVID-19 on health systems. The first confirmed case ofCOVID-19 in Brazil occurred on February 26, 2020, in the stateof São Paulo, although multiple independent introductions haveoccurred, fueled by returning international travelers5, andnationwide community transmission was declared on March 20.As of October, 2020, the number of confirmed COVID-19 casesexceeded 5.2 million nationally, with over 150,000 deaths repor-ted. Bahia, located in northeast Brazil, has a population of 14.8million throughout its 417 municipalities, with a territorialextension of 567,295 km2, comparable to that of France. In spiteof its economic importance (with the sixth highest gross domesticproduct among all Brazilian states), the state of Bahia presentsmarked intra-regional disparities in terms of access to health,with hospitals and healthcare investments unequally distributedaround the state6. Thus, Bahia is a representative example of howCOVID-19 impacts health resources in low and middle-incomecountries, and the effects of measures implemented in an attemptto mitigate damaging consequences.
Mathematical models are proving instrumental in studying thecurrent COVID-19 pandemic7, as well as in driving governmentalpolicy. A hallmark of the latter was the radical shift in actions ofsome governments defending “herd immunity” strategies, asmodels produced by the Imperial College London projectedmassive death tolls before reaching this objective8. Substantialinsights into the dynamics of disease spread can be gained byusing compartmentalized models, such as 3-compartment SIR(susceptible-infected-recovered)9. Models that build on theseprinciples have flourished in the recent literature, even extendingthe number of compartments to study other key aspects ofCOVID-19, including the role of asymptomatic transmission10,11,social distancing, and quarantine strategies3,12–15, as well as post-epidemic scenarios, e.g. the probability of novel outbreaks16,17.The need for hospitalization under various conditions has alsobeen evaluated using mathematical modeling18–20.
In this work, we further explore hospitalization needs in a low-resource state during the COVID-19 pandemic, with particular
emphasis given to hospital ward (throughout the text referred toas clinical) and intensive care unit (ICU) bed requirements.Particularly, we describe an 8-compartment model with variabledisease transmissibility over time, considering transmission byasymptomatic/mild cases, which usually go undetected, hospita-lization of severe cases (requiring clinical/ICU beds) and mor-tality. The parameters of this model are partially locally informedusing data from hospitals dedicated to treating COVID-19patients in the region, and partly calibrated against the data(cases, deaths) provided by local health authorities, with optimalparameters identified using particle swarm optimization meta-heuristics. This model was applied to study the ongoing COVID-19 outbreak in the state of Bahia, Brazil, an example of a low-resource setting with pronounced inequalities in healthcareaccess, but could be extended and is directly applicable to otherregions, offering the potential to aid in setting targets that mayguide to the analysis of the evolving COVID-19 pandemic, inaddition to informing the extent of governmental measuresrequired. Finally, we performed an ex-post evaluation of theCOVID-19 epidemic in Bahia using data that became availableafter the initial analysis, focusing on the actual clinical/ICU bedsusage during the period, the number of COVID-19 cases anddeaths, and the utility of the proposed model to describe theepidemic in real-time.
ResultsModel sensitivity analysis. We first conducted a sensitivityanalysis to evaluate the most influential parameters of the model.Of note, the variance-based method used accounts for interac-tions among the model variables. These results revealed the factorthat reduces the infectivity of the asymptomatic/non-detected, δ,to be among the most influential parameters to every modeloutput during the whole period evaluated. Also, the transmissionrate β was identified as exerting an important role in the modeldynamics, as expected. Particularly, during the first 30 days β0 isthe most important parameter in the system, as indicated byhigher values of the total effect index (ST). After this period, theimportance of β0 decreases as that of β1 increases, eventuallysuperseding the former as the most important parameter in thesystem. For H, U, and D, the most influential parameter duringthe initial stages of the simulation (before day 15) is the pro-portion of symptomatic needing hospitalization or ICU, h,together with the transmission rate (Supplementary Figs. 1, 2).The full analysis is presented in Supplementary Note 2.
Effects of social distancing and governmental interventions ondisease transmissibility were observable shortly after onset. Westarted our analyzes by assessing the effects in disease transmis-sibility that local non-pharmaceutical interventions (NPI) haveproduced in the Bahia state, in its capital Salvador, as well as inthe remaining cities (all municipalities in the state except thecapital). For this, the model was fitted using the number ofconfirmed cases as declared by local authorities (Fig. 1) and weestimated parameters related to the transmission rate (β0, β1), thetime point when it changes, and the factor that reduce theinfectivity of the asymptomatic/non-detected, δ. We observedthat the initial (pre-intervention) transmission rate was β0= 1.28([1.26–1.30] 95% CI). A reduction of 36% on the transmissionrate, yielding β1= 0.92 ([0.91, 0.93] 95% CI), is evidenced aroundApril 2 (27 days after the first confirmed case in the state). InSalvador (with a population of 2.6 million people), this reductionwas of 54.7% (on March 26), while the remaining cities displayeda decrease of approximately 40.6% (on April 3, 2020). Thefactor that reduces the infectivity of the asymptomatic/non-detected was determined to be δ= 0.34 ([0.33, 0.35] 95% CI) at
ARTICLE NATURE COMMUNICATIONS | https://doi.org/10.1038/s41467-020-19798-3
2 NATURE COMMUNICATIONS | (2021) 12:333 | https://doi.org/10.1038/s41467-020-19798-3 | www.nature.com/naturecommunications

the state level, δ= 0.71 ([0.69, 0.72] 95% CI) in the capital andδ= 0.62 ([0.60, 0.64] 95% CI) in the remaining cities. The basicreproduction numbers for Bahia, Salvador and the other 416municipalities were, respectively, of R0= 2.25 ([2.19–2.31] 95%CI), 3.56 ([3.44–3.69] 95% CI) and 2.45 ([2.36–2.55] 95% CI).
These results show that the combined effects of changes inhuman behavior with the governmental policies of movementrestriction resulted in significant decreases of the transmissionrate, as measured by the β parameter. However, these efforts arestill insufficient to curb the epidemic in the state, as the basiceffective reproduction number still exceeds 1 (see Fig. 2),indicating a scenario of continuing growth. Next, we presentthe results of the consequence of this growth in local healthresources.
Projecting hospitalization requirements in Bahia, Brazil:challenges for low-resource settings. We evaluated the burdenon hospitalization needs imposed by the COVID-19 epidemic atthe state level, as well as the effects of NPI strategies on theserequirements. We also estimated the total number of deathsprojected by the model in the absence and during the enforce-ment of distancing measures. Our results, presented in Fig. 3,show that, in the absence of interventions, the state level avail-ability of clinical beds would be exhausted by April 24, 2020.With the maintenance of the current level of interventions, thisdepletion is shifted in time and would occur by May 9. Analo-gously, the demand for ICU beds would exceed the installedcapacity by April 26 in the absence of interventions, and by May13 with the current rate of interventions.
The real-world, state-level data obtained for May 4, the last daywith available bed occupancy observations, shows that 240(51.5%) clinical beds were occupied, while 176 (41.7%) ICU beds
were in use. Our model-based analysis yields an increase in thesenumbers by 6.5 (1581 beds) and 6.4 (1131 beds) times for clinicaland ICU beds, respectively, if interventions had not been adoptedin the state. On the other hand, measures enforced decreased thenumber of cases and deaths by 7 and 4 times, respectively,compared to the scenario where no measures are in place.
These results underscore the impact that the ongoing COVID-19 epidemic imposes on hospital resources and mortality, andparticularly explicit the challenges faced by countries with morelimited healthcare systems. Even if we consider overestimation ofthe prediction results, the simple doubling of the current real-world bed occupancy data would already result in exceeding thecurrent availability of clinical and ICU beds in the state.
The obtained R0 is as before and the effective reproductionnumber is presented in Fig. 2. We can notice a trend of reductionon the effective reproduction number, althoughRðtÞ is above onethroughout most of the time series for the state of Bahia.Interestingly, our analysis of how non-detected cases (asympto-matic/mild infections) influence the course and dynamic oftransmission revealed that these individuals contribute to anincrease of 55.03% on the basic reproduction number.
A model-informed strategy of periodic interventions to reduceCOVID-19 transmissibility in an effort to protect health sys-tems. The previous results revealed the favorable effects thatinterventions resulting in decreased transmission rate have onshifting the peak of hospitalization saturation (complete occu-pancy of available beds), and in decreasing the number of casesand deaths. However, these results showed that completesaturation is inevitable under our local conditions. We nextevaluated to what extent more vigorous restriction policies, andtheir duration/periodicity, would be useful in order to prevent the
Fig. 1 Projection of the the number of cases with a changing transmission rate. (a) in Bahia; (b) in Salvador, and (c) in the remaining 416 municipalities.The parameters κ= 1/4, p= 0.2, γa= 1/3.5, γs= 1/4 were fixed and h was set to zero for the capital and inland cities. The black dots correspond to theactual number of cases. The vertical dashed red lines are the dates of transition from β0 to β1. The blue dashed and full lines represent the evolution of theepidemic with a fixed transmission rate β0 and with both β0 and β1, respectively. The shaded error bands represent 95% confidence intervals of the meancalculated using the weighted non-parametric bootstrap method. Raw data from March 6 to May 4, 2020 are shown in this graph.
NATURE COMMUNICATIONS | https://doi.org/10.1038/s41467-020-19798-3 ARTICLE
NATURE COMMUNICATIONS | (2021) 12:333 | https://doi.org/10.1038/s41467-020-19798-3 | www.nature.com/naturecommunications 3

complete collapse of the state-level health system. To address thisquestion, we used the SEIIHURD model to study the epidemicdynamics under various scenarios.
Initially, and in order to assert that disease transmissibility isthe driving factor leading to increased hospitalization require-ments, we considered a scenario where the transmission rate ofasymptomatic/non-detected individuals was increased by 50%starting in May 5 (Fig. 4). After 20 days, we noticed an increase ofcumulative cases and deaths of, respectively, 50%, and 37%.Accordingly, clinical and ICU bed requirements increase by 75%and 87.5%, respectively. This scenario is illustrative of a situationwhere the movement restriction of individuals asymptomatic orhaving only mild symptoms (non-detected infections) is eased.
By accounting for non-detected cases, our modeling-basedapproach allowed the estimation of the infection fatality ratio(IFR), which considers deaths as a proportion of the total numberof cases irrespective of severity or symptomatology. Oursimulations of the SEIIHURD model yielded an overall IFR of0.69% ([0.67, 0.71] 95% CI) for the state of Bahia, in line withpreliminary findings from a literature meta-analysis that reportedan estimated IFR of 0.68% ([0.52, 0.82] 95% CI), characterized byextensive heterogeneity across countries21,22. In addition, model-ing allows the estimation of the overall fraction of infected in thepopulation exposed to the virus, allowing to investigate whetherdecreases in the transmission rate are driven more by a decreasedpool of susceptibles or as a result of effective control policies. Weestimated that, by May 4, 2020, around 0.1% of the populationhad been infected (either symptomatic or asymptomatic/non-detected) (Supplementary Fig. 3), in line with seroprevalencestudies for the region23, reinforcing the benefits of control policiesto contain the viral spread, at least in the initial epidemic phase.
The previous results confirmed the importance of controllingdisease transmissibility. Then, we turned to set targets that would
allow for an increase in the protection of the healthcare system.These scenarios are illustrated in Table 1. We show that anintervention that reduces the transmission rate by 25%, enforcedon May 2, 2020 (7 days before the predicted collapse of thesystem), for 30 days, would not yield significant improvements,resulting in a gain of only 2 days until clinical beds collapse, and8 days until ICU bed capacity is exhausted. Similar results can beachieved by a more punctual (7 days period), but more vigorousintervention reducing transmission rate by 50% (Table 1). Moreinterestingly, a delay of about 40 days for clinical and ICU bedexhaustion can be achieved in a scenario where a 50% reductionon the transmission is sustained for 30 days, or when a 75%reduction is endured for 14 days (Supplementary Fig. 4).
The timing of interventions is also crucial under our model. If avigorous intervention is only adopted on the day when clinicalbed occupancy reaches its maximum availability (on May 9), atime lag will be needed in order to allow for patient turnover inhospitals. Once occupancy is below the total availability,interventions can be continued or suspended. In the latter case,hospitalization requirements recommence to rise until reachingthe health system’s capacity once again. Under this scenario, anintervention that reduces the transmission rate by 25% will not beenough to protect health resources, even if policies aremaintained for long periods of time (Supplementary Fig. 5).Similar results are seen when we consider the reduction of thetransmission rate by 50%, as shown in Table 2. Thus, harsherefforts to contain disease transmissibility, and for more extendedperiods, are necessary to allow for a full recovery of the healthcaresystem.
The previous results, combined, show that intense efforts todecrease COVID-19 transmissibility are needed in order toovercome a complete collapse of the healthcare system in a low-resource setting such as that encountered in Bahia, Brazil. Of
Fig. 2 Effective reproduction number. Results for (a) Bahia, (b) Salvador, and (c) the remaining 416 municipalities up to May 4, 2020. The black solid linesrepresent theRt calculated with reported number of new cases; the blue dashed lines represent theRt calculated with the new number of simulated casesobtained from the model. The red dashed lines indicate Rt ¼ 1.
ARTICLE NATURE COMMUNICATIONS | https://doi.org/10.1038/s41467-020-19798-3
4 NATURE COMMUNICATIONS | (2021) 12:333 | https://doi.org/10.1038/s41467-020-19798-3 | www.nature.com/naturecommunications

note, under some of the presented scenarios full re-establishmentof the hospitalization capacity may not be achieved if the timingto enforce more strict measures to decrease the transmission rateis not optimal. Accordingly, periodic interventions may be neededto control secondary waves of the outbreak. In Fig. 5 we illustratethe behavior of the spread dynamics of COVID-19 in Bahia ifmeasures are periodically adopted. We present the behavior ofimplementing measures for a period of 30 days, followed by aneasing of 30 days, and this being repeated periodically. Theseresults show that even a reduction of 50% of the currenttransmission rate is insufficient to remain below the actualavailability of health resources. Nevertheless, this implementationmay be combined with the expanding of health capacities,limiting the need of more intense interventions.
Real-time modeling. The previous analyses comprised dataavailable up to May 4, 2020. By leveraging the most currentepidemiological data available for the on-going epidemic, we wereable to juxtapose the original predictions of the SEIIHURD modelwith the COVID-19 epidemic unfolded in Bahia up to September13, 2020. For this ex-post assessment, we first compared 30 dayspredictions of the original model (calibrated on May 4) withactual data for the period (Fig. 6), reasoning that homogeneousmodels, such as ours, have a limited long-term prediction capa-city for the state as a whole, and in a real-world situation where
the model is used for predicting the allocation of healthcareresources, re-calibration with more current data would improvethe accuracy of predictions while providing a reasonable time-frame for the management of resources by policy-makers.
The 30 days prediction of the original model (calibrated on May4, 2020) was able to satisfactorily predict the number of reportedcases, deaths, and ICU requirements, with real-world values fallingwithin our predicted confidence intervals (Fig. 6). Confirming ouroriginal predictions, under a scenario where interventions weremaintained, the ICU bed availability would be exhausted by May13, while this capacity was actually reached on May 24, 2020(11 days later) as indicated by the data, also within the range of theestimated confidence interval. A less accurate result is shown forthe hospitalization requirements. With a collapse estimated tooccur on May 9, the data related to clinical beds occupations onlyreached its capacity on May 29. It is possible that hospitalizationparameters may have changed during the period, however, wewere not able to obtain updated data of the hospitalizationdynamics in ICM to confirm whether this actually occurred.
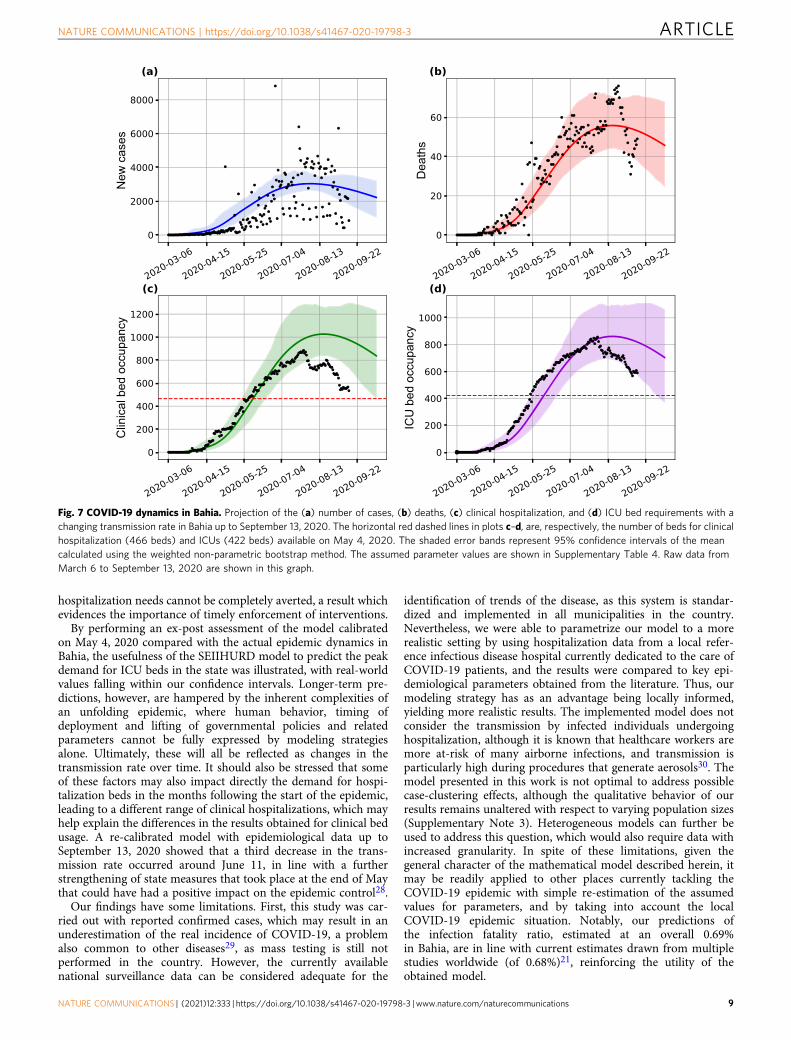
Lastly, to describe the most up-to-date transmission dynamicsin Bahia, we re-estimated our model with data available up toSeptember 13, 2020 (Fig. 7). We maintained the parametersconditions as described in “Methods”, while allowing for a newtransmission rate variability. The new estimates showed areduction of the transmission rate on June 11, hinting on anincreased control of the epidemic in Bahia.
Fig. 3 Effects of the implemented interventions in Bahia. Effects on the number of (a) cases, (b) deaths, (c) clinical hospitalization, and (d) ICU bedrequirements at the state level. The horizontal red dashed lines are, respectively, the current capacity for beds for clinical hospitalization (466 beds) andICUs (422 beds). The blue dashed and full lines represent the evolution of the epidemic with a fixed transmission rate β0 and with both β0 and β1,respectively. The shaded error bands represent 95% confidence intervals of the mean calculated using the weighted non-parametric bootstrap method.Residual analysis to visualize a tendency between the data and simulations are presented in Supplementary Fig. 7. The assumed parameter values areshown in Supplementary Table 3. Raw data from March 6 to May 4, 2020 are shown in this graph.
NATURE COMMUNICATIONS | https://doi.org/10.1038/s41467-020-19798-3 ARTICLE
NATURE COMMUNICATIONS | (2021) 12:333 | https://doi.org/10.1038/s41467-020-19798-3 | www.nature.com/naturecommunications 5

DiscussionThe COVID-19 pandemic poses unprecedented challenges tohealthcare resources worldwide. Our results based on actualepidemic data and on the generalization of the SEIR model,taking into account non-detected infections, hospitalizationdemands, and mortality, highlight some relevant scenarios forCOVID-19 in Bahia, a Brazilian state with exacerbated inequal-ities in health coverage and access. The trajectory of the epidemiccan be characterized by the basic reproduction number (R0>1),which reflected the exponential growth of cases at the beginningof the epidemic in Salvador, the capital of Bahia, as well as itsremaining 416 municipalities. We show that a reduction in
disease transmission rate, as a result of non-pharmaceuticalgovernmental interventions initiated on March 17, led todecreases in the number of cases, hospitalization demands andmortality up to May 4, which is represented in the model by astep function of transmission rate. We further show a reductionof 36% in the transmission rate in the 2 months since the firstcase was confirmed in Bahia. This may be partly attributed topopulation adherence to social distancing recommendations andconvergent actions taken by local government authorities at thestate and municipal levels. The effect of social distancing alsobecame apparent in the time series modeling of the effectivereproduction number, RðtÞ, which continued to be greater than 1
Fig. 4 Effect of easing the social distancing for individuals with asymptomatic/mild infections in Bahia. Impact on the (a) number of cases, (b) deaths,(c) clinical hospitalization, and (d) ICU bed requirements at the state level. Here, the value of δ has been increased by 50% (δ= 0.51 in this simulation).The black dots correspond to the actual number of cases (a), deaths (b), and hospital bed occupancy (c)–(d). The assumed parameter values are shown inSupplementary Table 3. Raw data from March 6 to May 4, 2020 are shown in this graph.
Table 1 Scenarios of an immediate intervention in May 2, 2020, with variations of the transmission rate and intervention length.
Percentage of transmission ratereduction
Intervention length (days) Date of hospitalization bedscollapse (delay, in days,compared to baseline scenario)
Date of ICU beds collapse(delay, in days, compared tobaseline scenario)
7 05/11/20 (2) 05/17/20 (4)25% 14 05/11/20 (2) 05/20/20 (7)
30 05/11/20 (2) 05/21/20 (8)7 05/15/20 (6) 05/21/20 (8)
50% 14 05/24/20 (15) 05/31/20 (18)30 06/17/20 (39) 06/23/20 (41)7 05/22/20 (13) 05/27/20 (14)
75% 14 06/08/20 (30) 06/13/20 (31)30 07/17/20 (69) 07/21/20 (69)
ARTICLE NATURE COMMUNICATIONS | https://doi.org/10.1038/s41467-020-19798-3
6 NATURE COMMUNICATIONS | (2021) 12:333 | https://doi.org/10.1038/s41467-020-19798-3 | www.nature.com/naturecommunications

(RðtÞ> 1), despite the implementation of governmentalmeasures.
Several measures to control the spread of the disease have beenenforced by local governments, some of them even before thenotification of the first cases of community spread, on March 19.From 17–28 March, measures were gradually applied and inclu-ded the ban of public gatherings of over 50 people, closure ofschools, mandatory home isolation for people with respiratorysymptoms, adoption of teleworking for individuals of risk groups,and the reduction of circulation of interstate buses and intercitytransportation between places where SARS-CoV-2 community
transmission was declared. Concerning the latter, it is possiblethat the transmission rate decrease observed for the capital led toa corresponding reduction in the remaining municipalities due todecreased transportation flux of individuals.
Given the extent of measures adopted from March 17 onward,our results show that the reduction of the demand for clinical andICU beds possibly avoided an immediate surge in hospitalizationneeds leading to system collapse, at least up to May 15. However,the simulated scenarios revealed that easing social distancingmeasures abruptly, which will result in increased transmissionrates, should not be considered due to the non-linear transmission
Table 2 Scenarios of critical interventions adopted exactly when total clinical beds availability is reached (05/09/20), withvariations of the transmission rate and intervention length.
Percentage oftransmission ratereduction
Intervention length(days)
Date when thehospitalization thresholdis re-achieved (days)
Date of secondhospitalization collapse(days of delay)
Date when the ICUthreshold isre-achieved (days)
Date of second ICUcollapse (days ofdelay)
7 does not occura – b 05/18/20 (5)14 does not occura – b 05/26/20 (13)
50% 30 does not occura – b 06/21/20 (39)60 06/17/20 (39) 07/30/20 (43) b 08/04/20 (83)90 06/17/20 (39) 09/10/20 (86) b 09/15/20 (125)7 does not occura – b 05/25/20 (12)14 05/26/20 (17) 06/05/20 (10) b 06/12/20 (30)
75% 30 05/26/20 (17) 07/17/20 (52) b 07/21/20 (69)60 05/26/20 (17) 09/26/20 (123) b 09/30/20 (140)
–, does not apply.aHospitalization is not reduced enough to reach the actual capacity.bICU did not collapsed.
Fig. 5 Effect of periodic interventions in Bahia. Simulated impact on the (a) number of cases, (b) deaths, (c) clinical hospitalization, and (d) ICU bedrequirements at the state level. The transmission function β, as in Eq. (1), is defined by considering a reduction of 25% (yellow curves), 50% (blue curves),and 75% (green curves) on the β1 parameter. The red curves consider a scenario of no reduction in β1, and the period is the intervention window of 30 days.The dashed horizontal lines in (c) and (d) indicate the total number of clinical and ICU beds available in the state, respectively, in that moment. The blackdots correspond to the actual number of cases (a), deaths (b), and hospital bed occupancy (c)–(d). The assumed parameter values are shown inSupplementary Table 3. Raw data from March 6 to May 4, 2020 are shown in this graph.
NATURE COMMUNICATIONS | https://doi.org/10.1038/s41467-020-19798-3 ARTICLE
NATURE COMMUNICATIONS | (2021) 12:333 | https://doi.org/10.1038/s41467-020-19798-3 | www.nature.com/naturecommunications 7

of the disease and the significant number of non-detected infec-tions, which have been considered as the source for the majority ofcases in the previous studies10.
Our results reinforce the negative effects on healthcareresources related to the circulation of asymptomatic/mild cases,which usually go undetected. Accordingly, policies aiming atrelaxing the current level of social distancing measures, in ascenario where the majority of the population does not haveaccess to diagnostic tests, could pose an additional burden on analready limited health system infrastructure. These results are inline with a recent study suggesting early self-isolation as a strategyto cope with the increasing demand for COVID-19-relatedhospitalization18.
Bounds for δ (a factor associated with the infectivity ofasymptomatic/non-detected) were defined based on the previousstudies10,17,24, which suggest that it is lower than that of symp-tomatic individuals (thus, δ < 1). However, based on the searchinterval for δ between 0 and 0.75, simulations of a greatertransmission by non-documented infections due to an increasedcirculation of individuals presenting with asymptomatic/milddisease can also be indicated by values of δ ≥ 1. The sensitivityanalysis presented in our modeling results revealed the impor-tance of increased knowledge of the extent to which infectedindividuals, with varying degrees of symptoms, are able totransmit the disease.
The consequences of the spread of the disease are even worsewhen the healthcare system is no longer able to support the
number of patients needing specialized assistance–a situationreferred to as a health system collapse. Our results point that non-pharmaceutical measures should be implemented in order toreduce the transmission rate of the disease, and consequently gaintime to create new hospitals, acquire protective equipmentmaterial and guarantee human resources. But what can be donewhen faced with an already collapsed health system? We per-formed simulations to address this question, presenting differentscenarios in order to determine an efficient strategy, by con-sidering the period and intensity of interventions. The interven-tions can be applied at a single moment in time and kept until adecrease of the number of cases is observed, or a combination ofinterventions can be enforced at different time intervals, as pro-posed in other works25,26, depending on testing and monitoringcapacities and/or local social-economical conditions. Our resultsshow that, when faced with an already collapsed system, onlyvigorous measures (that reduce the transmission rate by at least50%) enforced over at least two months or, alternatively, mea-sures capable of reducing transmission by at least 75% over a 2-week period, are capable of re-establishing hospitalizationoperation capacity. Albeit harsh, other countries have successfullymanaged to reduce transmission at such figures by employing amyriad of public health measures (including intra-city andintercity travel restrictions, social distancing, home confinement,and centralized quarantine and expansion of available medicalresources)27. Of note, even in the event that the transmission rateis decreased at these levels, a further, second collapse on
Fig. 6 Real-time comparison between the modeling analysis in Bahia and reported data updated up to June 4, 2020. (a) Cumulative number of cases;(b) cumulative number of deaths; daily (c) clinical, and (d) ICU bed requirements in the state of Bahia. The model was fitted based on data up to May 4,2020, represented by black dots, as shown in Fig. 3. The shaded error bands represent 95% confidence intervals of the mean calculated using the weightednon-parametric bootstrap method. Gray dots depict the newly available data up to June 4, 2020. The horizontal red dashed lines in panels c and drepresent, respectively, the number of beds for clinical hospitalization (466 beds) and ICUs (422 beds) available on May 4, 2020. Raw data from March 6to June 4, 2020 are shown in this graph.
ARTICLE NATURE COMMUNICATIONS | https://doi.org/10.1038/s41467-020-19798-3
8 NATURE COMMUNICATIONS | (2021) 12:333 | https://doi.org/10.1038/s41467-020-19798-3 | www.nature.com/naturecommunications
hospitalization needs cannot be completely averted, a result whichevidences the importance of timely enforcement of interventions.
By performing an ex-post assessment of the model calibratedon May 4, 2020 compared with the actual epidemic dynamics inBahia, the usefulness of the SEIIHURD model to predict the peakdemand for ICU beds in the state was illustrated, with real-worldvalues falling within our confidence intervals. Longer-term pre-dictions, however, are hampered by the inherent complexities ofan unfolding epidemic, where human behavior, timing ofdeployment and lifting of governmental policies and relatedparameters cannot be fully expressed by modeling strategiesalone. Ultimately, these will all be reflected as changes in thetransmission rate over time. It should also be stressed that someof these factors may also impact directly the demand for hospi-talization beds in the months following the start of the epidemic,leading to a different range of clinical hospitalizations, which mayhelp explain the differences in the results obtained for clinical bedusage. A re-calibrated model with epidemiological data up toSeptember 13, 2020 showed that a third decrease in the trans-mission rate occurred around June 11, in line with a furtherstrengthening of state measures that took place at the end of Maythat could have had a positive impact on the epidemic control28.
Our findings have some limitations. First, this study was car-ried out with reported confirmed cases, which may result in anunderestimation of the real incidence of COVID-19, a problemalso common to other diseases29, as mass testing is still notperformed in the country. However, the currently availablenational surveillance data can be considered adequate for the
identification of trends of the disease, as this system is standar-dized and implemented in all municipalities in the country.Nevertheless, we were able to parametrize our model to a morerealistic setting by using hospitalization data from a local refer-ence infectious disease hospital currently dedicated to the care ofCOVID-19 patients, and the results were compared to key epi-demiological parameters obtained from the literature. Thus, ourmodeling strategy has as an advantage being locally informed,yielding more realistic results. The implemented model does notconsider the transmission by infected individuals undergoinghospitalization, although it is known that healthcare workers aremore at-risk of many airborne infections, and transmission isparticularly high during procedures that generate aerosols30. Themodel presented in this work is not optimal to address possiblecase-clustering effects, although the qualitative behavior of ourresults remains unaltered with respect to varying population sizes(Supplementary Note 3). Heterogeneous models can further beused to address this question, which would also require data withincreased granularity. In spite of these limitations, given thegeneral character of the mathematical model described herein, itmay be readily applied to other places currently tackling theCOVID-19 epidemic with simple re-estimation of the assumedvalues for parameters, and by taking into account the localCOVID-19 epidemic situation. Notably, our predictions ofthe infection fatality ratio, estimated at an overall 0.69%in Bahia, are in line with current estimates drawn from multiplestudies worldwide (of 0.68%)21, reinforcing the utility of theobtained model.
Fig. 7 COVID-19 dynamics in Bahia. Projection of the (a) number of cases, (b) deaths, (c) clinical hospitalization, and (d) ICU bed requirements with achanging transmission rate in Bahia up to September 13, 2020. The horizontal red dashed lines in plots c–d, are, respectively, the number of beds for clinicalhospitalization (466 beds) and ICUs (422 beds) available on May 4, 2020. The shaded error bands represent 95% confidence intervals of the meancalculated using the weighted non-parametric bootstrap method. The assumed parameter values are shown in Supplementary Table 4. Raw data fromMarch 6 to September 13, 2020 are shown in this graph.
NATURE COMMUNICATIONS | https://doi.org/10.1038/s41467-020-19798-3 ARTICLE
NATURE COMMUNICATIONS | (2021) 12:333 | https://doi.org/10.1038/s41467-020-19798-3 | www.nature.com/naturecommunications 9

By drawing on different modeling scenarios, this workattempted to determine an efficient strategy to be employed in aneffort to avoid a collapse in the local healthcare system, takinginto account the length and the intensity of governmental inter-ventions. A compromise between the availability of hospital/ICUbeds and the pool of susceptible individuals was identified, forwhich modeling indicates the eventual occurrence of subsequentwaves of infection, leading to further shortages in hospital/ICUbeds. Our results underscore the crucial need for policy-makers totake into account the results of data-informed modeling whenconsidering the lifting of restrictive measures.
MethodsData sources and case definition. The models produced in this study wereinformed by data from multiple sources: The daily series of the cumulative con-firmed COVID-19 cases and the daily mortality series for the state of Bahia, itscapital Salvador and the remaining cities were obtained from publicly available dataprovided by the Secretary of Health of the State of Bahia (SESAB). Throughout ouranalyses, we consider separately the state capital (which concentrates the numberof cases in the region and is an important touristic destination) and the remaining416 municipalities. Local health authorities use the following case definition ofCOVID-19, based on two criteria: (i) clinical/epidemiological, namely a case ofsuspected flu-like syndrome or severe acute respiratory syndrome (SARS) who hadcontact with a laboratory-confirmed COVID-19 case in the last 7 days prior tosymptoms onset; or (ii) clinical/laboratory, a suspected case of flu-like syndrome orSARS with a positive SARS-CoV-2 serology (IgM and/or IgG) or real-time PCRresult.
Additionally, state-level daily hospital bed occupancy of clinical and ICU bedswere provided by SESAB. By May 2020, the state of Bahia had a total of 888hospital beds dedicated to the treatment of COVID-19 patients, of which 466 areclinical hospitalization and 422 are ICU beds. This data was not available at themunicipal level; rather, due to the Brazilian administrative division of healthregions, hospital bed occupancy was evaluated at the state level only. Data wasavailable throughout the period of March 6 to May 4, 2020 for the initial analysisand up to September 13, 2020 for the ex-post assessment.
We also had access to administrative data from a reference infectious diseasehospital located in Salvador (Instituto Couto Maia; ICM), in cooperation with theRede CoVida consortium team. ICM is the leading public hospital in the state ofBahia for the treatment of COVID-19 patients. The collected hospitaladministrative data, aggregated across 231 patients followed from admission todischarge/death in the period of March 23 to April 16, 2020, were used to informthe hospitalization-related model parameters, including the search intervals foroptimization procedures, as described in Section “Evaluation and estimation ofmodel parameters”.
The estimated population of Bahia in 2020 was obtained from the BrazilianInstitute of Geography and Statistics (IBGE).
Assumptions and model construction. In this section, we present the SEIIHURDmodel that subdivides the population into eight compartments, as follows: sus-ceptible (S), those who are not exposed to the disease; exposed (E), individuals whohave been exposed to the virus and are in a latent, non-infectious period; (I)infectious, those currently infected and capable of transmitting the disease tocontacts; recovered (R), those who were previously infected and recovered from thedisease; deaths (D) those that resulted from death due to COVID-19, after passingfor a period of hospitalization or ICU. The infectious individuals are furtherseparated into asymptomatic/non-detected infections, denoted Ia, and sympto-matic, denoted by Is. Of note, COVID-19 transmission by undocumented infec-tions, which encompasses truly asymptomatic (individuals that never developsymptoms) as well as those that present with very mild symptoms, has been shownto facilitate the spread of SARS-CoV-210. Thus, individuals in the Ia compartmentrepresent this group of persons that usually do not require hospitalization, are notaccounted for in the official data, and define a subset of non-detected infections.However, a proportion of the infected will present with severe symptoms requiringhospitalization (clinical beds) (H), while those in critical conditions will eventuallyrequire ICU admission (U). For simplicity, we have neglected the transmission ofindividuals in compartments H and U, assuming that hospital containmentdecreases the chances of contact with susceptible individuals. We also consider aflux of patients between the H and U compartments, as individuals initiallyadmitted to a clinical ward may worsen their condition and require an ICU bed.Furthermore, all patients in U are transferred to H prior to discharge and recovery.This assumption was based on the analysis of the administrative data from ICM, inwhich we observed that all patients requiring ICU beds had one of two outcomes:They were moved to hospitalization wards (H) before recovery and discharge; orthey died as a result of disease. In addition, this administrative patient flow is alsoreported to be more common in the literature than a discharge directly home31. InSupplementary Fig. 6 we present the flow diagram of the proposed model. Similarworks can be found in refs. 10,14,19,32.
To account for local interventions of movement restriction (such asgovernmental stay-at-home orders), we consider the transmission rate as afunction of time, varying according to local measures. To define β, let {t1, t2,…, tn}be a set of points in time defining the change in the transmission rate. Then, we canwrite β as a function of time t as
βðtÞ ¼ β0Hðt1 � tÞ þXn�1
i¼1
β1Hðtiþ1 � tÞHðt � tiÞ þ β0Hðt � tnÞ; ð1Þ
where HðtÞ ¼ limk!11
1þexpð�2ktÞ is a Heaviside step function, βi are transmission
rates that can be obtained by the fitting of the data to the time interval defined bythe ti’s. The system of differential equations then reads:
dSdt
¼ �βðtÞSðIs þ δIaÞN
; ð2Þ
dEdt
¼ βðtÞSðIs þ δIaÞN
� κE; ð3Þ
dIadt
¼ ð1� pÞκE � γaIa; ð4Þ
dIsdt
¼ pκE � γsIs; ð5Þ
dHdt
¼ hξγsIs þ ð1� μU þ ωUμU ÞγUU � γHH; ð6Þ
dRdt
¼ γaIa þ ð1� hÞγsIs þ ð1� μHÞð1� ωHÞγHH; ð7Þ
dRdt
¼ γaIa þ ð1� hÞγsIs þ ð1� μHÞð1� ωHÞγHH; ð8Þ
dDdt
¼ ð1� ωHÞμHγHH þ ð1� ωU ÞμUγUU; ð9Þ
where the key epidemiological parameters are described in Table 3. More details onthe system of equations are provided in Supplementary Note 4.
Analytical evaluation of R0 and RðtÞ in the SEIIHURD model. The basicreproduction number, R0, is a threshold parameter estimated in the beginning ofthe outbreak. It is defined by the average number of secondary infections caused bya single infective in a fully susceptible population. Under these conditions, with themodel proposed here, the primary cases are generated under the initial pre-interventions transmission rate β(t)= β033.
The basic reproduction number R0 has been derived within the general nextgeneration operator framework32,34. It considers the unstable disease-freeequilibrium point of the model, where S corresponds to the whole population and allother compartments are identically set to 0. Following Van den Driessche et al.(2002)34, the value ofR0 results from a balance between the infectious and transitionterms of the sub-model composed of the variables (E, Ia, Is) associated with thetransmission of the disease, which are gathered in the corresponding 3 × 3 matrices
Table 3 Key epidemiological parameters used in theSEIIHURD model.
Parameter Description
β0 Pre-intervention transmission rateβ1 Post-intervention transmission ratet1 Time of transmission rate changeδ Asymptomatic/non-detected infectivity factorp Proportion of latent (E) that proceed to symptomatic
infectiveκ Mean exposed period (days−1)γa Mean asymptomatic period (days−1)γs Mean symptomatic period (days−1)h Proportion of symptomatic needing hospitalization (clinical
beds) or ICU1− ξ Proportion of symptomatic that proceed to ICUγH Mean hospitalization (clinical beds) period (days−1)γU Mean ICU period (days−1)μH Death rate of hospitalized individualsμU Death rate of ICU individualsωH Proportion of hospitalized that goes to ICUωU Proportion of ICU that goes to hospitalization
ARTICLE NATURE COMMUNICATIONS | https://doi.org/10.1038/s41467-020-19798-3
10 NATURE COMMUNICATIONS | (2021) 12:333 | https://doi.org/10.1038/s41467-020-19798-3 | www.nature.com/naturecommunications

K and T , given by
K ¼0 β0δ β00 0 0
0 0 0
0B@
1CA; ð10Þ
T ¼κ 0 0
�ð1� pÞκ γa 0
�pκ 0 γs
0B@
1CA: ð11Þ
Thus, given the above matrices, R0 corresponds to the largest eigenvalue of thematrix KT �1 and represents the sum of the contribution of the symptomatic andasymptomatic/non-detected transmission, being expressed by
R0 ¼β0pγs
þ β0δð1� pÞγa
: ð12Þ
The effective reproduction number RðtÞ provides a measure of how the newlyinfected part of the population will further transmit the pathogen as the epidemicevolves over time. Indeed, as reminded above, the evaluation of R0 considers thatthe whole population is initially susceptible, a condition that is strictly valid onlywhen the pathogen is first introduced into the system. As time evolves, thesusceptible fraction of the population always decreases with time for models wherethe R compartment does not feed S. It is still unknown whether re-infection bySARS-CoV-2 can occur, but initial evidence suggests against this possibility35. Herewe assume that only a single COVID-19 infection event can occur in any singleperson.
The epidemiological meaning ofRðtÞ is the same as forR0, namely, it representsthe average number of secondary infections that an individual, who became infectedat time t, is able to generate. The series of RðtÞ values indicates the current trend ofthe epidemic and captures changes caused by recently-introduced interventions(such as governmental policies) or by natural decrease of the susceptible population.Accordingly, it provides a quantitative evidence of whether further measures areneeded to control the epidemic. Here RðtÞ has been estimated following theassumptions introduced in Wallinga, Jacco, and Marc Lipsitch (2007)36. It is basedon the series of daily infected individuals, that is considered here as the source toinsert into the general renewal equation for a birth process
RðtÞ ¼ JðtÞR10 Jðt � xÞgðxÞdx
; ð13Þ
with J(t)= b(t + ℓ) where b(t) is the number of daily reported cases.In an epidemiological context, J(t) represents the daily number of new
infections, while g(x) is the disease probability distribution function for the time anindividual takes to infect secondary cases, in accordance with the ideas in theoriginal infection-age model by Kermack and McKendrick9. In this case, thefunction g(x) receives contributions that depend on the dynamics of the same threecompartments E, Ia, Is that impact the evaluation of R0. The population flowthrough these compartments consists of a first sequential step (E) followed by abifurcation event leading either to the asymptomatic/non-detected (Ia) or thesymptomatic (Is) compartments. Therefore, it is first necessary to separatelyevaluate the composite functions ga(x) and gs(x) that account, respectively, for thesequential contributions of the flows E→ Ia→O and E→ Is→O, where Oindicates any compartment not responsible for infectious steps. Here we follow theframework developed by Brauer37 to obtain the following expressions:
gaðtÞ ¼κγa
γa � κðe�κt � e�γatÞ; gsðtÞ ¼
κγsγs � κ
ðe�κt � e�γs tÞ: ð14Þ
Subsequently, these two contributions are combined, leading to the expression:
gðxÞ ¼ gsðxÞpβ=γs þ gaðxÞð1� pÞβδ=γapβ=γs þ ð1� pÞβδ=γa
: ð15Þ
The details of the evaluation of Eqs. (14) and (15) are available in SupplementaryNote 5, where we also detail how the expressions in Equation (14) should bereplaced when κ= γa or κ= γs. It is noteworthy to see that the weights in factorsmultiplying ga(x) and gs(x) correspond to the contributions of the correspondingflow paths to R0 in Eq. (12), with the difference that the value of β0 is replaced bythe value of β at the current time t.
In order to overcome the fluctuations of the confirmed number of cases (whichis influenced by testing capacity and its associated increase, even if momentarily,such as when pending tests accumulate), we present two series of Rt , onecalculated from the daily number of confirmed cases, as informed by local healthauthorities; and another Rt series where this data is informed by the predictions ofthe model. More details are given in Supplementary Note 5.
Parameter sensitivity analysis. Sensitivity analysis was conducted to assess theeffects of model parameters in the dynamics of Ia, Is, U, H, and D over time. Byusing an statistical variance-based method, described by Sobol (2001)38, the sen-sitivity analysis of the system described by Eqs. (2)–(9) considers the followingparameter vector
θ :¼ β0; β1; γH ; γU ; δ; h; t1; k� �
2 R8; ð16Þ
and assumes that its elements are uniformly distributed in proper intervals asfollows:
β0 � Uð0; 2Þ; β1 � Uð0; 2Þ; γH � Uð1=12; 1=4Þ; γU � Uð1=12; 1=3Þ;δ � Uð0; 0:75Þ; h � Uð0:05; 0:25Þ; t1 � Uð0; 30Þ; k � Uð0; 100Þ:
ð17Þ
This method is divided into two steps, described in more detail inSupplementary Note 2. The numerical simulations were performed using the SALiblibrary39, and the experiments were conducted generating N= 12,000 parametercombinations, totaling 120,000 simulations of the model. The influence of eachparameter on the model dynamics was evaluated using the total effect index, whichtakes into account higher-order interactions amongst the variables of the model.
Evaluation and estimation of model parameters. The estimation of the para-meters occurred within a chosen range based on literature and data collectedlocally, as described in Supplementary Tables 1 and 2. The initial conditions(S0, Ia,0, Ia,0, E0, R0,H0,U0,D0) is given by (1− Ia,0− Is,0− E0, Is,0, Ia,0, Is,0, E0, 0, 0,0, 0).
The parameters p, κ, γa, γs, ξ, ωU, ωH, μU, μH were kept fixed and the remainingwere obtained by estimating the best values that fit the model to the data. To definethe fixed parameters and the search intervals to use for the estimations, weperformed a literature review of published papers and collected the data regardingkey epidemiological parameters that inform our model (see SupplementaryTable 1).
As an additional guide to obtain a locally-informed model, administrative datafrom a reference infectious disease hospital (ICM; see Data Sources section) wereused in order to capture plausible ranges for the hospitalization-related modelparameters: Mean hospitalization period (γH), mean ICU period (γU), death rate ofhospitalized individuals (μH), death rate of ICU individuals (μU), proportion ofclinically hospitalized transferred to ICU (ωH) and proportion of ICU individualsthat return to clinical hospitalization (ωu) (see Supplementary Table 2).
Based on the search ranges, optimized model parameters were estimated usingthe Particle Swarm Optimization (PSO) metaheuristic40. Under the PSOframework, we used a multi-optimization function to simultaneously optimize themodel to the series of daily confirmed cases, deaths, clinical hospitalization, andICU occupations in the whole state, and to daily confirmed cases and deaths for thecapital city Salvador and the remaining 416 municipalities (given that thehospitalization series were only available aggregated at the statewide level) up toMay 4, 2020. PSO was implemented using pyswarms library version 1.1.0 forPython 341, and was executed with 300 particles through 1,000 iterations withcognitive parameter 0.1, social parameter 0.3, inertia parameter 0.9, evaluating fiveclosest neighbors through Euclidean (or L2) distance metric. In addition to thepoint estimates obtained by the PSO method for the parameters β0, β1, δ, h, γH andγU, percentile confidence intervals were also estimated for these parameters. Theintervals were constructed using the weighted non-parametric bootstrap method42,considering 500 replicates of the original series St, t= 1,…, n, which represents thenumber of new cases observed at time t. The proportion of observed cases at time t(number of cases at time t/total number of cases in the analyzed period) was usedas a weight in the re-sampling process to obtain the bootstrap replicates. Then, theSEIIHURD model was adjusted for each replicated series and the estimatesobtained for the model parameters were stored in vectors, generating the empiricaldistribution for each parameter.
Given the complexity of the proposed model, we performed an identifiabilityanalysis in terms of the number of parameters and possible correlations betweenthem. A simulation study was carried out in order to assess the identifiability of themodel presented. The study was conducted based on the approach developed byRoosa and Chowell43, which makes use of the parametric bootstrap method togenerate data from a system of dynamic equations, in order to quantify theuncertainty and assess the identifiability of the indicators of the model. Moreinformation is given in Supplementary Note 6.
Modeling scenarios. We present our analysis as follows: First, we study the effectsof previously enforced interventions in the state of Bahia, its capital city Salvadorand the remaining 416 municipalities. For this, we considered the SEIIHURDmodel with the proportion of symptomatic needing hospitalization or ICU(parameter h) equals to zero, so that the resulting model does not consider thecompartments of hospitalization, ICU, and death, effectively resembling an SEIRmodel with asymptomatic/non-detected transmission.
Then, we analyze these effects on the number of deaths and hospitalizationrequirements in the state level. We show the impact of the non-detected individualson the dynamics of COVID-19 transmission.
Lastly, to study the future behavior of the transmission of the disease in Bahia,we simulated different scenarios that may impact the number of cases, mortality,and healthcare demands. The following scenarios were considered: (1) Animmediate intervention taking place on May 5, sustained for a period of 7, 14, or30 days, and resulting in a reduction of the transmission rate by 25%, 50%, or 75%;(2) A critical intervention, adopted when the collapse of clinical bed occupancyoccurs (on May 14, 2020, the predicted date of peak demand), maintained for aperiod of 7, 14, 30, 60, 90 days and leading to a reduction of the transmission rate
NATURE COMMUNICATIONS | https://doi.org/10.1038/s41467-020-19798-3 ARTICLE
NATURE COMMUNICATIONS | (2021) 12:333 | https://doi.org/10.1038/s41467-020-19798-3 | www.nature.com/naturecommunications 11

by 25%, 50% or 75%; and (3) implementations of more than two interventions insequence.
Ethics statement. This study was conducted with publicly available data from theCOVID-19 epidemic in Bahia, obtainable from the periodic epidemiological bul-letins published by the Secretary of Health of the State of Bahia (SESAB), as well aswith aggregated administrative data from Instituto Couto Maia hospital (Salvador,Bahia), and therefore no approval by an ethics committee was required, accordingto Resolutions 466/2012 and 510/2016 (article 1, sections III, and V) from theNational Health Council (CNS), Brazil.
Reporting summary. Further information on research design is available in the NatureResearch Reporting Summary linked to this article.
Data availabilityThe series of COVID-19 cases and deaths and hospital occupancy are publicly availablefrom the State Secretary of Health of Bahia (SESAB) at https://infovis.sei.ba.gov.br/covid19/and are also available as CSV files. All other data, including the list of parameters used toinform the model, are presented within the Supplementary Material and in the GitHubrepository at https://github.com/cidacslab/Mathematical-and-Statistical-Modeling-of-COVID19-in-Brazil.git44. Raw data is included within Figs. 1, 3, 4, 5, 6, and 7. Source dataare provided with this paper.
Code availabilityCodes used to produce the results presented herein are available in a public GitHubrepository at https://github.com/cidacslab/Mathematical-and-Statistical-Modeling-of-COVID19-in-Brazil.git44, as well as in the Supplementary Material.
Received: 22 May 2020; Accepted: 26 October 2020;
References1. Dong, E., Du, H. & Gardner, L. An interactive web-based dashboard to track
COVID-19 in real time. Lancet Infect. Dis. 20, 533–534 (2020).2. Li, Q. et al. Early transmission dynamics in Wuhan, China, of novel
coronavirus-infected pneumonia. N. Engl. J. Med. 382, 1199–1207 (2020).3. Wu, J. T., Leung, K. & Leung, G. M. Nowcasting and forecasting the potential
domestic and international spread of the 2019-nCoV outbreak originating inWuhan, China: a modelling study. Lancet 395, 689–697 (2020).
4. Cowling, B. J. et al. Impact assessment of non-pharmaceutical interventionsagainst coronavirus disease 2019 and influenza in Hong Kong: anobservational study. Lancet Public Health 5, E279–E288 (2020).
5. Candido, D. S. et al. Evolution and epidemic spread of SARS-CoV-2 in Brazil.Science 369, 1255–1260 (2020).
6. Teles, A. S., Coelho, T. C. B. & Ferreira da, M. P. d. S. Public expenditure onhealth in Bahia: exploring evidence of inequalities. Saúde. em Debate 41,457–470 (2017).
7. Panovska-Griffiths, J. Can mathematical modelling solve the current Covid-19crisis? BMC Public Health 20, 551 (2020).
8. Ferguson, N. et al. Impact of non-pharmaceutical interventions (NPIs) toreduce COVID19 mortality and healthcare demand. http://hdl.handle.net/10044/1/77482 (2020).
9. Kermack, W. O. & McKendrick, A. G. A contribution to the mathematicaltheory of epidemics. Proc. R. Soc. Lond. (Ser. A) 115, 700–721 (1927).
10. Li, R. et al. Substantial undocumented infection facilitates the rapiddissemination of novel coronavirus (SARS-CoV-2). Science 368, 489–493 (2020).
11. Eikenberry, S. E. et al. To mask or not to mask: modeling the potential for facemask use by the general public to curtail the COVID-19 pandemic. Infect. Dis.Model. 5, 293–308 (2020).
12. Leung, K., Wu, J. T., Liu, D. & Leung, G. M. First-wave COVID-19transmissibility and severity in China outside Hubei after control measures,and second-wave scenario planning: a modelling impact assessment. Lancet395, 1382–1393 (2020).
13. Prem, K. et al. The effect of control strategies to reduce social mixing onoutcomes of the COVID-19 epidemic in Wuhan, China: a modelling study.Lancet Public Health 5, E261–E270 (2020).
14. Berger, D. W., Herkenhoff, K. F. & Mongey, S. An SEIR infectious diseasemodel with testing and conditional quarantine. National Bureau of EconomicResearch, No. w26901 (2020).
15. Giordano, G. et al. Modelling the COVID-19 epidemic and implementation ofpopulation-wide interventions in Italy. Nat. Med. 26, 855–860 (2020).
16. Kucharski, A. J. et al. Early dynamics of transmission and control of COVID-19: a mathematical modelling study. Lancet Infect. Dis. 20, 553–558 (2020).
17. Kissler, S. M., Tedijanto, C., Goldstein, E., Grad, Y. H. & Lipsitch, M.Projecting the transmission dynamics of SARS-CoV-2 through thepostpandemic period. Science 368, 860–868 (2020).
18. Moghadas, S. M. et al. Projecting hospital utilization during the COVID-19outbreaks in the United States. Proc. Natl Acad. Sci. 117, 9122–9126 (2020).
19. Weitz, J. S. et al. Modeling shield immunity to reduce COVID-19 epidemicspread. Nat. Med. 26, 849–854 (2020).
20. Castro, M. C. et al. Demand for hospitalization services for COVID-19patients in Brazil. https://doi.org/10.1101/2020.03.30.20047662 (2020).
21. Meyerowitz-Katz, G. & Merone, L. A systematic review and meta-analysis ofpublished research data on COVID-19 infection-fatality rates. https://doi.org/10.1101/2020.05.03.20089854 (2020).
22. Centers for Disease Control and Prevention–CDC. Pandemic PlanningScenarios. CDC. https://www.cdc.gov/coronavirus/2019-ncov/hcp/planning-scenarios.html
23. Hallal, P., Hartwig, F., Horta, B., Victora, G. D. & Silveira, M. Remarkablevariability in SARS-CoV-2 antibodies across Brazilian regions: nationwideserological household survey in 27 states. medRxiv https://doi.org/10.1101/2020.05.30.20117531 (2020).
24. Cheng, H.-Y. et al. Contact tracing assessment of COVID-19 transmissiondynamics in Taiwan and risk at different exposure periods before and aftersymptom onset. JAMA Intern. Med. 180, 1156–1163 (2020).
25. Müller, M., Derlet, P. M., Mudry, C. & Aeppli, G. Using random testing tomanage a safe exit from the COVID-19 lockdown. https://doi.org/10.1101/2020.04.09.20059360 (2020).
26. Kissler, S. M., Tedijanto, C., Goldstein, E., Grad, Y. H. & Lipsitch, M.Projecting the transmission dynamics of SARS-CoV-2 through thepostpandemic period. Science 3, 433 (2020).
27. Pan, A. et al. Association of public health interventions with the epidemiologyof the COVID-19 outbreak in Wuhan. China Jama 323, 1915–1923 (2020).
28. Jorge, D. C. P. et al. Assessing the nationwide impact of COVID-19 mitigationpolicies on the transmission rate of SARS-CoV-2 in Brazil. https://doi.org/10.1101/2020.06.26.20140780 (2020).
29. Oliveira, J. F. et al. Interdependence between confirmed and discarded cases ofdengue, chikungunya and Zika viruses in Brazil: a multivariate time-seriesanalysis. PloS ONE 15, e0228347 (2020).
30. Tang, J. W., Li, Y., Eames, I., Chan, P. K. S. & Ridgway, G. L. Factors involvedin the aerosol transmission of infection and control of ventilation inhealthcare premises. J. Hospital Infect. 64, 100–114 (2006).
31. Stelfox, H. T. et al. Assessment of the safety of discharging select patientsdirectly home from the intensive care unit: a multicenter population-basedcohort study. JAMA Intern. Med. 178, 1390–1399 (2018).
32. Diekmann, O. & Heesterbeek, J. A. P.Mathematical Epidemiology of InfectiousDiseases: Model Building, Analysis and Interpretation 5 (John Wiley & Sons,2000).
33. Chowell, G., Hengartner, N. W., Castillo-Chavez, C., Fenimore, P. W. &Hyman, J. M. The basic reproduction number of Ebola and the effects ofpublic health measures: the cases of Congo and Uganda. J. Theor. Biol. 229,119–126 (2004).
34. Van den Driessche, P. & Watmough, J. Reproduction numbers and sub-threshold endemic equilibria for compartmental models of diseasetransmission. Math. Biosci. 180, 29–48 (2002).
35. Bao, L., Deng, W., Gao, H., Xiao, C. & Liu, J. Reinfection could not occur inSARS-CoV-2 infected rhesus macaques. https://doi.org/10.1101/2020.03.13.990226 (2020).
36. Wallinga, J. & Lipsitch, M. How generation intervals shape the relationshipbetween growth rates and reproduction numbers. Proc. R. Soc. B: Biol. Sci.274, 599–604 (2007).
37. Brauer, F. Age of infection in epidemiology models. Electron. J. DifferentialEqu. (EJDE) [Electron. only] 2005, 29–37 (2005).
38. Sobol, I. M. Global sensitivity indices for nonlinear mathematical modelsand their Monte-Carlo estimates. Math. Computers Simul. 55, 271–280(2001).
39. Herman, J. & Usher, W. SALib: an open-source Python library for sensitivityanalysis. J. Open Source Softw. 2, 97 (2017).
40. Eberhart, R. & Kennedy, J. A new optimizer using particle swarm theory. InMHS’95. Proc. 6th International Symposium on Micro Machine and HumanScience, 39–43 (1995).
41. Miranda, L. PySwarms: a research toolkit for particle swarm optimization inPython. J. Open Source Softw. 3, 433 (2018).
42. Davison, A. C., Hinkley, D. V. & Young, G. A. Recent developments inbootstrap methodology. Stat. Sci. 18, 141–157 (2003).
43. Roosa, K. & Chowell, G. Assessing parameter identifiability in compartmentaldynamic models using a computational approach: application to infectiousdisease transmission models. Theor. Biol. Med. Model. 16, 1 (2019).
44. Oliveira, J. F. et al. Mathematical modelling of COVID-19 in 14.8 millionindividuals in Bahia, Brazil. GitHub Repository: Mathematical and StatisticalModeling of COVID19 in Brazil (2020).
ARTICLE NATURE COMMUNICATIONS | https://doi.org/10.1038/s41467-020-19798-3
12 NATURE COMMUNICATIONS | (2021) 12:333 | https://doi.org/10.1038/s41467-020-19798-3 | www.nature.com/naturecommunications

AcknowledgementsThis study was financed in part by the Coordenação de Aperfeiçoamento de Pessoalde Nível Superior—Brazil (CAPES)—Finance Code 001. STRP was supported by anInternational Cooperation grant (process number INT0002/2016) from BahiaResearch Foundation (FAPESB). STRP and RFSA were supported by the NationalInstitute of Science and Technology—Complex Systems from CNPq, Brazil. JFO wassupported by the Center of Data and Knowledge Integration for Health (CIDACS)through the Zika Platform—a long-term surveillance platform for Zika virus andmicrocephaly (Unified Health System (SUS), Brazilian Ministry of Health). AASAgratefully acknowledges the financial support received from the Engineering andPhysical Sciences Research Council (EPSRC) in the form of grant EP/R002134/1.The authors acknowledge the helpful suggestions from members of the CoVidaNetwork (http://www.redecovida.org), in special to contributors to the Rede CoVidaModelling Task-force (See Supplementary Note 1). Andris K. Walter is gratefullyacknowledged for English language revision and manuscript copy-editingassistance.
Author contributionsJ.F.O., S.T.R.P., P.I.P.R., and R.F.S.A. conceived and designed the study. J.F.O., D.C.P.J.,R.V.V., D.S.S., M.S.R., M.F.T., N.B.S., R.L.F., F.A.C.P., C.P.C., A.S.S.P., A.A.S.A.,E.A.B.F.L., P.I.P.R., R.F.S.A., and S.T.R.P. performed the analysis. J.F.O. and P.I.P.R.wrote the first draft of the manuscript, which was reviewed by L.L.C., N.B.S., S.T.R.P.,and R.F.S.A. All authors participated in the discussion of the results and contributed tothe revision of the final manuscript.
Competing interestsThe authors declare no competing interests.
Additional informationSupplementary information is available for this paper at https://doi.org/10.1038/s41467-020-19798-3.
Correspondence and requests for materials should be addressed to J.F.O.
Peer review information Nature Communications thanks Rowland Kao and the other,anonymous reviewer(s) for their contribution to the peer review of this work.
Reprints and permission information is available at http://www.nature.com/reprints
Publisher’s note Springer Nature remains neutral with regard to jurisdictional claims inpublished maps and institutional affiliations.
Open Access This article is licensed under a Creative CommonsAttribution 4.0 International License, which permits use, sharing,
adaptation, distribution and reproduction in any medium or format, as long as you giveappropriate credit to the original author(s) and the source, provide a link to the CreativeCommons license, and indicate if changes were made. The images or other third partymaterial in this article are included in the article’s Creative Commons license, unlessindicated otherwise in a credit line to the material. If material is not included in thearticle’s Creative Commons license and your intended use is not permitted by statutoryregulation or exceeds the permitted use, you will need to obtain permission directly fromthe copyright holder. To view a copy of this license, visit http://creativecommons.org/licenses/by/4.0/.
© The Author(s) 2021
NATURE COMMUNICATIONS | https://doi.org/10.1038/s41467-020-19798-3 ARTICLE
NATURE COMMUNICATIONS | (2021) 12:333 | https://doi.org/10.1038/s41467-020-19798-3 | www.nature.com/naturecommunications 13