mathematical model to analyze the heat transfer in tunnel
TRANSCRIPT

Mathematical Model to Analyze the Heat Transfer in
Tunnel Kilns for Burning of Ceramics
Dissertationzur Erlangung des akademischen Grades
Doktoringenieur(Dr.-Ing.)
von M.Sc. Hassanein Abdel Mohsen Hassanein Refaeygeb. am 7. February 1978 in Qaliubiya, Agypten
genehmigt durch die Fakultat fur Verfahrens- und Systemtechnikder Otto-von-Guericke-Universitat Magdeburg
Prufungskommission:Prof. Dr.-Ing. Eckehard Specht (Gutachter und Betreuer)Prof. Dr.-Ing. Gerd Walter (Gutachter)Dr.-Ing. Anne Tretau (Gutachterin)Prof. Dr.-Ing. Dominique Thevenin (Vorsitzender)
eingereicht am: 05.02.2013Promotionkolloquium am: 02.05.2013

II

Preface
This dissertation is submitted to Otto von Guericke University Magdeburg for thedegree of Doctor of Engineer. The research described herein was conducted under thesupervision of Prof. Eckehard Specht between September 2009 and January 2013. Tothe best of my knowledge, this work is original, except where suitable references aremade to previous works. Neither this, nor any substantially similar dissertation has beensubmitted for any degree, diploma or qualification at any other university or institution.
Hassanein RefaeyMagdeburg, Germany30 January 2013
Don’t think of it as being outnumbered, think of it as a wide target selection.

IV

Acknowledgement
Firstly, I would like to express my thankfulness and gratitude to my country Egypt forthe financial support during my research. Without that, I was not able to work andresearch here in Germany.
I am extremely grateful to my sincere gratitude and appreciation to my supervisor(Doktorvater); Prof. Dr.-Ing. Eckehard Specht, for his continual support, encouragementand guidance. His strong motivation, creativity and rich knowledge and experienceenriched my confidence level to solve many complex problems in effective ways. Moreover,his knowledge, experience, guidance, friendly personality, and patience have benefitedme immensely.
Further acknowledgment goes to Prof. Dr.-Ing. Dominique Thevenin who tookover the chair in examination committee. I would also like to express my deepestgratefulness to Prof. Dr.-Ing. habil. Dr. h.c. Gerd Walter for his repetitive support,for reviewing this dissertation and for valuable comments and suggestions. I am deeplygrateful to Dr.-Ing. Anne Tretau for her elaborated review of my thesis and constructivecomments.
I wish to thank all my colleagues in the Institute for Fluid Dynamics and Ther-modynamics, Otto von Guericke University Magdeburg for their assistance, friendshipand many happy and enjoyable times. Furthermore, special thanks go to our friendlysecretary; Christin Hasemann for her help.
I also would like to thank all my Egyptian friends in Magdeburg for their endlesssharing and companionship and also to all my friends here in Germany and in Egypt.
Last but not least, I would like to take this opportunity to express my warmthankfulness to my father Abd Elmohsen Refaey, my mother Magda Eliwa, to mywife; Eman Elnagdy, to my sweetheart’s daughters; Sondos and Nada, to my brotherAhmed, to my sisters; Mervat, Manal, and Samah, and to every member in myfamily for their unconditional love and support.
Hassanein RefaeyMagdeburg, Germany30 January 2013

VI

Contents
Preface III
Acknowledgement V
List of Contents IX
Nomenclature XI
Abstract XV
Zusammenfassung XVII
1 Introduction 11.1 Introduction . . . . . . . . . . . . . . . . . . . . . . . . . . . . . . . . . . . 11.2 Ceramic . . . . . . . . . . . . . . . . . . . . . . . . . . . . . . . . . . . . . 2
1.2.1 Ceramic classification . . . . . . . . . . . . . . . . . . . . . . . . . . 21.2.2 Ceramic production stages . . . . . . . . . . . . . . . . . . . . . . . 51.2.3 Firing process in ceramic production . . . . . . . . . . . . . . . . . 5
1.3 Tunnel kiln . . . . . . . . . . . . . . . . . . . . . . . . . . . . . . . . . . . 71.3.1 Introduction . . . . . . . . . . . . . . . . . . . . . . . . . . . . . . . 71.3.2 Tunnel kiln history . . . . . . . . . . . . . . . . . . . . . . . . . . . 81.3.3 Tunnel kiln description . . . . . . . . . . . . . . . . . . . . . . . . . 101.3.4 Energy consumption . . . . . . . . . . . . . . . . . . . . . . . . . . 11
1.4 Motivation . . . . . . . . . . . . . . . . . . . . . . . . . . . . . . . . . . . . 12
2 Literature Review 132.1 Heat transfer . . . . . . . . . . . . . . . . . . . . . . . . . . . . . . . . . . 13
2.1.1 Convective heat transfer of setting in tunnel kiln . . . . . . . . . . . 132.1.2 Numerical and analytical studies . . . . . . . . . . . . . . . . . . . 16
2.2 Mathematical models for tunnel kiln . . . . . . . . . . . . . . . . . . . . . 192.3 Mathematical models for burning zone . . . . . . . . . . . . . . . . . . . . 222.4 Numerical simulation for tunnel kiln . . . . . . . . . . . . . . . . . . . . . 242.5 Modeling and control systems for tunnel kiln . . . . . . . . . . . . . . . . . 262.6 Energy saving in tunnel kiln . . . . . . . . . . . . . . . . . . . . . . . . . . 282.7 Conclusions on literature review . . . . . . . . . . . . . . . . . . . . . . . . 29
3 Simplified Mathematical Model for Tunnel Kilns 313.1 Introduction . . . . . . . . . . . . . . . . . . . . . . . . . . . . . . . . . . . 313.2 Energy balance . . . . . . . . . . . . . . . . . . . . . . . . . . . . . . . . . 313.3 Simple analysis case A (firing zone zero) . . . . . . . . . . . . . . . . . . . 33

VIII
3.3.1 Description of the case . . . . . . . . . . . . . . . . . . . . . . . . . 333.3.2 Temperature profile . . . . . . . . . . . . . . . . . . . . . . . . . . . 343.3.3 Analytical solution for Ω = 1 . . . . . . . . . . . . . . . . . . . . . 363.3.4 Analytical solution for different Ω . . . . . . . . . . . . . . . . . . . 39
3.4 Effect of firing zone length . . . . . . . . . . . . . . . . . . . . . . . . . . . 423.4.1 The whole kiln is the firing zone : Case B . . . . . . . . . . . . . . 423.4.2 Firing zone length equal to preheating zone: Case C . . . . . . . . 473.4.3 Different firing zone length . . . . . . . . . . . . . . . . . . . . . . . 50
4 Heat Transfer Modeling for Vitrified Clay Pipes Kiln 534.1 Introduction . . . . . . . . . . . . . . . . . . . . . . . . . . . . . . . . . . . 534.2 Modeling of heat transfer . . . . . . . . . . . . . . . . . . . . . . . . . . . . 544.3 Convective heat transfer analysis . . . . . . . . . . . . . . . . . . . . . . . 56
4.3.1 Vitrified clay pipes . . . . . . . . . . . . . . . . . . . . . . . . . . . 564.3.2 Supported cylinders . . . . . . . . . . . . . . . . . . . . . . . . . . . 584.3.3 Nusselt number determination . . . . . . . . . . . . . . . . . . . . . 58
4.4 Radiative heat transfer analysis . . . . . . . . . . . . . . . . . . . . . . . . 604.4.1 Introduction . . . . . . . . . . . . . . . . . . . . . . . . . . . . . . . 604.4.2 Gas to solid radiation calculations . . . . . . . . . . . . . . . . . . . 614.4.3 Solid to solid radiation . . . . . . . . . . . . . . . . . . . . . . . . . 634.4.4 Radiative heat transfer determination . . . . . . . . . . . . . . . . . 67
4.5 Simple case analysis for pipes only . . . . . . . . . . . . . . . . . . . . . . 674.6 Heat transfer analysis results . . . . . . . . . . . . . . . . . . . . . . . . . . 69
5 Vitrified Clay Pipes Analysis 715.1 Introduction . . . . . . . . . . . . . . . . . . . . . . . . . . . . . . . . . . . 715.2 Burning zone analysis . . . . . . . . . . . . . . . . . . . . . . . . . . . . . . 71
5.2.1 ODE for first gas stream (gasI) . . . . . . . . . . . . . . . . . . . . 715.2.2 ODE for second gas stream (gasII) . . . . . . . . . . . . . . . . . . 745.2.3 ODEs for solids . . . . . . . . . . . . . . . . . . . . . . . . . . . . . 76
5.3 Preheating zone analysis . . . . . . . . . . . . . . . . . . . . . . . . . . . . 795.3.1 ODE for first gas stream (gasI) . . . . . . . . . . . . . . . . . . . . 795.3.2 ODE for second gas stream (gasII) . . . . . . . . . . . . . . . . . . 805.3.3 ODEs for solids . . . . . . . . . . . . . . . . . . . . . . . . . . . . . 81
5.4 Numerical solution results . . . . . . . . . . . . . . . . . . . . . . . . . . . 835.4.1 Results for radiative heat transfer calculations only . . . . . . . . . 835.4.2 Results for all system . . . . . . . . . . . . . . . . . . . . . . . . . . 87
6 Sanitaryware Kiln 916.1 Introduction . . . . . . . . . . . . . . . . . . . . . . . . . . . . . . . . . . . 916.2 Case ”A,new” with the new concept . . . . . . . . . . . . . . . . . . . . . . 92
6.2.1 Description of the case . . . . . . . . . . . . . . . . . . . . . . . . . 926.2.2 The ordinary differential equations for gas and solid . . . . . . . . . 926.2.3 Numerical solution . . . . . . . . . . . . . . . . . . . . . . . . . . . 96
6.3 Case ”C,new” with the new concept . . . . . . . . . . . . . . . . . . . . . . 976.3.1 Description of the case . . . . . . . . . . . . . . . . . . . . . . . . . 976.3.2 Numerical solution for case ”C,new” . . . . . . . . . . . . . . . . . 98
6.4 Heat Transfer Analysis for Sanitaryware Kiln . . . . . . . . . . . . . . . . . 1016.4.1 Burning zone analysis . . . . . . . . . . . . . . . . . . . . . . . . . 101

IX
6.4.2 Preheating zone analysis . . . . . . . . . . . . . . . . . . . . . . . . 1036.4.3 Numerical solution results . . . . . . . . . . . . . . . . . . . . . . . 103
6.5 Flow field simulation with CFD . . . . . . . . . . . . . . . . . . . . . . . . 1056.5.1 Introduction . . . . . . . . . . . . . . . . . . . . . . . . . . . . . . . 1056.5.2 CFD results . . . . . . . . . . . . . . . . . . . . . . . . . . . . . . . 108
7 Conclusions and Outlook 1117.1 Summary . . . . . . . . . . . . . . . . . . . . . . . . . . . . . . . . . . . . 1117.2 Conclusions . . . . . . . . . . . . . . . . . . . . . . . . . . . . . . . . . . . 1117.3 Outlook . . . . . . . . . . . . . . . . . . . . . . . . . . . . . . . . . . . . . 112
A Boundary Value Problem Solver (BVP) 113
Bibliography 114
Curriculum Vitae 119

X

Nomenclature
Only commonly used symbols are listed below. The meanings of all other symbols aredefined explicitly within the text.
Latin letter symbols
A area, m2
Az area per unit length, m2/mAT
transverse area, m2
a1 slope of the equationBk kiln width, mBc car width, mc specific heat, kJ/(kg·K)cpg specific heat of gas, kJ/(kg·K)cpgo specific heat of air, kJ/(kg·K)cT specific heat of transportation, kJ/(kg·K)cs specific heat of solids, kJ/(kg·K)D pipe outside diameter, md cylinder diameter, mE specific energy consumption, MJ/kge exponential functionFa tubes arrangement factorFcyl→pl view factor from cylinder to perforated plateFfc→pl view factor from fire clay plate to perforated plateFpl→p view factor from perforated plate to pipef percentage, %
H enthalpy flow, kW
dH change in enthalpy flow, kWHk kiln height, mHp pipe height, mhcyl cylinder height, mhfc fire clay height, mhu lower heating value of fuel, kJ/kgL air demand, kg
air/kg
fuel
Lc characteristic length, mLf firing length, mLk kiln length, mLpre preheating length, m

XII
M mass flow rate, kg/smbar millibar, 100N/m2
N total number of pipesNc number of columnsNcars number of carsNcyl number of cylinders per car, cylinders/carNpcars number of pipes per car, pipes/carNr number of rowsNu Nusselt number (hD/k)Nu
DNusselt number based on pipe diameter (hD/k)
P pressure, barPr Prandtl number for gases determined at gas temperature (cpµ/λg)Prs Prandtl number based on surface temperature
Qw wall heat loss, kW
dQ change in heat transfer, kWRe Reynolds number (vD/ν)St Stanton numbers beam length, mSD
diagonal pitch, mSL
longitudinal pitch, mST
transverse pitch, mtd thermal diffusivity, m2/sT temperature, KV volume, m3
wa air velocity, m/swg gas free stream velocity, m/swmax gas maximum velocity, m/sXT
transportation percentage, %
X volume concentration of the gasZ dimensionless lengthz independent variable
Greek symbols
α heat transfer coefficient, W/(m2·K)ε emissivityλ excess air numberλg thermal conductivity of gas, W/(m·K)µg dynamic viscosity of gas, kg/(m·s)νg kinematic viscosity of gas, m2/sΩ heat capacity ratioΩ′ inverse of heat capacity ratioΦ factorρ density, kg/m3
σ Stefan-Boltzmann constant, W/(m2·K4)ϕL
dimensionless longitudinal pitch (SL/D)ϕT
dimensionless transverse pitch (ST/D)

XIII
Subscripts
a airad adiabaticb burningcyl cylinderconv convectiond diameterD diameterEq equationF fuelFig figuref firingfc fire clay plateg gasi innerin inletk kilnm constantmax maximumn constantno nozzlenc constantnµ constantnλ constantout outletp pipepl platepre preheatingpro productsr radiations solidt totalw wallz element in z direction
Abbreviations
1D one dimensionBVP boundary value problembvp4c boundary value problem four conditionCFD computational fluid dynamicsEq equation

XIV
Eqs equationsCFD computational fluid dynamicsFig figureODE ordinary differential equationODEs ordinary differential equationsNG natural gasSTP standard temperature and pressure

Abstract
An analysis of preheating and burning processes in tunnel kilns was done to developa simple mathematical model which can be used to predict gas and solid temperatureprofiles. In the simple model three special cases were studied. In the first case of no firinglength, a system of ordinary differential equations was established to simulate the processin the kiln. In addition the analytical solution for that system was also obtained. Themodel estimated the energy consumption for that case. The second case was establishedto consider the kiln as a firing zone and obtaining its system of the ordinary differentialequations (ODEs). As a consequence, the energy consumption for different excess airnumber was represented. The third case was done to the kiln with firing zone equal topreheating zone.
Moreover, the model studied the effect of the firing zone length on the energyconsumption. It was evident that the energy consumption always increases pro-gressively with the firing zone length. Therefore, up to approximately ∼30 %, theincrease is relatively low and as a consequence, the firing zone length should be asshort as possible for low energy consumption. In order solve all the foregoing ODEssystems to obtain the temperature profile MATLAB was used, specifically the bvp4c code.
The heat transfer mechanism is complex inside the tunnel kiln, due to the interac-tions of kiln car, kiln furniture, product types and product arrangements in the kiln.Therefore, it is important to establish a model to analyze the heat transfer in the kiln.Moreover, the type, the shape, and the arrangement of products are important in theanalysis calculations. Consequently, the vitrified clay pipes were taken as a product of asimple shape to analyze the heat transfer. The system in this case included not only theODEs for the product but also for the kiln furniture materials. The temperature profilesfor products and kiln furniture were represented as well as gases temperature profiles.The heat transfer coefficients for both convection and radiation have been calculatedalong the two zones.
A simple mathematical model has been done for the two zones with an air addi-tion along the preheating zone for the Sanitaryware kiln. A comparison between the newmodel results and the simple mathematical model results have been done to show theeffect of this air addition on the energy consumption.
A computational fluid dynamics (CFD) was established for the Sanitaryware kilnto study the gas circulation in the cross section. The 3D simulations were carried outwith the commercial software package FLUENT 6.3 for the preheating zone to show theflow field around the Sanitaryware. The flow field is distinctly visualized by images ofvelocity vectors. The CFD results showed that there was a good mixing of the gases

XVI
around the Sanitaryware. The study demonstrates simulation upon a scalable segmentgeometric model is capable of providing the main flow feature in the preheating zoneof Sanitaryware kiln, which is nearly impossible to study in experimental setups. Theaverage velocity inside the observed domain is low, around 1 m/s.

Zusammenfassung
In dieser Arbeit wird der Aufheiz- und Brennvorgang in Tunnelofen analysiert. Es wirdein vereinfachtes mathematisches Modell entwickelt, das auf Grundlage von Energie- undMassenbilanzen das axiale Temperaturprofil anhand eines Systems von gewohnlichenDifferentialgleichungen beschreibt. Dabei werden drei gesonderte Falle betrachtet. Dererste Fall beschreibt den Ofenprozess, wenn die Lange der Brennzone sehr klein ist. Somitwird von einem punktformigen Warmeeintrag am Ende der Aufheizzone ausgegangen.Im zweite Fall wird der gesamte betrachtete Ofenabschnitt als Brennzone angenommen,so dass die zugefuhrten Brenngase gleichmaßig auf die Ofenlange verteilt werden. Derdritte Fall geht von einer gleichlangen Aufheiz- und Brennzone aus. Die Brenngase werdedaher in der zweiten Halfte des Ofens eingebracht.
Der Energieverbrauch wird in Abhangigkeit von wichtigen Betriebsparametern, wiez. B. der Luftzahl und der Lange der Brennzone, dargestellt. Es wird gezeigt, dass derEnergieverbrauch mit der Lange der Brennzone progressiv zunimmt. Dadurch steigt derEnergieverbrauch nur langsam an, wenn der Anteil der Brennzonenlange im betrachtetenOfenabschnitt klein ist. Ein geringer Energieverbrauch kann somit erreicht werden,wenn die Lange der Brennzone minimiert wird. Zur Losung der Differentialgleichungenwurde MATLAB, speziell der Loser ”bvp4c”, verwendet, um die Temperaturprofile dereinzelnen Stoffstrome im Tunnelofen anhand gegebener Randbedingungen berechnen zukonnen.
Der Warmeubergangsmechanismus in Tunnelofen ist komplex, da hier der Ofen-wagen, das Brenngut sowie die Transporthilfsmittel in Wechselwirkung stehen. Eswird ein Modell zur Beschreibung des Warmeubergangs prasentiert, das anhand vonSteinzeugrohren die Art, die Form und den Besatz des Brenngutes berucksichtigt.Neben dem Gas- und Produktstrom werden hier Differentialgleichungen zur Bestimmungder Temperaturprofile des Ofenwagens und der Transporthilfsmittel angegeben. DerWarmeubergangskoeffizient durch Konvektion sowie Strahlung konnte dadurch entlangder Aufheiz- und Brennzone bestimmt werden.
Des Weiteren wurde ein einfaches mathematisches Modell entwickelt, welches einezusatzliche Luftzufuhr in der Aufheizzone von Tunnelofen fur Sanitarware berucksichtigt.Ein Vergleich zu den vorherigen Ergebnissen zeigt den Einfluss dieser zusatzlichenLuftzufuhr auf den Energieverbrauch. Anschließend wurde eine numerische Simulationder Gaszirkulation (CFD) im Querschnitt eines solchen Tunnelofenabschnitts mit demSoftwarepaket FLUENT 6.3 durchgefuhrt. Durch die drei-dimensionale Simulation kannunter anderem das Geschwindigkeitsfeld durch Vektoren in der Nahe der Sanitarwarevisualisiert werden. Die Simulationsergebnisse zeigen, dass die Sanitarware vom Gas gutumstromt wird. Außerdem demonstriert diese Untersuchung, dass durch die numerische

XVIII
Simulation die Beschreibung der Stromungseigenschaften in der Aufheizzone von Ofenfur Sanitarware, die durch Experimente nahezu nicht bestimmbar sind, moglich ist. Diemittlere Stromungsgeschwindigkeit im untersuchten Bereich ist gering und liegt bei etwa1 m/s.

Chapter 1
Introduction
1.1 Introduction
Reducing energy consumption is one of the most important priorities of modern life.Therefore, it is of interest to reduce energy consumption in industrial processes, especiallyof ceramic products, which play a significant role in everyday human life. For example,there are numerous commonly used ceramic products including:
• refractory bricks
• high voltage electrical insulators
• roof tiles
• wall and floor tiles
• sanitary ware
• vitrified clay products
• table-and ornamental ware (household ceramics)
• technical ceramics.
The energy consumption for each type of product fluctuates greatly between the productsof ceramics. For example, the maximum energy consumed for production of technicalceramic is 50 MJ/kgs and the minimum energy consumed for the production of wall andfloor tiles is 2.3 MJ/kgs, even though these two products are produced in tunnel kilnand have the same production sequences. In addition, the two most important productrequirements for customers are high quality and low cost. Furthermore, environmentalconstraints, in terms of reducing emissions of the combustion process of the kilns con-stitute a restriction on design and calculations. Moreover, due to the high energy price,caused by the energy crisis, energy consumption in the tunnel kiln has to be reduced.Experimentation is also difficult in tunnel kiln, they can reach a length of 180 meters andhave production cycles that can last days. In addition, the cost of experiments in thetunnel kiln is high. Also optimization of the process by experiments is difficult, thereforea mathematical model is required for a process simulation to find a solution for energyreduction. According to the large dimension of tunnel kiln, it is difficult to apply com-mercial CFD codes which need high computational time. As a solution, specific codesand models to solve the thermal problem involved in the tunnel kiln was developed.

2 Introduction
1.2 Ceramic
Ceramic products are one of the most commonly used products in daily life and industry.The word ceramic [1] is a word derived from the Greek word (keramikos) which meanspottery. ”Ceramic” can be used to indicate making things from minerals. Pottery andbricks were found in ancient Roman, Chinese, Japanese civilizations and used for buildingtowers of temples and palaces. The pharaohs’ in ancient Egypt used glazed ceramic platesas wall decorations for the pyramids. In addition, porcelain making has been known byancient Chinese people. Today ceramics include numerous products with a small fractionof clay or none at all. The following sections discuss ceramic classifications, productionstages, and the firing process.
1.2.1 Ceramic classification
There are two kinds of ceramic classifications: traditional ceramics and ceramic products.There is also a different classification of ceramic [2]. These classifications are inorganicand non-metallic solids which subjected to high temperature in manufacture and/oruse. Ceramics can also be porous or vitrified, glazed or unglazed. The compositions ofmost common ceramics are oxides, carbides, and nitrides. Ceramic processing generallyinvolves high temperatures, to produce heat resistance materials or refractory.
Ceramic products are produced from unrefined clay and combinations of refinedclay and powdered or granulated non-plastic minerals. In traditional ceramics, the claycontent exceeds 20 percent. There are two general kinds of traditional ceramics [3]
• Pottery
• Whiteware.
Pottery : Ceramics that contains clay and are not used for structural, technical, orrefractory purposes. The term ceramics is used to describe materials of the potteryindustry. Pottery could be called in some classifications as heavy ceramics [4].
Whiteware : This type refers to ceramic ware that is white, Ivory, or light gray in colorafter firing. Whiteware could be called in some classifications as fine ceramics [4] asshown in Fig. 1.1. Whiteware could be further divided to earthenware, stoneware,chinaware, porcelain, and technical ceramics. The following paragraphs explain eachof them [4].
• Earthenware: Glazed or unglazed nonvitreous (porous) clay-based ceramicware. It has many applications such as artware, kitchenware, ovenware, table-ware, and tile.
• Stoneware: This type is vitreous or semivitreous ceramic ware of fine texture.Primarily produced from non-refractory fire clay or some combination of clays,fluxes, and silica that when fired has properties similar to stoneware made fromfire clay as shown in Fig. 1.2. There are a various applications for stoneware in-cluding: art-ware, chemical ware, cookware, drainpipe, kitchenware, tableware,and tile.

Introduction 3
Figure 1.1: Classification of ceramic materials [4].
Figure 1.2: Vitrified clay pipes [5].
• Chinaware: It is a vitreous ceramic ware of zero or low absorption after firingthat is used for non-technical applications. Chinaware has some applicationsinclude art-ware, ovenware, sanitary ware (Fig. 1.3), and tableware.
• Porcelain: Can be defined as glazed or unglazed vitreous ceramic ware. Porce-lain is used primarily for technical purposes. Figure 1.4 shows some applica-

4 Introduction
Figure 1.3: Sanitary ware [6].
tions of porcelain which also include artware, ball mill balls, ball mill liners,chemicalware, insulators, and tableware.
Figure 1.4: Porcelain [7].
• Technical ceramics: It includes vitreous ceramic whiteware which used inelectrical insulation and electronic pieces production. This technical ceramicssupply elements for the aerospace and automotive industries (engine parts,catalyst carriers), biomedical products [8] (bone replacement) as shown inFig. 1.5 and many other applications.

Introduction 5
Figure 1.5: Technical ceramics products (a)Biomedical implants (b) Fixed partial denture,or ”bridge” [8].
Ceramic products made from highly refined natural or synthetic compositions and de-signed to have special properties. Advanced ceramics can be classified according to itsapplication as electrical, magnetic, optical, chemical, thermal, mechanical, biological, andnuclear. Most ceramic products are clay-based and are made from single clay or moreclay mixed with mineral modifiers such as quartz and feldspar. The types of commercialclays used for ceramics are primarily kaolin and ball clay.
1.2.2 Ceramic production stages
Production of ceramic products has main steps which are largely independent of thematerials used and the type of final product. Figure 1.6 schematically shows the typicalprocess and possible or necessary supply and disposal facilities. The process consists ofthe following steps: mining of raw material, transportation and storage of raw material,preparation of raw material, shaping, drying, surface treatment, firing, and subsequenttreatment [9].
1.2.3 Firing process in ceramic production
One of the most important stages in ceramic production is the firing process whichcould be called as sintering process. Firing process controls many properties of thefinal ceramic products such dimensional stability, mechanical strength, fire resistance,resistance to water and chemicals, and abrasion resistance. There are a lot of parameterswhich affect the firing process including temperature, pressure, time, and the surroundingatmosphere. The firing process is thermally activated and depends upon the temperaturelevel and upon the time of holding of the solid material at this temperature. The effectof firing time appears in the structure of ceramic products. Using conventional methods,a short firing time produces porous and low density products while long firing times

6 Introduction
(Best Available Techniques)
Figure 1.6: Schematic diagram represents ceramic production stages [9].
produces a coarse-grained product.
Often two methods are used in firing, conventional firing and pressure firing. Thefollowing paragraph concentrates on conventional firing, because it is most widely used

Introduction 7
method.
In conventional firing, the green ceramic is heated up to approximately two-thirds of the melting point of the material at ambient pressure and holding it for aspecified time in the kiln [3]. Various fuels are used to obtain the temperatures necessaryfor the firing process in conventional firing, natural gas and oil are the most popular. Inaddition, solid fuels, biogas/biomass, and electric power are also used for heat generationin some cases. However, most of modern kilns now use natural gas because it is cleaner,efficient, and easy to control during firing process. Natural gas and electric heating canbe fitted, adjusted, and controlled by computerized program during the firing process [3].Typically, gas and electric kilns are common for smaller scale production. Severalmethods are used for the firing process including pressure firing, plasma firing, microwavefiring, hot forging, and infrared firing in addition to conventional firing. Due to highercost of pressure firing, it is usually reserved for manufacturing ceramics that are difficultto fire to high density with conventional firing. Figure 1.7 shows the industrial maturingtemperatures ranges for different product groups.
Figure 1.7: Firing temperature for different ceramic products [4].
1.3 Tunnel kiln
1.3.1 Introduction
Tunnel kiln is one of the basic continuously operated kilns in the firing process. Tunnelkiln is a long structure in which only the central portion is directly heated. The wareenters the kiln and is slowly transported through it, and then the temperature of ware isincreased steadily as it approaches the central of the kiln which considered as the highesttemperature section of the kiln. The temperature is reduced until the products exit the

8 Introduction
kiln near room temperature. Tunnel kilns are considered as the most energy-efficient kilnsbecause the heat given off during cooling part is used for all previous drying processes.Figure 1.8 shows a schematic diagram of the tunnel kiln. The different parts of the kiln,the charging, and discharging track are labeled. The figure additionally shows the fluegas passage and the stack which withdraw the flue gas.
Figure 1.8: Schematic description of tunnel kiln layout [9].
1.3.2 Tunnel kiln history
The history of tunnel kiln design can be traced back to the early 20 thcentury since then thedesign has been continuously enhanced to increase its productivity, product efficiency, andquality. Optimization of the size of kilns, capacity, and rate of firing are still in progress,as shown in Fig. 1.9, photo taken at KERAMAG Company. Tunnel kilns, are a type ofmodern kilns which look like a tunnel. They are about (90-130 m) long, (3-4.25 m) wide,and (2.4-3.6 m) high (inside dimension), in some cases kilns180 m long have been built.Tunnel kiln design has two schools: Firstly the American designs, or traditional design.These kilns are narrower, taller, and the burners placed in the kiln sidewalls, firing towardthe center. Secondly the European designs in which kilns are generally lower and widerthan the American design, the burners are located in the kiln roof and firing straightdownward [10].
In the middle of 20 thcentury, the tunnel kiln replaced other types of old kilns and be-came the most popular kiln at the beginning of the 20 thcentury. The constructions andinsulation materials of old tunnel kilns were commonly from refractory bricks as shownin Fig. 1.10.The figure shows the kiln car with wares and also shows the fire in the firing

Introduction 9
Figure 1.9: Old tunnel kiln (this photo had been taken at KERAMAG Company).
zone of the kiln. Figure 1.11 shows photo for such new design in which the kiln is openedand has no doors on both sides, photo taken at KERAMAG Company.
Figure 1.10: Tunnel kiln cross section [11].

10 Introduction
Figure 1.11: Tunnel kiln new conception (this photo had been taken at KERAMAGCompany).
1.3.3 Tunnel kiln description
Tunnel kiln consists of three main zones; Preheating zone, Firing zone and Cooling zone.The three zones will be described in more details in the following sections.
• Preheating zone: This zone considers the first zone in tunnel kiln, whereas thegreen products enter the kiln on the kiln car. The temperature of these greenproducts increases gradually to a certain temperature due to contact with flue gaseswhich coming from the firing zone, so it could be considered as countercurrent flowheat exchanger.
• Firing zone: The firing zone (sometimes it called sintering zone) is the main zonein the kiln, in which the green products are subjected to heat from the combustionof fuel. This zone is responsible of heating up the green products to the desiredtemperature to produce the products before leaving it. Furthermore, the productsgo inside the kiln to cooling zone continuously.
• Cooling zone: Cooling zone play a main important role in the kiln to cool downthe product temperature. Air comes from a blower at the end side of the tunnelkiln playing the function of a countercurrent flow heat exchanger. The coolingprocess has three main stages; Rapid cooling: to avoid the low-valency Fe to beoxidized. Static cooling: to avoid cracks in the products. Final cooling: toincrease the production speed and improve the productivity. After the products goout from the cooling zone all the products have to be removed from the kiln carthen the car is prepared for the next cycle of production as shown in Fig. 1.12.
The temperature profile for gas and solid inside the tunnel kiln is shown in Fig. 1.12 [12].The figure demonstrates the heat exchange between flue gases and solid in the preheating

Introduction 11
and firing zone in which the heat from flue gas preheats the solid (green ware); thereforethe solid temperature increases and the flue gas temperature decreases. On the otherhand, in the cooling zone the cooling air cools the solid coming from firing zone, sothat the solid temperature decreases and cooling air temperature increases. Both heatexchange processes are considered as countercurrent flow heat exchanger. As a result tothis, the solid on kiln cars moves continuously opposite to direction of all the gas flow.
Figure 1.12: Temperature profile of solid and gas for tunnel kiln [12].
1.3.4 Energy consumption
Due to a wide distribution of clay materials throughout Europe, ceramic products andbricks are relatively inexpensive and manufactured virtually in all Member States. A lot ofspecialized products are mainly produced in a few countries due to its higher price. Thesecountries have the necessary special raw materials, skills, and expertise. For example,a large percentage of ceramic tiles are manufactured in Italy and Spain; tableware inthe United Kingdom, Germany, and France; vitrified clay pipes in Germany, UnitedKingdom, Belgium, and the Netherlands. Ceramic industry has a big importance interms of employment and economics as shown in table 1.1 [9].
Table 1.1: Ceramics output, sales and employment figure.
Sector of Ceramic industry EU-15 Output 2000 EU-15 sales 2003 Manpower 2003
(x million tonnes) (x million EUR) (x 1000)
Wall and floor tiles 25.0 10100 69
Bricks and roof tiles 55 6800 50
Table- and ornamental ware 0.5 2000 48
Refractory products 4.5 3100 18
Sanitaryware 0.5 1900 25
Technical ceramics 0.15 2000 9
Vitrified clay pipes 0.7 300 2
Expanded clay aggregates (2002) 3.0 300 2.5
Inorganic bonded abrasives (2003) 0.04 260 3.1

12 Introduction
Energy consumption is a very important part in the production process because ceramicproduction consumes a large amount of energy. It is therefore necessary to know theamount of energy consumption due to emissions in the flue gas and then for the wholeproduction process. As a result, energy consumption is a crucial factor in the final price ofthe product. All sectors which used to produce ceramic in industry are energy intensive,as a key part of the process involves drying followed by firing to temperatures of between800 and 2000 C. For example, the manufacture of porcelain has CO2 emissions consumeenergy between less than 10 to 18% of the total cost. Another example, the manufactureof bricks has an energy cost between 17 and 25% with maximum levels of up to 30%. Thefollowing table 1.2 [9] shows the specific energy consumption in the ceramics industry inEurope.
Table 1.2: Specific energy consumption in the ceramics industry in Europe.
Sector Unit 1980 1985 1990 1995 2000 2003
Brick and roof tiles GJ/t 2.65 2.45 2.19 2.06 2.38 2.31
Wall and floor tiles GJ/t 11.78 9.16 6.76 5.45 5.74 5.60
Refractory products GJ/t 4.88 4.96 6.51 4.91 5.41 5.57
Sanitaryware GJ/t 26.56 24.214 22.27 22.76 20.88 21.87
Vitrified clay pipes GJ/t 5.75 5.77 6.10 5.23
Table- and ornamentalware GJ/t 47.56 38.91 43.46 45.18
Technical ceramics GJ/t 34.72 50.39
1.4 Motivation
Currently, saving energy is a global concern due to the soaring costs of energy. En-ergy consumption during the production process of any product affects the price of finalproduct. Obtaining accurate numerical information about tunnel kiln allows for optimaldevelopment of the kiln. Therefore, the objective of this work is to understand the processinside the kiln. The following points show the main objectives of this work:
• Create a mathematical model to simulate the process inside the kiln; therefore, thiswill be done by solving simplified equations to predict the temperature profile forboth gas and solid material.
• Rigorous numerical calculations are done to study different cases in the kiln. Fur-thermore, the analytical solution of simple case is compared with the numericalsolution.
• Study the convective heat transfer in the kiln for different operating parameters.
• Study the radiative heat transfer in the kiln and its effects on temperature distri-bution for both gas and solid materials.
• Carry out 3D flow simulation with a commercial CFD program FLUENT 6.3 forpre-heating zone in Sanitaryware kiln to visualize the flow field.
• How the process and energy consumption can be principally influenced.

Chapter 2
Literature Review
2.1 Heat transfer
2.1.1 Convective heat transfer of setting in tunnel kiln
A laboratory model of a section of a tunnel kiln has been built to investigate a correlationto calculate convective heat transfer rates in the firing of refractory by Dugwell andOakley [13]. A 1/10th scale model in which chrome-magnetite blocks have been used torepresent the blades of ware set on cars in the kiln. The data was collected from thermo-couples located in the air stream, and on the surfaces of the chrome-magnesite blocks toestimate convective heat transfer coefficients on the sides, top, and end surfaces of theblocks. The data were reported in a correlation for heat transfer to rectangular bladesof refractory differentiating between top, side, front, and back surfaces as shown in Eq. 2.1.
Nu = cReb (2.1)
Whereb and c are constants which include the dependency on Prandtl number and on settinggeometry. Table 2.1 shows the values of b and c for setting pattern number 1.
Table 2.1: Setting pattern 1
face c bSide face 2.119 0.55Front face 1.584 0.58Back face 1.800 0.49Top face 11.883 0.37
The data was reported as correlations for Reynolds number ranged from 11000 to 20000and Prandtl number close to 0.7. However, the usage indicated that the correlationswere valid for Reynolds number up to 105, so that they cover the normal range of kilnoperations.
Karaush et al. [14] established an experimental study which involves a model unitconducted on heat absorption from the radiating walls of a kiln by the ceramic ware setup on a kiln car. Their results showed that there was an optimal spacing between the

14 Literature Review
ceramic pieces in the setting above which any further increase in the spacing would notincrease the rate of heat absorption by the ware.
Abou-Ziyan [15] made an experimental investigation to explore the effect of brickarrangements on local, average heat transfer and pressure drop of setting composed ofrectangular bricks as shown in Fig. 2.1. He provided reliable information for convectiveheat exchange between air and bricks in order to represent the actual arrangementsso that three basic column configurations were valid for extended range of Reynoldsnumber. A laboratory-scale experiment simulating a section of tunnel kiln by scale 1:4
Figure 2.1: (a) Brick directions relative to air flow. (b) Brick arrangement of setting no.1.(c) Section of the duct at AA (four columns and eight layers shown) [15].
was designed and constructed to explore the effect of brick arrangements. He concludedthat kilns which used lattice setting with equal spacing between columns and betweenbricks achieved the largest convection heat transfer coefficient, the shortest productiontime and provided high measure of energy saving. The following two correlations werereported from his experiments in the form of dimensionless groups, the first equation withcorrelation coefficient f = 0.98 and the second correlation with correlation coefficient of0.86.
Nu = 0.088Re0.625(sa
)−2.30 (εs
b
)1.837
(2.2)
Nu = 0.081f 1.31Re (2.3)
Wherea, length of brick model, (m)b, thickness of brick model, (m)c, height of brick model, (m)f, correlation coefficient, (m)s, spacing between columns, (m), andε, void fraction.
Where the Nusselt number and the Reynolds number were calculated according to

Literature Review 15
the following equations
Nu =hDh
k(2.4)
Re =UDh
ν(2.5)
Whereh, convective heat transfer coefficient, (W/(m2 ·K))Dh, hydraulic diameter, (m)k, thermal conductivity of air, (W/(m·K))U , interstitial velocity of air in the loaded duct (u/ε), (m/s)u, superficial velocity of air in the empty duct, (m/s), andν, kinematic viscosity of air, (m2/s)
Gol’tsova et al. [16] studied experimentally the thermal loss via the enclosing structuresof a brick-firing kiln. All zones of the kiln at the Altair Works, which has 48 zones,were investigated from the sides, the top and the data on each zone were recorded.The interpolation method was used to determine the weighted mean temperatures foreach kiln zone as shown in Fig. 2.2. The heat loss is based on the temperature fields
Figure 2.2: Weighted mean temperatures of external kiln walls split by zones: 30C)theoretical temperature of the external surface of the kiln [16].
of the outer surfaces of the walls and the roof of the firing kiln were equal to 12.1 %instead of 6-8 %, which is considered as the recommended heat loss level meaning up toa 5 % savings in energy consumption. The type of destruction of the enclosing structureof thermal insulation was identified. As a result, it was possible to develop justifiedrecommendations for repairing the kiln lining or thermal insulation. Furthermore,revealing the need for additional thermal insulation in zones with large heat loss evenwhen the lining or thermal insulation were not destroyed.
Vogt and Beckmann [17] evaluated the measurements of Schroder, Hoyer, Abbaku-mow and Dugwell, generalized equations for the convective heat transfer in channels andextensions of brick settings as shown in Fig 2.3. The influence of the setting geometrywas calculated with a factor (Φ) which used to describe the ratio of the Nusselt numberof the respective setting arrangement to the fully developed steady pipe flow. Regardingthe heat transfer in the channel, the influences of the non-dimensional channel length G1

16 Literature Review
and the non-dimensional length of the extension G2 were proved to be roughly equivalent.In addition, they deduced that in the extension itself the influence of the non-dimensionalchannel length was forced back strongly compared to the influence of the non-dimensionallength of the extension and the area ratio G3. Furthermore, a maximum in the heattransfer occurred in the extension at G2= 0.9. The heat transfer values attained in theresults were only reached approximately again above a non-dimensional length of theextension of G2 > 2.5.
WhereG, the geometrical similarity indexG1 = lk/dGL, (channel length/equivelent diameter)G2 = lE/dGL, (extension length/equivelent diameter), andG3, area ratio.
Figure 2.3: Multi-layer lattice-shaped block setting [17].
2.1.2 Numerical and analytical studies
Mandhani et al. [18] investigated, numerically, the forced convective heat transfer charac-teristics for an incompressible, steady, and Newtonian fluid flow over a bundle of circularcylinders. In the study the role of the type of thermal boundary conditions, namelyconstant temperature and constant heat flux, on overall heat transfer characteristicswere elucidated. The finite difference based numerical solution procedure was used tosolve momentum and energy equations for a range of physical and kinematic conditions.Moreover, results on the temperature fields, and on the variation of the Nusselt numberon the surface of a typical cylinder in the assemblage were obtained for two valuesof Prandtl number (air and water) with Reynolds number of flow varied from 1 to500. The results showed that the surface averaged value of Nusselt number increaseswith the decreasing value of porosity and increasing values of Prandtl and Reynoldsnumbers. In addition, the results were in satisfactory agreement with the previousnumerical and experimental results for a single cylinder and for the arrays of cylinders

Literature Review 17
in the overlapping ranges of conditions. The study clearly showed that the cell modelsoffer a viable approach to the modeling of momentum, heat and mass transfer in suchmulti-cylinder systems.
Kang and Rong [19] used a hybrid method based on numerical simulation and an-alytical equations to calculate the radiation, convection, and conduction heat transfers inheat treatment processes. The view factors between the furnace and workpieces, amongworkpieces were calculated by the exposed surface area over the total surface area inthe radiation model as shown in Fig. 2.4. In case of conduction model the workpieces
Figure 2.4: The 2D illustrative diagram of view factor calculation between furnace andworkpiece and among workpieces: (a) round workpieces; (b) rectangular workpieces [19].
were classified into lumped capacitance and massive objects. In addition the workpieceswere classified into three basic shapes: sphere, cylinder, and sheet. Furthermore, naturaland forced convection were solved by analytical algorithms for aligned and staggeredload patterns. In their calculations the convective heat transfer coefficient and Reynoldsnumber were calculated as follow:
hconv =λgNuL∗
L∗(2.6)
ReL∗ =U∞L
∗
ν(2.7)
Wherehconv, convective heat transfer coefficient,L∗, the characteristic length of workpiece, (L∗ = A1/2)A, the external surface area of the workpiece,NuL∗ , Nusselt number related to the geometrical features of workpiece, andReL∗ , Reynolds number.
The velocity which was used to calculate Reynolds number was calculated as
U∞ =
π
4D2
fanHfanRfan
Aws(2.8)

18 Literature Review
WhereDfan, Hfan, Rfan were the diameter, height, and rotational speed of the circulation fanrespectively, andAws, load area which facing the flow direction of atmospheric gas.
A comparison between the models and two experimental case studies of bladesand drill bits has been done as shown in Fig. 2.5.
Figure 2.5: Comparison of measured and calculated results of heating of blades:(a) work-piece at location 1; (b) workpiece at location 2 [19].
Becker et al. [20] investigated the convective heat transfer under superimposedlongitudinal and cross flow conditions in a fast firing tunnel kiln for glost firing ofporcelain. A commercial CFD-code for the simulation is used as shown in Fig. 2.6. Dueto complexity of the geometry and the resulting huge number of cells for the simulation,all three segments of the flow model were not simulated at once. In addition, a 1:5cold model of a real existing tunnel kiln for firing flat tableware was used in order todetermine the convective heat transfer coefficient by similarity examinations, in whichReynolds numbers for longitudinal flow (ReL) and for cross flow (ReQ) were calculatedaccording to the following equations.
ReL =wLdTν
(2.9)
ReQ =wQdTν
(2.10)
WheredT , plate diameterwL, velocity inside the empty canalwQ, velocity of the injection, andν, kinematic viscosity
Stirrer vessel flow conditions were assumed to calculate the combustion gas tem-peratures. The total heat transmission coefficient under inclusion of the radiant heatportion was calculated, the kiln room temperature and energy demand of the tunnel kilnplant. Furthermore, a satisfactory compliance between the CFD results and total energy

Literature Review 19
demand measurements was made on a real kiln plant.
Longitudinal flow
Figure 2.6: The heated model plates are placed at different positions inside the stack todetermine the heat transfer coefficients [20].
2.2 Mathematical models for tunnel kiln
Abbakumov [21] analyzed the heating and cooling of products in tunnel kilns and de-veloped relationships which permit accurate thermal analysis of tunnel kilns. Moreover,he analyzed the thermal work of a high temperature tunnel kiln and explained theessential role of radiation. Figure 2.7 shows the temperature distribution for solid andgas according to Abbakumov results. Abbakumov simplified the analysis to examinethe counterflow of the setting of endless plates; heat transfer at the ends of the setting,the proportion of which was comparatively small. He introduced appropriate correctionsinto the coefficient of heat exchange of the longitudinal side surfaces of the columns.Furthermore the system was solved for the case of symmetrical heating (cooling) of theplates.
Dugwell and Oakley [22] made a mathematical model for a firing refractory ware ingas-fired tunnel kilns which can be used to predict gas temperature and compositionand ware temperature profiles during firing. The cross section of the studied tunnel kilnis shown in Fig. 2.8. This mathematical model was supported by new correlations forconvective heat transfer coefficients on a laboratory scale model. Three models wereproduced. First, the simplest 1-D model to provide quick prediction of gas and waretemperature profiles. Second, a 2-D model for good prediction of gas temperature profileand improve prediction of ware temperature profile. Finally, a 3-D model to predict waretemperature distribution along the firing zone.
Boming Yu [23] developed a dynamic model of a tunnel kiln consisted of five bladesof wares set on a refractory lined kiln car. The model based on the transient heatconduction which occurred in the products (or wares) and in the lining bricks of kiln cars(LBKC), as well as on the gas continuity, heat balance, and material balance equations.Boming performed a numerical simulation on a 72-m-long tunnel kiln which used forfiring clay bricks. Furthermore, the numerical results showed that the proposed dynamicmodel could predict the temperature distributions in both wares and LBKC. In addition,the proposed model could predict the fuel consumption, heat loss, heat storage, and heat

20 Literature Review
Figure 2.7: Change in temperature of material and gases in a high temperature tunnelkiln; x calculated temperature of gases; o) calculated temperature of material; a) heatingof column; b) cooling of column (figures on the curves show the number of the position).Zones: 1) heating; 2) firing; 3) cooling. [21]
Sandrinne
Sand seals
0 1 2 m
Besatz/ Ware
Ofenwagen
Kiln car
Figure 2.8: Cross section view of kiln and kiln car. [22]

Literature Review 21
storage rates in both ware and lining bricks as well as in metal parts of kiln cars, gasflow, and exhaust components. Moreover, from simulations two types of energy-savingstructures of kiln cars were suggested. Boming also concluded that his dynamic modelcan be used not only to describe the thermodynamic processes, but also to help design atunnel kiln and to compute heat balances.
Essenhigh [24] introduced an analysis of tunnel kiln performance to determine therelation between input energy (H
f) and useful output energy (Hs). He applied the
integral energy equation which leads to a firing equation of standard form. Essenhighdeveloped an analytical structure specifically for the tunnel kiln represented as a firingsection flanked by two (upstream and downstream) heat exchanger. However, the generaldesign and theoretical structure has potentially wider application, particularly withrespect to the influence of heat exchangers in a furnace system. He concluded that theseassumptions and constraints were important factors to be identified in extension to othersystems. Furthermore, there was generally a governing temperature requirement andtime-held at that temperature for the processing to go to completion for the materialbeing heat-treated, such as firing brick, ceramics or heat treatment of steel parts. Then,materials could be cooled and the enthalpy could be recovered, but the determiningtemperatures and processing times which translated into thus specifying the throughputrates, were set by the internal process requirements.
An approach to determine the temperature fields in tunnel kiln for brick produc-tion together with different possibilities of decreasing specific fuel consumption wereinvestigated by Durakovic and Delalic [25]. They developed a software to execute asimulation of temperature distribution in furnace during brick production process in realconditions.
Gol’tsova et al. [26] examined a mathematical model that could be used to maintain theprocess parameters in real time as a function of the amount of brick manufactured. Inthe model, they divided the entire kiln into 48 zones equal processing zones. In addition,they assumed that the temperature in each zone was constant, i.e., was not a functionof time. The results of the mathematical model were compared with a tunnel kiln fromAltair Ceramics Co. (Izhevsk). Furthermore, the results of the kiln operating conditionsfounded that the rhythm and operating conditions of the kiln vary up to 10 times eachmonth, which affected the quality of the bricks. Moreover, the results showed a largeexcessive of power consumption. Although, the analysis of operation of the factoryshowed the annual volume and product assortment were very similar. Comparisonbetween the factory results and their mathematical model results is shown in Fig. 2.9.
Mancuhan et al. [27] developed a one dimensional model to simulate the drying bricksin the preheating zone of a tunnel kiln. Two different profiles and vent locations for theambient air into the preheating zone were used to achieve the desired gas temperaturefor high quality bricks. The simulated results were compared to measured plant data.Figure 2.10 showed a comparison between the obtained results and a measured data.

22 Literature Review
Figure 2.9: Tunnel kiln temperature conditions: for the process (1: operational) and real(2: production). [26]
(a) (b)
Figure 2.10: (a) Comparison of the measured temperatures to the computed gas and bricktemperatures, (b) Variation of kiln gas temperature profiles as a function of different massfluxes of ambient air. [27]
2.3 Mathematical models for burning zone
Shvartsman et al. [28] deduced an equation for assessing the uniformity of firing overthe length of the setting in tunnel kiln. The results showed that, to reduce the firingirregularity over the setting’s length it was necessary to reduce the distance between theburners, reduce the heat losses into the surroundings, and increase the total volume ofcombustion products by using only hot air. The result declared that with reduction inthe distance between the burners and increasing in the volume of combustion products,it was possible to obtain fuel economies. They concluded, it was best to use tunnelkiln equipped with roof burners with continuous movement of the goods to increasethe uniformity of firing. The uniform heating of the entire volume of the setting onthe tunnel kiln car reduced the firing time and as a result, the output of the kiln wasincreased and also the specific outlay on fuel was reduced.

Literature Review 23
Mancuhan and Kucukada [29] presented an optimization of the fuel and air usedaround a tunnel kiln producing bricks with low calorific value (LCV) coal as an additive.In the model, the mass and energy balance computations to calculate the energy werecomputed based on the plant data. They concluded that the use of admixed coal for bothcases which using pulverized coal or natural gas (NG) in firing zone is considered as anadvantage. Furthermore, the heating value of the admixed coal (AC) didn’t significantlychange the total fuel cost when pulverized coal was preferred. They recommended thehigh calorific value (HCV) of admixed coal when the plant use natural gas as the fuelsupplied to the firing zone as shown in Fig. 2.111. In addition, although the natural gas
Figure 2.11: Percentages of the energy sources for the tunnel kiln when NG and AC areused [29].
is more expensive than the pulverized coal, it eases the combustion. Their optimizationresults may change depending on the properties of fuels and its prices.
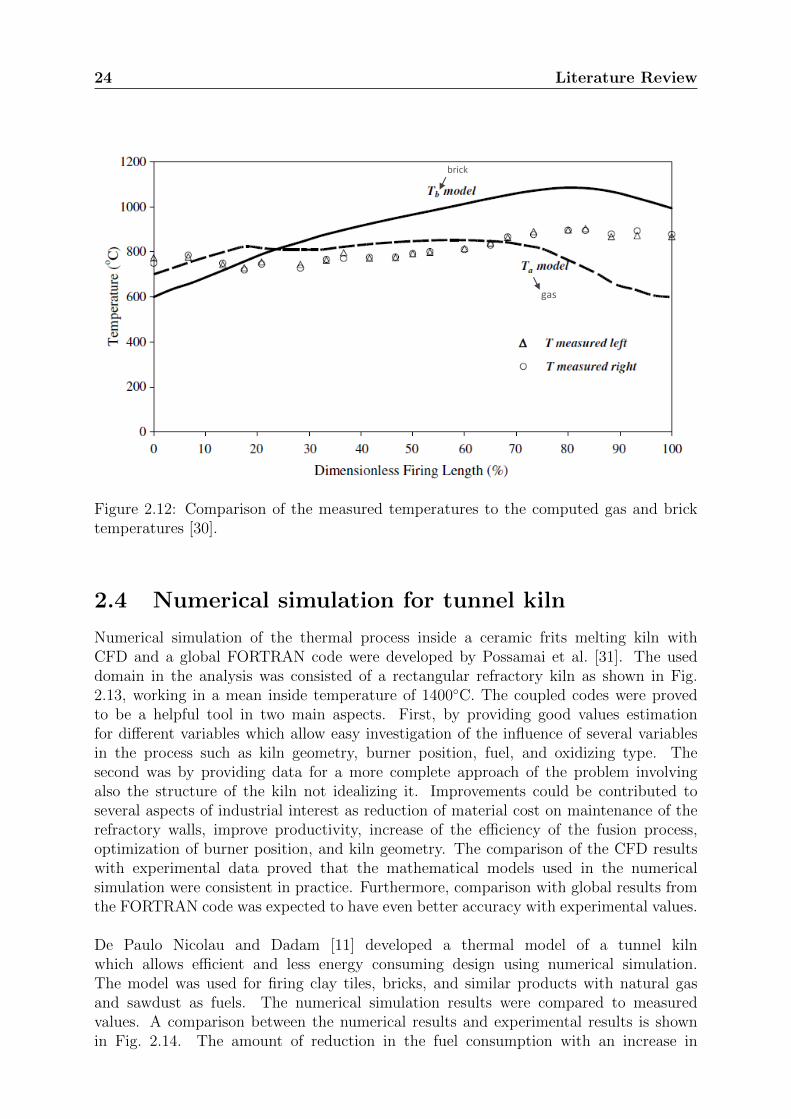
Kaya et al. [30] made an optimization of the firing zone to minimize the fuel costas being the objective function. In the work, they demonstrated how the optimaloperating conditions could be predicted by using a mathematical model representing inthe simplest form the phenomena of heat transfer, combustion of admixed coal (AC)and pulverized coal (PC), together with gas flow. The fuel cost is used as an objectivefunction with the necessary constraints. The optimization was realized by consideringthe tunnel kiln to be composed of number of increments. The optimized value of PC wasfound to be lower than the existing tunnel kiln. The optimization results were comparedto the plant data of brick kiln as shown in Fig 2.12.The overall energy balance predictedan energy use of 3385 kJ/kg of brick, which was 2.7 % higher than the optimized results.
1This figure is used based on license agreement between the author and Elsevier with license numberof 2950900525607.
24 Literature Review
brick
gas
Figure 2.12: Comparison of the measured temperatures to the computed gas and bricktemperatures [30].
2.4 Numerical simulation for tunnel kiln
Numerical simulation of the thermal process inside a ceramic frits melting kiln withCFD and a global FORTRAN code were developed by Possamai et al. [31]. The useddomain in the analysis was consisted of a rectangular refractory kiln as shown in Fig.2.13, working in a mean inside temperature of 1400C. The coupled codes were provedto be a helpful tool in two main aspects. First, by providing good values estimationfor different variables which allow easy investigation of the influence of several variablesin the process such as kiln geometry, burner position, fuel, and oxidizing type. Thesecond was by providing data for a more complete approach of the problem involvingalso the structure of the kiln not idealizing it. Improvements could be contributed toseveral aspects of industrial interest as reduction of material cost on maintenance of therefractory walls, improve productivity, increase of the efficiency of the fusion process,optimization of burner position, and kiln geometry. The comparison of the CFD resultswith experimental data proved that the mathematical models used in the numericalsimulation were consistent in practice. Furthermore, comparison with global results fromthe FORTRAN code was expected to have even better accuracy with experimental values.
De Paulo Nicolau and Dadam [11] developed a thermal model of a tunnel kilnwhich allows efficient and less energy consuming design using numerical simulation.The model was used for firing clay tiles, bricks, and similar products with natural gasand sawdust as fuels. The numerical simulation results were compared to measuredvalues. A comparison between the numerical results and experimental results is shownin Fig. 2.14. The amount of reduction in the fuel consumption with an increase in

Literature Review 25
Figure 2.13: Kiln geometry [31].
the thermal insulation thickness used on the walls was determined from results. Theresults demonstrated the influence of the load internal area on the heat exchanged withcombustion gases inside the kiln. Also, it showed the effectiveness of the heat exchangeinside the load stacks which occurs above a threshold value for the internal area toexternal area ratio. Furthermore, the results showed the need to use a larger number ofless tortuous channels inside the load to promote efficient gas circulation.
(a)
(b)
Figure 2.14: (a) Temperature within the load for the central part of the tunnel kiln, (b)Gas temperature compared to simulated temperature of the gas and temperature insidethe load [11].

26 Literature Review
Oba et al. [32] presented a numerical model to simulate a tunnel kiln applied in ceramicindustry. The dimensions of the used kiln in calculations is shown in Fig. 2.15, inwhich the load was one block. The model solved a 3D problem with models for energydistribution in the burning zone, the advection of gases inside the kiln, and the radiationbetween ceramic load and refractory walls. The energy loss from the kiln to thesurroundings was solved. The results presented the characteristic firing curve of the kilnas shown in Fig. 2.16. The results also illustrated the temperature distribution in theload, walls, and gases; additionally, it estimated production and distribution of energyflows in the kiln. Moreover, the results were based in some parameters such as fuel,cooling air flow, and extraction air flow. In addition, the model was capable of estimatingthe temperature and energy distribution and kiln efficiency. The authors concluded thatalthough the numerical prediction given was consistent, experimental data of the kiln inoperation condition was necessary for real validation.
Figure 2.15: Dimensions of the furnace, load and lorry. [32]
2.5 Modeling and control systems for tunnel kiln
Due to requirements of automated tunnel kilns on the basis of microprocessor technology,this makes it possible to reduce the volume of control and measuring instruments andapparatus on the kiln. Furthermore, requirements to increase the accuracy in maintainingtemperature conditions by the use of the most up-to-date methods of control.
Abbakumov and Vel’sin [33] developed a mathematical model and a program for

Literature Review 27
Figure 2.16: Temperature curve of flow inside the kiln. [32]
calculating the firing zone of a tunnel kiln with automatic control of the firing process.The developed program made it possible to select the best method of control and to de-termine the optimum parameters of the system. The basic advantages and disadvantageswere revealed by use of the developed method of control. Their mathematical model mayserve as an element of software of an automated system of production operation controlof firing in a tunnel kiln.
Chen et al. [34] proposed an intelligent computer-aided design (CAD) system forceramic kiln. The developed system used an object-oriented programming (OOP)technology with a user friendly interface. In addition, the expert system and the draftingsystem were discussed in detail. Furthermore, in the integrated intelligent CAD system,the object oriented database was taken as a kernel, the design calculation, the expertsystem, and the parametric drafting system interfaced directly with the engineeringdatabase. The results provided a foundation for the intelligent automatic design ofceramic kilns.
Michael and Manesis [35] proposed a control scheme for model-based coordinationof the individual subsystems which were controlled locally by fuzzy controllers combinedwith conventional ones in brick and tile production tunnel kiln. The proposed controlstructure could be easily applied to the process environment and the implementationmay be realized directly on a programmable logic controller. Furthermore, in the upperlevel of the hierarchy supervisory controller classified the actual system situation basedon the mathematical model of the process and in the lower level performed the specificcontrol mode selection. A result from this study is shown in Fig. 2.17.

28 Literature Review
Figure 2.17: Temperature difference after the action of the fuzzy supervisory con-troller. [35]
2.6 Energy saving in tunnel kiln
Tunnel kiln consumes different amounts of energy. The consumed energy varies accordingto the type of products; consequently, there is much interest in tunnel kiln energy savings.The following literature focuses on energy saving in tunnel kilns.
The tunnel kiln car’s refractory system in the ceramic industry protects the steelchassis and wheel sets from high temperatures. There are two main types of losses forkiln car, transmission losses due to accumulated heat flow via the bottom surface of thetunnel kiln cars and cumulative losses corresponds to the heat content of the kiln carswhen they leave the kiln. Therefore, De Wit [36] developed a computer program calledQ-CAR for the exact calculation of energy loss in the kiln car (transmission losses andcumulative losses). The developed system reduced energy consumption in cars becausekiln cars accounted for about 40 % of the internal surface area of the kiln. The usedsystem is a particularly suitable auxiliary for the selection of tunnel car refractory systems.
Carvalho and Nogueira [37] presented the utilization of dedicated modeling toolsfor the optimization of a variety of thermal equipment for high- medium- and low-temperature heat transfer processes. The equipment considered for this study was(ceramic and glass-melting furnaces, cement kilns, and baking ovens). A significantreduction of energy consumption and low-cost abatement was achieved for these fourindustrial situations. The authors believed that the achievements were contributedto pollution abatement strategies for industries that were intensive energy users. Thefollowing figure shows different brick settings used in the study.
Unaspekov [38] presented a result on updating the firing technology for aluminosilicaterefractory materials in a high-temperature tunnel furnace at the Kazogneupor Plant.

Literature Review 29
Figure 2.18: Typical brick setting geometry [37].
Unaspekov concluded that the use of the advanced gas heating system provided rationalsupply and burning of fuel to attain the required firing temperatures. Furthermore, alarge amount of work has to be done to optimize the performance of the combined systemof heating depending on the gas-dynamic and hydraulic operational parameters of thetunnel furnace. In addition, special concern must be placed on the reduction of heat lossthrough the refractory lining of high-temperature furnaces.
2.7 Conclusions on literature review
The previous work in the literature review sections of the present chapter, providesguidelines and an extensive background for the present study. The literature surveyof the previous work revealed most of the research has been done on tunnel kiln usedin brick manufacturing. Some experimental works have been done to investigate theconvective heat transfer coefficient and effect of brick settings in brick tunnel kilns. Inaddition, some works have been done to calculate the radiative heat transfer for someproducts in tunnel kilns. Mathematical models have also been created to simulate thethermal process in certain tunnel kilns. Literature review revealed that further researchin tunnel kilns with other combinations of parameters and consideration of kiln furnitureare required.
In spite of many published studies, it still seems possible to develop a model toestimate the temperature profile for gas, products, and kiln furniture. There are aplethora of studies regarding various types of products that are produced in tunnelkilns. Previous models yielded no information regarding changes in the heat transfercoefficient with various kiln geometries. Also, the measured profile doesn’t present thewhole section. There is a scarce amount of research that is independent of product types.The current work presents a simplified mathematical model for the kiln and studiesthe effect of burning zone length on the temperature profile for both gases and solids.In addition, examine the heat transfer in the kiln furniture with special supports andgeometry. Finally, observe the effect of air addition in the preheating zone. Such studiesare crucial in order to fully understand tunnel kiln dynamics.

30 Literature Review

Chapter 3
Simplified Mathematical Model forTunnel Kilns
3.1 Introduction
The heat transfer mechanism is complex inside the tunnel kiln, because of the interactionof kiln car, kiln furniture, product types, and product arrangements in the kiln. There-fore, it is important to establish a simplified model to understand the principal behaviorof the kiln process. This model considers the preheating and burning zone in which thesolid materials (product, furniture, and car) are heated up to the required sintering tem-perature. The cooling air is sucked away from the kiln and then used in the dryer. Itis assumed that the enthalpy of the cooling covers the energy for the drying process. Asa consequence, the energy of the fossil fuel of the kiln is the required energy for the to-tal process. This is the case for the most processes of ceramics burning. Therefore, thefollowing is assumed and are valid for counter current heat exchanger.
Assumptions :
? The process is assumed to be a steady state process.
? The temperature of product and of gas is assumed to be constant at any cross section.As a consequence, the temperature depends only on the length.
? The temperature of product and transportation materials are the same.
? The heat transfer coefficient is constant.
? The heat losses through the walls are neglected.
? The material properties (specific heat capacity, density) are assumed as constant.
? The material does not store latent energy.
3.2 Energy balance
The basis of all kiln processes is an energy balance. The enthalpies in heat balancesare always referred to the reference temperature (0C). In energy balance analysis, theenergy inserted by fuel is equal to the heat gain by solid, heat removed from gas, and
32 Simplified Mathematical Model for Tunnel Kilns
heat loss through walls. By applying the energy balance, the following equation is obtained
Mscs (Ts,f − Ts,in) + Mgcpg (Tg,out − Ta) + Qw = MFhu. (3.1)
Where Ms represents solid mass flow rate, cs specific heat of solid, Ts,in and Ts,f representinlet and outlet solid temperature respectively, Qw heat loss through kiln walls, M
Ffuel
mass flow rate, Mg gas mass flow rate, cpg gas specific heat at constant pressure, the inletgas temperature is Ta (ambient air temperature), and Tg,out outlet gas temperature .
In the following, the heat loss through walls is neglected (Qw = 0) as mentionedbefore. Regarding the energy balance equation, the solid material (Ms) represents thetwo masses for product (Mpro) and transportation (M
T) as
Ms = Mpro + MT.
The ratio between the product materials to the transportation material is definedas
XT
=M
TcT
Mprocpro.
Where cT
specific heat capacity of transportation (cT∼= cs), cpro specific heat ca-
pacity of products.
Therefore, the following equation is obtained
Ms = Mpro(1 +XT
cprocs
). (3.2)
The outlet gas mass flow rate from the combustion process is the summation of the fuelmass flow rate, M
F, and the air mass flow rate Ma
Mg = MF
+ Ma. (3.3)
The mass flow rate of air can be expressed in terms of air demand (L), excess air number(λ) and fuel mass flow rate as
Ma = λLMF. (3.4)
Then the gas mass flow rate can be specified directly as a function of fuel mass flow rate,air demand, and excess air number
Mg = MF
(1 + λL) . (3.5)
The energy equation Eq. 3.1 requires the mean specific heat capacity. Therefore, thefollowing equation is used to calculate the mean specific heat capacity with gas propertiesreferred to reference temperature, To = 273K [39]
cpg(T)
cpo(To)=
1
nc + 1
((T/To)
nc+1 − 1
(T/To)− 1
). (3.6)

Simplified Mathematical Model for Tunnel Kilns 33
For this specified case the specific heat of air with (cpo(To)= 1.0) and index (nc= 0.1) areused. Moreover, equation 3.7 is used to simplify the energy consumption equation
cpg(1 + λL) ∼= cpgoλL. (3.7)
Then, the specific energy consumption equation referred to the solid flow is introduced
Es =M
Fhu
Ms
. (3.8)
Solving Eq. 3.1 to Eq. 3.8 results in the following form for the specific energy consumption
Es =cs (Ts,f − Ts,in)
1− cpg (1 + λL) (Tg,out − Ta)hu
. (3.9)
In industry the specific energy consumption is referred to the product flow as in thefollowing equation
Epro =M
Fhu
Mpro
. (3.10)
WhereEpro, is the specific energy consumption per kg of product.
By joining Eq. 3.2, Eq. 3.10 together with Eq. 3.8 the specific energy consumptionper kg of products can be presented as
Epro = Es
(1 +X
T
cprocs
). (3.11)
The specific energy consumption E cannot be calculated because Tg,out is not known. Theoutlet temperature depends on area and heat transfer coefficient. Therefore, the outletgas temperature is calculated in the following sections for different basic cases. Theenergy consumption related to the product is therefore always higher than the energyconsumption related to the solid.
3.3 Simple analysis case A (firing zone zero)
3.3.1 Description of the case
For this case the burning zone is considered with zero length. Therefore, the two zonesare considered as one zone (preheating only) which is called ”case A”. Figure 3.1 shows aschematic description of the tunnel kiln with a gas input from one position. In the shownfigure, the combustion of fuel with air occurred in an adiabatic combustion chamber.Therefore, the outlet gas temperature from this combustion process is the adiabatic flametemperature. As illustrated in the figure, the kiln car carries the product through the kilnin counter direction to gas flow. The kiln process is reduced to a simple counter currentheat exchanger.

34 Simplified Mathematical Model for Tunnel Kilns
Combustion
𝐌 𝐠,𝐓𝐠,𝐨𝐮𝐭
𝐀𝐢𝐫, 𝐌 𝐚,𝐓𝐚
𝐓𝐠,𝐢𝐧= 𝐓𝐚𝐝 , 𝐌 𝐠
𝐌 𝐬,𝐓𝐬,𝐟 𝐓𝐬,𝐢𝐧
𝐅𝐮𝐞𝐥, 𝐌 𝐅,𝐓𝐅
z
Gas
Lk
Air curtain
Kiln door
Product
Kiln car
Combustion
𝐌 𝐠,𝐓𝐠,𝐨𝐮𝐭
𝐀𝐢𝐫, 𝐌 𝐚,𝐓𝐚
𝐓𝐠,𝐢𝐧= 𝐓𝐚𝐝 , 𝐌 𝐠
𝐌 𝐬,𝐓𝐬,𝐟 𝐓𝐬,𝐢𝐧
𝐅𝐮𝐞𝐥, 𝐌 𝐅,𝐓𝐅
z
Gas
Lk
Air curtain
Kiln door
Product
Kiln car
Figure 3.1: Input of gas at one position.
3.3.2 Temperature profile
The temperature profile of the solid and the gas for this heat exchanger can be calculatedusing an energy balance for a differential kiln length dz. The gas enthalpy flow changedHg and solid enthalpy flow change is expressed as
dHg = dQconv, dHs = dQconv. (3.12)
Also the gas enthalpy flow change dHg, can be expressed by the following equation:
dHg = MgcpgdTg. (3.13)
The convective heat transfer between the gas and solid can be expressed as
dQconv = α (Tg − Ts) dA. (3.14)
Where
dA =AtLkdz. (3.15)
α, heat transfer coefficient,dA, the element area,At, total surface area of solid, andLk, the kiln length.
The following ordinary differential equation (ODE) for gas is obtained
MgcpgdTg =αAtLk
(Tg − Ts) dz. (3.16)

Simplified Mathematical Model for Tunnel Kilns 35
The equation can be represented with dimensionless parameters
dTgdZ
= Stg (Tg − Ts) . (3.17)
Where the Stanton number for the gas is expressed as
Stg =αAt
Mgcpg. (3.18)
and the dimensionless length coordinate is represented as
dZ =dz
Lk. (3.19)
Regarding the solid, the solid enthalpy flow change is expressed by equation
dHs = MscsdTs. (3.20)
Then the following first order ordinary differential equation (ODE) for solid is obtainedas follows
MscsdTs =αAtLk
(Tg − Ts) dz. (3.21)
And in the dimensionless form the ODE for solid is expressed as
dTsdZ
= Sts (Tg − Ts) . (3.22)
Where the Stanton number for solid is expressed by the following equation
Sts =αAt
Mscs. (3.23)
Moreover, the specific heat capacity ratio is defined as
Ω =StsStg
=Mgcpg
Mscs. (3.24)
Then by substituting the value of (Mg) from Eq. 3.5 the following equation for specificheat capacity ratio is obtained
Ω =M
Fcpg (1 + λL)
Mscs. (3.25)
Furthermore, the fuel mass flow rate is replaced by energy consumption Es from Eq. 3.8.Therefore, the specific heat capacity ratio Ω is represented in the following new form
Ω =Escpg(1 + λL)
cshu. (3.26)

36 Simplified Mathematical Model for Tunnel Kilns
The two first order ordinary differential equations need two boundary conditions to besolved. These two boundary conditions are
Ts(z=0)= Ts,in
(3.27)
Ts(z=Lk) = Ts,f .
WhereTs,in, the inlet solid temperature, andTs,f is the outlet temperature from the burning zone.
3.3.3 Analytical solution for Ω = 1
This section describes the analytical solution for a special case in which the heat capacityratio is equal to unity (Ω = 1, Sts = Stg). For Ω = 1 the temperature profiles for solidand gas are linear as shown in Fig. 3.2. From heat exchanger basics the following twoequations are obtained
𝐓𝐬,𝐢𝐧
𝐓𝐬,𝐟
𝐓𝐠,𝐢𝐧
𝐓𝐠,𝐨𝐮𝐭
Tem
per
atu
re
0 Z (m) Lk
Gas
Solid
Figure 3.2: Schematic representation for the temperature profile in case of Ω =1.
Tg,in − Ts,inTg,out − Ts,in
= 1 + Sts (3.28)
Ts,f − Ts,inTg,out − Ts,in
= Sts. (3.29)
From Eq. 3.29 the outlet gas temperature is obtained as follows
Tg,out =∆TsSts
+ Ts,in. (3.30)

Simplified Mathematical Model for Tunnel Kilns 37
Where∆Ts = Ts,f − Ts,in, the solid temperature difference.
By solving Eq. 3.28 and Eq. 3.30 together, the inlet gas temperature is obtainedas
Tg,in = ∆Ts
(1 + StsSts
)+ Ts,in. (3.31)
From the energy balance for the combustion chamber the gas inlet temperature is obtainedas
Tg,in = Tad =hu
cpg (1 + λL)+ Ta. (3.32)
From these two equations Eq. 3.31 and Eq. 3.32, the excess air number which achieve theheat capacity ratio of unity (Ω=1) is obtained as
λ =1
L
(huSts
cpg (∆Ts(1 + Sts) + Sts(Ts,in − Ta))− 1
). (3.33)
Then from Eqs. 3.9, 3.30 and 3.33 the energy consumption equation is obtained as
Es =cs (∆Ts(1 + Sts) + Sts(Ts,in − Ta))
Sts. (3.34)
In most cases Ts,in ∼= Ta, therefore the equation can be represented in easier form asfollowing
Tg,out =∆TsSts
(3.35)
Tg,in = ∆Ts
(1 + StsSts
)+ Ts,in (3.36)
λ =1
L
(huSts
cpg∆Ts(1 + Sts)− 1
)(3.37)
Es =cs∆Ts(1 + Sts)
Sts. (3.38)
Figure 3.3 represents the energy consumption as function of the Stanton number. Thehigher the Stanton number and the heat transfer coefficient (α), the lower the energyconsumption (Es). This Es only depends on the required firing temperature and theStanton number. In this figure the solid temperature difference is ∆Ts= 950 K forexample. The specific heat capacity cs is assumed as 0.85 kJ/(kg.K). For Sts −→ ∞the lower limit of energy consumption is Es = 0.83 MJ/kgs.
In addition, Fig. 3.4 represents the excess air number as function in the Stantonnumber. The higher the Stanton number the higher the excess air number (λ) whichfulfill the specific heat capacity ratio of unity (Ω= 1).
Figure 3.5 represents the outlet gas temperature as the function of Stanton number. Itis obvious from the figure that the higher the Stanton number is the lower the outlet gastemperature (Tg,out). The data is represented in table 3.1.

38 Simplified Mathematical Model for Tunnel Kilns
1 2 3 4 5 6 7 8Sts
0.9
1
1.1
1.2
1.3
1.4
1.5
1.6
1.7
Es (
MJ/k
gs)
=1
Ts,in = Ta
Ts =950 K
Emin=0.83MJ/kgs
Figure 3.3: Energy consumption for Ω =1.
1 2 3 4 5 6 7 8Sts
1.2
1.3
1.4
1.5
1.6
1.7
1.8
1.9
2
2.1
2.2
2.3
2.4
Excess a
ir n
um
ber
( )
=1Ts,in = Ta
Ts,in =950 KEmin =0.83MJ/kgs
Figure 3.4: Excess air number for special case of Ω =1.

Simplified Mathematical Model for Tunnel Kilns 39
Table 3.1: Some data used in calculations
Symbol Description Value Unit
used fuel natural gas H type
cpgo specific heat of air 1.0 kJ/(kg.K)
Lk kiln length 50 m
cs Specific heat of solid 0.85 kJ/(kg.K)
Ms capacity of kiln 20000 t/year
Ts,in solid inlet temperature 50 C
Ts,f solid outlet temperature 1000 C
L air demand 16.9 kgair/kgfuelhu lower heating value 47300 kJ/kgF
1 2 3 4 5 6 7 8Sts
100
200
300
400
500
600
700
800
900
1000
Tg
,ou
t (o
C)
=1
Ts,in = Ta
Ts =950 K
Emin=0.83MJ/kgs
Figure 3.5: Outlet gas temperature for special case of Ω =1.
3.3.4 Analytical solution for different Ω
It is important to obtain the analytical solution not only for the foregoing special case Ω= 1, but also for the other values of the specific heat capacity ratio (i.e. Ω 6= 1). Thefollowing two equations are the obtained equations from solving the foregoing two ODEs
Tg(Z) =Ω′Ts,in
(1− eSts(Ω′−1)Z
)+ Tg,out
(Ω′eSts(Ω
′−1)Z − 1)
Ω′ − 1(3.39)
Ts(Z) =Ts,in
(Ω′ − eSts(Ω′−1)Z
)+ Tg,out
(eSts(Ω
′−1)Z − 1)
Ω′ − 1. (3.40)

40 Simplified Mathematical Model for Tunnel Kilns
WhereZ =
z
Lk(3.41)
and
Ω′ =1
Ω=
Mscs
Mgcpg. (3.42)
To obtain the outlet gas temperature equation, the following boundary condition(Ts(z=Lk) = Ts,f ) has to be applied in Eq. 3.40
Tg,out =Ts,f (Ω
′ − 1)− Ts,in(Ω′ − eSts(Ω′−1))
eSts(Ω′−1) − 1. (3.43)
Then from these two equations 3.39 and 3.40 the temperature distribution for gas andsolid for case ”A” can be drawn. The energy consumption Es is represented by Eq. 3.9,Tg,out is represented by Eq. 3.43 and the specific heat capacity ratio is represented byEq. 3.26. From these equations the energy consumption is a function of the Stantonnumber and excess air number (Es = f(Tg,out,λ)). The data used in the calculations arerepresented in table 3.1.
The equations are solved by a MATLAB program. The output results from thisprogram are represented in Fig. 3.6 which shows a comparison of the energy consumptionfor omega equal one (Ω = 1) with that of case A under the same condition of caseA. The figure shows the energy consumption as a function of the Stanton number for
1 2 3 4 5 6 7 8
Sts
0.8
0.9
1
1.1
1.2
1.3
1.4
1.5
1.6
1.7
1.8
ES
(M
J/k
gS)
=1
Ts=950 K, Emin=0.83MJ/kgs
=1.9
=1.7
=1.5
=1.3
=1.0
Figure 3.6: Energy consumption for case A.
different excess air numbers. It is obvious that for constant excess air number, the energyconsumption decreases as Stanton number increases. The trend is the same for any excess

Simplified Mathematical Model for Tunnel Kilns 41
air number. The Stanton number increases if the heat transfer coefficient (α) increases.The figure demonstrates that for Stanton < 3, with a little decrease in Stanton numberresults in a big decrease of Es for same excess air number. Furthermore, the figure showsalso that as excess air number increase the energy consumption increase. From the figurethe value of the Stanton number with excess air number with its corresponding energyconsumption the specific heat capacity ratio which is equal to one could be found.
The following sections focus on the results from solving the two first order ordi-nary differential equations (ODEs) Eqs. 3.16 and 3.21 of gas and solid numerically.The commercial code (bvp4c) is used to solve system of coupled ODE and boundaryconditions. The bvp4c solver requires two boundary conditions for the solution in whichthe solid inlet and outlet temperatures are known (inlet temperature of solid Ts,in,and outlet solid temperature Ts,f ). Appendix (A), shows the basics of bvp4c solver.Furthermore, from the program results the temperature profiles for the gas and solidalong the two zones (preheating and firing) are obtained. Some variables used in solvingthis system are listed in table 3.1.
Figure 3.7 shows the effect of Stanton number on temperature distribution forconstant excess air. This figure illustrates that as Stanton number increases the energyconsumption E decreases and so the outlet gas temperature decreases. The value ofenergy consumption could be seen in Fig. 3.6. Also figure 3.7 shows that as Stantonnumber increases the temperature profiles are completely different. As a consequence,the Stanton number has a big influence on the outlet gas temperature.
0 10 20 30 40 50z (m)
0
200
400
600
800
1000
1200
1400
1600
1800
2000
Te
mp
era
ture
oC
Gas
Solid
=1.3Sts=1, =1.2901
Sts=2, =0.607
Sts=3, =0.5512
Figure 3.7: Temperature profile, case A, λ = 1.3.
Figure 3.8 shows the influence of excess air number on both temperature distributionand outlet gas temperature. The figure shows that the lower the excess air number thelower the outlet gas temperature, this is due to the decrease in energy consumption for

42 Simplified Mathematical Model for Tunnel Kilns
Sts= 3 with the required outlet solid temperature. The figure shows that at λ = 1.3the flue gases has a lower temperature which is required to prevent thermal pollution.Moreover, from these results the outlet gas temperature can be controlled and regulatedaccording to the requirements. In some cases the outlet flue gases are used for the dryingprocess and its temperature should be a little bit higher.
0 10 20 30 40 50z (m)
0
200
400
600
800
1000
1200
1400
1600
1800
2000
Te
mp
era
ture
oC Gas
Solid
Sts=3
=1.7, =0.8328
=1.5, =0.7095
=1.3, =0.5512
Figure 3.8: Temperature profile for different excess air number, case A, Sts=3.
3.4 Effect of firing zone length
Case A has a low heat transfer coefficient (α) because of low axial velocity, the gas flowsmainly above and not through the load. Therefore, a row of burners is used for gas mixingin cross section. The following sections study the effect of firing zone length.
3.4.1 The whole kiln is the firing zone : Case B
In this section the two zones, firing and preheating zones, are considered as firing zoneand will be further called ”Case B”. In addition to the previous assumptions used in caseA, the following assumption is included.
Assumption :
? The fuel is distributed uniformly along the firing zone of length Lf .
Figure 3.9 shows schematic description for case B. This figure shows that there is ahomogeneous inlet of combustion gas along the kiln.

Simplified Mathematical Model for Tunnel Kilns 43
𝐓𝐠,𝐢𝐧= 𝐓𝐚𝐝 , 𝐌 𝐠
Combustion
𝐌 𝐠,𝐦𝐚𝐱,𝐓𝐠,𝐨𝐮𝐭
𝐀𝐢𝐫, 𝐌 𝐚,𝐓𝐚
𝐌 𝐬,𝐓𝐬,𝐟 𝐓𝐬,𝐢𝐧
𝐅𝐮𝐞𝐥, 𝐌 𝐅,𝐓𝐅
Gas
Lf = Lk
Air curtain
Kiln door
Product
Kiln car
z
Figure 3.9: Continuously combustion gas injection along the entire kiln (case B only firingzone).
The axial distribution of gas flow is given as
Mg(z) =Mg,max
Lf(Lk − z). (3.44)
Then, with Eq. 3.41 the dimensionless form is obtained
Mg(Z) =Mg,maxLk
Lf(1− Z). (3.45)
WhereLk, the length of the kiln,Lf , the length of the firing zone,Mg,max, the maximum mass flow rate of gases, and
Z=z
Lk.
Then by differentiation with respect to Z the following differential form for thegas mass flow rate is obtained
dMg
dZ= −Mg,maxLk
Lf. (3.46)
• Ordinary differential equation for gas
The gas enthalpy flow is expressed as
Hg = Mg(z)cpgTg(z). (3.47)

44 Simplified Mathematical Model for Tunnel Kilns
Now there are two variables depending on length, z, so that the change in gasenthalpy flow is represented as
dHg = Mg(z)cpgdTg + TgcpgdMg(z). (3.48)
Furthermore, the convective heat transfer between the gas and solid can be expressedas mentioned in Eq. 3.14. For this case there is another source of enthalpy flow inputdue to combustion of fuel is expressed as in the following equation
dHin = Qf,tdz
Lf= Mg,maxcpgTad
−dzLf
. (3.49)
There is a negative sign in dHin because the addition is in the opposite direction ofaxes z.
From the energy balance, the inlet energy to the element is equal to theoutlet one with neglecting heat loss. This energy balance is shown in the followingequation
Mg(z)cpgdTg + TgcpgdMg(z) =αAtLk
(Tg − Ts)dz − Mg,maxcpgTaddz
Lf. (3.50)
Equation 3.50 can be represented in the following form as a general equation
Mg(z)dTgdz
=αAtLkcpg
(Tg − Ts)−Mg,max
Lf(Tad − Tg). (3.51)
By substituting Eq. 3.18 and Eq. 3.45 in Eq. 3.51 the general form for the first orderordinary differential equation (ODE) is obtained as in the following equation
(1− Z)dTgdZ
= StgLfLk
(Tg − Ts)− (Tad − Tg). (3.52)
In case B, the firing length is equal to kiln length (Lf=Lk). Therefore, by replacingthis condition in the foregoing equation, the equation for case B is obtained
(1− Z)dTgdZ
= Stg(Tg − Ts)− (Tad − Tg). (3.53)
• Ordinary differential equation for solid
There is no change in energy for the solid, so that Eq. 3.22 represents the solidequation as before in case A. The two first order ordinary differential equationsneed two boundary conditions to be solved. These two boundary conditions are
Ts(z=0)= Ts,in
(3.54)
Ts(z=Lk) = Ts,f .

Simplified Mathematical Model for Tunnel Kilns 45
By the same way the MATLAB (commercial code) is used to solve the system of ordinarydifferential equations (ODEs) by bvp4c solver to obtain the results.
Figure 3.10 illustrates the energy consumption as a function of Stanton numberfor different excess air numbers. The figure demonstrates that for constant excessair number, the energy consumption decreases as Stanton number increases. Thetrend is the same for any excess air number. Furthermore, the figure shows that asexcess air number increase the energy consumption increase for the same Stanton number.
1 2 3 4 5 6 7 8
Sts
0.8
1
1.2
1.4
1.6
1.8
2
2.2
2.4
ES
(M
J/k
gS)
Ts=950 K, Emin=0.83MJ/kgs
=1.9
=1.7
=1.5
=1.3
=1.0
Figure 3.10: Energy consumption for case B.
Figure 3.11 shows the ratio of energy for both cases ”B” and ”A” as a function of Stantonnumber for different values of excess air number. From the figure, it can be seen that theenergy consumption for case ”B” is always higher than case ”A”. The difference is thehigher the Stanton number and the lower excess air number is.
Figures 3.12 and 3.13 show the temperature profiles of the gas and the solid.Figure 3.12 shows the effect of Stanton number on temperature profile for constant excessair number of value λ = 1.3. The figure shows that the lower the Stanton number isthe higher the energy consumption which results in a higher flue gas temperature. Bycomparing Fig. 3.12 with the corresponding figure in case ”A” (Fig. 3.7), it is obviousthat the profiles are completely different.
The influence of excess air number on temperature distribution for both gas andsolid is shown in Fig. 3.13. By comparing Fig. 3.13 with the corresponding figure incase ”A” (Fig. 3.8), it is obvious that the profiles are completely different. The gas

46 Simplified Mathematical Model for Tunnel Kilns
temperature has a maximum value. The temperature of the solid increases sharply atthe entrance and weaker at the end of the firing zone.
1 2 3 4 5 6 7 8
Sts
1
1.2
1.4
1.6
1.8
2
2.2
2.4
EB/E
A
=1.9
=1.7
=1.5
=1.3
=1.0
Figure 3.11: Comparison of energy consumption for cases A and B.
0 10 20 30 40 50z (m)
0
200
400
600
800
1000
1200
1400
1600
Te
mp
era
ture
oC
Gas
Solid
=1.3
Sts=1
Sts=2
Sts=3
Figure 3.12: Temperature profile, case B, λ = 1.3.
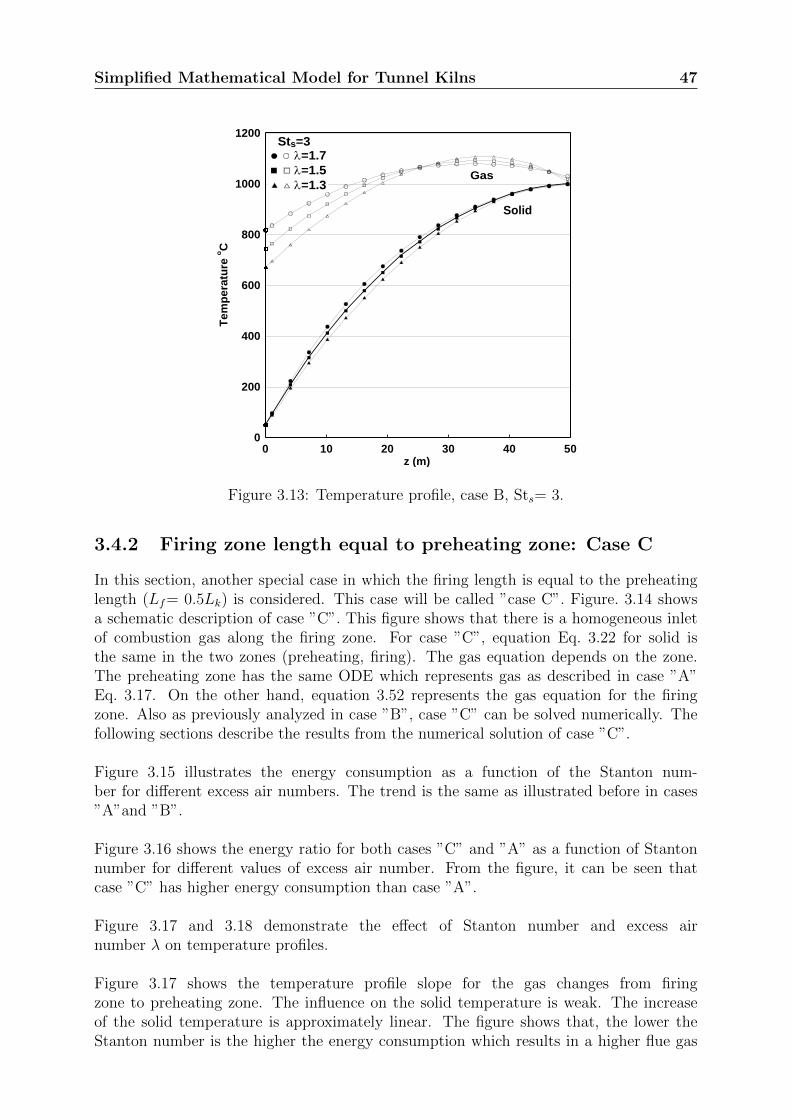
Simplified Mathematical Model for Tunnel Kilns 47
0 10 20 30 40 50z (m)
0
200
400
600
800
1000
1200
Te
mp
era
ture
oC
Gas
Solid
Sts=3=1.7
=1.5
=1.3
Figure 3.13: Temperature profile, case B, Sts= 3.
3.4.2 Firing zone length equal to preheating zone: Case C
In this section, another special case in which the firing length is equal to the preheatinglength (Lf= 0.5Lk) is considered. This case will be called ”case C”. Figure. 3.14 showsa schematic description of case ”C”. This figure shows that there is a homogeneous inletof combustion gas along the firing zone. For case ”C”, equation Eq. 3.22 for solid isthe same in the two zones (preheating, firing). The gas equation depends on the zone.The preheating zone has the same ODE which represents gas as described in case ”A”Eq. 3.17. On the other hand, equation 3.52 represents the gas equation for the firingzone. Also as previously analyzed in case ”B”, case ”C” can be solved numerically. Thefollowing sections describe the results from the numerical solution of case ”C”.
Figure 3.15 illustrates the energy consumption as a function of the Stanton num-ber for different excess air numbers. The trend is the same as illustrated before in cases”A”and ”B”.
Figure 3.16 shows the energy ratio for both cases ”C” and ”A” as a function of Stantonnumber for different values of excess air number. From the figure, it can be seen thatcase ”C” has higher energy consumption than case ”A”.
Figure 3.17 and 3.18 demonstrate the effect of Stanton number and excess airnumber λ on temperature profiles.
Figure 3.17 shows the temperature profile slope for the gas changes from firingzone to preheating zone. The influence on the solid temperature is weak. The increaseof the solid temperature is approximately linear. The figure shows that, the lower theStanton number is the higher the energy consumption which results in a higher flue gas

48 Simplified Mathematical Model for Tunnel Kilns
Combustion
𝐌 𝐠,𝐦𝐚𝐱,𝐓𝐠,𝐨𝐮𝐭
𝐀𝐢𝐫, 𝐌 𝐚,𝐓𝐚
𝐌 𝐬,𝐓𝐬,𝐟 𝐓𝐬,𝐢𝐧
𝐅𝐮𝐞𝐥, 𝐌 𝐅,𝐓𝐅
𝐓𝐠,𝐢𝐧= 𝐓𝐚𝐝 , 𝐌 𝐠
Gas
Lk
Air curtain
Kiln door
Product
Kiln car
Lf
z
Figure 3.14: Kiln with heating and firing zones(case C).
1 2 3 4 5 6 7 8
Sts
0.8
1
1.2
1.4
1.6
1.8
2
Es (M
J/k
gs)
=1.9
=1.7
=1.5
=1.3
=1.0
Ts=950 K, Emin=0.83MJ/kgs
Lf = 0.5 Lk
Figure 3.15: Energy consumption for case C.
temperature.
Figure 3.18 shows the influence of excess air number on temperature profile forboth gas and solid. The influence on the solid temperature is weak. The increase of thesolid temperature is approximately linear. The figure shows that the higher the excess air

Simplified Mathematical Model for Tunnel Kilns 49
number is the higher the energy consumption, resulting in a higher flue gas temperature.
1 2 3 4 5 6 7 8
Sts
1
1.1
1.2
1.3
EC/E
A
=1.9
=1.7
=1.5
=1.3
=1.0
Lf = 0.5 Lk
Figure 3.16: Comparison of energy consumption for cases A and C.
0 10 20 30 40 50z (m)
0
200
400
600
800
1000
1200
1400
1600
1800
Te
mp
era
ture
oC
Lf =25 m
Gas
Solid
=1.3
Sts=1
Sts=2
Sts=3
Figure 3.17: Temperature profile, case C, with firing zone length of 25 m, λ = 1.3.

50 Simplified Mathematical Model for Tunnel Kilns
0 10 20 30 40 50z (m)
0
200
400
600
800
1000
1200
Te
mp
era
ture
oC
Lf = 25 m
Gas
Solid
Sts=3=1.7
=1.5
=1.3
Figure 3.18: Temperature profile, case C, with firing zone length of 25 m, Sts=3.
3.4.3 Different firing zone length
This section presents a sample of results to show the effect of firing zone length ontemperature profiles for both gas and solid. In the burning zone the two general equationsEq. 3.22 and Eq. 3.52 for solid and gas respectively are solved. In the preheating zonethe two general equations Eq. 3.22 and Eq. 3.17 for solid and gas are solved so that theeffect of firing zone length can be studied.
Firing length has great effects on the energy consumption according to the valueof excess air number for the same Stanton number. The following curves explain theeffect of the firing length on energy consumption.
Figure 3.19 and 3.20 show the influence of the firing length ratio on the energyconsumption for different excess air numbers and Stanton numbers. The energy con-sumption always increases with the firing zone length. The increase is stronger the lowerthe Stanton number and the higher the excess air number. The energy consumptionincreases progressively with the firing zone length. However, up to approximately ∼30 %,the increase is relatively low. As a consequence, from the model, the firing zone lengthshould be as short as possible for low energy consumption.
In Fig. 3.21 the temperature profiles are compared for the three cases for Sts = 2 andλ = 1.3 as an example. From the figure it can be seen that, the longer the firing zoneis the stronger is the increase of the solid temperature at the beginning and the lower atthe end of the firing zone. For case ”A” a very high gas inlet temperature occurs. Thishigh gas temperature results in high NOx emissions and a higher quality product andexpensive refractory materials. As a consequence, an extreme short firing zone results inoverly high gas temperatures and in a used proper profile of the solid temperature.

Simplified Mathematical Model for Tunnel Kilns 51
0 0.1 0.2 0.3 0.4 0.5 0.6 0.7 0.8 0.9 1
Firing length ratio (Lf / Lk)
0.8
1.2
1.6
2
2.4
Es (M
J/k
gs)
Sts= 2= 1.7
= 1.5
= 1.3
= 1.0
Figure 3.19: Influence of firing zone length on energy consumption for Sts = 2.
0 0.1 0.2 0.3 0.4 0.5 0.6 0.7 0.8 0.9 1
Firing length ratio(Lf /Lk)
0.8
1.2
1.6
2
2.4
Es (M
J/k
gs)
=1.3
Sts=1
Sts=2
Sts=3
Figure 3.20: Influence of firing zone length on energy consumption for λ = 1.3.
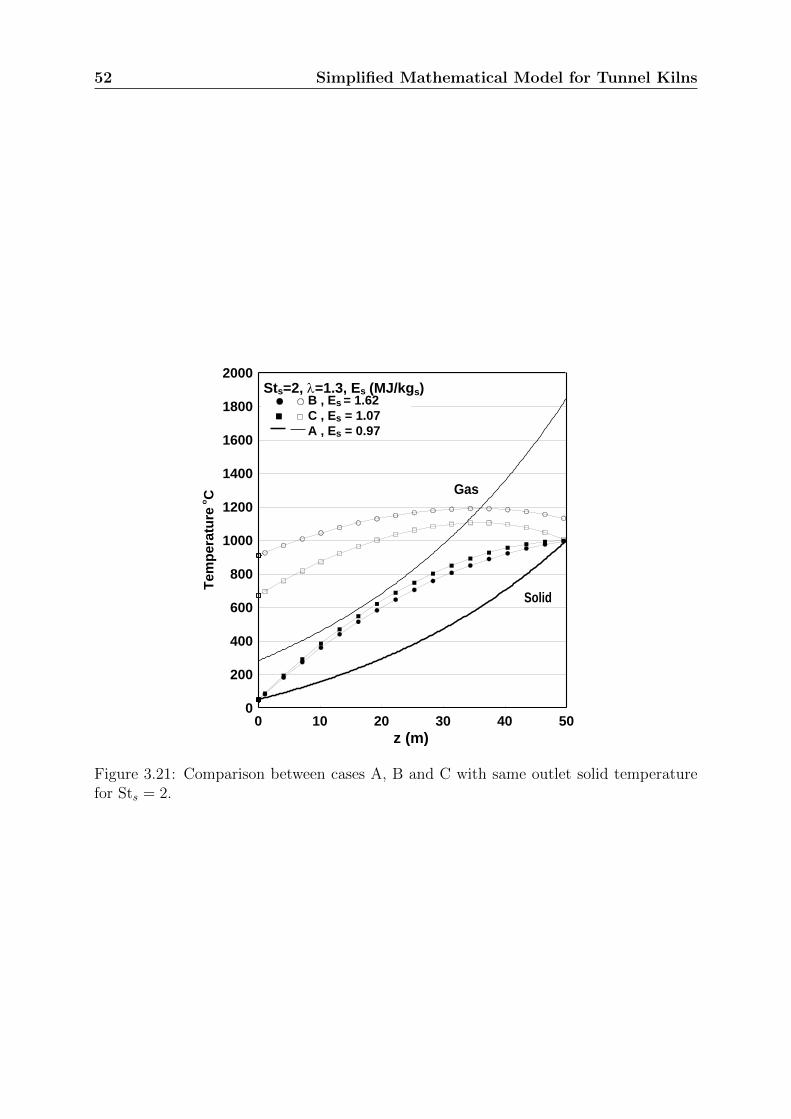
52 Simplified Mathematical Model for Tunnel Kilns
0 10 20 30 40 50
z (m)
0
200
400
600
800
1000
1200
1400
1600
1800
2000
Tem
pera
ture
oC Gas
Solid
Sts=2, =1.3, Es (MJ/kgs)B , Es = 1.62
C , Es = 1.07
A , Es = 0.97
Figure 3.21: Comparison between cases A, B and C with same outlet solid temperaturefor Sts = 2.
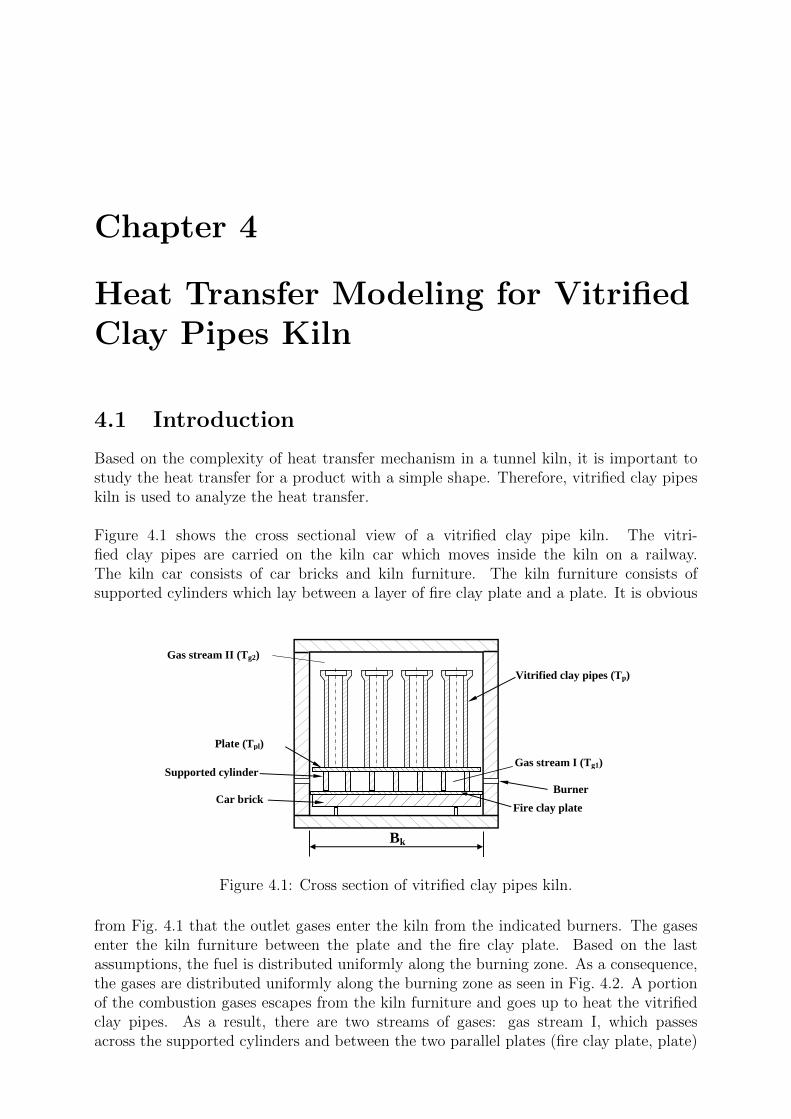
Chapter 4
Heat Transfer Modeling for VitrifiedClay Pipes Kiln
4.1 Introduction
Based on the complexity of heat transfer mechanism in a tunnel kiln, it is important tostudy the heat transfer for a product with a simple shape. Therefore, vitrified clay pipeskiln is used to analyze the heat transfer.
Figure 4.1 shows the cross sectional view of a vitrified clay pipe kiln. The vitri-fied clay pipes are carried on the kiln car which moves inside the kiln on a railway.The kiln car consists of car bricks and kiln furniture. The kiln furniture consists ofsupported cylinders which lay between a layer of fire clay plate and a plate. It is obvious
Bk
Burner Car brick
Plate (Tpl)
Vitrified clay pipes (Tp)
Fire clay plate
(Tfc)
Supported cylinder
(Tcyl)
Gas stream II (Tg2)
Gas stream I (Tg1)
Figure 4.1: Cross section of vitrified clay pipes kiln.
from Fig. 4.1 that the outlet gases enter the kiln from the indicated burners. The gasesenter the kiln furniture between the plate and the fire clay plate. Based on the lastassumptions, the fuel is distributed uniformly along the burning zone. As a consequence,the gases are distributed uniformly along the burning zone as seen in Fig. 4.2. A portionof the combustion gases escapes from the kiln furniture and goes up to heat the vitrifiedclay pipes. As a result, there are two streams of gases: gas stream I, which passesacross the supported cylinders and between the two parallel plates (fire clay plate, plate)

54 Heat Transfer Modeling for Vitrified Clay Pipes Kiln
gas stream II, which escapes from the space between the kiln side walls and the plateand it passes across the vitrified clay pipes. Obviously, the main source of the gases isthe combustion gases which come from the burners. The used data in calculations isrepresented in table 4.1.
Combustion
𝐀𝐢𝐫, 𝐌 𝐚 ,𝐓𝐚
𝐅𝐮𝐞𝐥, 𝐌 𝐅
𝐓𝐠,𝐢𝐧 = 𝐓𝐚𝐝
𝐌 𝐬,𝐓𝐬,𝐟 𝐓𝐬,𝐢𝐧
Solid,
z
Fire clay plate
Gas
Lk
Air curtain
Kiln car
Kiln door
Lf
Car brick
Supported cylinder
Vitrified clay pipes
plate
𝐌 𝐠,𝐦𝐚𝐱,𝐓𝐠,𝐨𝐮𝐭
Figure 4.2: Schematic description of vitrified clay pipes kiln.
This thesis focuses on the burning and preheating zones, so that the calculations arerelated to these two zones. Furthermore, the calculations take into consideration thepipes and kiln furniture without car bricks. Due to highly sintering region in the tunnelkiln, the heat transfer analysis of the kiln must include radiation. The radiation analysisincludes gas to solid radiation and solid to solid radiation.
4.2 Modeling of heat transfer
From the last description of the kiln and the gas flows inside the kiln, the heat is transferredfrom the first gas stream (gasI) to the kiln furniture (fire clay plate, supported cylindersand plate) by convection and radiation. The heat is transferred by convection from thegas to the solids from the gas motion. According to high temperature of the gas the heatis radiated from gas I to plate, fire clay plate, and the supported cylinders. The secondpart of radiation is due to solid to solid radiation which comes from the fire clay plate tothe plate and the radiation which comes from the supported cylinders to the plate. Thenthe plate radiates the heat to the vitrified clay pipes. Regarding the second gas stream(gasII) the two types of heat transfer exist. Due to gas motion through the vitrified claypipes the heat is transferred by convection to the pipes. Moreover, the gas radiates heatto the pipes. The following sections describe in detail these two types of heat transfer

Heat Transfer Modeling for Vitrified Clay Pipes Kiln 55
Table 4.1: Data used in calculations
Symbol Description Value Unit
used fuel natural gas H type
Bk kiln width 4.1 m
Bc car width 4.0 m
cpgo specific heat of air 1.0 kJ/(kg·K)
ccyl specific heat of cylinders 0.85 kJ/(kg·K)
cfc specific heat of fire clay 0.85 kJ/(kg·K)
cp specific heat of pipes 0.85 kJ/(kg·K)
cpl specific heat of plate 0.85 kJ/(kg·K)
Di pipe inner diameter 0.5 m
D pipe outer diameter 0.613 m
dcyl cylinder diameter 0.15 m
Hk kiln height 3.3 m
Hp pipe height 2.6 m
hcyl cylinder height 0.300 m
hfc fire clay height 0.050 m
hpl plate height 0.080 m
hu lower heating value 47300 kJ/kgfuel
Lk kiln length 77 m
Lf burning zone length 35 m
L air demand 16.9 kgair/kgfuelMcar car mass flow rate 65 t/day
Mcyl supported cylinders mass flow rate 4 t/day
Mfc fire clay plate mass flow rate 10 t/day
Mp vitrified clay pipes mass flow rate 115 t/day
Mpl plate mass flow rate 11 t/day
N total number of pipes 406
Ta air temperature 298 K
To reference temperature 273 K
Ts,in all solid inlet temperature 150 C
Tp,f pipe outlet temperature 1115 C
ρcyl
density of cylinders 800 kg/m3
ρfc
density of fire clay 1200 kg/m3
ρp density of pipes 2000 kg/m3
ρpl
density of plate 1000 kg/m3
εcyl
cylinder emissivity 0.59
εfc
fire clay emissivity 0.59
εp pipe emissivity 0.8
εpl
plate emissivity 0.59
(convection and radiation) inside the kiln. The calculations are done for the vitrified claypipes kiln.

56 Heat Transfer Modeling for Vitrified Clay Pipes Kiln
4.3 Convective heat transfer analysis
Convection takes place due to gas motion along the axial direction of the kiln and itsdirect contact with solids. As a result, calculating the convective heat transfer coefficientα along the axial direction of the kiln is important. There are two arrangementsin the vitrified clay pipes kiln, the first arrangement is a staggered arrangement forthe pipes, the second an in-line arrangement for the supported cylinders. Therefore,the following section describes the convective heat transfer analysis for both arrangement.
4.3.1 Vitrified clay pipes
This section describes the way to determine the convective heat transfer coefficient for thevitrified clay pipes in the kiln. Vitrified clay pipes are arranged on kiln car in staggeredarrangement. Reynolds number and Nusselt number are required in the calculation ofconvective heat transfer. So that, some properties are required in the calculations. Thefollowing set of equations Eq. 4.2 calculates these required gas properties (density, kine-matic viscosity and thermal conductivity). In these equations, the reference temperatureTo = 273K is taken [39]. The gas properties at this reference temperature is taken fromtable 4.2.
cpg(T)
cpo(To)=
1
nc + 1
((T/To)
nc+1 − 1
(T/To)− 1
)(4.1)
ρgρo
=
(T
To
)−1
;µgµo
=
(T
To
)nµ;νgνo
=
(T
To
)nµ+1
;λgλo
=
(T
To
)nλ(4.2)
Table 4.2: Gas properties at reference temperature.
Gas M ρo cpo nc λo nλ µo nµ Pr
(kg/kmol) (kg/m3) (kJ/(kg·K)) - (W/(m·K)) - (mg/(m·s)) - -
N2 28 1.26 1.00 0.11 0.024 0.76 16.8 0.67 0.70
Air 29 1.29 1.00 0.10 0.025 0.76 17.4 0.67 0.70
O2 32 1.44 0.9 0.15 0.025 0.8 19.7 0.67 0.70
CO2 44 1.98 0.84 0.3 0.017 1.04 14.4 0.77 0.73
H2O 18 0.81 1.75 0.2 0.016 1.42 8.7 1.13 0.95
Hence to get the heat transfer coefficient in the kiln the following approach is used.
Figure 4.3 illustrates the arrangement of the vitrified clay pipes on the plate. Forthe staggered arrangement, the flow area decreases from area (A1,p = S
THk1
) to thetransverse area (A
T= (S
T−D)H
k1) where, H
k1, is the total height of the kiln without
the height of kiln furniture (i.e. Hk1
= Hk − hfc − hcyl − hpl) andD, the outer diameter of the pipe.
From basic calculations of cross flow over tube of banks, Reynolds number is calculatedfrom equation 4.3 [40]. The value of Reynolds number in cross flow calculations based on

Heat Transfer Modeling for Vitrified Clay Pipes Kiln 57
AT
ST
A1 AD
AD
SL D
SD
1st row 2nd row 3rd row
Tra
nsve
rse
pitch
Longitudinal pitch
Ga
s I
I
Figure 4.3: Schematic description for pipes arrangement on kiln car.
the maximum velocity wmax which is based on the arrangement of pipes
Re =wmaxD
νg. (4.3)
Where
wmax =ST
ST−D
wg (4.4)
and wg, the approach velocity of the gas and it is calculated from the following equation
wg =Mg
ρgHk1Bk
. (4.5)
The maximum velocity wmax is calculated according to Eq. 4.4 for staggered arrangementwhen the following condition occurred
SD>
(ST
+D)
2. (4.6)
WhereSD
, the diagonal pitch and it is calculated from the following equation
SD
=
√S2L
+
(ST
2
)2
. (4.7)
on the other hand if the condition does not occurred, the maximum velocity will calculatedaccording to Eq. 4.8
wmax =ST
2(SD−D)
wg . (4.8)

58 Heat Transfer Modeling for Vitrified Clay Pipes Kiln
4.3.2 Supported cylinders
Figure 4.4 demonstrates the arrangement of the supported cylinders which lies betweenthe plate and fire clay plate. The supported cylinders are part of kiln furniture. In the in-line arrangement, the flow area decreases from area (A
1,cyl= S
T,cylhcyl) to the transverse
area (AT,cyl
= (ST,cyl− d)hcyl). Where hcyl, is the cylinder height and d, the cylinder
diameter.
AT
SL
1st row 2nd row 3rd row
ST
A1
D
Tra
nsve
rse
pitch
Longitudinal pitch
Ga
s I
Figure 4.4: Schematic description for cylinders arrangement in the kiln furniture.
The calculation of Reynolds number for the supported cylinders is represented in Eq. 4.9.Where, the maximum velocity wmax2 is calculated according to Eq. 4.10 which is basedon the arrangement of the supported cylinders
Re2 =wmax2d
νg. (4.9)
wmax2 =ST,cyl
ST,cyl− d
wg2 (4.10)
Wherewg2 , the approach velocity of the gas and it is calculated from the following equation
wg2 =Mg2
ρghcylBk
. (4.11)
4.3.3 Nusselt number determination
Nusselt number is important to calculate the heat transfer coefficient for convection prob-lems. The Nusselt number can be represented as a function in convective heat transfercoefficient (α) as
Nu =αLc
λg. (4.12)

Heat Transfer Modeling for Vitrified Clay Pipes Kiln 59
Whereα, the convective heat transfer coefficient,λg , the thermal conductivity of gas, andLc, the characteristic length which is the corresponding diameter in this case.
Consequently, the change in convective heat transfer is as following
dQconv = αAt (Tg − Ts) dZ. (4.13)
Many correlations are used to obtain Nusselt number. These correlations depend on thesolid arrangements and type of flow. Zukauskas [41] proposed a correlation to calculatethe average Nusselt number. In addition to Zukauskas correlation, there is anothercorrelation derived by Huge [42] and Pierson [43]. But Hausen [44] modified slightly thePrevious correlation and presented an empirical formula for the tubes arrangement factorFa instead of the graphical representation. Therefore, Nusselt number correlations differfrom one case to another.
Recently, Khan et al. [45] investigated analytically the heat transfer from tubebanks for in-line or staggered arrangement in cross flow under isothermal boundarycondition. A correlation for Nusselt number for both arrangements (in-line and staggered)was represented. This correlation is shown in equation 4.14 in which Reynolds number iscalculated according to Eq. 4.3 or Eq. 4.9 which is based on the diameter
NuD
= C1Re1/2DPr1/3. (4.14)
WhereD, the diameter of tube, (m)
C1 was determined according to the arrangement and was reported as follows :
• For in-line arrangement
C1 = (0.25 + exp(−0.55ϕL))ϕ0.285
Tϕ0.212L
(4.15)
• For staggered arrangement
C1 =0.61ϕ0.091
Tϕ0.053L
(1− 2 exp(−1.09ϕL))
(4.16)
WhereϕL, the dimensionless longitudinal pitch, and
ϕT, the dimensionless transverse pitch.
• for pipes
ϕT
=ST
D,ϕ
L=SL
D
(4.17)
• for cylinders
ϕT
=ST,cyl
d, ϕ
L=SL,cyl
d
(4.18)

60 Heat Transfer Modeling for Vitrified Clay Pipes Kiln
4.4 Radiative heat transfer analysis
4.4.1 Introduction
Radiation is one of the heat transfer mechanisms which depends on the high flowtemperatures. There are two types of radiation that occur in a kiln; gas radiationand solid to solid radiation. The gas radiation depends on solid emissivity and gasemissivity. For solid emissivity each solid material has an emissivity value stated intables. The gas emissivity depends on gas temperature and gas mixture. Carbon dioxideand water vapor are the most important gases in gas mixture. Therefore, calculatingthe emissivity of CO2 andH2O is one of the most important steps in radiation calculations.
• Carbon dioxide and water vapor emissivities determination
The total emissivity εg of CO2 − H2O mixture depends on the temperature, thethickness (Pg·s) of the layer (mean beam length), the partial pressure Pg of theradiant gas, and the total pressure p of the gas mixture. An approximate value forthe mean beam length s for geometries can be obtained from the equation [46]
s = 0.94VgA. (4.19)
WhereinVg, volume of the gas, andA, the surface area around the gas body.For example VgII = Vk1 − Vpipes, A= surface area of pipes, Vcyl =9.68 m3 totalvolume of the supported cylinders, and As,cyl=258 m2.
The beam length for gasI = 0.37 m.The beam length for gasII = 1.05 m.
The volume concentration which is used to calculate the partial pressure forcarbon dioxide and water vapor in the gas mixture is obtained from Fig. 4.5 [47].Therefore, the partial pressure is obtained as
Pg = PtXg. (4.20)
Where, Xg, the volume concentration of the gas, andPt, total pressure.
Figure 4.6 and Fig. 4.7 show the Hottel’s charts used to obtain the CO2 and H2Oemissivity, respectively. Equation 4.21 represents the approximated equation whichused to calculate CO2 and H2O emissivities (εgi ) [48] and i refers to the gas
εgi = Ab exp−BbT . (4.21)
WhereAb and Bb are functions in beam length and partial pressure for carbon dioxide andwater vapor. The equation which represent the two functions could be representedas in table 4.3. T represents gas temperature in Kelvin degree.

Heat Transfer Modeling for Vitrified Clay Pipes Kiln 61
1 1.1 1.2 1.3 1.4 1.5 1.6 1.7 1.8 1.9 2Excess air number ()
0
0.02
0.04
0.06
0.08
0.1
0.12
0.14
0.16
0.18
0.2
Vo
lum
e c
on
cen
tra
tio
n
Natural gas
CO2
H2O
Figure 4.5: Composition of combustion gas of natural gas [47].
Table 4.3: Used equations to calculate CO2 −H2O emissivity [48].
Gas Ab Bb Pg·s in bar.m T in KCO2 0.51(Pg·s)0.26 6.7× 10⁻⁴(Pg·s)−0.085 0.01− 1.5 > 1200
2.0(Pg·s)0.54 0.001− 0.01
H2O 0.6(Pg·s)0.25 5.3× 10⁻⁴(Pg·s)−0.2 0.1− 2 > 10000.87(Pg·s)0.47 0.01− 0.1
• Gas mixture emissivity
An approximated equation which can be directly used in MATLAB program is used todetermine the gas mixture emissivity. The approximated equation 4.22 [48] is used tocalculate the total emissivity of carbon dioxide and water vapor mixture
εg = εCO2
+ εH2O− ε
CO2εH2O
. (4.22)
4.4.2 Gas to solid radiation calculations
Regarding, the previous calculations of gas emissivity for gases and gas mixtures, theradiative heat transfer between gas and its surroundings can be analyzed. In orderto perform to do such calculations there is a simplification that should be taken intoconsideration, the emissivity is equal to the absorptivity (αg = εg) [49].

62 Heat Transfer Modeling for Vitrified Clay Pipes Kiln
Figure 4.6: Emissivity εCO2
of carbon dioxide at a total pressure of 1 bar as a function oftemperature and the product of P
CO2·s [46].
Figure 4.7: Emissivity εH2O
of water vapor at a total pressure of 1 bar as a function oftemperature and the product P
H2O·s [46].

Heat Transfer Modeling for Vitrified Clay Pipes Kiln 63
The general form of change in radiative heat transfer between gas and solid isrepresented in Eq. 4.23. This change depends on the elementary area and it is a functionof the length
dQr =εσAtLk
(T 4g − T 4
s
)dz. (4.23)
The effective emissivity between the gas mixture and solid material is calculatedaccording to Eq. 4.24
ε =1
1
εs+
1
εg− 1
. (4.24)
WhereTg, the temperature of gas,Ts, the temperature of solid,ε, the effective emissivity, andεs, the emissivity of solid material.
Solving Eq. 3.19 and Eq. 4.23 together, the following equation for the change inradiative heat transfer is obtained
dQr = αrAt (Tg − Ts) dZ. (4.25)
Whereαr, the radiative heat transfer coefficient.
The following equation represents one of the approximated forms of the radiativeheat transfer coefficient as a function of effective emissivity and gas and solid tempera-tures
αr = εσT 3g
[1 +
(TsTg
)+
(TsTg
)2
+
(TsTg
)3]. (4.26)
4.4.3 Solid to solid radiation
Radiation from surface to another depends on the orientation relative to each other.Therefore the view factor must be determined. In special geometrical cases, the viewfactor is tabulated for many technical situations. In other arbitrary cases in the vitrifiedclay kiln, some views factors have to be explained. Figure 4.1 shows the arrangementsof vitrified clay pipes and the kiln furniture arrangements so the view factor could beexplained for such arrangements. The following sections describe these different viewfactors in the illustrated vitrified clay kiln.
• Fire clay plate to plate view factor :
The fire clay plate is placed on the kiln car. According to the expected temperaturedifference between the fire clay plate and the plate, there is heat transferred byradiation. In Fig. 4.8, the fire clay plate is parallel to the plate. From heat transfer

64 Heat Transfer Modeling for Vitrified Clay Pipes Kiln
Bc
Fire clay plate
plate
hcyl
Figure 4.8: Schematic description of the kiln furniture.
basics with some replacements by the shown dimensions, the view factor betweentwo parallel plates is represents by Eq. 4.27 [40].
Ffc→pl =
[1 +
(hcylBc
)2]1/2
−(hcylBc
)(4.27)
WhereBc, the kiln car wide,hcyl, the cylinder height, andFfc→pl , the view factor between fire clay plate and plate.
• Cylinder to plate view factor :
Referring to the vitrified clay tunnel kiln Fig. 4.2, there is an obvious case of cylindersited on a plate. Now, it is required to obtain the view factor for this case. Fig-ure 4.9 [50] shows such a case, the figure represents some dimensions which are usedto calculate the view factor. Equation 4.28 demonstrates the symbols related tothe geometry, these symbols are used in view factor calculation. Equation 4.29 [50]represents the view factor from cylinder to plate.
Area1
r2
h
Area2
r1
Figure 4.9: View factor from outer surface of cylinder to disk at the end of cylinder [50].

Heat Transfer Modeling for Vitrified Clay Pipes Kiln 65
R1 = r1r2
;
H1 = hr2
;
A1 = H12 +R1
2 − 1;
B1 = H12 −R1
2 + 1
(4.28)
Fcyl→pl =
B1
8R1H1
+1
2π
arccos
(A1
B1
)(4.29)
−
[1
2H1
[(A1 + 2)2
R21
− 4
]1/2
arccos
(A1R1
B1
)]− A1
2R1H1
arcsinR1
WhereFcyl→pl , the view factor from the cylinder to the plate.
According to the vitrified clay tunnel kiln schematic description, there aretwo cases which will be described in the following two sections.
1. Supported cylinder to plate view factor :
The supported cylinders in the kiln furniture structure radiate heat to the plate.Figure 4.9 demonstrates the same geometrical representation between cylinder andplate. Therefore, the view factor equation between the supported cylinder andplate is the same as in equation 4.29.
2. Plate to pipes view factor :
Due to temperature deference between the plate and the vitrified clay pipes, theplate radiates heat to the pipes. In order to calculate the view factor from theplate to the pipes, the view from vitrified clay pipes to plate is calculated similarlyas stated in equation 4.29. Then from the reciprocity relation the view factor fromthe plate to vitrified clay pipe is obtained as shown in Eq. 4.30
Fpl→p =
ApApl2
Fp→pl . (4.30)
WhereinFpl→p , the view factor from the plate to vitrified clay pipe,Ap, the surface area of vitrified clay pipes, andApl2, the upper surface area of the plate.
Fp→pl , the view factor from the vitrified clay pipe to the plate. Regarding
the calculation of this view factor; r1 = D/2, r2 = SD/2 and h = Hp.

66 Heat Transfer Modeling for Vitrified Clay Pipes Kiln
The local view factor is determined according to Eq. 4.31. Figure 4.10 shows the viewfactors from plate to pipe, from pipe to plate, and the local view factor from the plate tothe pipe. Furthermore, Fig. 4.11 shows the local view factor from the pipe to plate withlogarithmic scale
Flocal
=d(F
pl→pHp)
dHp
. (4.31)
0 400 800 1200 1600 2000 2400 2800Hp (mm)
0
0.05
0.1
0.15
0.2
0.25
0.3
0.35
0.4
0.45
0.5
0.55
Vie
w f
ac
tor
DN500
Fppl
Fplp
Flocal, ppl
Figure 4.10: View factors between pipe and plate.
0 400 800 1200 1600 2000 2400 2800Hp
0.0001
0.001
0.01
0.1
1
0.0002
0.0004
0.0006
0.0008
0.002
0.004
0.006
0.008
0.02
0.04
0.06
0.08
0.2
0.4
0.6
0.8
Lo
ca
l v
iew
fa
cto
r
Fppl
Figure 4.11: Local view factor.

Heat Transfer Modeling for Vitrified Clay Pipes Kiln 67
4.4.4 Radiative heat transfer determination
To determine the radiative heat exchange between two surfaces two main types of resis-tance have to be determined. The first is surface resistance which depends on the surfaceemissivity. The second is the space resistance which depends on the shape of each surfaceand the view factor between each other. The following equation demonstrates the effectiveemissivity for such a case
εs1→s2 =1(
1− εs1εs1
+1
Fs1→s2+As1
As2
(1− εs2εs2
)) . (4.32)
Wheres1, refers to surface one, ands2, refers to second surface.
Consequently, the radiative heat exchange between the two surfaces is representedas in the following general equation :
dQrs1→s2 = αrs1→s2As1 (Ts1 − Ts2) dZ (4.33)
Therefore, radiative heat transfer coefficient is represented as
αrs1→s2 = εs1→s2σT3s1
[1 +
(Ts2Ts1
)+
(Ts2Ts1
)2
+
(Ts2Ts1
)3]. (4.34)
4.5 Simple case analysis for pipes only
In this section the solution is obtained for only the vitrified clay pipes which means thatall the gases pass through the pipes. In the schematic description of the kiln shown inFig. 4.2, the case looks like case ”C”, but with Lf = 35m. So that Eq. 3.22 representsthe ODE for solid in the two zones (preheating, burning). The gas equation depends onthe zone. Equation 3.17 is used for the preheating zone. Equation 3.52 represents thegas equation for the firing zone.
Figure 4.12 illustrates the energy consumption which is obtained from the bvp4cprogram. The figure shows the energy consumption as a function of Stanton numberfor different excess air numbers. In Fig. 4.12 it is obvious that for constant excess airnumber, the energy consumption decreases as Stanton number increases. The trend isthe same for any excess air number. As a consequence, from the figure a little increase inheat transfer results in a big decrease of Es for same excess air number. Moreover, thefigure shows also that as excess air number increases the energy consumption increasesfor the same Stanton number. The shadow part in the figure represents the range ofenergy consumption in industry.
The heat transfer coefficient is calculated according to the following equation:
α =StsMscsAt
(4.35)

68 Heat Transfer Modeling for Vitrified Clay Pipes Kiln
1 2 3 4 5 6 7 8Sts
0.8
1
1.2
1.4
1.6
1.8
2
2.2
Es (
MJ
/kg
s)
Ts=965 K
=2.1
=1.9
=1.7
=1.5
=1.3
=1.0
Figure 4.12: Energy consumption of simple case analysis for pipes only.
Then, from this equation and the information from table 4.1, the heat transfer coefficientis calculated for each Stanton number. Table 4.4 shows the heat transfer coefficientrelated to each Stanton number with the energy consumption in the shadow area. Theheat transfer coefficient increases by about 76 % if the excess air number changes from1.3 to 2.1 therefore Stanton changes from 1.3 to 5.5. Figure 4.13 shows the temperature
Table 4.4: Some results from the calculations
λ Sts α(W/(m2·K)) E (MJ/kgs) Ω
1.3 1.3 0.724 1.8112 1.1383
1.5 1.8 1 1.696 1.2227
1.7 2.5 1.4 1.6456 1.3385
1.9 3.5 1.9 1.691 1.5318
2.1 5.5 3.1 1.835 1.832
profiles for different excess air numbers which stated in table 4.1. The results are allin the shadow range of energy consumption. In Fig. 4.13, the temperature profile slopefor the gas changes from firing zone to preheating zone. The influence on the solidtemperature is weak. The figure shows that, the lower the excess air number is the higherthe energy consumption which results in a higher flue gas temperature.
Figure 4.14 shows the effect of Stanton number on temperature distribution forconstant excess air number. Moreover, the results are all in the shadow range ofenergy consumption. In the figure, the lower the Stanton number the higher the energyconsumption which results in a higher flue gas temperature. The values of energyconsumption are illustrated in Fig. 4.12. The temperature of the solid is nearly linearalong the two zones and there is approximately no difference between them because of

Heat Transfer Modeling for Vitrified Clay Pipes Kiln 69
the small change in Stanton number.
0 10 20 30 40 50 60 70 80z (m)
0
200
400
600
800
1000
1200
1400
1600
Te
mp
era
ture
oC
Gas
Solid
=1.5, Sts=1.8
=1.7, Sts=2.5
=1.9, Sts=3.5
Figure 4.13: Temperature profile with same energy consumption.
0 10 20 30 40 50 60 70 80z (m)
0
200
400
600
800
1000
1200
1400
Te
mp
era
ture
oC
Gas
Solid
=1.7
Sts=2.2
Sts=2.4
Sts=2.55
Figure 4.14: Temperature profile with excess air number of λ = 1.7.
4.6 Heat transfer analysis results
Figure 4.15 shows the temperature profiles for gas and solid due to convective heattransfer analysis. The figure demonstrates that the excess air number should have ahigher value to obtain the results. In the figure, the temperature of gas and solid increasesharply at the entrance and weaker at the end of the firing zone.

70 Heat Transfer Modeling for Vitrified Clay Pipes Kiln
Figure 4.16 shows the convective heat transfer coefficient α along the kiln. Theheat transfer coefficient increases as the firing length increases. This increase is due tothe increase of the mass flow of gas and as a result increasing of Reynolds number. Atthe end of burning zone there is no more addition of gases, so that the maximum amountof gases passes through the preheating zone. Therefore, the heat transfer coefficient isnearly constant along the preheating zone.
0 10 20 30 40 50 60 70 80z (m)
0
200
400
600
800
1000
1200
Te
mp
era
ture
oC
=2.1, Es=1.06 MJ/kgs
=1.05
Tg
Ts
Figure 4.15: Temperature profile along the kiln.
0 10 20 30 40 50 60 70 80z (m)
0
2
4
6
8
(
W/m
2K
)
= 2.1, Es =1.06MJ/kgs
= 1.05
Figure 4.16: Convective heat transfer coefficient α along the kiln.

Chapter 5
Vitrified Clay Pipes Analysis
5.1 Introduction
This chapter focuses on obtaining the ordinary differential equations (ODEs) which areused to draw the temperature profiles for the vitrified clay pipes kiln along the burning andpreheating zones. Therefore, the convective heat transfer and the radiative heat transferare calculated to obtain these ODEs. The foregoing assumptions for case ”B” are takeninto consideration during the calculations. The analysis is divided into two main sections,burning zone analysis and preheating zone analysis. These analyses are described in thefollowing sections.
5.2 Burning zone analysis
According to the last description of the gas streams, the following sections describe theanalysis for both convective and radiative heat transfer. The analysis is related to solidarrangements and the flow of the gases.
5.2.1 ODE for first gas stream (gasI)
As described before the gas distribution equation along the firing length is represented byEq. 3.44. Moreover, the equation of the first gas stream which passes across the supportedcylinders (gasI) is expressed as
Mg1(z) =(1− f)Mg,maxLk
Lf(1− Z). (5.1)
Wheref, represents the percentage of the gas which escapes to heat up the vitrified clay pipes.
The calculation steps to obtain the ordinary differential equation for gasI (ODE)are the same as described in chapter 3. The change in gas enthalpy flow is expressed byequation 3.48. Then by applying the energy balance with neglecting heat loss as statedin the chapter 3, the following equation is obtained.
dHg = dQg1→pl + dQg1→fc + dQg1→cyl + dHin (5.2)

72 Vitrified Clay Pipes Analysis
Where the enthalpy flow input due to combustion of fuel is represented by equation 3.49.
In Eq. 5.2 there are three terms representing the heat transfer. Each term in-cludes convection and radiation. Therefore, the following subsection shows the details ofeach term to obtain the ODE for gasI .
• Convective and radiative heat transfer calculations
From Fig. 5.1 which shows the arrangement of the supported cylinders, the first gas stream(gasI) passes across the supported cylinders and the heat is transferred by convection.The heat transfer coefficient is calculated according to Eq. 4.12. Therefore, the followingequation represents the convective heat transfer coefficient for gasI
α1 =Nuλg1dcyl
. (5.3)
Whereλg1 , the thermal conductivity of gasI ,α1, the convective heat transfer coefficient for gasI in the burning zone,dcyl
, cylinder diameter, andNu, Nusselt number.
Nusselt number is calculated from the analysis in chapter 4 from Eq. 4.14. Thecalculation is based on the diameter of the supported cylinder. The change in convectiveheat transfer is calculated according to Eq. 4.13.
AT
SL
1st row 2nd row 3rd row
ST
A1
D
Tra
nsve
rse
pitch
Longitudinal pitch
Ga
s I
Figure 5.1: Schematic description for the Supported cylinders arrangement in the kilnfurniture.
In addition to convection, the radiation takes place in the calculations according tohigh temperature of the existing gases. The gas which exists between the kiln furniturestructures radiates heat to kiln furniture (transportation materials). Moreover, the

Vitrified Clay Pipes Analysis 73
furniture structures which are shown in Fig. 4.1 and Fig. 5.1 are taken into considerationduring the calculations. The gases used in radiation calculation are carbon dioxide andwater vapor. Therefore, the total emissivity of carbon dioxide and water vapor mixtureis calculated according to the approximated Eq. 4.22 [48]. Then, the effective emissivitybetween the gas and each solid surface is calculated according to Eq. 4.24. So, theeffective emissivities between gasI and fire clay plate, plate and supported cylinders areobtained as
ε1 =1
1
εpl+
1
εg1− 1
(5.4)
ε2 =1
1
εfc+
1
εg1− 1
(5.5)
ε3 =1
1
εcyl+
1
εg1− 1
. (5.6)
Whereε1, ε2, and ε3 are the effective emissivities between gasI and plate, fire clay plate, andsupported cylinders respectively, andεg1, the total emissivity of the first gas stream (gasI) in the burning zone.
The total heat exchange between gas and its surrounding solids is calculated as
dQg→s = dQr + dQconv. (5.7)
The forgoing two equations 4.13 and 4.25 are used for the convective and radiativeheat exchange between gasI and the surrounded solid surface area. Therefore, fromFig. 4.1 the following equations represent the heat exchange terms between gasI and itssurrounded solid based on surface area.
1. Lower surface of plate
dQg1→pl = (α1 + αr1)Apl1(Tg1 − Tpl)dZ (5.8)
WhereApl1, the lower surface area of the plate.
2. Fire clay platedQg1→fc = (α1 + αr2)Afc(Tg1 − Tfc)dZ (5.9)
WhereAfc, the surface area of the fire clay plate.
3. Supported cylinders
dQg1→cyl = (α1 + αr3)Acyl(Tg1 − Tcyl)dZ (5.10)
WhereAcyl, the surface area of the supported cylinders.

74 Vitrified Clay Pipes Analysis
The three symbols αr1 , αr2 , and αr3 are the radiative heat transfer coefficients betweengasI and plate, fire clay plate, and supported cylinders respectively. The radiative heattransfer coefficients are calculated according to Eq. 4.26.
By replacing Eqs. 3.48, 3.49, 5.8, 5.9 and 5.10 in Eq. 5.2, the following new firstorder ordinary differential equation (ODE) for gasI is obtained as
(1− Z)dTg1dZ
=Lf
Mg,maxcpg1LkApl1(α1 + αr1)(Tg1 − Tpl) + Afc(α1 + αr2)(Tg1 − Tfc)
(5.11)
+Acyl(α1 + αr3)(Tg1 − Tcyl) − ((1− f)Tad − Tg1).
5.2.2 ODE for second gas stream (gasII)
The vitrified clay pipes must be heated until the desired sintering temperature is reached.Therefore, from the description of the kiln furniture there is an amount of gas whichescapes to heat the pipes. The equation which describes the escaped amount is representedas
Mg2(Z) =fMg,maxLk
Lf(1− Z). (5.12)
Wheref, represents the percentage of the gas which escapes to heat up the vitrified clay pipes.
Moreover, this gas amount passes across the vitrified clay pipes and is used to de-termine Reynolds number and therefore Nusselt number. The change in gas enthalpyflow for gasII is expressed as stated in equation 3.48. Then by applying the energybalance with neglecting heat loss as before, the following equation is obtained
dHg2 = dQg2→p + dHin2 . (5.13)
The enthalpy flow input dHin2 in the last equation is the amount of gases which escapedfrom the space between the kiln walls and plate to heat the vitrified clay pipes. Thisamount is the heat source and is represented as
dHin2 = −fMg,maxcpg1TadLkLf
dZ. (5.14)
A negative sign is applied in dHin2 because the addition is in the opposite direction ofaxes z.
Regarding the second term in Eq. 5.13 which includes convection and radiation,the following subsection shows how to obtain it and consequently the ODE for gasII .

Vitrified Clay Pipes Analysis 75
• Convective and radiative heat transfer calculations
The arrangement of the vitrified clay pipes in the kiln is shown in Fig. 5.2. The secondgas stream (gasII) passes across the pipes and the heat is transferred by convection. Theconvective heat transfer coefficient is calculated according to Eq. 4.12. Therefore, for thevitrified clay pipes the convective heat transfer coefficient is represented as
α2 =Nuλg2Dp
. (5.15)
Whereλg2 , the thermal conductivity of gasII ,α2, the convective heat transfer coefficient for gasII in the burning zone,Dp , vitrified clay pipe outer diameter, andNu, Nusselt number.
Nusselt number is calculated from the analysis in chapter 4 from Eq. 4.14 andbased on pipe outer diameter of the pipe. The change in convective heat transfer iscalculated according to Eq. 4.13.
AT
ST
A1 AD
AD
SL D
SD
1st row 2nd row 3rd row
Tra
nsve
rse
pitch
Longitudinal pitch
Ga
s I
I
Figure 5.2: Schematic description for pipes arrangement on kiln car.
The amount of gases which escapes from the space between the kiln walls and plate hasa high temperature and radiates heat to the pipes. This amount is called as before gasIIwhich exists around the vitrified clay pipes as shown in Figures. 4.1 and 5.2. The gasesused in calculations are considered as gas mixture of carbon dioxide and water vapor.Therefore, the total emissivity of carbon dioxide and water vapor mixture is calculatedaccording to the approximated Eq. 4.22 [48]. Then, the effective emissivity betweenthe gas and pipes surface is calculated according to Eq. 4.24. The effective emissivitybetween gasII and vitrified clay pipes is represented as
ε4 =1
1
εp+
1
εg2− 1
. (5.16)

76 Vitrified Clay Pipes Analysis
Whereε4, the effective emissivity between gasII and vitrified clay pipes, andεg2, the total emissivity of the second gas stream in the burning zone.
The foregoing two equations Eq. 4.13 and Eq. 4.25 are used for the convectiveand radiative heat exchange between gasII and the surrounded pipes surface area. Theequation which represents the heat exchange between gasII and the vitrified clay pipes is
dQg2→p = (α2 + αr4)Ap(Tg2 − Tp)dZ. (5.17)
WhereAp, the total surface area of the vitrified clay pipes, andαr4 , the radiative heat transfer coefficient between gasII and vitrified clay pipes.
By replacing Eqs. 3.48, 5.14 and 5.17 in Eq. 5.13, the following new first orderordinary differential equation (ODE) for gasII is obtained
(1− Z)dTg2dZ
=ApLf
fMg,maxcpg2Lk(α2 + αr4)(Tg2 − Tp)−
(cpg1cpg2
Tad − Tg2). (5.18)
5.2.3 ODEs for solids
There are four solids which are considered in the vitrified clay pipes kiln calculations.These four solids are plate, supported cylinders, fire clay plate, and the vitrified claypipes itself. The vitrified clay pipes are subjected to the second gas stream gasII . Theother three solids are subjected to the first gas stream gasI . Therefore, to obtain the ODEfor each solid material the contact gas must be considered for convective and radiativeheat exchange calculations; moreover, the heat exchange between the solids themselves.The general solid enthalpy flow change equation is expressed by equation 3.20. In theequation, s, represents the solid material and it is related to the material name.
The mass flow of solid for each solid material in the kiln is calculated related tothe data in table 4.1 as
Ms = NcarsρsVsLoad. (5.19)
Whereρs , the density of the solid material,Ncars, number of cars in the kiln,Load, the load inside the kiln (car/day), andVs, the volume of solid material per car.
Then the general form of the first order ordinary differential equation ODE forsolid is represented as
MscsdTs = dQg→s + dQs1→s2. (5.20)
In the foregoing equation, there are two terms in the right hand side, each term is calcu-lated according to the heat exchange mechanism. The first term on the right hand side(dQg→s) includes both convective and radiative heat exchange as stated in Eq. 5.7. The

Vitrified Clay Pipes Analysis 77
second term (dQs1→s2) is related to solid to solid radiation. The following section showsin detail, how to obtain the (ODE) for each of the four solids material in the vitrified claypipes kiln.
• Convective and radiative heat transfer for solids
The convective heat transfer coefficients from both gas streams (gasI and gasII) are asdescribed before (α1 and α2).
There are additional terms in the radiative heat transfer calculations which are re-lated to the solid to solid radiation. These additional terms include radiation from thefire clay plate to the plate, radiation from the supported cylinders to the plate, andradiation from the plate to the vitrified clay pipes. Solid to solid radiation depends onview factor determination. As illustrated before in the foregoing chapter, the differentview factors have been mentioned in that chapter. So that, referring to these view factorsthe solid to solid radiation could be obtained as following.
• Fire clay plate to plate radiation
The effective emissivity between the fire clay plate and the plate is calculated ac-cording to Eq. 4.32 and it is expressed as
εfc→pl =
1(1− εfcεfc
+1
Ffc→pl
+AfcApl1
(1− εplεpl
)) . (5.21)
WhereFfc→pl , the view factor between fire clay plate and plate.
The view factor is determined from Eq. 4.27. The radiative heat transfer isdetermined according to Eq. 4.33 in which the radiative heat transfer coefficientis determined according to Eq. 4.34. Therefore, the equation which represents theradiative heat transfer between the fire clay plate and the plate is
dQrfc→pl = αrfc→plAfc(Tfc − Tpl)dZ. (5.22)
Whereαrfc→pl , the radiative heat transfer coefficient between fire clay plate and plate.
• Supported cylinder to plate radiation
The effective emissivity between the supported cylinders and the plate is calculatedaccording to Eq. 4.32 and it is expressed as
εcyl→pl =
1(1− εcylεcyl
+1
Fcyl→pl
+AcylApl1
(1− εplεpl
)) . (5.23)
Where Fcyl→pl , the view factor between supported cylinder and perforated plate.

78 Vitrified Clay Pipes Analysis
The view factor is determined from Eq. 4.29. The radiative heat transfer isdetermined according to Eq. 4.33 in which the radiative heat transfer coefficientis determined according to Eq. 4.34. Therefore, the equation which represents theradiative heat transfer between supported cylinders and plate is expressed as
dQrcyl→pl = αrcyl→plAcyl(Tcyl − Tpl)dZ. (5.24)
Whereαrcyl→pl , the radiative heat transfer coefficient between supported cylinders and plate.
• Plate to vitrified clay pipes radiation
Additionally, the effective emissivity between plate and vitrified clay pipes is calcu-lated according to Eq. 4.32 and it is expressed as
εpl→p =
1(1− εplεpl
+1
Fpl→p
+Apl2Ap
(1− εpεp
)) . (5.25)
WhereFpl→p, the view factor between the plate and the vitrified clay pipes, andApl2, the upper surface area of the plate.
The view factor, the radiative heat transfer, and the radiative heat transfercoefficient are determined from Eqs. 4.30, 4.33, and 4.34 respectively. Therefore,the equation which represents the radiative heat transfer between the plate and thevitrified clay pipes is expressed as
dQrpl→p = αrpl→pApl2(Tpl − Tp)dZ. (5.26)
Whereαrpl→p , the radiative heat transfer coefficient between the plate and the vitrifiedclay pipes.
The ordinary differential equation for each solid is obtained by replacing the correspondingvalues of heat exchange in the right hand side of Eq. 5.20. Moreover, for each solid theright hand side contains three parts of heat exchange. The three parts are convective heattransfer from gas to solid, radiative heat transfer according to gas radiation, and solid tosolid radiation. These parts are related to each gas and its contact solids and also thesolids arrangements as in Figures( 4.1 and 4.2). The following equations represent theODEs for the solids under interest
1. Plate
MplcpldTpldZ
= Apl1(α1 + αr1)(Tg1 − Tpl) + αrfc→plApl1(Tfc − Tpl)
(5.27)
+αrcyl→plAcyl(Tcyl − Tpl)− αrpl→pApl2(Tpl − Tp)

Vitrified Clay Pipes Analysis 79
2. Fire clay plate
MfccfcdTfcdZ
= Afc(α1 + αr2)(Tg1 − Tfc)− αrfc→plApl1(Tfc − Tpl) (5.28)
3. Supported cylinders
McylccyldTcyldZ
= Acyl(α1 + αr3)(Tg1 − Tcyl)− αrcyl→plAcyl(Tcyl − Tpl) (5.29)
4. Vitrified clay pipes
MpcpdTpdZ
= Ap(α2 + αr4)(Tg2 − Tp) + αrpl→pAp(Tpl − Tp). (5.30)
5.3 Preheating zone analysis
The hot gas which passes through the burning zone goes directly to the preheating zoneto preheat the solids before the burning process. So that, the first gas stream (gasI)passes across the supported cylinders and between the plate and the fire clay plate. Thesecond gas stream (gasII) passes across the vitrified clay pipes. Furthermore, the twostreams are sucked out from the kiln by blowers. Likewise, by the same method in theburning zone the ODEs for the two gas streams and the solids in the preheating zoneare obtained. In this region there is no heat source from combustion gases because thecombustion process ends at the end of combustion zone.
5.3.1 ODE for first gas stream (gasI)
In the preheating zone there is no more addition of gases; therefore, the amount of gasesis constant along the zone. The gas amount which passes across the supported cylindersis expressed as
Mg1,pre = (1− f)Mg,max. (5.31)
The calculation steps to obtain the ODE for gasI are the same as described in chapter 3.The change in gas enthalpy flow in the preheating zone is expressed as
dHg1,pre = Mg1,precpg1,predTg1 . (5.32)
Applying the energy balance with neglecting heat loss as stated in the chapter 3, thefollowing equation is obtained
dHg1,pre = dQg1→pl,pre + dQg1→fc,pre + dQg1→cyl,pre. (5.33)
In Eq. 5.33, there are three terms represent the heat transfer. Each term includesconvection and radiation, the following subsection shows the details of each term toobtain the ODE for gasI .

80 Vitrified Clay Pipes Analysis
• Convective and radiative heat transfer calculations
Referring to Fig. 5.1 which shows the arrangement of the supported cylinders, and bythe same analysis as in the burning zone the convective heat transfer coefficient of gasIis represented as in equation 5.3.
Nusselt number is calculated from the analysis in chapter 4 from Eq. 4.14 and itscalculation is based on the diameter of the supported cylinder. The change in convectiveheat transfer is calculated according to Eq. 4.13.
The radiation analysis takes place in the preheating zone by the same steps as inthe burning zone. Therefore, the total emissivity of carbon dioxide and water vapormixture is calculated according to the approximated Eq. 4.22 [48]. Then, the effectiveemissivity between the gas and each solid surface is calculated according to Eq. 4.24.So that, the effective emissivities between gasI and fire clay plate, plate, and supportedcylinders are obtained by the foregoing Eqs. 5.4, 5.5, and 5.6 respectively.
The total heat exchange between gas and its surrounded solids is calculated ac-cording to Eq. 5.7. In which Eq. 4.13 and Eq. 4.25 are used for the convective andradiative heat exchange between gasI and the surrounded solid surface area. Therefore,from Fig. 4.1 the equations which represent the heat exchange terms between gasI andits surrounded solid (lower surface of plate, fire clay plate, and supported cylinders)based on surface area are the same as 5.8, 5.9, and 5.10 respectively.
The following new first order ordinary differential equation (ODE) for gasI is ob-tained by the same steps as in Eq. 5.11.
dTg1,predZ
=1
(1− f)Mg,maxcpg1,pre
Apl1(α3 + αr1,pre)(Tg1 − Tpl)
(5.34)
+Afc(α1 + αr2,pre)(Tg1,pre − Tfc) + Acyl(α1 + αr3,pre)(Tg1 − Tcyl)
α3, the convective heat transfer coefficient for gasI in the preheating zone.The three symbols αr1,pre , αr2,pre , and αr3,pre , are the radiative heat transfer coefficientsbetween gasI and plate, fire clay plate, and supported cylinders respectively. Theradiative heat transfer coefficients are calculated according to Eq. 4.26.
5.3.2 ODE for second gas stream (gasII)
The total amount of the gases which escaped to heat the vitrified clay pipes passes throughthe preheating zone to preheat the solids before the burning process. The equation whichdescribes the escaped amount is represented as
Mg2,pre = fMg,max. (5.35)

Vitrified Clay Pipes Analysis 81
Wheref, represents the percentage of the gases which escaped to heat up the vitrified clay pipes.
The change in gas enthalpy flow for gasII in the preheating zone is expressed as
dHg2,pre = Mg2,precpg2,predTg2,pre . (5.36)
Applying the energy balance with neglecting heat loss as before, the following equationis obtained
dHg2,pre = dQg2→p,pre. (5.37)
The right hand side in Eq. 5.37 includes convection and radiation. The convective heattransfer coefficient is calculated in the same way as in the burning zone. From thearrangement of the vitrified clay pipes in the kiln as shown in Fig. 5.2, the convectiveheat transfer coefficient is calculated according to Eq. 4.12. Therefore, the convectiveheat transfer coefficient is represented as stated before in Eq. 5.15.
Nusselt number is calculated from the analysis in chapter 4 from Eq. 4.14, but itscalculation based on outer pipe diameter. Furthermore, the change in convective heattransfer is calculated according to Eq. 4.13.
Besides the convective heat transfer, radiative heat transfer occurs also in the pre-heating zone between gasII and the vitrified clay pipes. Therefore, the total emissivityof the gas mixture is calculated according to the approximated Eq. 4.22 [48]. Then, theeffective emissivity between the gas and pipes surface is calculated according to Eq. 4.24.The effective emissivity between gasII and vitrified clay pipes is expressed as in Eq. 5.16.
Therefore, from this analysis the right hand side of Eq. 5.37 which includes con-vective and radiative heat transfer between gasII and the surrounded pipes surface areais represented in Eq. 5.17.
The following new first order ordinary differential equation (ODE) for gasII is ob-tained by the same steps as in Eq. 5.18
dTg2,predZ
=Ap
fMg,maxcpg2,pre(α4 + αr4,pre)(Tg2 − Tp). (5.38)
WhereAp, the total surface area of the vitrified clay pipes,α4, the convective heat transfer coefficient for gasII in the burning zone, andαr4,pre , the radiative heat transfer coefficient between gasII and vitrified clay pipes.
5.3.3 ODEs for solids
Likewise the analysis of solids in the preheating zone is the same as in the burning zone.Therefore, the general solid enthalpy flow change equation is represented by Eq. 3.20 and

82 Vitrified Clay Pipes Analysis
the general form of the first order ordinary differential equation ODE for solid is expressedby Eq. 5.20. In Eq. 5.20 there are two terms in the right hand side, each term is calculatedaccording to the heat exchange mechanism. The first term in the right hand side (dQg→s)includes both convective and radiative heat exchange as stated in Eq. 5.7. The secondterm (dQs1→s2) is related to solid to solid radiation. The following section shows in de-tail how to obtain the (ODE) for each of the four solids material in vitrified clay pipes kiln.
• Convective and radiative heat transfer for solids
The convective heat transfer coefficients from both gas streams (gasI and gasII) are asdescribed before (α3 and α4).
Regarding the radiative heat transfer calculations, the effective emissivities whichrelated to the solid to solid radiation are calculated as in Eqs. 5.21, 5.23, and 5.25 forradiation from the fire clay plate to the plate, radiation from the supported cylindersto the plate, and finally radiation from the plate to the vitrified clay pipes respectively.Consequently, the radiative heat transfer for solid to solid radiation is obtained byEqs. 5.22, 5.24, and 5.26. The ordinary differential equation for each solid is obtained byreplacing the corresponding values of heat exchange in the right hand side of Eq. 5.20.The following equations represent the ODEs for the solids of interest (i.e. plate, fire clayplate, supported cylinders, and vitrified clay pipes)
1. Plate
MplcpldTpldZ
= Apl1(α3 + αr1,pre)(Tg1 − Tpl) + αr,prefc→plApl1(Tfc − Tpl)
(5.39)
+αr,precyl→plAcyl(Tcyl − Tpl)− αr,prepl→pApl2(Tpl − Tp)
2. Fire clay plate
MfccfcdTfcdZ
= Afc(α3 + αr2,pre)(Tg1 − Tfc)− αr,prefc→plApl1(Tfc − Tpl) (5.40)
3. Supported cylinders
McylccyldTcyldZ
= Acyl(α3 + αr3,pre)(Tg1 − Tcyl)− αr,precyl→plAcyl(Tcyl − Tpl) (5.41)
4. Vitrified clay pipes
MpcpdTpdz
= Ap(α4 + αr4,pre)(Tg2 − Tp) + αr,prepl→pAp(Tpl − Tp). (5.42)

Vitrified Clay Pipes Analysis 83
5.4 Numerical solution results
There is a system of ordinary differential equations (ODEs) for solids and gases for bothburning and preheating zones. In the case of vitrified clay pipes, the system consists ofsix first order (ODEs) for the burning zone and also six (ODEs) for the preheating zone.Equations 5.11, 5.18, 5.27, 5.28, 5.29, and 5.30 are the ODEs for the burning zone. Onthe other hand Eqs 5.34, 5.38, 5.39, 5.40, 5.41, and 5.42 are the ODEs for the preheatingzone. Therefore, it is necessary to solve this system of ODEs equations numerically.In order to solve this system of ODEs equations, algebraic equations with boundaryconditions, the MATLAB bvp4c solver is used. The bvp4c solver required six boundaryconditions for the solution in which the four solids inlet temperatures ( Tp,in, Tpl,in,Tfc,in, and Tcyl,in ) for pipes, plate, fire clay plate, and supported cylinders respectively,then the last two boundary conditions ( Tp,f and Tfc,f ) are the outlet temperatures ofpipes and fire clay plate respectively. The basics of this solver are shown in Appendix (A).
Regarding the previous analysis in chapter 3, there are many numerical results todisplay the temperature profile for both solid and gas. Furthermore, from the results thetemperature profiles for the gases and solids along the two zones, preheating and burningare obtained. Some variables used in solving this system are listed in table 4.1. In thisprogram the outlet temperature of pipes is Tp,f= 1115C as a sintering temperaturefor the vitrified clay pipes production. In addition, the suggested outlet temperatureof fire clay plate is Tfc,f= 1227C. In the solution for the same excess air number, theiteration is done to obtain the results and to fit the energy balance. The value of f isadjusted and then the iterations are done by changing the energy input until the balanceis obtained and then the solution is accepted. Furthermore, the value of f is changedand the sequences are followed again to obtain the solution. The following sections showsample of results obtained from the numerical solution.
5.4.1 Results for radiative heat transfer calculations only
In this section the results are obtained for radiation’s calculations only. Therefore, theconvective heat transfer coefficient in the ODEs is neglected.
Figure 5.3 illustrates the energy consumption which obtained from the bvp4c pro-gram. The energy consumption in the figure is shown as a function of the percentage ofgas escaped, f, for different excess air numbers. The figure demonstrates that for constantexcess air number, the energy consumption decreases as the escaped percentage of gasincreases. The all excess air number the trend remains the same. The figure shows thatfor some values of f there is no solution for the combined equations with the boundaryconditions for some excess air number’s values. The figure shows also that as excess airnumber increases the energy consumption increases for the same f.
Figure 5.4 and 5.5 show the temperature profiles for excess air number λ = 2.1and f = 15 % and 20 % respectively. These figures demonstrate that the temperatureprofile of the vitrified clay pipes is nearly linear. From these figures it can be seen thelower the escaped gas is, the higher the energy consumption which results in a higherflue gas temperature. Unfortunately, the temperature profiles for the kiln furniture solids

84 Vitrified Clay Pipes Analysis
10 20 30 40f (%)
0.8
1
1.2
1.4
1.6
1.8
2
2.2
2.4
2.6
2.8
3
Es (
MJ/k
gs)
Ts=965 K
=2.1
=1.9
=1.7
=1.5
=1.3
Figure 5.3: Energy consumption for radiation only.
differ from industrial experience. The sharp decreasing in temperature profiles of kilnfurniture materials is due to the boundary conditions which are equal to pipes inlettemperature. Also the material has to be heated to an extremely high temperature dueto radiation. Moreover, the values of f affect on the temperature profiles of the kilnfurniture and the difference between Tg1 and Tg2 .
Figure 5.6 shows the radiative heat transfer coefficients along the kiln for both gasradiation and solid to solid radiation. In the figure, the heat transfer coefficients decreaseas the firing length increases. Therefore, the heat transfer between gas and solid is veryhigh. As a consequence, the temperature profiles of gas and solid are very close to eachother as shown in the figure.
Figure 5.7 shows the emissivities of carbon dioxide, εCO2
, water vapor, εH2O
, andgasII emissivity, εg2 , for excess air number of value λ = 2.1 and escaped percentage ofvalue f = 20 %.

Vitrified Clay Pipes Analysis 85
0 10 20 30 40 50 60 70 80z (m)
0
200
400
600
800
1000
1200
1400
Te
mp
era
ture
oC
Tg2
Tp
=2.1, f=15%Tg1
Tcyl
Tfc
Tpl
Figure 5.4: Temperature profile with excess air number of λ = 2.1 and f= 15 %.
0 10 20 30 40 50 60 70 80z (m)
0
200
400
600
800
1000
1200
1400
Te
mp
era
ture
oC
Tg2 Tp
=2.1, f=20%Tg1
Tcyl
Tfc
Tpl
Figure 5.5: Temperature profile with excess air number of λ = 2.1 and f= 20 %.

86 Vitrified Clay Pipes Analysis
0 10 20 30 40 50 60 70 80z (m)
0
5
10
15
20
25
30
35
40
45
50
55
W
/(m
2K
)
= 2.1, f=20%fc- pl
r1
pl- p
cyl- pl
r4
Figure 5.6: Radiative heat transfer coefficient (αr) along the kiln.
400 600 800 1000 1200 1400 1600
Temperature (Tg2 ) K
0.06
0.08
0.1
0.12
0.14
0.16
0.18
0.2
0.22
0.24
0.26
Em
iss
ivit
y
= 2.1, f = 20%
H2O
CO2
g2
Figure 5.7: Emissivities of εCO2
and εH2O
.

Vitrified Clay Pipes Analysis 87
5.4.2 Results for all system
This section shows the results which obtained for all the system with convection andradiation calculations.
Figure 5.8 illustrates the energy consumption which obtained from the bvp4c pro-gram. The energy consumption in the figure is shown as a function of the percentage ofgas escaped f for different excess air numbers. The figure demonstrates that for constantexcess air number, the energy consumption decreases as the escaped percentage of gasincreases. The trend is the same for any excess air number. The figure shows that forsome values of f there is no solution for the combined equations with the boundaryconditions for some excess air number’s values. The figure demonstrates that as excessair number increases the energy consumption increases for the same f. For lower excessair number values the available results obtained for 25 % < f < 40 %.
15 20 25 30 35 40f (%)
0.8
1
1.2
1.4
1.6
1.8
Es (
MJ/k
gs)
Ts=965 K
=2.1
=1.9
=1.7
=1.5
=1.3
Figure 5.8: Energy consumption for all system.
Figure 5.9 and 5.10 show the temperature profiles for two values of f = 15 % and 20 %respectively with excess air number λ = 2.1. These figures demonstrate that thetemperature profile of the vitrified clay pipes is nearly linear. In the figures the lowerthe escaped gas is, the higher the energy consumption which results in a higher flue gastemperature. Unfortunately, the temperature profiles for the kiln furniture solids differfrom the industrial experience. The sharply decreasing in temperature profiles of kilnfurniture materials is due to the assumed inlet temperature of these materials. Moreover,the values of f affect on the temperature profiles of the kiln furniture and the differencebetween Tg1 and Tg2 .

88 Vitrified Clay Pipes Analysis
0 10 20 30 40 50 60 70 80z (m)
0
200
400
600
800
1000
1200
1400
Te
mp
era
ture
oC
=2.1, f=15%
Tg1
Tcyl
Tfc
Tpl
Tg2
Tp
Figure 5.9: Temperature profile with excess air number of λ = 2.1 and f= 15 %.
Figure 5.11 shows the heat transfer coefficients α along the kiln for the two gas streams.From the figure, the heat transfer coefficients increase as the firing length increases forboth streams. This increase is due to the increase of the mass flow of gas and therefore anincrease of the Reynolds number. At the end of burning zone there is no more additionof gases, so that the maximum amount of gases passes through the preheating zone.Therefore, the heat transfer coefficients being almost constant along the preheating zone.
Figure 5.12 shows the radiative heat transfer coefficients along the kiln. In the figure, theheat transfer coefficients for both gas radiation and solid to solid radiation decrease asthe firing length increases which are related to the decrease of the temperature along thekiln. Therefore, the heat transfer between gas and solid is very high. As a consequence,the temperature profiles of gas and solid are very close to each other as shown in theFig 5.10.
The emissivities of carbon dioxide, εCO2
, water vapor, εH2O
, and gasII emissivity, εg2 , forexcess air number of value λ = 2.1 and f = 20 % are shown in Fig. 5.13.

Vitrified Clay Pipes Analysis 89
0 10 20 30 40 50 60 70 80z (m)
0
200
400
600
800
1000
1200
1400
Te
mp
era
ture
oC
Tg2
Tp
=2.1, f=20%Tg1
Tcyl
Tfc
Tpl
Figure 5.10: Temperature profile with excess air number of λ = 2.1 and f= 20 %.
0 10 20 30 40 50 60 70 80z (m)
0
4
8
12
16
W
/(m
2K
)
= 2.1, f = 20%
1
2
Figure 5.11: Convective heat transfer coefficient (α) along the kiln.
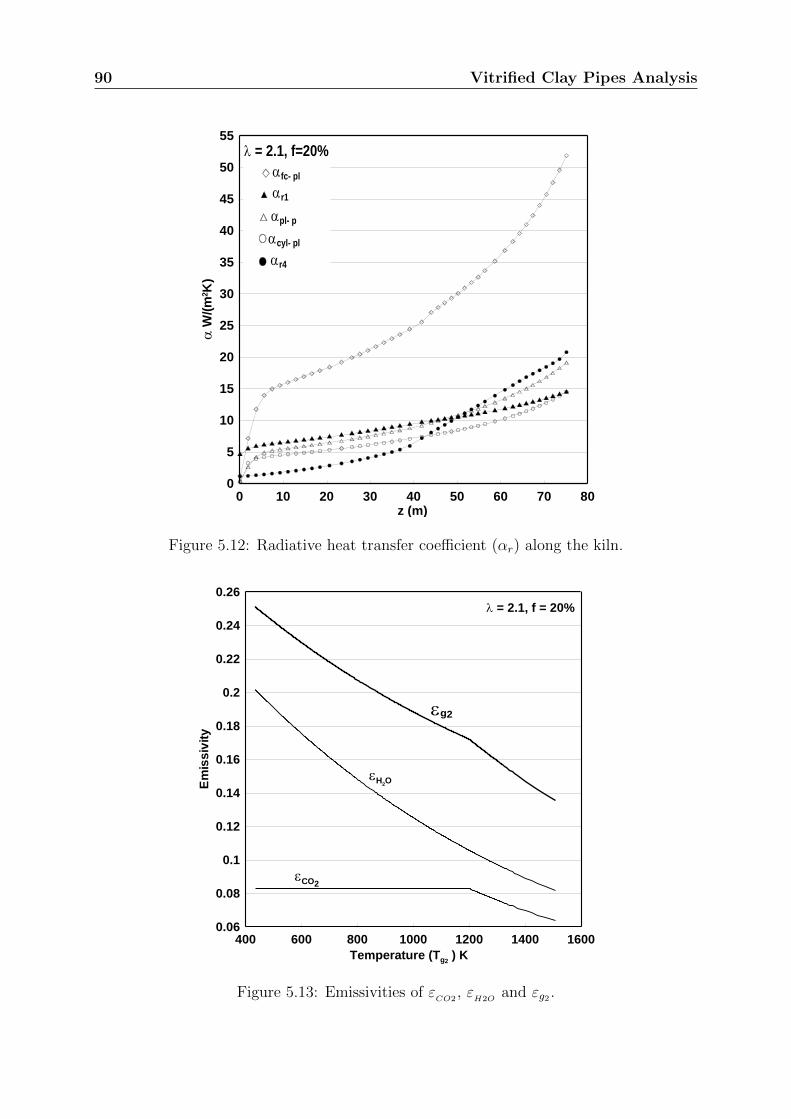
90 Vitrified Clay Pipes Analysis
0 10 20 30 40 50 60 70 80z (m)
0
5
10
15
20
25
30
35
40
45
50
55
W
/(m
2K
)
= 2.1, f=20%
fc- pl
r1
pl- p
cyl- pl
r4
Figure 5.12: Radiative heat transfer coefficient (αr) along the kiln.
400 600 800 1000 1200 1400 1600
Temperature (Tg2 ) K
0.06
0.08
0.1
0.12
0.14
0.16
0.18
0.2
0.22
0.24
0.26
Em
iss
ivit
y
= 2.1, f = 20%
H2O
CO2
g2
Figure 5.13: Emissivities of εCO2
, εH2O
and εg2 .

Chapter 6
Sanitaryware Kiln
6.1 Introduction
The heat transfer mechanism is different from one kiln to another. The complexity ofthe mechanism depends on the type of products and its interaction with kiln car andkiln furniture. Furthermore, it is important in the tunnel kilns to have a good mixingof the gas around the products. Therefore, the technique of mixing is important anddepends on the type of product and its sintering temperature. Sanitaryware kiln is anexample of a kiln that requires a good mixing of the gases because of the complexity ofthe product shape. Figure 6.1 shows one type of the products which is produced in theSanitaryware kiln. In this kiln there is a special way to thoroughly mix the preheating
Figure 6.1: Sanitaryware product.
zone. In the kiln there is an amount of air which is added in the preheating zone formixing. The air is added through lateral nozzles. Therefore, it is important to establish asimplified model to understand the principal behavior of the kiln process and to analyzethe heat transfer. This model considers the preheating and burning zone in which the solidmaterials (product, furniture, and car) are heated to the required heating temperature.Therefore, the following assumptions have to be made to perform analysis on this kiln.
Assumptions :
• The process is assumed to be a steady state process.
• The temperature of product and of gas is assumed to be constant at any cross section.As a consequence, the temperature depends only on the length.
• The temperature of product and transportation materials are the same.
• The heat losses through the walls are neglected.

92 Sanitaryware Kiln
• The fuel is distributed uniformly along the firing zone of length Lf .
• The air is distributed uniformly along the preheating zone of length Lpre.
• The solid material properties (specific heat capacity, density) are assumed as constant.
6.2 Case ”A,new” with the new concept
6.2.1 Description of the case
As in chapter 3, the burning zone is considered with zero length. Therefore, the twozones are considered as one zone (preheating only). The new case is called case ”A,new”.The difference between case ”A” and case ”A,new” is the preheating zone has additionalair nozzles in order to circulate the flue gases between the products. This circulation isdone to achieve a homogenous mixture in order to uniformly heat the products during thepreheating process. Figure 6.2 shows a schematic description of case ”A,new”. The gas isadded from one position and the air is uniformly distributed along the preheating zone.According to the combustion of fuel in an assumed adiabatic combustion chamber, theoutlet gas temperature from the combustion process is the adiabatic flame temperature.As illustrated in the figure, the kiln car carries the product through the kiln in counterdirection to gas flow. Therewith, the kiln process is reduced to a simple counter currentheat exchanger.
𝐀𝐢𝐫, 𝐌 𝐚,𝐓𝐚
𝐌 𝐬,𝐓𝐬,𝐟 𝐓𝐬,𝐢𝐧
𝐅𝐮𝐞𝐥, 𝐌 𝐅,𝐓𝐅
𝐓𝐠,𝐢𝐧= 𝐓𝐚𝐝 , 𝐌 𝐠
Combustion
Air curtain
𝐀𝐢𝐫, 𝐌 𝐚,𝐦𝐚𝐱,𝐓𝐚
Gas
Lk
Kiln door
Product
Kiln car
𝐌 𝐭,𝐦𝐚𝐱,𝐓𝐠,𝐨𝐮𝐭
z
Figure 6.2: Schematic description of case ”A,new”.
6.2.2 The ordinary differential equations for gas and solid
For this heat exchanger the temperature profile of solid and gas can be calculated usingan energy balance for a differential kiln length dz. The axial distribution of the added air

Sanitaryware Kiln 93
in the preheating zone is given as
Ma(z) =Ma,max
Lpre(Lpre − z) . (6.1)
Then with Eq. 3.41 the dimensionless form is obtained
Ma(Z) =Ma,maxLkLpre
(LpreLk− Z
). (6.2)
WhereLk, the length of the kiln,Lpre, the length of the preheating zone, andMa,max, the maximum mass flow rate of air.
Then by differentiation with respect to Z the following differential form for the airmass flow rate is obtained as
dMa
dZ= −Ma,maxLk
Lpre. (6.3)
From the description of the kiln, the air is added through nozzles and its maximum amountis calculated from the continuity equation as
Ma,max = ρoAnowaNno . (6.4)
WhereAno , the cross section area of nozzle,wa, the velocity of the injected air from the nozzle, andNno , the total number nozzles used.
The following table 6.1 shows some of the data used in the calculations.
Table 6.1: Part of the data used in the calculations
Symbol Description Value Unit
Dno nozzle diameter 0.021 m
∆P pressure drop through nozzle 20 mbar
sp space between two nozzles 0.75 m
The following are the equations used to calculate the nozzle’s numbers, the nozzle areaand the velocity of air respectively
Nno =Lpresp− 1 (6.5)
Ano =π
4D2no
(6.6)
wa =
√2∆P
ρo. (6.7)

94 Sanitaryware Kiln
• Ordinary differential equation for gas
The gas enthalpy flow for this new concept is expressed as
Ht = Mt(z)cpgTg(z). (6.8)
There are two variables depending on length, z, so that the change in gas enthalpyflow is represented as
dHt = Mt(z)cpgdTg + TgcpgdMt(z). (6.9)
The axial distribution of the total gas in the preheating zone is given as
Mt(z) =Ma,max
Lpre
(LpreMt,max
Ma,max
− z
). (6.10)
WhereMt,max, the total mass flow rate of gases; Mt,max = Ma,max +Mg,max.Then with Eq. 3.41 the dimensionless form is obtained as
Mt(Z) =Ma,maxLkLpre
(C2 − Z) . (6.11)
and the constant C2 is expressed as
C2 =LpreMt,max
LkMa,max
. (6.12)
Then by differentiation with respect to Z the following differential form for the airmass flow rate is obtained as
dMt
dZ= −Ma,maxLk
Lpre. (6.13)
For this heat exchanger the temperature profile of the gas can be calculated usingan energy balance for a differential kiln length dz. The gas enthalpy flow changedHt is expressed as
dHt = dQconv + dHair. (6.14)
The convective heat transfer between the gas and solid is expressed by Eq. 3.14.For this case there is another source of enthalpy flow input of the added air (dHair)through the preheating zone which is represented as
dHair = TaircpgoMa,max
Lpre(−dz). (6.15)
There is a negative sign in dHair, because the addition is in the opposite directionof z axes.
From the energy balance, the inlet energy to the element is equal to the

Sanitaryware Kiln 95
outlet one with neglecting heat loss. Solving Eqs. 3.14, 6.9 6.15 with Eq. 6.14 thefollowing first order ordinary equation for the gas is obtained as
Mt(z)cpgdTg + TgcpgdMt(z) =αAtLk
(Tg − Ts)dz − TaircpgoMa,max
Lpredz. (6.16)
Equation 6.16 can be represented in the following form as a general equation
Mt(z)dTgdz
=αAtLkcpg
(Tg − Ts)−Ma,max
Lprecpg(cpgoTair − cpgTg) . (6.17)
By substituting Eq. 6.11 in Eq. 6.17 the general form for the first order ordinarydifferential equation (ODE) is obtained as
(C2 − Z)dTgdZ
= StaLfLk
(Tg − Ts)−(cpgocpg
Ta − Tg). (6.18)
Where the Stanton number for the air is expressed as
Sta =αAt
Ma,maxcpg. (6.19)
• Ordinary differential equation for solid
The solid enthalpy flow change is expressed by
dHs = MscsdTs. (6.20)
For this heat exchanger the temperature profile of the solid can be calculated using anenergy balance for a differential kiln length dz. The convective heat transfer between thegas and solid is expressed by Eq. 3.14. Then the following first order ordinary differentialequation (ODE) for solid is obtained as
dTsdz
=αAt
MscsLk(Tg − Ts) . (6.21)
And in dimensionless form the ODE for solid is expressed as
dTsdZ
= Sts (Tg − Ts) . (6.22)
Where the Stanton number for solid is expressed by Eq. 3.23.

96 Sanitaryware Kiln
1 2 3 4 5 6 7 8Sts
0.8
1
1.2
1.4
1.6
1.8
2
ES (
MJ
/kg
S)
Ts=950 K
=1.9
=1.7
=1.5
=1.3
=1.0
Figure 6.3: Energy consumption from the numerical solution program of case ”A,new”.
6.2.3 Numerical solution
This section focuses on solving the two first order ODEs Eqs. 6.17 and 6.21 of gas andsolid numerically. The commercial code (bvp4c) is used to solve this system of coupledODE and boundary conditions. As stated before in chapter 3 the bvp4c solver needs twoboundary conditions for the solution in which the solid inlet and outlet temperatures areknown (inlet temperature of solid Ts,in, and outlet solid temperature Ts,f ).
Figure 6.3 illustrates the energy consumption which is obtained from the bvp4cprogram of case ”A,new”. In the figure, for constant excess air number, the energyconsumption decreases as Stanton number increases. The trend is the same for allexcess air number. The Stanton number increases if the heat transfer coefficient (α)increases. The figure illustrates that for Stanton < 3, with a small decrease in Stantonnumber there is a big influence on the energy consumption for all excess air numbers.The figure shows also that as excess air number increase the energy consumption increase.
By comparing the results in Fig. 6.3 with the corresponding results in case ”A”(Fig. ??), it is obvious that the energy consumption in the new concept is higherthan in simple case in chapter 3. The percentage of the increase for almost values ofStanton numbers is ranged from 10 % to 25 % for the different values of excess air number.
Regarding the previous analysis for case ”A,new”, there are many numerical re-sults to display the temperature profile for both solid and gas for different Stantonnumber and excess air number. Some variables used in solving this system are listed intables 3.1 and 6.1.

Sanitaryware Kiln 97
Figure 6.4 shows a comparison between the numerical solution of the case ”A”and case ”A,new” for Sts = 2 and λ = 1.3 with the corresponding value of energyconsumption in each case. The figure demonstrates that the two cases are completely
0 10 20 30 40 50z (m)
0
200
400
600
800
1000
1200
1400
1600
1800
2000T
em
pe
ratu
re o
C
Es (MJ/kgs)
A =0.966A,new=1.144
Sts=2 , =1.3
Tg ,A,new
Tg ,A
Ts ,A,new
Ts ,A
Figure 6.4: Temperature profiles of cases ”A” and ”A,new” for Sts = 2.
different in temperature profiles therewith the same outlet solid temperature. Thiscan be attributed to the different energy consumption which is required in each caseto satisfy the requirements as shown in the figure. The figure illustrates that theoutlet gas temperature obtained from case ”A,new” is approximately doubled theoutlet temperature obtained from simple case ”A”. Also, the figure illustrates that thetemperature profile of the solid is different. The solid curve shows that the heating of thematerial can be changed related to the required heating trend of the product. Therefore,the thermal heating of the material can be controlled according to the model results.
6.3 Case ”C,new” with the new concept
6.3.1 Description of the case
In case ”C,new” (Lf=Lpre) additional air nozzles are added to circulate the flue gasesbetween the products as shown in Fig. 6.5. This circulation is done to achieve thoroughmixing and good thermal heating of products during the preheating process. This figureshows that there is a homogeneous inlet of combustion gas along the burning zone.
1. Burning zone ODEs for gas and solid
The ordinary differential equations for case ”C,new” which represent gas and solidare the same as described before in chapter 3. Therefore, equation 3.51 represents

98 Sanitaryware Kiln
𝐀𝐢𝐫, 𝐌 𝐚,𝐓𝐚
𝐌 𝐬,𝐓𝐬,𝐟 𝐓𝐬,𝐢𝐧
𝐅𝐮𝐞𝐥, 𝐌 𝐅,𝐓𝐅
𝐓𝐠,𝐢𝐧= 𝐓𝐚𝐝 , 𝐌 𝐠
Combustion
Gas
Lk
Air curtain
Kiln door
Product
Kiln car
Lf
𝐀𝐢𝐫, 𝐌 𝐚,𝐦𝐚𝐱,𝐓𝐚
Lpre
𝐌 𝐭,𝐦𝐚𝐱,𝐓𝐠,𝐨𝐮𝐭
z
Figure 6.5: Schematic description for the second case ”C,new”.
the gas equation for the burning zone. Furthermore, equation 6.21 represent theODE for solid in the burning zone.
2. Preheating zone ODEs for gas and solid
The ordinary differential equations which represent the preheating zone in case”C,new” is the same as described before in case ”A,new”. Therefore, equation 6.18represents the gas equation for the burning zone. Furthermore, equation 6.21 rep-resent the ODE for solid in the preheating zone.
6.3.2 Numerical solution for case ”C,new”
In the previous analysis the numerical solution with bvp4c code is used to solve thesystem. Then from the results the temperature profiles are obtained for both gas andsolid along the two zones. As stated before in chapter 3 the bvp4c solver needs twoboundary conditions for the solution in which the solid inlet and outlet temperatures areknown (inlet temperature of solid Ts,in, and outlet solid temperature Ts,f ).
Figure 6.6 illustrates the energy consumption as a function of Stanton number fordifferent excess air numbers. The trend is the same for any excess air number therewithStanton number increases from 1 to 3. The figure illustrates that for excess air numberλ < 1.5 there are no logic results for a Stanton number > 3 (i.e. the results are obtainedfor a higher Stanton number, but the temperature of solid exceeds that of the gas inthe burning zone). The figure demonstrates that for Stanton < 3, with a small decreasein Stanton number there is a big influence on the energy consumption Es for all excessair numbers. The figure shows also that as excess air number increase the energy

Sanitaryware Kiln 99
consumption increase.
1 2 3 4 5Sts
0.8
1
1.2
1.4
1.6
1.8
2
Es (
MJ
/kg
s) Lf = 0.5 Lk
=1.9
=1.7
=1.5
=1.3
=1.0
Ts=950 K
Figure 6.6: Energy consumption from the numerical solution program of case ”C,new”.
By comparing the results in Fig. 6.6 with the corresponding results in case ”C” (Fig. 3.15),it is obvious that the energy consumption in case ”C,new” is mostly lower than that incase ”C” in chapter 3.
Figure 6.7 shows a comparison between the numerical solution of the case ”C”and case ”C,new” for Sts = 2 and λ = 1.3 with the corresponding value of energyconsumption in each case. The figure demonstrates that the two cases are approximatelysimilar in temperature profiles thereby the same outlet solid temperature. Moreover,the figure illustrates that the outlet gas temperature obtained from case ”C” is higherthan the outlet temperature obtained from ”C,new”. This result is due to higher energyconsumption in case ”C”. The figure shows that the temperature profile of the solid isincreased linearly along the two zones and is nearly the same for both cases.
Figure 6.8 shows another comparison between the two cases for Sts = 3 and λ = 1.3. Thefigure shows that the two cases are different in temperature profiles thereby the sameoutlet solid temperature. Also, the figure illustrates that the outlet gas temperatureobtained from case ”C,new” is about 100 K higher than the outlet temperature obtainedfrom ”C”. This result is due to higher energy consumption in case ”C,new”. Furthermore,the figure illustrates that the temperature profile of the solid is also different in the twocases.

100 Sanitaryware Kiln
0 10 20 30 40 50z (m)
0
200
400
600
800
1000
1200
1400
1600
1800
2000
Te
mp
era
ture
oC
Sts=2 , =1.3
Tg, C,new
Tg, C
Ts, C,new
Ts, C
Es (MJ/kgs)
C =1.071C,new=1.057
Figure 6.7: Temperature profiles of cases ”C” and ”C,new” for Sts = 2.
0 10 20 30 40 50z (m)
0
200
400
600
800
1000
1200
1400
1600
1800
2000
Te
mp
era
ture
oC
Sts=3 , =1.3Tg, C,new
Tg, C
Ts, C,new
Ts, CEs (MJ/kgs)
C =0.928C,new=1.003
Figure 6.8: Temperature profiles of cases ”C” and ”C,new” for Sts = 3.
The heat transfer coefficient is calculated according to the following Eq. 4.35. Ta-ble 6.2 shows the heat transfer coefficient related to each Stanton number with theenergy consumption. The heat transfer coefficient increases by about 76% if the excessair number changes from 1.3 to 2.1 thereby Stanton changes from 1.3 to 5.5 as in chapter4.

Sanitaryware Kiln 101
Table 6.2: Some results for case C,new
λ Sts α(W/(m2·K)) E (MJ/kgs) Ω
1.3 1.3 0.59 1.1598 0.7289
1.5 1.8 0.8 1.1458 0.826
1.7 2.5 1.1 1.1382 0.9258
1.9 3.5 1.6 1.1396 1.0323
2.1 5.5 2.5 1.1405 1.1386
6.4 Heat Transfer Analysis for Sanitaryware Kiln
Understanding the heat transfer coefficient helps in drawing the temperature profiles.There are two main types of heat transfer between the hot gases in the kiln and thesolid materials, convection and radiation as stated before in chapter 5. The Sanitarywareproducts are not regular in shape as shown in Fig. 6.1. The kiln produces various productswith different shapes. Consideration of the total surface area of the Sanitaryware which isexposed to gas flow, thereby heat transfer coefficient, it is unlikely to estimate an accuratevalue of overall rate of the convective heat transfer to the Sanitaryware. Therefore, toanalyze the heat transfer in the Sanitaryware kiln the following assumptions are takeninto consideration:
Assumptions :
• The Sanitaryware is roughly approximated as pipes with a staggered arrangement.
• There is no kiln furniture.
• The calculation considered only the convective heat transfer between the gases and thesolid material.
It is obvious that the fuel is distributed uniformly along the burning zone. As a conse-quence, the gases are distributed uniformly along the burning zone which can be seenfrom Fig. 6.5. Furthermore, the air is distributed uniformly along the preheating zone.The following sections describe the heat transfer analysis in the burning and preheatingzone. Furthermore, table 6.3 shows some of the data used in calculations.
6.4.1 Burning zone analysis
The axial distribution of gas flow equation along the burning length is represented byEq. 3.44. Therefore, the ODE for the gas is represented as
Mg(z)dTgdz
=αbAtLkcpg
(Tg − Ts)−Mg,max
Lf(Tad − Tg). (6.23)
WhereAt=πDHsNcarsNp,cars ,At, the total surface are of the pipes, andHs, the solid material height.

102 Sanitaryware Kiln
Table 6.3: Some of data used in the Sanitaryware kiln calculations
Symbol Description Value Unit
Bk kiln height 3.1 m
cs Specific heat of solid 0.9 kJ/(kg.K)
D assumed diameter 0.4 m
DN nozzle diameter 0.021 m
Hfur kiln furniture height 0.365 m
Hk kiln height 1.195 m
Hs solid height 0.63 m
hu lower heating value 47300 kJ/kgFLk kiln height 50 m
Ms capacity of kiln 2.4 t/h
Ncars number of cars 25 car
Np,cars number of pipes per car 33 pipes/car
SL longitudinal pitch 0.8D m
ST transverse pitch 1.5D m
Ts,in solid inlet temperature 20 C
Ts,f solid outlet temperature 1200 C
L air demand 16.9 kgair/kgfuel
The gas passes across the assumed arrangement which is shown in Fig. 6.9. Theconvective heat transfer coefficient is calculated according to Eq. 4.12. Therefore, for theconvective heat transfer coefficient is represented as
Approximated shape as a pipe
Approximated shape of Sanitaryware Approximated arrangement
Figure 6.9: Schematic description of staggard arrangement.
αb =NuλgD
. (6.24)
WhereD, the assumed pipe outer diameter,Nu, Nusselt number,λg , the thermal conductivity of the gas, andαb, the convective heat transfer coefficient for the gas in the burning zone.
Nusselt number is calculated from Eq. 4.14 according to the analysis in chapter 4.The change in convective heat transfer is calculated according to Eq. 4.13.

Sanitaryware Kiln 103
The solid ODE is the same as stated before in chapter 3 in equation 3.21 and theODE for solid is represented as
dTsdz
=αbAt
MscsLk(Tg − Ts) . (6.25)
6.4.2 Preheating zone analysis
The axial distribution of total gas flow equation along the preheating length is repre-sented by Eq. 6.10. The analysis for the gas in the preheating zone is represented byequation 6.17. Therefore, the ODE for the gas is represented as
Mt(z)dTgdz
=αpreAtLkcpg
(Tg − Ts)−Ma,max
Lprecpg(cpgoTa − cpgTg) . (6.26)
The convective heat transfer coefficient is calculated according to Eq. 4.12. Therefore, forthe preheating zone the convective heat transfer coefficient is represented as
αpre =NuλgD
. (6.27)
Whereαpre, the convective heat transfer coefficient for the gas in the preheating zone.
The solid ODE is the same as stated before in chapter 3 in equation 3.21. There-fore, the ODE for solid is represented as
dTsdz
=αpreAt
MscsLk(Tg − Ts) . (6.28)
6.4.3 Numerical solution results
From the foregoing analysis, the bvp4c code is used to solve the system of ODEs. Then,the temperature profiles are obtained for both gas and solid along the two zones. Thetwo boundary conditions for the solution in which the solid inlet and outlet temperaturesare known, inlet temperature of solid Ts,in and outlet solid temperature Ts,f which aretaken from table 6.3.
For that system of ODEs many trials had been done for the different excess airnumbers till the logical solution is obtained (i.e. the temperature profile of gas is alwayshigher than that of solid). Figure 6.10 shows the temperature profiles for gas and soliddue to convective heat transfer analysis. In the figure, the excess air number has a highervalue to obtain the results. The figure shows that the temperature profiles of gas andsolid increase sharply during the preheating zone and weaker through the firing zone.Furthermore, the gas and solid profiles are too close to each other in the burning zone.The results are obtained at a high excess air number (λ= 2.1) and the energy consumedis Es= 1.5243 MJ/kgs.
Figure 6.11 shows the heat transfer coefficient, α, along the kiln. The convectiveheat transfer coefficient increases rapidly through the burning zone according to the gas

104 Sanitaryware Kiln
distribution along the zone and thereby increasing of Reynolds number. At the end ofburning zone there is no more addition of gas so that the maximum amount of gas passesthrough the preheating zone. Therefore, the heat transfer coefficient is nearly constantalong the preheating zone.
0 10 20 30 40 50
z (m )
0
200
400
600
800
1000
1200
1400T
em
pe
ratu
re o
C
=2.1, E s =1.524(M J/kg s)
T s
T g
Figure 6.10: Temperature profiles λ = 2.1.
0 10 20 30 40 50
z (m )
0
5
10
15
20
25
30
(
W/(
m2K
))
= 2.1 , E s =1.524(M J/kg s)
Figure 6.11: Convective heat transfer coefficient (α) along the kiln.

Sanitaryware Kiln 105
6.5 Flow field simulation with CFD
6.5.1 Introduction
The commercial CFD packages is one of the used codes for modeling and analyzing sys-tems which involve fluid flow, heat transfer, and dissociative phenomena. There are somegeneralized equations which are used by FLUENT. The Navier Stokes equations for con-servation of mass and momentum are used as a generalized equations to calculate laminarflow without heat transfer. Also, there are some additional equations which are usedfor solve heat transfer, species mixing or reaction or turbulent cases. There are threemain elements in CFD simulation: Preprocessing, Solving, and Post-processing. Thissection concentrates on the use of FLUENT software package to simulate the flow fieldfor the Sanitaryware kiln. The Fluent 6.2 Users Guide contains the basic equations andbackground of these equations [51]. The basic procedure steps to solve the problem byFLUENT are as follow:
1. Using Gambit to create the geometry, mesh, and specify the boundary types.
2. Start fluent by selecting 3D modeling.
3. Follow up fluent steps to import, check grids, select solver, and physical models.
4. Specify material properties and the boundary conditions.
5. Make the appropriate adjustments to start the solution.
6. Obtain the results from the program and make the analysis to these results.
For solving the problem by CFD program there are some assumptions which must betaken into consideration, the problem is steady state and the flow is incompressible.Figure 6.12 shows the 3D free domain for the part of the kiln with two nozzles, uppernozzle and lower nozzle. The full scale kiln geometry is extremely large. Therefore, asmall part of the total kiln volume has been taken for 3D simulation as a computationaldomain in order to minimize the simulation time. Figure 6.13 shows a part of thekiln’s geometry which is considered as symmetrical cuboid (112 cm length, 159 cmwidth and 120 cm in height). GAMBIT 2.2.30 package as a pre-processing program isused to generate the mesh. Unstructured mesh with tetrahedron mesh type is used inmesh generation of the computational domain as shown in Fig. 6.14. The standard k-ε model is the most popular and most widely used turbulence model, especially forindustrial applications, but it depends on the computational domain. The model is asemi-empirical model which is based on model transport equations for the turbulentkinetic energy (k) and its dissipation rate (ε) [51]. For this work the realizable k-ε modelis the recommended model from the FLUENT program for the shown domain.
• Grid independence analysis
A number of 3D meshes with increasing in the density of meshes to perform amesh independence study to make sure that the solution is converged as the mesh sizeincreases. Grid independent analysis was carried out for the computational domain. Asshown in Fig. 6.15, the mesh number varied from 1,219,420 to 2,523,6790 cells. Based onthis independence study there is no more change in the maximum velocity, so that the

106 Sanitaryware Kiln
120
90
112
75
X
Y
Z
Figure 6.12: The 3D free domain of the kiln (dimension in cm).
Figure 6.13: The three views of the 3D domain with the isometric of Sanitaryware piece.

Sanitaryware Kiln 107
Figure 6.14: The computational domain.
cell numbers 2,461,387 is the recommended for further simulations for the computationaldomain.
40
44
48
52
56
60
64
1219420 1552499 1685513 2461387 2523679
Max
imu
m v
elo
city
(m/s
)
No. of cells
Figure 6.15: Grid independence study for the computational domain.

108 Sanitaryware Kiln
6.5.2 CFD results
Meanwhile, an investigation for the gas flow in the preheating zone is carried out to showthe gas circulation. Figure 6.16 shows the velocity vectors in a cross sectional plane ofthe computational domain. The shown plane passes through the upper nozzle in thecomputational domain. The figure illustrates the flow circulation in the cross section, it isevident that the flow circulation can be ensured between the products. The figure showsvelocity vectors for a certain limit of the velocity in the computational domain. The figuredemonstrates the flow circulations in the Sanitaryware gaps. The calculations also showthat the average velocity inside the domain is around 1 m/s. The cross sectional velocity
Figure 6.16: The velocity vector map colored by velocity.
profiles (Z direction) are plotted in Fig. 6.17. The figure shows the velocity profiles atthree different levels in the same cross sectional plane. The flow is a typical turbulent flowvelocity profile with some fluctuations on the velocity profile. The flow is very uneven dueto the complex structure of the Sanitaryware. In Fig. 6.17, there are three lines, the firstline (Line1) is placed over the Sanitaryware products. Therefore, the velocity profile is acontinuous line and has regular velocity profile. The second and third lines (Line2 andLine3) are place in between the Sanitaryware products. Therefore, the velocity profilesare discontinuous, not homogenous, and appear in the free space between the solids.
The axial velocity profiles along the kiln length (X direction) are plotted in Fig 6.18.The figure shows the velocity profiles at three different levels. In Fig. 6.18, there arethree lines, the first line (Line1) is placed over the Sanitaryware products. Therefore, thevelocity profile is continuous line and has regular velocity profile. The second and thirdlines (Line2 and Line3) are place in between the Sanitaryware products. Therefore, thevelocity profiles are discontinuous, not homogenous, and appear in the free space betweenthe solids. Comparing the two velocity profiles for the cross sectional and the axial, itis clear obvious that the axial velocity is small; therefore, the heat transfer coefficient

Sanitaryware Kiln 109
0 0.4 0.8 1.2 1.6Z (m)
0
0.5
1
1.5
2
2.5
3
3.5
4
4.5
Velo
cit
y (
m/s
)
Line1, height = 0.9 m
Line2, height = 0.7 m
Line3, height = 0.5 m
Figure 6.17: Velocity profiles in the cross section of the 3D domain.
is small. As a consequence, the radial velocity produced by the burner and nozzles isnecessary in order to increase the heat transfer to decrease the energy consumption.
0 0.2 0.4 0.6 0.8 1 1.2X (m)
0
0.2
0.4
0.6
0.8
1
1.2
1.4
Velo
cit
y (
m/s
)
Line1, height = 0.9 m
Line2, height = 0.7 m
Line3, height = 0.5 m
Figure 6.18: Velocity profiles in the longitudinal direction of the 3D domain.

110 Sanitaryware Kiln

Chapter 7
Conclusions and Outlook
7.1 Summary
A numerical model for simulating the process in the tunnel kiln is developed. Thedetails of the mathematical model are described in the present work. The modelpredicts the temperature profiles of product, furniture, and gas along the preheatingand firing zone in tunnel kilns. The model describes the method to obtain the ordinarydifferential equations for solids and gas in the preheating and firing zones. The developedmathematical model has been used to predict temperature profiles of different operatingconditions (excess air number and Stanton number) on the energy consumption of the kiln.
A one dimensional mathematical model was established to analyze the heat trans-fer in the vitrified clay pipes kiln as a simple product. In addition 1D mathematicalmodel was established for the Sanitaryware kiln to simulate the process inside the kiln.Moreover, another one dimensional mathematical model was established to analyze theheat transfer in the Sanitaryware kiln with a simplification of the products which lookinglike a pipe.
3D-CFD simulations using commercial CFD code (FLUENT 6.3) for preheatingzone in Sanitaryware kiln were conducted and presented in order to study the flow fieldin the zone. Depending on the special dimension of the kiln, the CFD simulation can beapplied particularly to simulate the flow field in the preheating zone.
7.2 Conclusions
The major conclusions from this work are represented in the following points:
• The higher the Stanton number the lower the energy consumption.
• The higher the excess air number the stronger is the influence of the heat transfer.
• The higher the excess air number the higher is the energy consumption resulting ina higher flue gas temperature.
• The firing zone length has a significant effect on the energy consumption and shouldbe as short as possible for low energy consumption.

112 Conclusions and Outlook
• A lower excess air number with higher Stanton number yields a lower flue gastemperature.
• The thesis contributes in understanding the process in the vitrified clay pipes tunnelkiln.
• The heat transfer is very low and it is between 1 and 5 W/m2·K.
• The main radiation in the vitrified clay pipes kiln is from the plate to the top of thepipes.
• For the vitrified clay pipes kiln it is of great importance to change the pipes ar-rangement to allow gas passage between the pipes; therefore, enhancing the heattransfer and decreasing the energy consumption.
• If the heat transfer coefficient could be increased, then there is high potential tosave the energy.
• The flow field for the preheating zone with air nozzles is simulated. So that,the cross section velocity is much higher than the axial velocity. This air jetsdramatically improve the heat transfer which is advantageous in decreasing energyconsumption.
7.3 Outlook
In the present study basic simplified equations to simulate the process in tunnel kilns havebeen introduced. Moreover, ordinary differential equations to analyze the heat transfer inthe vitrified clay pipes kiln have been obtained. However, there are several areas wherefurther analysis is required including:
• Experimental measurements should be carried out to verify the models (difficult inthe present time).
• Study the effect of spacing between air nozzles on the results.
• Pipe to pipe radiation should be added to the mechanism.
• Including the wall radiation to the kiln (it need more data).
• The verification of the models used in this work should be done with advancedmathematical models and should be further developed to the tunnel kiln.

Appendix A
Boundary Value Problem Solver(BVP)
The boundary value problem solver (BVP) is one of the solvers which used to solvetwo-point boundary value problems for ordinary differential equations (ODEs). Theordinary differential equations (ODEs) describe a phenomena that change continuously.For solving the BVP a guess for the solution is required. There are parametershave to be determined so that the BVP has a solution. Furthermore, there might bemore than one possibility, so that the program requires a guess for the parameters desired.
The bvp4c solver in MATLAB is the function which solves two-point boundaryvalue problems for ordinary differential equations (ODEs). The bvp4c function integratesa system of first-order ordinary differential equations of the form,
z′ = f(x; z) (A.1)
on the interval [a; b], the equation is subject to general two-point boundary conditions,
g(z(a); z(b))=0.
This equation form also used to solve other types of boundary value problemswhich have any of the following; problems with unknown parameters, problems withsingularities in the solutions and multi point conditions problems. For such cases, thenumber of boundary conditions must be sufficient to determine the solution of theproblem and the unknown parameters.
The bvp4c function produces a continuous solution on the interval [a; b] and has acontinuous first derivative there. Furthermore, bvp4c code implements the 3-stage Lo-batto IIIA formula. The Lobatto methods used for the numerical integration of differentialequations which named after Rehuel Lobatto. The Lobatto methods are characterized bythe use of approximations to the solution at the two end points. Due to their good stabil-ity properties, the Lobatto IIIA methods are used for boundary value problems (BVP).In the solver the mesh selection and error control are based on residual of the continuoussolution. This mesh of points is used to divide the interval of integration into subintervals.
The numerical solution is obtained from this solver by solving a global system of

114 Boundary Value Problem Solver (BVP)
algebraic equations resulting from the boundary conditions and the collocation condi-tions imposed on all the subintervals. Then, the solver estimates the numerical solutionerror in each subinterval. Furthermore, the solver adapts the mesh and repeats theprocess when solution does not satisfy the tolerance criteria. Moreover, the points of theinitial mesh must be provided by the user as an initial approximation of the solution atthe mesh points.

Bibliography
[1] http://en.m.wikipedia.org/wiki/Ceramic engineering.
[2] http://www.epa.gov/ttnchie1/ap42/ch11/final/c11s07.pdf.
[3] J. Shular, The Emission Factor Documentation for AP-42 Section 11.7: CeramicProducts Manufacturing for U.S, 1996.
[4] O. Rentz, A. Schmittinger, R. Jochum, and F. Schultmann, “Exemplary investigationinto the state of practical realisation of integrated environmental protection withinthe ceramics industry under observance of the IPPC-directive and the development ofBAT reference documents, Research project 298 94 313/07,” Environmental ResearchPlan of the Federal Minister for the Environment, Nature Conservation and Safety,2001.
[5] http://www.gladdingmcbean.com.
[6] http://www.bathroomcity.co.uk/pdf/sanitaryware1 30.pdf.
[7] http://en.m.wikipedia.org/wiki/Porcelain.
[8] http://en.m.wikipedia.org/wiki/Ceramic.
[9] “Merkblatt uber die Besten Verfugbaren Techniken in der Keramikindustrie,”Umweltbundesamt, 2007.
[10] http://honeywell.com/Pages/Home.aspx, “Application profile tunnel kiln.”
[11] V. De Paulo Nicolau and A. P. Dadam, “Numerical and experimental thermal anal-ysis of a tunnel kiln used in ceramic production,” Journal of the Brazilian Society ofMechanical Sciences and Engineering, vol. 31, no. 4, pp. 297–304, 2009.
[12] P. Meng, “Solid-solid Recuperation to Improve the Energy Efficiency of TunnelKilns,” Ph.D. dissertation, Otto-von-Guericke-Universitat, Magdeburg, Germany,2011.
[13] D. R. Dugwell and D. E. Oakley, “Correlation of convective heat transfer data for tun-nel kilns,” ZI, Ziegelindustrie International/Brick and Tile Industry International,vol. 42, no. 10, pp. 536–545, 1989.
[14] S. A. Karaush, Y. I. Chizhik, and E. G. Bober’, “Optimization of ceramic setting as afunction of their heat absorption from the radiating walls of the furnace,” Glass andCeramics (English translation of Steklo i Keramika), vol. 54, no. 5-6, pp. 190–192,1997.

116 BIBLIOGRAPHY
[15] H. Z. Abou-Ziyan, “Convective heat transfer from different brick arrangements intunnel kilns,” Applied Thermal Engineering, vol. 24, no. 2-3, pp. 171–191, 2004.
[16] O. B. Gol’tsova, V. S. Klekovkin, O. B. Nagovitsin, and S. V. Antonychev, “Heatlosses in a tunnel kiln for brick firing,” Glass and Ceramics (English translation ofSteklo i Keramika), vol. 63, no. 3-4, pp. 127–129, 2006.
[17] S. Vogt and M. Beckmann, “Convective heat transfer on brick settings,” ZI, Ziegelin-dustrie International/Brick and Tile Industry International, vol. 60, no. 9, pp. 34–49,2008.
[18] V. Mandhani, R. Chhabra, and V. Eswaran, “Forced convection heat transfer in tubebanks in cross flow,” Chemical Engineering Science, vol. 57, no. 3, pp. 379 – 391,2002.
[19] J. Kang and Y. Rong, “Modeling and simulation of load heating in heat treatmentfurnaces,” Journal of Materials Processing Technology, vol. 174, no. 1-3, pp. 109–114,2006.
[20] F. H. Becker, G. Walter, and L. Lorenz, “Heat exchange in a fast firing kiln for glostfiring of porcelain,” CFI Ceramic Forum International, vol. 83, no. 9, pp. E59–E65,2006.
[21] V. G. Abbakumov, “Analyzing the heating and cooling of products in a high tem-perature tunnel kiln,” Refractories, vol. 9, no. 1-2, pp. 77–83, 1968.
[22] D. R. Dugwell and D. E. Oakley, “Simulation of tunnel kilns for firing refractoryproducts,” British ceramic. Transactions and journal, vol. 86, no. 5, pp. 150–153,1987.
[23] B. Yu, “Dynamic modeling of a tunnel kiln,” Heat Transfer Engineering, vol. 15,no. 2, pp. 39–53, 1994.
[24] R. H. Essenhigh, “Studies in furnace analysis: Prediction of tunnel kiln performanceby application of the integral energy equation,” Energy and Fuels, vol. 15, no. 3, pp.552–558, 2001.
[25] J. Durakovic and S. Delalic, “Temperature field analysis of tunnel kiln for brickproduction,” RMZ - Materials and Geoenvironment, vol. 53, no. 3, pp. 403–408,2006.
[26] O. B. Gol’tsova, V. S. Klekovkin, and V. A. Tenenev, “Development and approval ofa mathematical model of a brick firing kiln,” Glass and Ceramics (English translationof Steklo i Keramika), vol. 65, no. 3-4, pp. 100–102, 2008.
[27] E. Mancuhan, K. Kucukada, and E. Alpman, “Mathematical modeling and simula-tion of the preheating zone of a tunnel kiln,” Isi Bilimi Ve Teknigi Dergisi/ Journalof Thermal Science and Technology, vol. 31, no. 2, pp. 79–86, 2011.
[28] M. Z. Shvartsman, I. P. Tsibin, and G. A. Ketslakh, “The uniformity of firing andfuel economics in tunnel kilns,” Refractories, vol. 20, no. 11-12, pp. 735–739, 1980.

BIBLIOGRAPHY 117
[29] E. Mancuhan and K. Kucukada, “Optimization of fuel and air use in a tunnel kilnto produce coal admixed bricks,” Applied Thermal Engineering, vol. 26, no. 14-15,pp. 1556–1563, 2006.
[30] S. Kaya, E. Mancuhan, and K. Kucukada, “Modelling and optimization of the firingzone of a tunnel kiln to predict the optimal feed locations and mass fluxes of the fueland secondary air,” Applied Energy, vol. 86, no. 3, pp. 325–332, 2009.
[31] T. S. Possamai, R. Oba, V. Nicolau, and O. Otte, “Numerical simulation of a ce-ramic kiln used in frits production,” in 20th International Congress of MechanicalEngineering , Gramado, RS, Brazil COB09 1152, November 2009.
[32] R. Oba, T. S. Possamai, A. T. Nunes, and V. De Paulo Nicolau, “NUMERICALSIMULATION OF TUNNEL KILNS APPLIED TO WHITE TILE WITH NATU-RAL GAS,” in 21st Brazilian Congress of Mechanical Engineering, Natal, RN, BrazilCOBEM 2011, October 2011.
[33] V. G. Abbakumov and S. I. Vel’sin, “Thermal operation of the firing zone of anautomated tunnel kiln,” Refractories, vol. 27, no. 9-10, pp. 541–546, 1986.
[34] Z. Chen, H. Zhang, and Z. Zhu, “An integrated intelligent system for ceramic kilns,”Expert Systems with Applications, vol. 16, no. 1, pp. 55–61, 1999.
[35] P. Michael and S. Manesis, “Modelling and control of industrial tunnel-type furnacesfor brick and tile production,” Proceeding of the 5th Int.Conference on Technologyand Automation, Patras, GR-26500, Greece, pp. 216–221, 2005.
[36] J. B. De Wit, “Use of energy-saving tunnel kiln cars in the ceramic industry,” ZI,Ziegelindustrie International/Brick and Tile Industry International, vol. 42, no. 10,1989.
[37] M. D. G. Carvalho and M. Nogueira, “Improvement of energy efficiency in glass-melting furnaces, cement kilns and baking ovens,” Applied Thermal Engineering,vol. 17, no. 8-10, pp. 921–933, 1997.
[38] B. A. Unaspekov, “Operation of a combined gas heating system for firing refractorycomponents in a tunnel funnel at the Kazogneupor plant,” Refractories and IndustrialCeramics, vol. 43, no. 9-10, pp. 319–321, 2002.
[39] E. Specht, “Kinetik der Abbaureaktionen,” Cuvillier Verlag, Gottingen, 1993.
[40] Y. A. Cengel and A. J. Ghajar, Heat and Mass Transfer: Fundamentals and Appli-cations. McGraw-Hill Companies, Inc., U.S.A., 2011.
[41] A. Zukauskas, “Heat Transfer from Tubes in Crossflow,” ser. Advances in Heat Trans-fer, J. P. Hartnett and T. F. Irvine, Eds. Elsevier, 1972, vol. 8, pp. 93 – 160.
[42] E. C. Huge, “Experimental investigation of effects of equipment size on convectionheat transfer and flow resistance in cross flow of gases over tube banks,” Trans.ASME,vol. 59, no. 7, pp. 573–581, 1937.
[43] O. L. Pierson, “Experimental investigation of the influence of tube arrangement onconvection heat transfer and flow resistance in cross flow of gases over tube banks,”Trans.ASME, vol. 59, no. 7, pp. 563–572, 1937.

118 BIBLIOGRAPHY
[44] H. Hausen, “The pressure drop accompanying fluid flow through tubes and ducts,”Heat Transfer in Counterflow, Parallel-flow, and Cross-flow, 1983.
[45] W. Khan, J. Culham, and M. Yovanovich, “Convection heat transfer from tube banksin crossflow: Analytical approach,” International Journal of Heat and Mass Transfer,vol. 49, no. 25-26, pp. 4831 – 4838, 2006.
[46] D. Vortmeyer and S. Kabelac, “K3 Gas Radiation: Radiation from Gas Mixtures,”in VDI Heat Atlas, 2010, pp. 979–988.
[47] E. Specht, Lecture Note of Combustion Engineering. University of Magdeburg,Germany, 2008.
[48] ——, Lecture Note of Advanced Heat and Mass Transfer. University of Magdeburg,Germany, 2008.
[49] J. H. Lienhard IV and J. H. V. Lienhard, A Heat Transfer Textbook Third Edition.Phlogiston press Cambridge, Massachusetts, U.S.A., 2004.
[50] W. M. Rohsenow, J. P. Hartnett, and Y. I. Cho, Handbook of Heat Transfer Thirdedition. McGraw-Hill Companies, Inc., U.S.A., 1998.
[51] F. Inc., FLUENT 6.3 User’s Guide, Tutorial Guide, FLUENT User Services Center.Fluent Inc., Lebanon, NH, 2006.

Curriculum Vitae
Personal Information
Name: Hassanein RefaeyBirth date: 07.02.1978 in Qaliubiya, EgyptNationality: EgyptianE-mail: hassanein [email protected] status: Married, 2 children
Education
1984 - 1989 Elementary school, Senduin, Qaliubiya, Egypt.1989 - 1992 Primary school, Senduin, Qaliubiya, Egypt.1992 - 1995 Secondary school, Senduin, Qaliubiya, Egypt.
1995 - 2000 B.Sc. in Mechanical Power Engineering, Faculty of En-gineering at Shoubra, Benha University, Cairo, Egypt.
2001 - 2003 Postgraduate courses for M.Sc. in Mechanical PowerEngineering, Faculty of Engineering at Shoubra, BenhaUniversity, Cairo, Egypt.
2003 - 2006 M.Sc. in Mechanical Power Engineering, Faculty of En-gineering at Shoubra, Benha University, Cairo, Egypt.
Sep. 2009 - Till now Ph.D. in Engineering (Dr.-Ing.), Faculty of Processand System Engineering, Otto von Guericke UniversityMagdeburg, Germany.
Work Experience:
2002 - 2006 Demonstrator at Faculty of Engineering at Shoubra,Benha University, Cairo, Egypt.
2006 - 2009 Assistant lecturer at Faculty of Engineering at Shoubra,Benha University, Cairo, Egypt.
Sep. 2009 - Till now Scientific assistant (Ph.D student) at Otto von GuerickeUniversity, Magdeburg, Germany.
Magdeburg, 30 January 2013Hassanein Refaey